Article

Numerical Analysis of Heat Transfer Behaviours of Melting Process for Ice Thermal Storage Based on Various Heat Source Configurations

1
Beijing Institute of Aerospace Testing Technology, Beijing 100074, China
2
Institute of Refrigeration and Cryogenics, Zhejiang University, Hangzhou 310027, China
3
Special Equipment Safety Supervision Inspection Institute of Jiangsu Province, Nanjing 210036, China
4
The School of Architecture and Civil Engineering, Jinggangshan University, Jinggangshan 343009, China
*
Authors to whom correspondence should be addressed.
Sustainability 2023, 15(1), 365; https://doi.org/10.3390/su15010365
Submission received: 5 November 2022 / Revised: 14 December 2022 / Accepted: 22 December 2022 / Published: 26 December 2022
(This article belongs to the Special Issue Toward Carbon Neutrality: Renewable Energy and Energy Engineering)

Abstract

:
Ice thermal storage (ITS) performance for cooling systems is greatly influenced by the poor thermal conductivity of phase change material (PCM). The effect of natural convection on the melting process is significant for heat transfer enhancement. Thus, the melting performance of PCM in a shell-and-tube latent heat storage (STLHS) unit is numerically studied by considering natural convection in terms of various heat source positions and configurations, i.e., central position, eccentric position, and flat-tube type. Temperature distribution, melting time, and the overall heat transfer coefficient during the process are investigated. The results show that the circulation vortex formed by natural convection is a dominant factor that affects melting front evolution and the overall heat transfer coefficient. When input heat flux is relatively weak, PCM below the heat source is liquefied first. In contrast, PCM in the upper part melts earlier when the heat flux is excellent. The overall heat transfer coefficient decreases sharply with the increase in melting time in the early stage. Then, the heat transfer coefficient tends to be constant. PCM in an STLHS unit with a heat source in a lower position and a configuration of vertical flat-tube type has a desirable performance when compared with other cases, which could provide good support for ITS application.

1. Introduction

The rapid development of the industry has led to a remarkable increase in electricity demand, which is especially evident in summer. Thermal energy storage (TES) that can balance energy demand and supply could play an important role in achieving carbon peak and carbon neutrality [1,2]. Among common TES technologies, latent thermal energy storage (LTES) that uses phase change material (PCM) is gathering momentum because it is regarded as a compromise between a sensible and thermochemical type [3,4]. A relatively high thermal storage density and small volume variation make LTES a good candidate for future application [5,6]. As a common type of LTES, ice thermal storage (ITS) systems could be adopted in a variety of industries, which include food processing, air conditioning, drug delivery, and building energy conservation [7,8,9].
Heat transfer enhancement is also a key research direction for all types of LTES technologies, such as ITS [9]. One method is to add materials with high thermal conductivity to form an advanced nanofluid [10,11]. Yang et al. [12] prepared a nanofluid with graphene oxide to improve the thermal properties of water. Their results indicated that there was a large increase in the thermal conductivity of the nanofluid and the maximum value could reach 48.1%. Xing et al. [13] experimentally investigated thermal conductivities of nanofluids with different carbon nanotubes (CNTs). It is noted that CNTs–nanofluids could present the maximum improvements in thermal conductivity, potentially reaching 16.2% for long single-walled nanotubes. Parker et al. [14] developed a nanofluid by using graphene nanoparticles with high thermal conductivity. Their results demonstrated that nanofluid that incorporated oxidized graphene had outstanding properties as heat transfer media. To further improve the performance of nanofluid, Du et al. [15] investigated nanofluid with iron oxide (Fe3O4) plus multiwalled carbon nanotube. Thermal conductivities were improved by 32.76% and 33.23% at 50 °C. Moreover, structure variation is another way to improve overall heat transfer performance. Abhishek et al. [16] investigated and analysed the charging and discharging working process of an ITS system. It was indicated that tube diameter, orientation, and outlet location had a great influence on the performance of thermal storage system. Vyshak et al. [17] investigated the discharging characteristic of PCM with three encapsulated configurations. Their results indicated that the heat transfer medium that flows inside the inner tube had the highest energy storage efficiency. Anica et al. [18] conducted a numerical simulation of an LTES device and analysed the heat transfer performance during the melting processes. The enthalpy method was used to couple transient convection and solid–liquid phase change heat transfer. Soltan et al. [19] analysed the water freezing time around a circular pipe. Different technologies were used to investigate transient mass and heat transfer around the pipe. Kousha et al. [20] investigated heat storage performance of cylindrical shell-and-tube latent heat storage (STLHS) units at different inclination angles. They demonstrated that the liquid fraction of horizontal units during the melting process was improved when compared with that of vertical units. To ensure the influence of extended surface on the heat transfer performance, Yuan et al. [21] analysed the melting process of an annular latent heat storage (LHS) unit with fins. They showed that heat transfer efficiency with less melting time could be obtained by using fins, while natural convection in heat storage units was weakened.
Except the two main methods of heat transfer enhancement mentioned above, the effect of natural convection cannot be ignored [22]. A solidification process without considering natural convection was investigated by Chiu et al. [23]. It showed that their experimental results were in good agreement with simulated results. Darzi et al. [24] numerically investigated different structures of LHS units in terms of the melting and solidification processes. They observed that natural convection could play a leading role in the heat release process with N-eicosane for PCM. The bottom of the annular cross section had a better melting rate. Since the melting process was affected by buoyancy, the area dominated by natural convection increased as the tube moved downward. Cao et al. [25] experimentally and numerically investigated the heat-releasing process in the eccentric structured STLHS units that was filled with lauric acid. It indicated that the liquid fraction rate could be greatly increased with the increase in eccentricity and the area of the region determined by natural convection. They also found that the inlet temperature has a major effect on the heat-releasing performance. However, ITS is a unique process, and it is related to phase changing and natural convection between ice and water. The special property of density inversion of water occurs at around 4 °C [26,27]. It is acknowledged that the warm temperature of liquid, e.g., PCM or water with low salinity floats owing to its lighter density, while the denser solid or colder PCM would sink. Density reversal of the water occurs when the peak density is near 4 °C, i.e., density is positively correlated with a temperature below 4 °C, while it shows a negative trend at a temperature above 4 °C [28]. It results in a significant change in the flow direction of the melting process, which is determined by natural convection. It is key to studying the melting process in the water LHS unit.
In our previous research, a passive heat transfer improvement of PCM in an STLHS unit was investigated to make use of natural convection for ITS [29]. However, the performance, by considering different positions and configurations of heat sources, is not covered and also has not been analysed in the literature. Table 1 shows a comparison between this work and some representative literature. To comprehensively investigate cold storage processes, the melting process of ice is numerically investigated by the constant heat source input in this work. The effects of natural convection on PCM in an STLHS unit, solid–liquid interface, and temperature distribution are analysed and compared in terms of different heat source positions and configurations, i.e., central position, eccentric position, and flat-tube configuration. The framework of this paper is illustrated as follows: physical and numerical models are indicated in Section 2 which are also validated by the experimental data. Results and discussions are shown in Section 3, followed by the conclusions in Section 4.

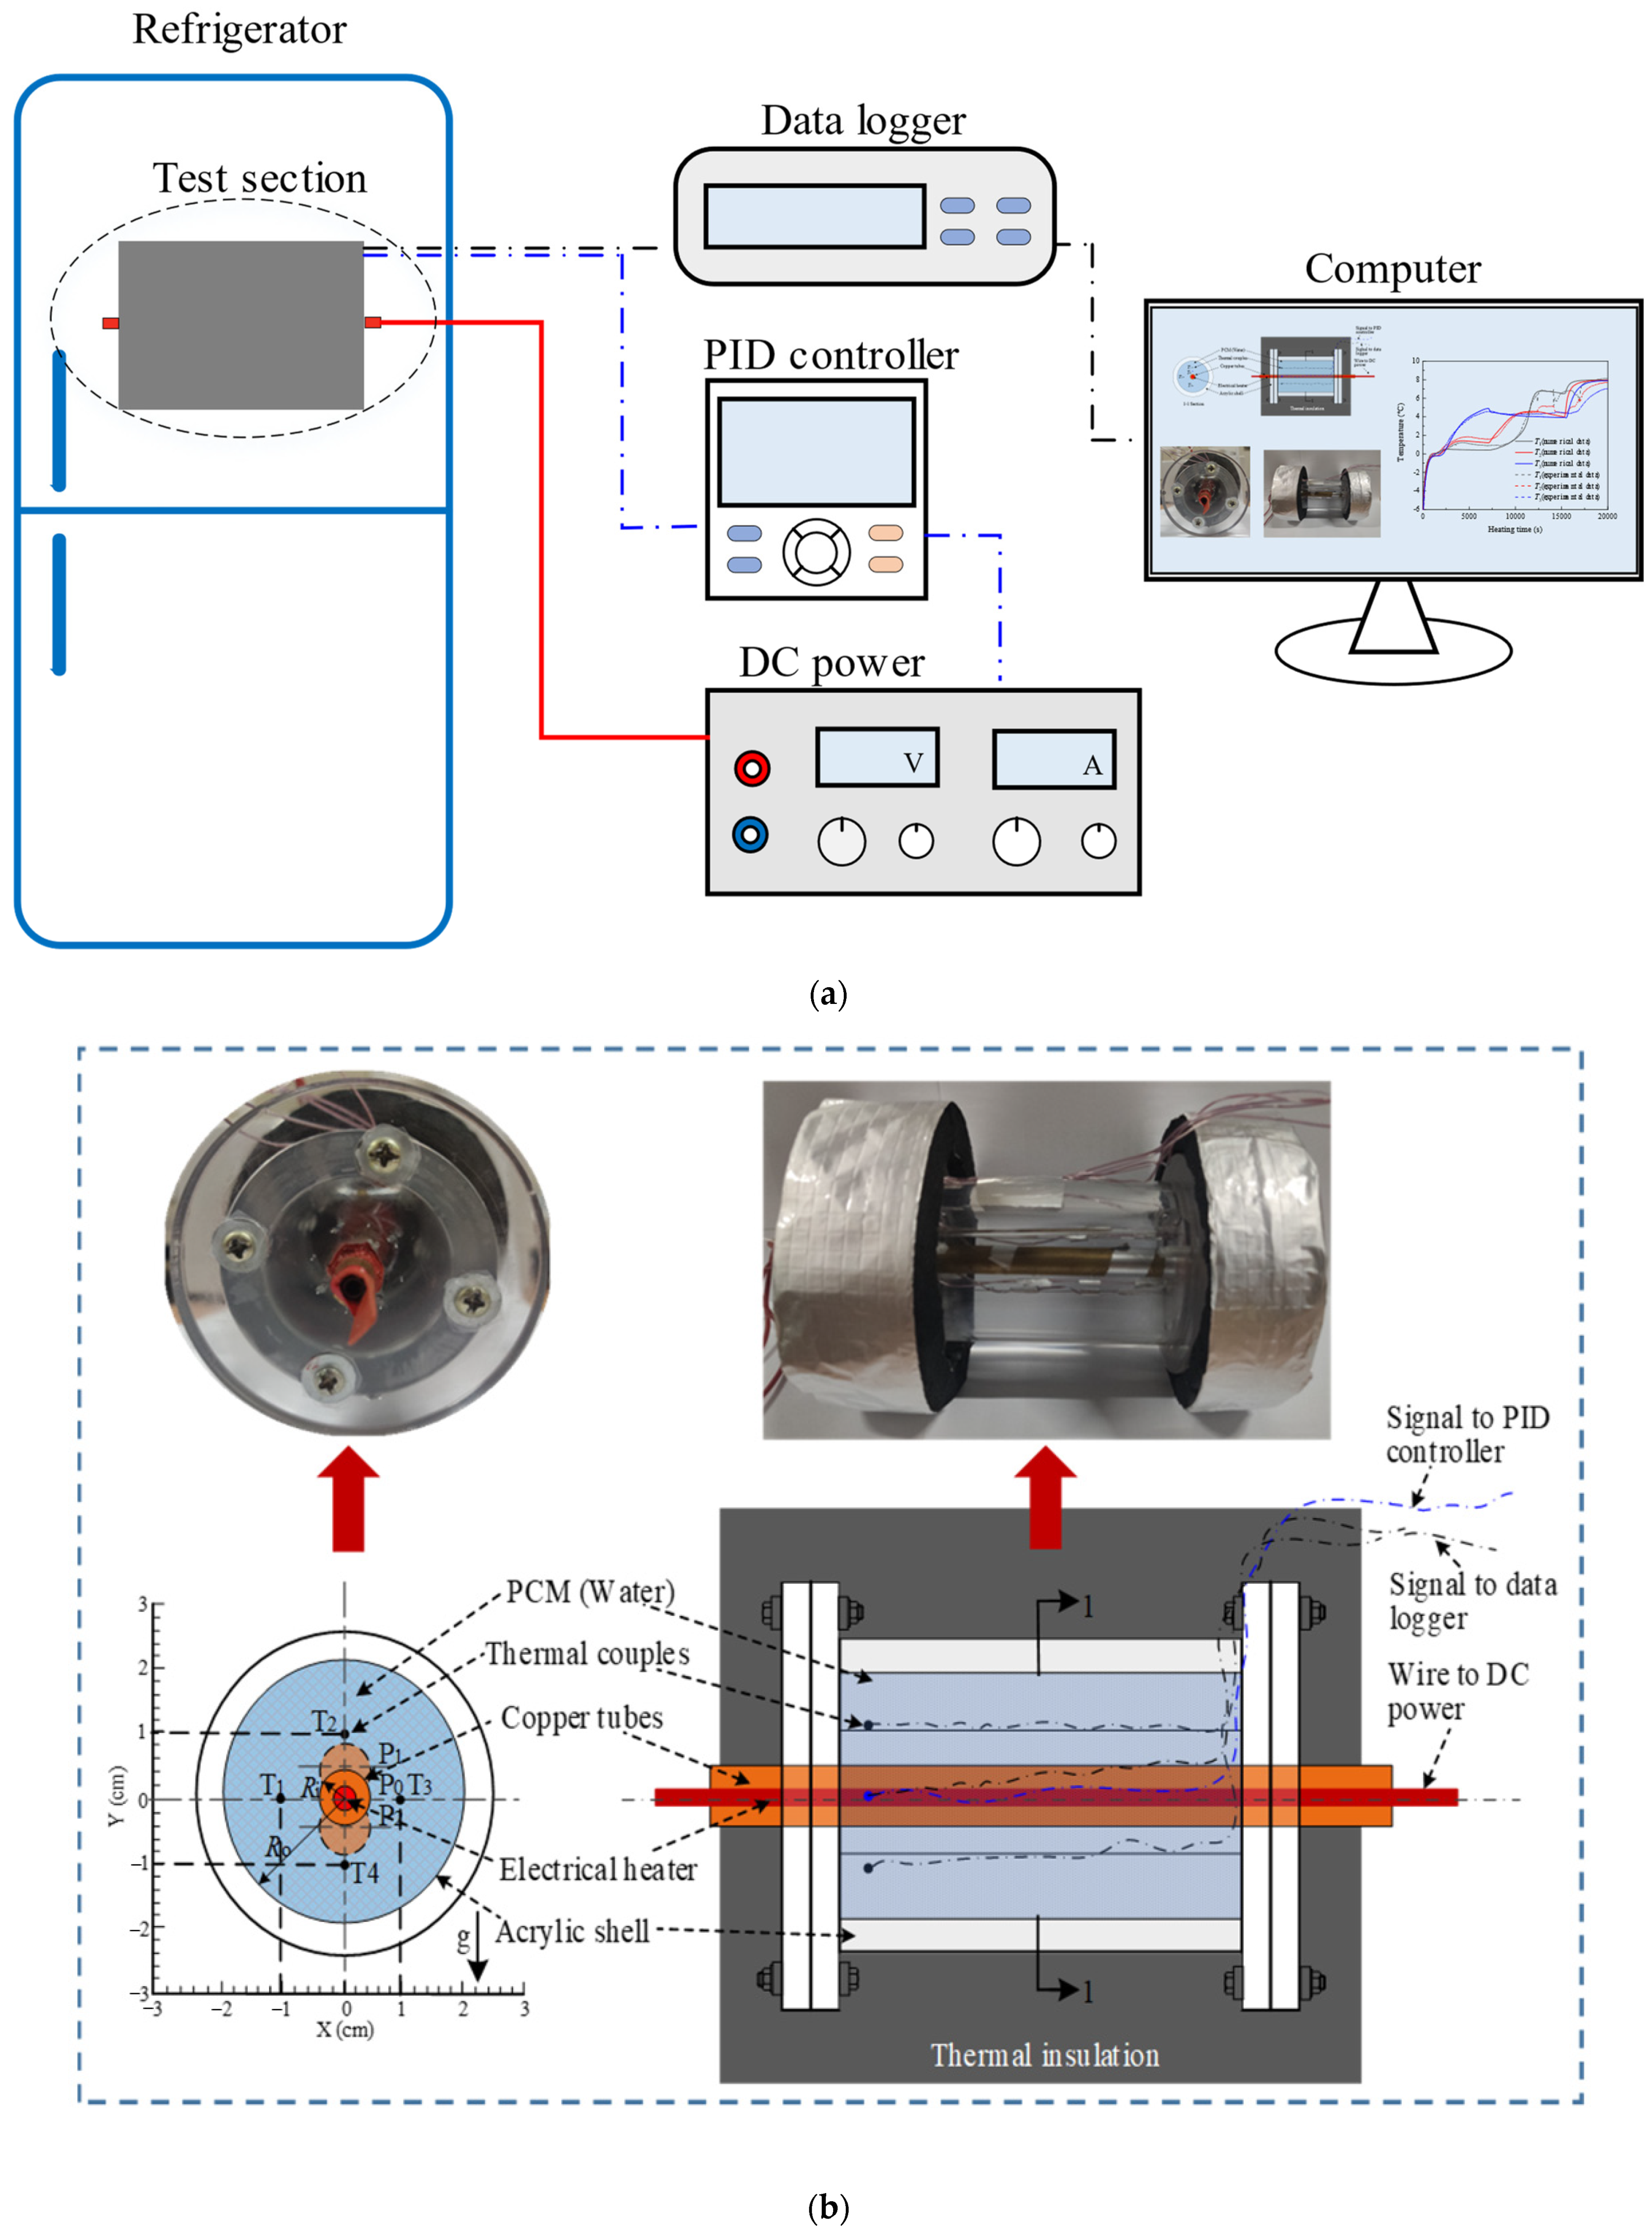
2. Physical and Numerical Models of ITS

2.1. Physical Model

The experimental rig (Figure 1a) in this study consisted of an STLHS unit, instrumentation devices, thermocouples, and a control loop. The STLHS unit, which included two concentric cylinders, is shown in Figure 1b. The geometrical parameters are as follows: one, with a diameter (Ri) of the inner tube, was 10 mm and was made of copper with a thickness of 2 mm. The other, with a diameter (Ro) shell of 40 mm, was made of Plexiglas. The length of the STLHS unit (L) was 200 mm, which was wrapped with insulation cotton of a thickness within 15 mm. Wires were used as the endothermic source and were arranged inside the copper tube and regulated by a proportional–integral–derivative (PID) controller as well as a DC power supply. The temperature of the heat storage medium was tested by thermocouples, which were placed at four different locations inside the STLHS unit, with an accuracy of ±0.15 K. The thermocouples were arranged as shown in Figure 1b. Water was used as a low-temperature PCM medium, which was used to fill the circular space between the two cylinders. The initial temperature of the ice was 267.15 K. The testing result was just used for model validation. Figure 2 shows the different heat source positions and configurations, i.e., central position, eccentric position, and flat-tube configuration, that were used for the simulation in the rest of the paper.

2.2. Governing Equations

Pertinent assumptions are defined as follows:
(1)
The endothermic source is considered as a constant temperature.
(2)
The effect of the thickness of tube and shell on the numerical model was ignored, and the shell was regarded as an adiabatic wall.
(3)
Variation of PCM properties of ice and water was ignored except for the density. It implied that only the effect of density variation of PCM with the temperature on buoyancy was considered.
(4)
Melting of the PCM was isotropic and homogeneous.
(5)
The experimental system had four sets of thermocouples distributed uniformly. The geometry and place occupied by these probes were not defined.
(6)
The enthalpy–porosity method, as a common method for PCM simulation [31,32,33,34], was applied to simulate the ice-melting process.
For PCM, based on the above assumptions, the governing equations of the model were continuity, momentum, and energy-conservation equation, which are presented below.
The continuity equation was expressed as Equation (1) [29].
ρ t + 1 r r ( r ρ V r ) + 1 r θ ( ρ V θ ) = 1
The momentum equation was expressed as Equations (2) and (3) [29].
V θ t + ( V ) V θ V r V θ r = g β ( T T m ) sin θ 1 ρ r p θ + ν ( 2 V θ + 2 r 2 V r θ V r r 2 ) + S θ
V r t + ( V ) V r V θ 2 r = g β ( T T m ) cos θ 1 ρ p r + ν ( 2 V r + 2 r 2 V θ θ V r r 2 ) + S r
where Vr and V θ denote the flow velocity of the melted water along r and θ directions (m·s−1). The first term on the right side of the equation represents natural convection term according to the Boussinesq approximation, i.e., the density variation is only considered in the gravity term. β is the expansion coefficient (K−1), ν denotes dynamic viscosity, Sr and S θ are the damping source terms which are used to vary fluid velocity during the melting process (m·s−1), and r and θ are introduced into the momentum equation to describe the effect of the phase transition on convective region of the PCM, and are calculated by Equation (4) [29].
S θ = ( 1 f ) 2 f 3 + ε A mush V θ     S r = ( 1 f ) 2 f 3 + ε A mush V r
where Amush represents the mushy region constant, which describes the steepness of the velocity gradient in the mixing region (kg·m−1·s−1), ranging between 104 and 1010, f denotes the liquefaction rate in the range from 0 (solid) to 1 (liquid), which represents the proportion of liquid PCM in total PCM. Amush is assumed to be constant and set to 106. ε is a constant that prevents the denominator from being zero, which is normally taken as 0.001.
Energy conservation equation could be expressed as Equation (5) [29].
t ( ρ H ) + ( ρ V H ) = λ ( 1 r 2 2 T θ 2 + 1 r r ( r T r ) )
where λ is thermal conductivity (W·m−1·K−1), and H represents the sum of sensible and latent heats formulated by the enthalpy method (kJ·kg −1). Instead of identifying a precise solid–solution interface, this method distributes a given liquefaction rate to each calculation cell according to enthalpy balance [31,35], where H‘ (kJ·kg−1) is the sum of sensible enthalpy, and Δ H (kJ·kg −1) is latent heat, as in Equation (6).
H = H + Δ H
where
H = h r e f + T r e f T c p d T
and
Δ H = f L
f = { 0 T T s T l T s 1 T < T s T s < T < T l T > T l
Water density varied nonlinearly with temperature and reverses at 277.15 K, which can be considered by the following equation [36]. It can be derived for water densities at different temperatures, as shown in Figure 3.
ρ = ρ l , max ( 1 - γ | T - T max | 1.89 )
where ρ is the transient density (kg·m−3), ρ l , max is the maximum water density with temperature (kg·m−3), and Tmax is the temperature of the maximum density of water. In this study, ρ l , max is 999.97 kg·m−3, Tmax is 277.15 K, and γ is 9.3 × 10⁻⁶.
As shown in Equations (2) and (3), the effect of density variation on natural convection was transferred to that of the expansion coefficient. Thus, β in the model is described as Equation (11).
β = { 1.89 γ ( T max T ) 0.89 1 - γ ( T - T max ) 1.89 1.89 γ ( T max T ) 0.89 1 - γ ( T max T ) 1.89 T > T max T < T max
Heat flux on the tube surface was set as constant and the shell was adiabatic from the surrounding environment. Therefore, boundary conditions of the PCM in the STLHS unit are expressed as Equations (12) and (13).
( T r | r = r i ) = q
( T r | r = r 0 ) = 0
To evaluate the general heat transfer performance of the STLHS unit, the overall heat transfer coefficient, which simultaneously considered heat conduction and convection, was calculated for discussion as in Equation (14).
h ove = q T tube T m
Physical properties of water in the simulation are listed in Table 2 [29].

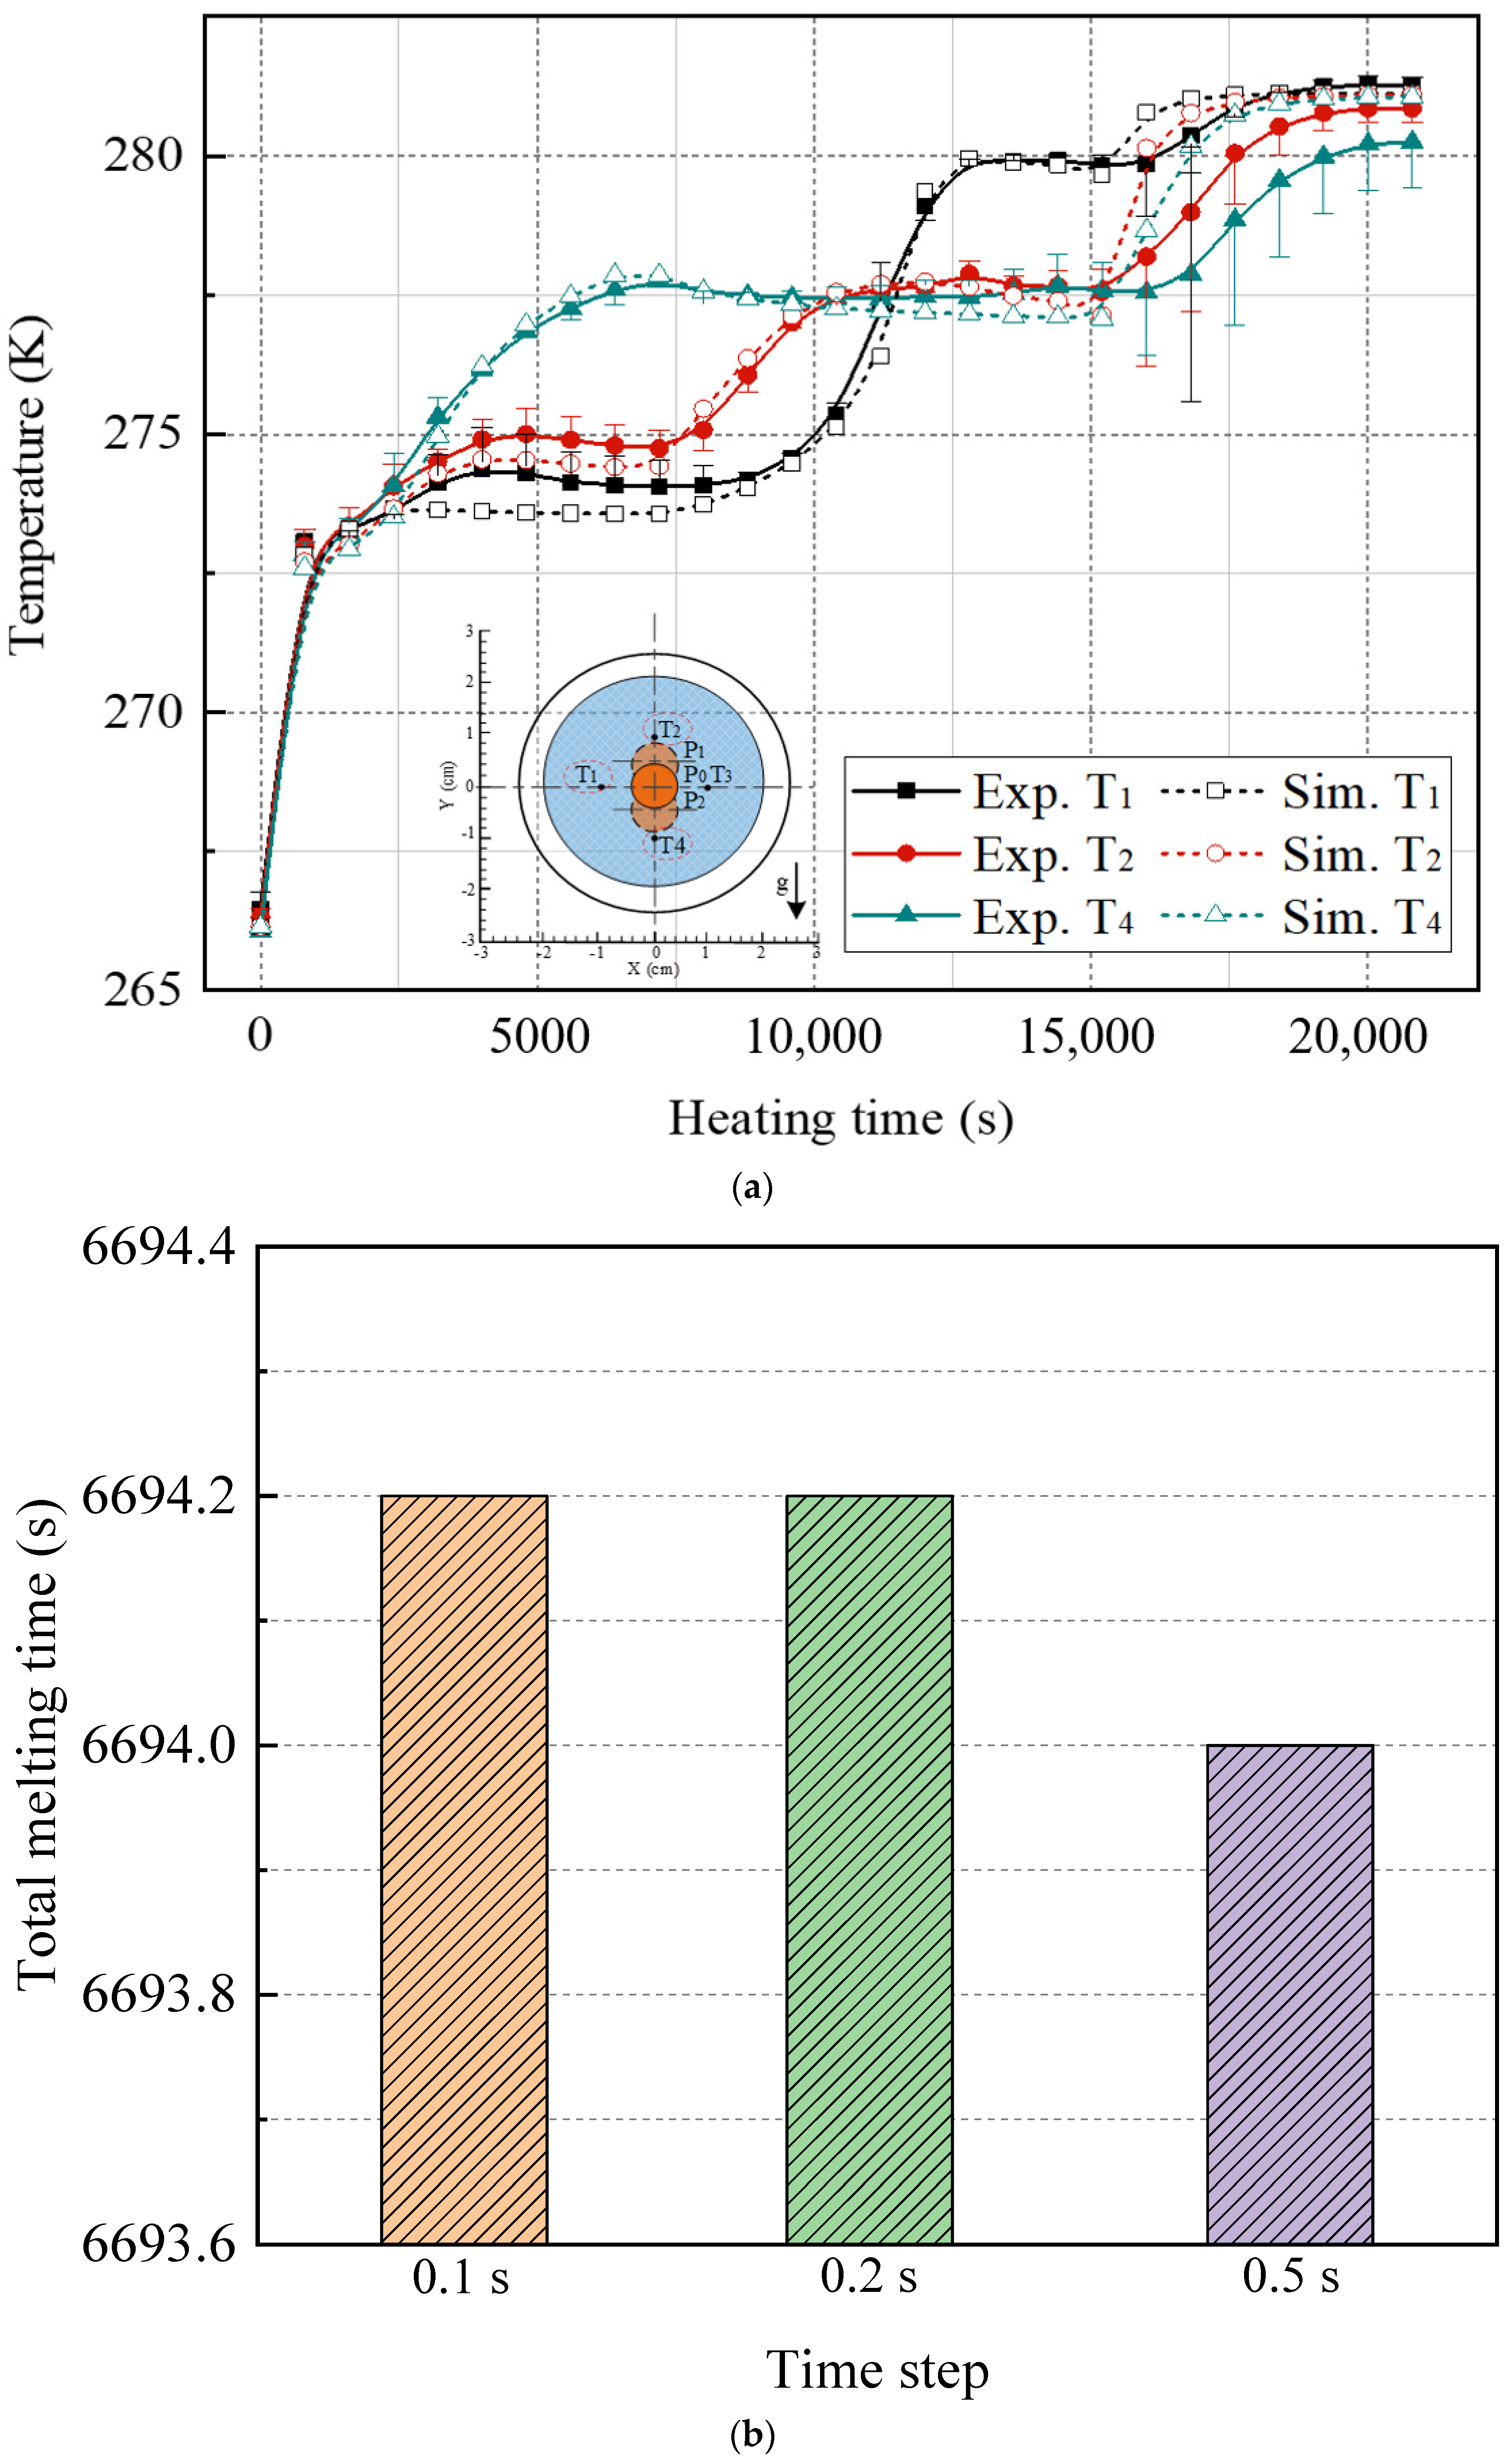
2.3. Numerical Model and Validation

The coupled equations above were solved by ANSYS FLUENT software, which developed the user-defined functions to match properties of density dynamics with temperature. Boundary conditions of the external wall of the STLHS unit were assumed to be adiabatic for insulation simulation. A PISO (Pressure Implicit with Split Operator) algorithm was adopted to solve the pressure–velocity coupling, the skewness correction and the neighbourhood correction were set to 1, the second order scheme could be adopted to discretize the momentum and energy option, and the convergence criteria used for continuous equation, momentum equation, and energy equation were all less than 1 × 10⁻⁶.
Figure 4a shows the temperature at various measuring positions of the STLHS unit during the melting process. The dashed line represents the numerical simulation results, whereas the continuous line represents experimental measurements. It was indicated that the model of PCM was generally reliable and well indicated that the experimental situation was reliable. Furthermore, Figure 4b,c show the total melting time of ice when the input heat flux was 3000 W·m−2 with different simulation time steps and cell numbers. It indicates that there was no significant change when reducing the time steps and cell numbers. Considering computational cost and accuracy, 0.2 s and 12,500 cells were used for the numerical study. For more details of validation, please refer to our previous research [29].

3. Results and Discussion

3.1. Heat Source in Central Position

Figure 5 shows thermal characteristics of PCM in an STLHS unit based on a heat source in the central position. In Figure 5a, the melting evolutions of PCM are presented in terms of different heat flux from 500 W·m−2 to 3000 W·m−2 and liquefaction rate distribution when the global average of liquefaction rate increases from 0.1 to 0.9. The left part of each circle is the phase and velocity vector distributions, while the right part is the temperature distribution. Initially, heat conduction plays a leading role between the heat source and the ice. Thus, the melted liquid is symmetrically distributed in the parts that are close to the central position. As the melting process proceeds, the thickness of the melted part increases, and the melting of warm water starts to flow in the STLHS unit. It demonstrates that natural convection is gradually dominant in the melting process with circulation vortices and further promotes the heat exchange process. It is worth noting that the direction of the flow above and below the STLHS unit are determined by different levels of heat flux ranging from 500 W·m−2 to 3000 W·m−2, which is mainly due to the phenomena of water density, as shown in Figure 3. When heat flux is below 1000 W·m−2, heat convection in the melting process flows to the bottom of the unit while the flow starts to go to the up part with a heat flux higher than 2000 W·m−2. Thus, the critical point for heat convection of water flow ranges between 1000 W·m−2 and 2000 W·m−2. The reason for the influence of heat flux on convection direction is described as follows: due to the unique density feature, the hot water moves downwards, driven by natural convection when the temperature is lower than 277.15 K, and moves upwards when the temperature is higher than 277.15 K. For different levels of heat flux, the temperature of liquid water is different. When heat flux is relatively small, e.g., 500 W·m−2, the water temperature mainly ranges from 273.1 K to 277.15 K, while, when heat flux is relatively large, e.g., 3000 W·m−2, the water temperature is always higher than 277.15 K. Thus, the natural convection directions of these two conditions are different, which means that the direction of heat convection changes with different heat flux. The overall heat transfer coefficient is presented in terms of different heat flux, as shown in Figure 5b. It is noted that the overall heat transfer coefficient of different heat flux from 500 W·m−2 to 3000 W·m−2 decreases sharply with the increase in the melting time at the beginning of the melting process. This is mainly because heat conduction initially plays a leading role in the STLHS unit. Then, the heat transfer coefficient tends to be constant at about 250 W·m−2·K−1 based on heat convection. Figure 5c shows the liquefaction rate of the unit with the increase in the melting time. The results show that the liquefaction rate increases with the increase in the melting time. The higher heat flux is, the larger the liquefaction rate becomes, which leads to a reduced melting time of PCM in the STLHS unit. The melting time of PCM with a heat flux of 500 W·m−2 is more than five times longer than that of 3000 W·m−2.

3.2. Heat Source in Eccentric Postions

Figure 6 shows thermal characteristics of PCM in an STLHS unit based on a heat source in eccentric positions where up and down eccentric positions are illustrated. Figure 6a,b demonstrate the situation when considering different levels of heat flux, i.e., 500 W·m−2 and 3000 W·m−2, respectively. It reveals that the general development of the melting process with a heat source in eccentric positions is almost similar to that of a heat source in a central position, i.e., heat convection direction with 500 W·m−2 goes towards the bottom of the STLHS unit, while the direction with 3000 W·m−2 goes to the top. Accordingly, Figure 7 indicates the melting time of PCM based on a heat source in eccentric positions based on the different levels of heat flux in which 500 W·m−2 and 3000 W·m−2 are presented in Figure 7a,b, respectively. For a heat flux of 500 W·m−2, the total melting time of PCM in the upper heat source position of the STLTS unit is shorter than that of PCM with a central heat source position and that in a lower heat source position. This could be attributed to the fact that the convection direction goes to the lower part. Thus, the upper part of PCM is difficult to liquefy in the process. The larger the volume ratio of the upper area to the total area of the STLTS unit is, the longer the melting time of PCM becomes. The difference in melting time in different heat source positions is very small, and the increment or decrement of the melting time for PCM with a heat source in various positions is less than 1%. Considering the heat flux of 3000 W·m−2, the total melting time of PCM with a heat source in the upper position is longer than that of PCM with a heat source in the central position and that with a heat source in the lower position. It could be observed that the shortest total melting time of PCM with a heat source in the lower position is 8248 s, which is about 14% and 25% smaller than that of PCM with a heat source in the central position and upper position, respectively. It is noted that the time saved by changing heat source position is quite distinct under the heat flux of 500 W·m−2 and 3000 W·m−2. The main reason is that the key effect of excellent heat transfer on latent thermal storage is the reduction in sensible heat when the total heat power input is fixed. In the case of weak heat flux, the average temperature of the melted PCM is low, and the proportion of sensible heat to total heat is relatively small. The benefit of reducing the sensible heat is negligible. When the heat flux increases, the benefit brought by heat transfer enhancement becomes remarkable, and the time saved by changing the heat source position is significant. This proves that the lower position of heat source is more conducive to the melting process of PCM in an STLTS unit. To further compare and analyse this, Figure 8 indicates the heat transfer coefficient of PCM in the STLTS unit with a heat source in eccentric positions based on the different levels of heat flux in which 500 W·m−2 and 3000 W·m−2 are presented in Figure 8a,b, respectively. The heat transfer coefficients decrease sharply and are all similar at the beginning of the melting process due to the leading role of heat conduction. After that, the heat transfer coefficients slightly decrease. When heat flux is 500 W·m−2, the heat transfer coefficient of PCM with a heat source in the upper position is higher than that of PCM with a heat source in the lower position and central position. For a heat flux of 3000 W·m−2, a reverse trend of PCM with a heat source in different positions could be found in the melting process.

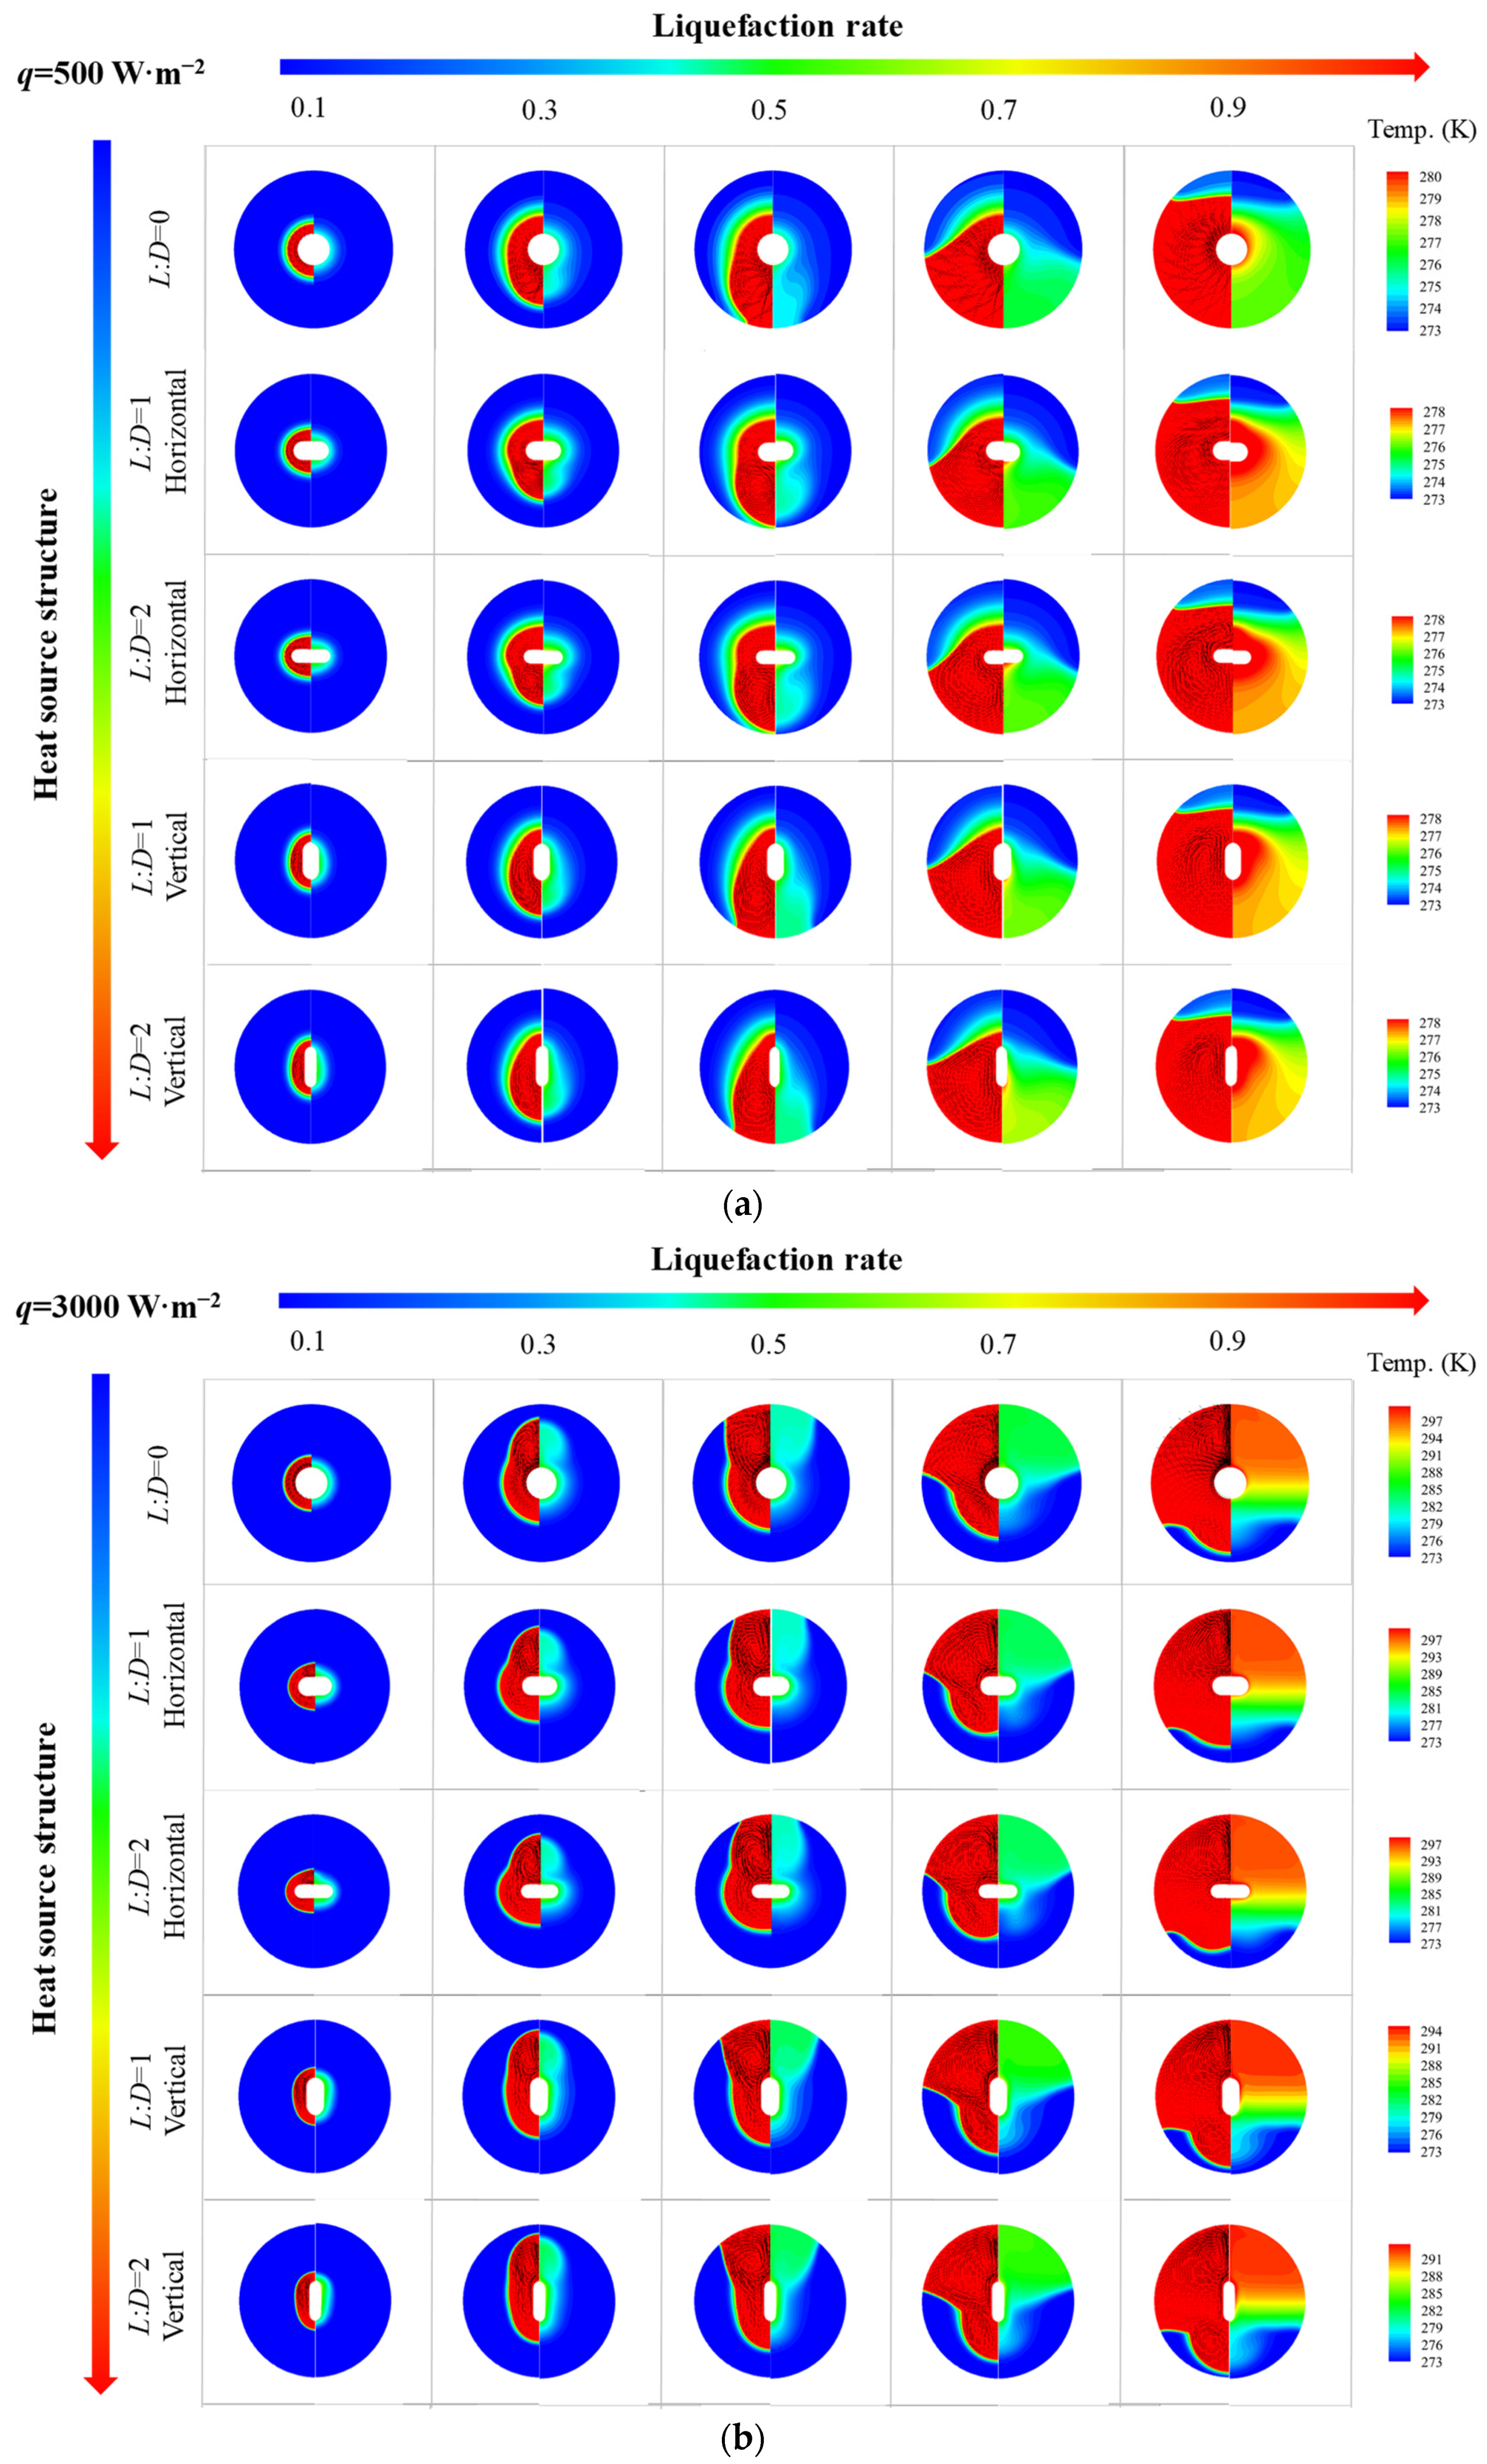
3.3. Heat Source with Various Configurations

Figure 9 shows thermal characteristics of PCM in an STLHS unit with a heat source with flat-tube configuration in terms of different heat source configurations, i.e., horizontal and vertical flat-tube type. The heat flux values of 500 W·m−2 and 3000 W·m−2 are presented in Figure 9a,b, respectively. From Figure 9a, it is noted that the temperature distribution of PCM with the configurations of round heat source or flat-tube heat source are almost the same at the beginning of the melting process since, during this period, heat transfer is dominated by heat conduction. Then, for the melting process, it is dominated by heat convection, and PCM with the configuration of a vertical flat-tube heat source has a better performance than that of heat source in a central position and a horizontal flat-tube heat source when the heat flux is 500 W·m−2. This is mainly because the heat source may cause flow resistance during the melting process. The structure of the vertical flat-tube fits with the streamline of natural convection that is better than the circle tube and horizontal flat-tube, leading to a weaker flow resistance and better heat transfer performance. This situation is also found when heat flux is 3000 W·m−2, as shown in Figure 9b. The larger the ratio between L and D is, the more obvious the situation becomes. Figure 10 demonstrates the total melting time of PCM in an STLHS unit with various heat source configurations. With the increase in the melting time, the melting process of PCM with five different configurations of heat source is compared in terms of heat flux values of 500 W·m−2 and 3000 W·m−2. It was observed that the total melting time of PCM with vertical flat-tube heat source is much shorter than that of a heat source in the central position and horizontal flat-tube type due to the above reasons for heat convection processes. Similar to the total melting time of PCM in different configurations of heat source, the performance is very close when heat flux is 500 W·m−2, as shown in Figure 10a. Comparably, in Figure 10b, the total melting time of PCM with various heat source configurations has a larger difference under a heat flux of 3000 W·m−2. The longest melting time of PCM is 6994 s when a heat source is adopted as a horizontal flat-tube with an L:D ratio of 2. It reveals that the shortest melting time of PCM could be obtained by the configuration with a vertical flat-tube heat source with an L:D ratio of 2, which is up to 6.3% smaller than that of PCM with a heat source in a central position and the configuration of horizontal flat-tube heat source. Accordingly, Figure 11 shows the heat transfer coefficients of PCM in an STLHS unit with a heat source in a central position and the configuration of various flat-tube types, which aims to further analyse and understand the thermal characteristics of the melting process. Figure 11a,b present the performance of PCM with heat flux values of 500 W·m−2 and 3000 W·m−2, respectively. Heat transfer coefficients of PCM with various heat source configurations are almost similar in the heat conduction process. For a heat flux of 500 W·m−2, the heat transfer coefficient of PCM shows the highest value of 213 W·m−2·K with the configuration of vertical flat-tube heat source which has an L:D ratio of 2 at 15,200 s during the convection-dominating period. During the melting process, which is dominated by heat convection, the heat transfer coefficient with the configuration of the vertical flat-tube heat source is around 1.5% higher than that with the heat source in a central position and the configuration of horizontal flat-tube heat source. This is mainly due to the improved natural convection. Moreover, considering a heat flux of 3000 W·m−2, the overall trend of the heat transfer coefficient is almost the same as that with a heat flux of 500 W·m−2. The heat coefficient of PCM with the configuration of the vertical flat-tube heat source is around 241 W·m−2·K, which is higher than that of PCM with a heat flux of 500 W·m−2. This is mainly due to the more significant natural convection caused by the larger temperature difference. Based on the above analysis of different heat source positions and configurations, it can be concluded that PCM in an STLHS unit with a heat source in the lower position and configuration of the vertical flat-tube type could reveal a superior performance when compared with other cases. The above results could be a good basis for the design of ice storage.

4. Conclusions

Different heat source positions and configurations were adopted to investigate the effect of natural convection on the melting process of PCM in an STLTH unit. Melting evolution, the melting time, and the overall heat transfer coefficient during the melting process were analysed and compared. The conclusions are as follows.
This study demonstrates that natural convection is gradually dominant in the melting process with circulation vortices and would further promote the heat exchange process. The direction of flow toward upper and lower parts of the STLHS unit are determined by different heat flux values ranging from 500 W·m−2 to 3000 W·m−2. The critical point for heat convection of PCM in the STLTH unit ranges between 1000 W·m−2 and 2000 W·m−2. Moreover, a higher heat flux leads to a larger liquefaction rate. The melting time of PCM with a heat flux of 500 W·m−2 is more than five times longer than that of PCM with a heat flux of 3000 W·m−2. The melting process with a heat source in eccentric positions has a similar trend with that of a heat source in a central position. Due to the different natural convection directions, the larger the volume ratio of upper area to total area of an STLTS unit is, the longer the melting time of PCM becomes. Different heat source configurations, i.e., horizontal and vertical flat-tube type have different effects on the melting processes. Under a heat flux of 3000 W·m−2, the shortest melting time of PCM is obtained by a heat source that has a vertical flat-tube with an L:D ratio of 2. For a heat flux of 500 W·m−2, the heat transfer coefficient of PCM shows the highest value of 213 W·m−2·K with a vertical flat-tube heat source and an L:D ratio of 2 at 15,200 s during the convection-dominating period.
To conclude, PCM in an STLTH unit with a heat source in the lower position as well as configuration of vertical flat-tube type could achieve a superior melting performance when compared with other cases in this work. For practical application, air conditioning in buildings would be the main target for ITS. The research finding of this work could be a basis for the design of storage units. Thus, a high overall thermal performance would be achieved in terms of system compactness and energy storage efficiency.

Author Contributions

Conceptualization, C.Z., Y.F. and D.C.; methodology, Y.F. and L.J.; software, Y.F.; validation, W.Z., M.Y., Z.W. and Y.F.; formal analysis, C.Z.; investigation, D.C.; re-sources, Z.W.; data curation, Y.F.; writing—original draft preparation, C.Z., Y.F. and D.C.; writing—review and editing, C.Z., M.Y., Y.F. and D.C.; supervision, Z.W. and L.J.; project administration, L.J.; funding acquisition, L.J. All authors have read and agreed to the published version of the manuscript.

Funding

The authors gratefully acknowledge the support from National Natural Science Foundation of China (No. 52276022), as well as from the Basic Research Funds for the Central Government ‘Innovative Team of Zhejiang University’ under contract number (2022FZZX01-09).

Institutional Review Board Statement

Not applicable.

Informed Consent Statement

Not applicable.

Data Availability Statement

Not applicable.

Conflicts of Interest

The authors declare no conflict of interest.

Nomenclature

TTemperature (K)
tTime (s)
CNTCarbon nanotubeVFlow velocity (m·s−1)
ITSIce thermal storage
LTES Latent thermal energy storageGreek letters
LHSLatent heat storageρDensity (kg·m−3)
PCMPhase change materialεCalculation constant
STLHSShell-and-tube latent heat storageβExpansion coefficient (K−1)
TESThermal energy storageλCoefficient of thermal conductivity (W·m−1·K−1)
cpSpecific heat capacity at constant pressure (kJ·kg−1·K−1)
fLiquid fractionSubscripts
gGravitational acceleration (m·s−2)iInner tube radius
HTotal enthalpy (J·g−1)lLiquid
hEnthalpy (J·g−1)mPhase change temperature of PCM
h ove Overall heat transfer coefficient (W·K−1)oOuter shell radius
LLatent heat of fusion (J·g−1)refReference stated
qHeat flux (W·m−2)sSolid
rRadius (m)wWater

References

  1. Wang, L.W.; Tamainot-Telto, Z.; Metcalf, S.J.; Critoph, R.E.; Wang, R.Z. Anisotropic thermal conductivity and permeability of compacted expanded natural graphite. Appl. Therm. Eng. 2010, 30, 1805–1811. [Google Scholar] [CrossRef] [Green Version]
  2. Li, Q.; Bai, F.; Yang, B.; Wang, Z.; El Hefni, B.; Liu, S.; Kubo, S.; Kiriki, H.; Han, M. Dynamic simulation and experimental validation of an open air receiver and a thermal energy storage system for solar thermal power plant. Appl. Energy 2016, 178, 281–293. [Google Scholar] [CrossRef]
  3. Jiang, L.; Wang, R.Z.; Wang, L.W.; Roskilly, A.P. Investigation on an innovative resorption system for seasonal thermal energy storage. Energy Convers. Manag. 2017, 149, 129–139. [Google Scholar] [CrossRef] [Green Version]
  4. Jiang, L.; Li, S.; Wang, R.Q.; Fan, Y.B.; Zhang, X.J.; Roskilly, A.P. Performance analysis on a hybrid compression-assisted sorption thermal battery for seasonal heat storage in severe cold region. Renew. Energy 2021, 180, 398–409. [Google Scholar] [CrossRef]
  5. Jiang, R.; Yu, X.; Chang, J.; Yu, X.; Wang, B.; Huang, R.; Li, Z. Effects evaluation of fin layouts on charging performance of shell-and-tube LTES under fluctuating heat sources. J. Energy Storage 2021, 44, 103428. [Google Scholar] [CrossRef]
  6. Hu, C.; Li, M.; Wang, Y.; Li, G.; Ma, X.; Du, W.; Zhou, X.; Zhag, Y. Preliminary investigation on pilot-scale photovoltaic-driven cold storage with ice thermal storage based on vapor compression refrigeration cycle. Sustain. Energy Technol. Assess. 2021, 45, 101187. [Google Scholar] [CrossRef]
  7. Khadiran, T.; Hussein, M.Z.; Zainal, Z.; Rusli, R. Encapsulation techniques for organic phase change materials as thermal energy storage medium: A review. Sol. Energy Mater. Sol. Cells 2015, 143, 78–98. [Google Scholar] [CrossRef]
  8. Sarkar, S.; Mestry, S.; Mhaske, S.T. Developments in phase change material (PCM) doped energy efficient polyurethane (PU) foam for perishable food cold-storage applications: A review. J. Energy Storage 2022, 50, 104620. [Google Scholar] [CrossRef]
  9. Wang, X.; Li, W.; Luo, Z.; Wang, K.; Shah, S.P. A critical review on phase change materials (PCM) for sustainable and energy efficient building: Design, characteristic, performance and application. Energy Build. 2022, 260, 111923. [Google Scholar] [CrossRef]
  10. Fan, Y.; Zhang, C.; Jiang, L.; Zhang, X.; Qiu, L. Exploration on two-stage latent thermal energy storage for heat recovery in cryogenic air separation purification system. Energy 2022, 239, 122111. [Google Scholar] [CrossRef]
  11. Fan, Y.; Yu, M.; Zhang, C.; Jiang, L.; Zhang, X.; Zhao, Y. Melting performance enhancement of phase change material with magnetic particles under rotating magnetic field. J. Energy Storage 2021, 38, 102540. [Google Scholar] [CrossRef]
  12. Yang, L.; Ji, W.; Zhang, Z.; Jin, X. Thermal conductivity enhancement of water by adding graphene Nano-sheets: Consideration of particle loading and temperature effects. Int. Commun. Heat Mass Transf. 2019, 109, 104353. [Google Scholar] [CrossRef]
  13. Xing, M.; Yu, J.; Wang, R. Experimental study on the thermal conductivity enhancement of water based nanofluids using different types of carbon nanotubes. Int. J. Heat Mass Transf. 2015, 88, 609–616. [Google Scholar] [CrossRef]
  14. Park, S.S.; Kim, N.J. Influence of the oxidation treatment and the average particle diameter of graphene for thermal conductivity enhancement. J. Ind. Eng. Chem. 2014, 20, 1911–1915. [Google Scholar] [CrossRef]
  15. Du, C.; Nguyen, Q.; Malekahmadi, O.; Mardani, A.; Jokar, Z.; Babadi, E.; D’Orazio, A.; Karimipour, A.; Li, Z.; Bach, Q.-V. Thermal conductivity enhancement of nanofluid by adding multiwalled carbon nanotubes: Characterization and numerical modeling patterns. Math. Methods Appl. Sci. 2020. [Google Scholar] [CrossRef]
  16. Abhishek, A.; Kumar, B.; Kim, M.H.; Lee, Y.T.; Chung, J.D.; Kim, S.T.; Kim, T.; Lee, C.; Lee, K. Comparison of the performance of ice-on-coil LTES tanks with horizontal and vertical tubes. Energy Build. 2019, 183, 45–53. [Google Scholar] [CrossRef]
  17. Vyshak, N.R.; Jilani, G. Numerical analysis of latent heat thermal energy storage system. Energy Convers. Manag. 2007, 48, 2161–2168. [Google Scholar] [CrossRef]
  18. Trp, A.; Lenic, K.; Frankovic, B. Analysis of the influence of operating conditions and geometric parameters on heat transfer in water-paraffin shell-and-tube latent thermal energy storage unit. Appl. Therm. Eng. 2006, 26, 1830–1839. [Google Scholar] [CrossRef]
  19. Soltan, B.K.; Ardehali, M.M. Numerical simulation of water solidification phenomenon for ice-on-coil thermal energy storage application. Energy Convers. Manag. 2003, 44, 85–92. [Google Scholar] [CrossRef]
  20. Kousha, N.; Hosseini, M.J.; Aligoodarz, M.R.; Pakrouh, R.; Bahrampoury, R. Effect of inclination angle on the performance of a shell and tube heat storage unit—An experimental study. Appl. Therm. Eng. 2017, 112, 1497–1509. [Google Scholar] [CrossRef]
  21. Yuan, Y.; Cao, X.; Xiang, B.; Du, Y. Effect of installation angle of fins on melting characteristics of annular unit for latent heat thermal energy storage. Sol. Energy 2016, 136, 365–378. [Google Scholar] [CrossRef]
  22. Liu, Z.; Quan, Z.; Zhao, Y.; Jing, H.; Liu, X.; Wang, L. Experimental research on the performance of ice thermal energy storage device based on micro heat pipe arrays. Appl. Therm. Eng. 2021, 185, 116452. [Google Scholar] [CrossRef]
  23. Chiu, J.N.W.; Martin, V. Submerged finned heat exchanger latent heat storage design and its experimental verification. Appl. Energy 2012, 93, 507–516. [Google Scholar] [CrossRef]
  24. Darzi, A.R.; Farhadi, M.; Sedighi, K. Numerical study of melting inside concentric and eccentric horizontal annulus. Appl. Math. Model. 2012, 36, 4080–4086. [Google Scholar] [CrossRef]
  25. Cao, X.; Yuan, Y.; Xiang, B.; Haghighat, F. Effect of natural convection on melting performance of eccentric horizontal shell and tube latent heat storage unit. Sustain. Cities Soc. 2018, 38, 571–581. [Google Scholar] [CrossRef]
  26. Yu, C.; Peng, Q.; Liu, X.; Cao, P.; Yao, F. Role of metal foam on ice storage performance for a cold thermal energy storage (CTES) system. J. Energy Storage 2020, 28, 101201. [Google Scholar] [CrossRef]
  27. Lou, X.; Wang, H. Role of copper foam on solidification performance of ice-cool storage sphere system. J. Energy Storage 2022, 47, 103552. [Google Scholar] [CrossRef]
  28. Zhao, Y.; Li, Z.; Utaka, Y.; Chen, Z.; Ohkubo, H. Adhesion characteristics of ice in urea aqueous solution for efficient slurry formation in cold storage. Int. J. Refrig. 2019, 100, 335–342. [Google Scholar] [CrossRef]
  29. Wu, F.; Fan, Y.B.; Zhang, X.J.; Zhang, H.; Wang, Z.L.; Wang, Z.W.; Jiang, L. Performance prediction on ice melting process for cold energy utilization: Effect of natural convection. J. Energy Storage 2022, 55, 105638. [Google Scholar] [CrossRef]
  30. Yıldız, Ç.; Arıcı, M.; Nižetić, S.; Shahsavar, A. Numerical investigation of natural convection behavior of molten PCM in an enclosure having rectangular and tree-like branching fins. Energy 2020, 207, 118223. [Google Scholar] [CrossRef]
  31. Brent, A.D.; Voller, V.R.; Reid, K.J. Enthalpy-Porosity Technique For Modeling Convection-Diffusion Phase Change: Application To The Melting Of A Pure Metal. Numer. Heat Transf. 1988, 13, 297–318. [Google Scholar] [CrossRef]
  32. Chakraborty, P.R. Enthalpy porosity model for melting and solidification of pure-substances with large difference in phase specific heats. Int. Commun. Heat Mass Transf. 2017, 81, 183–189. [Google Scholar] [CrossRef]
  33. Younsi, Z.; Naji, H. A numerical investigation of melting phase change process via the enthalpy-porosity approach: Application to hydrated salts. Int. Commun. Heat Mass Transf. 2017, 86, 12–24. [Google Scholar] [CrossRef]
  34. Niezgoda-Żelasko, B. The Enthalpy-porosity Method Applied to the Modelling of the Ice Slurry Melting Process During Tube Flow. Procedia Eng. 2016, 157, 114–121. [Google Scholar] [CrossRef] [Green Version]
  35. Voller, V.R.; Swaminathan, C.R. Eral Source-Based Method for Solidification Phase Change. Numer. Heat Transf. Part B Fundam. 1991, 19, 175–189. [Google Scholar] [CrossRef]
  36. Sasaguchi, K.; Kusano, K.; Viskanta, R. A numerical analysis of solid-liquid phase change heat transfer around a single and two horizontal, vertically spaced cylinders in a rectangular cavity. Int. J. Heat Mass Transf. 1997, 40, 1343–1354. [Google Scholar] [CrossRef]
Figure 1. Schematic and photograph of the experimental rig: (a) schematic diagram of the experimental rig; (b) photo and structure of an STLHS unit [29].
Sustainability 15 00365 g001
Figure 2. Positions and configurations of heat source for PCM in an STLHS unit.
Sustainability 15 00365 g002
Figure 3. Variation of water density with the increase in temperature.
Sustainability 15 00365 g003
Figure 4. Validation results of melting model: (a) comparison between simulation and experiments [29], (b) independence test of time step, (c) independence test of cell number.
Sustainability 15 00365 g004aSustainability 15 00365 g004b
Figure 5. Thermal characteristics of PCM in an STLTH unit with a heat source in the central position vs. different heat flux: (a) temperature distribution; (b) the overall heat transfer coefficient; (c) the liquefaction rate.
Sustainability 15 00365 g005aSustainability 15 00365 g005b
Figure 6. Thermal characteristics of PCM in the STLTH unit with eccentric heat source position in terms of heat flux of (a) 500 W·m−2; (b) 3000 W·m−2.
Sustainability 15 00365 g006
Figure 7. Melting time of PCM in the STLTH unit with eccentric heat source position in terms of heat flux of (a) 500 W·m−2; (b) 3000 W·m−2.
Sustainability 15 00365 g007
Figure 8. Heat transfer coefficient of the STLTH unit with eccentric heat source position in terms of heat flux of (a) 500 W·m−2; (b) 3000 W·m−2.
Sustainability 15 00365 g008
Figure 9. Thermal characteristics of PCM in an STLTH unit based on a heat source with flat-tube configuration in terms of heat flux of (a) 500 W·m−2; (b) 3000 W·m−2.
Sustainability 15 00365 g009
Figure 10. Melting time of PCM in an STLTH unit based on heat source with flat-tube configuration in terms of heat flux of (a) 500 W·m−2; (b) 3000 W·m−2.
Sustainability 15 00365 g010
Figure 11. Heat transfer coefficient of PCM in an STLTH unit based on heat source with flat-tube configuration in terms of heat flux of (a) 500 W·m−2; (b) 3000 W·m−2.
Sustainability 15 00365 g011
Table 1. Comparison between this paper and the related literature.
PCMProcessNatural
Convection
Heat Source
Configuration
Heat Source BoundaryRef.
WaterSolidificationNoCircleConstant
temperature
[23]
N-eicosaneMeltingYesCircle;
eccentric
Constant
temperature
[24]
Lauric acidMeltingYesCircle;
eccentric
Constant
temperature
[25]
WaterSolidificationYesStarburst finConstant
temperature
[26]
ParaffinMeltingYesTree-like
branching fins
Constant heat flux[30]
WaterMeltingYes (density inversion)Circle;
eccentric
Constant
temperature
[29]
WaterMeltingYes (density inversion)Circle;
eccentric;
plate-tube
Constant heat fluxThis paper
Table 2. Thermal properties of water in the simulation [29].
PropertiesValue
Specific heat (J·kg−1·K−1)2020 (solid), 4212 (liquid)
Melting temperature (K)273.15
Dynamic viscosity (kg·m−1·s−1)0.001003
Thermal conductivity (W·m−1·K−1)2.22 (solid), 0.551 (liquid)
Thermal expansion coefficient (K−1)0.00013
Latent heat of fusion (J·kg−1)335
Disclaimer/Publisher’s Note: The statements, opinions and data contained in all publications are solely those of the individual author(s) and contributor(s) and not of MDPI and/or the editor(s). MDPI and/or the editor(s) disclaim responsibility for any injury to people or property resulting from any ideas, methods, instructions or products referred to in the content.

