Article

Analyzing Express Revenue Spatial Association Network’s Characteristics and Effects: A Case Study of 31 Provinces in China

1
School of Management, Zhejiang University of Technology, Hangzhou 310023, China
2
School of Information Engineering, Zhejiang University of Technology, Hangzhou 310023, China
*
Author to whom correspondence should be addressed.
Sustainability 2023, 15(1), 276; https://doi.org/10.3390/su15010276
Submission received: 12 November 2022 / Revised: 14 December 2022 / Accepted: 21 December 2022 / Published: 24 December 2022
(This article belongs to the Special Issue Frontiers in Economic Geography)

Abstract

:
In recent years, China’s express delivery industry has experienced significant regional differences in income, which may endanger the sustainable development of the economy and affect the sustainable development of society. To study the development setup and influencing factors of the express delivery industry in various regions of China, based on the income data of provincial express delivery, we constructed a spatial correlation network of provincial express revenue in China using the social network analysis method and analyzed its network characteristics and evolution rules. Additionally, the relationship between network structure parameters and express revenue was tested using the spatial Durbin model. The results reveal that the spatial correlation network of China’s provincial express revenue changes from decentralization to agglomeration, and the connection between the express industry in each province is constantly strengthened. The provinces in the eastern coastal areas exhibit a higher degree of centrality and effective scale in the network, and the limit system is smaller, which indicates that these provinces have higher importance and control ability in the network. Simultaneously, a moderating effect exists between network structure parameters and express income, indicating that network structure parameters affect express income through human capital input. This study provides theoretical research and empirical support to promote the coordinated and sustainable development of the express delivery industry.

1. Introduction

The express delivery industry—a new industry—emerged in the United States in the late 1960s. According to the US International Trade Commission’s 2004 report definition, express delivery is quickly collecting, transporting, and delivering documents, printed materials, parcels, and other items. The entire process is tracked and controlled, and other services related to the above processes are provided. However, with the continuous development of the express delivery industry, it gradually becomes an emerging composite enterprise that brings together functions such as information exchange, item transmission, and capital circulation. This industry is becoming increasingly important in people’s lives [1]. For a long time, the express delivery industry has played a basic role in serving the production and serving people’s livelihood and has significantly contributed to the promotion of economic development. For example, the express industry has a significant promoting effect on the growth of other services [2], and it has a cooperative income effect on the manufacturing output [3]. Therefore, it is of great significance to study the developmental status of the express delivery industry. According to the 2012–2020 courier revenue data released by the China Statistics Bureau on their website, the national express revenue in 2012 was 105.533 billion CNY, and the national express revenue in 2020 was 879.543 billion CNY. Simultaneously, the courier industry has become involved in the process of high-speed development. The number of express-delivery businesses in the eastern region is significantly higher than that in the western region, and the exchanges between the express delivery business between regions are extremely large [4]. For example, per the provinces announced by the China Statistics Bureau’s website in 2020, express delivery data reveal that in 2020, provinces with higher courier income included Guangdong, Shanghai, Zhejiang, and Jiangsu. The Ningxia courier revenue (Guangdong Province) was 618 times that of the highest courier income province (Tibetan Province), indicating a large gap in the express delivery income between provinces. Simultaneously, in 2020, the express delivery revenue in Eastern China accounted for 79.6%, while the express delivery revenue in Central and Western China accounted for less than 20%, indicating that the gap between express delivery income in each region was extremely large. As an important industry in China’s national economy, the express delivery industry is not conducive to the sustainable development of the regional express delivery industry or the regional economy if it develops very differently among regions and even endangers the development of the entire social economy [5,6]. Judging from the data released by the statistical bureaus of various provinces and countries, it can be seen that the express delivery industry has agglomerated development trends, and a large gap exists in express delivery income among provinces. However, the network structure and evolution mode of the express delivery industry remains unclear. Therefore, it is urgent to explore the network pattern of the development of the provincial express delivery industry and further analyze the evolution of the network to provide empirical support for promoting the regional coordinated development of the express delivery industry so as to promote the sustainable development of the express delivery industry.
In recent years, with the rise of geographical research from the perspective of streaming space, an increasing number of scholars have used social network analysis to visualize the regional relations of economic activities from a cross-disciplinary perspective, combined with economic sociology and economic geography. Researchers have studied the characteristics of different industries in regions or clusters and their network characteristics and reported numerous valuable findings [7]. Chen Lixian [8] built a spatial association network based on the production and trade services of 61 countries and found that the centrality and connection strength of the spatial association network positively affected global value chain participation and location index. Wang et al. used the carbon emission data of the construction industry to establish a spatial association network and performed an in-depth analysis of the structural characteristics and driving effects of the spatial association network of the construction industry’s carbon emission intensity. They found an increase in network density and a decrease in network level. A decrease in network efficiency would reduce the carbon emission intensity of the building [9]. Li Jing et al. studied the spatial correlation network of agricultural investment growth. They found that each node in the correlation network was closely connected and that the spatial clustering of agricultural investment growth in each region formed the following four functional plates: two-way spillover, broker, main benefit, and net benefit [10]. These studies have provided methodological inspiration for the exploration of the spatial association network of the express delivery industry, but there are many limitations. The main research topic of these studies is the spatial association network, but the spatial econometric model is not used to analyze the network effect in the process of exploring the network effect, and the specific quantification of the spatial spillover effect is lacking. Therefore, this study has made some innovations in the research methods of the express industry spatial association network. When exploring the network effect based on the spatial Durbin model, the adjustment effect between the network structure parameters calculated by the social network analysis method and the output of the express delivery industry was studied. On the one hand, the spatial spillover effects of network structure parameters and other factors were quantified. On the other hand, it is also a good combination of social network analysis and the spatial Durbin model. Simultaneously, the design of the spatial weight matrix is crucial for the spatial econometric model. However, most studies directly define it as a spatial proximity matrix, which affects the validity and stability of model estimation results. This study fully considers the characteristics of the express delivery industry and uses the information distance spatial weight matrix to weigh the interactions between provinces to test the stability of the model estimation results.
This study differs from previous research mainly in the following aspects: first, there is a lack of relevant work based on the development of the provincial express industry to study the network structure and evolution characteristics, and second, this study combines social network analysis and spatial econometric methods. The dual perspectives of space and relationship are combined to explore the associated network and network effects of the express industry, to provide empirical research for promoting the sustainable development of the express industry, and finally, to study the factors affecting the development of express delivery-related businesses, especially the influence of network characteristics and network adjustment effects. It was found that there is a moderating effect between the network structure parameters and express business income, which is also a contribution to the research on the moderating effect.
This study performs the following analysis: first, it uses provincial express income data. Based on the provincial unit as the network node and using the inter-provincial correlation coefficient as the connection edge between nodes, the provincial express income spatial correlation network is constructed. Second, based on the social network analysis method, its network parameters are calculated, and its network pattern and regional association changes are analyzed, revealing the dynamic evolution process of the association network space, and finally, a moderating effect model is built on the basis of the spatial Durbin model, revealing the network characteristics and evolution that affect industrial development law.

2. Literature Review

As a basic service industry, the express industry has always attracted the attention of scholars. The research has predominantly examined the development of the express industry and the influencing factors of spatial differences. Moreover, numerous studies have investigated industrial development using social networks and space measurement methods, but related research has neglected the important industrial field of the express delivery industry.

2.1. Express Industry Research Status

Several scholars at home and abroad have studied the factors affecting the development of the express industry based on regional perspectives. These studies are predominantly divided into two aspects—namely, express development and spatial differences. In terms of the impact of express development, Wang Yanyan et al. [11] adopted the influencing factors of the distribution of express business volume distribution of various provinces and cities from 2007–2014. They found that the penetration rate of netizens was an important influencing factor. Guo Mingde and Li Hong [12] analyzed panel data of the province’s express delivery industry and observed the factors influencing the express industry. They found that the informationization of the express industry and the number of employees have affected the industry’s development. Wang Linzhu et al. [13] used the long-term equilibrium relationship between panel data to study variables and found a long-term balanced relationship between the informationization level, urbanization level, and the express industry’s development. Liao et al. [14] selected the total national income as the key variable to analyze the factors influencing the number of express deliveries in China. They found that the total national income significantly contributes to promoting the number of express deliveries.
Additionally, numerous scholars have studied the factors influencing the differences in space within the express industry. Li Yumin et al. [15] used the data from express delivery businesses in various provinces to analyze the phenomenon of space gathering in China’s express industry. They found that the courier industry in Shanghai and Zhejiang exhibited a high degree of agglomeration and high agglomeration capacity. Zhang Jinyu and Lan Hongjie [16], considering Shandong Province as an example, studied the factors influencing the development of the urban express industry and found that the number of courier service vehicles and differentiated development of the express industry were the most correlated.
Moreover, some scholars have studied the express delivery industry from the perspective of the industry. Song Fang and Wang Lianhua [17] analyzed the factors affecting the development of the express delivery industry in Shandong Province in China. Based on the use of gray association analysis, it was found that human factors significantly impact the express industry. Huang Fei [18], with B2C e-commerce as the main research object, analyzed the factors influencing the growth of the express delivery industry in the B2C mode from both qualitative and quantitative perspectives. Research reveals that the informatization level and other factors significantly impact the Chinese express industry’s growth.

2.2. Research Status of Social Network Analysis Methods

Several scholars have utilized the social network analysis method, which is predominantly divided into two aspects—quantitative tools for industrial-related network structure characteristics and their impact on industrial development. Regarding the characteristics of industrial-related network structure and its research on the impact of industrial development, Li Yuanjun et al. [19], based on single express data, studied the characteristics of e-commerce express logistics network structure and its formation mechanism in the three major urban agglomerations in China. They found that its network density is high, and a typical network structure is formed. The Yangtze River Delta urban agglomeration network has a circular web structure.
Further, Ji Yujun and Zhang Yanyan [20] utilized data from the provincial manufacturing industry in China to study the characteristics and network effects of manufacturing-related networking. They found that the characteristics of network structure significantly positively contribute to the development of the provincial manufacturing industry. Wang et al. [9] used the carbon emissions data of the construction industry to establish a related network, perform an in-depth analysis of the related network structure characteristics, and determine the effects of the construction industry’s carbon emissions intensity. They found that the increase in network density, network level, and network efficiency reduces the intensity of carbon emissions.
Simultaneously, the social network analysis method can provide quantitative tools for representing spatial relations. Foreign research is primarily based on the global perspective and analyzes the impact of the logistics and express industry on the economy from the perspective of the world’s urban network [21]. Most domestic research has analyzed the express logistics network structure from the perspective of the provincial and urban perspectives. Tang Chenghui and Ma Xueguang [22] analyzed the data of the courier outlet, spatial pattern, characteristics, and structure of the Chinese city network. They found that the density of the courier network was low and had an evident core-edge structure. The network presents the characteristics of the small world. Zhou Jianping, based on the foundation of Zhongtong Express circulation data during the “Double Eleven” period, adopted the index random chart model (ERGM) to study the logistics network structure and self-organizational effect of the express enterprise and found that the network structure exhibited multiple cores and a gathering phenomenon [23]. Li Jun and Wang Zhongzhi [24] adopted the statistics of the express delivery industry of the Yangtze River Delta urban agglomeration—using ArcGIS and other tools to explore the network structure of the Yangtze River Delta urban agglomeration—and found that the adjacent geographical neighborhood positively impacts the intensity of express network connection.

2.3. Space Measurement Method Research Status

With the development of spatial measurement analysis methods and measurement tools, an increasing number of learning methods used the method of space measurement to study industrial development from the perspective of space. Some scholars have utilized the method of space measurement to study the impact of a certain factor on the industry. Liu Guowei [25] used the inter-provincial data from 2000 to 2015 to perform spatial measurement analysis from the perspective of geography and technology. They found that logistics technology innovation exhibits a significant space overflow of logistic development factors, such as regional logistics transportation distance. Zhong Changbao and Zhu Zhanjie [26], based on the provincial and municipal data of the Yangtze River Economic Belt in the Yangtze River Economic Belt from 2006–2015, demonstrated that social capital significantly positively influenced local and surrounding areas gathering levels of the logistics industry agglomeration. Li Zhenqiang et al. [27], based on the provincial and municipal data of the Yangtze River Economic Belt in 2004–2018, studied the effect of industrial policy on the level of logistics agglomeration of the Yangtze River Economic Belt and concluded that the industrial policy significantly impacts its agglomeration level.
Some scholars have used the space Durbin model to assess the adjustment effect of other factors. Wei Lihua et al. [28] used the provincial panel data of China from 2007–2017 to explore the financial drawing ability and public service supply relationship by building a space measurement model. Their results revealed that the blind-scale expansion of economic growth raised by fiscal decentralization and the process of rapid urbanization negatively regulated local governments’ actions. Yu Binbin and Su Yimei [29], based on China’s prefecture-level and urban data from 2004 to 2017, used the space Durbin model to test the relationship between real estate investment and land use efficiency and found that real estate investment in land finance affected the value of land scale efficiency. The adjustment effect was negative.
Moreover, some scholars have used space measurement to study factors affecting industrial development. Wang Dongfang and Dong Qianli [30] studied the factors influencing the heterogeneity of the urban logistics industry’s development level in China from 2005 to 2016 with respect to the geographical space distribution. They found that the development of urban logistics exhibited a significant overflowing effect. Sun Chunxiao et al. [31] studied the characteristics and driving mechanisms of China’s urban logistics innovation. They found that the government’s support, congregation creation atmosphere, and economic foundation significantly impacted local or neighboring urban logistics innovation.

2.4. Literature Analysis

The development of the express industry has always received widespread attention from scholars. Numerous related studies have significantly inspired—and contributed to—this study’s theoretical framework and model construction. However, the existing literature still has several shortcomings.
First, previous research lacks related work based on the development of the provincial express industry to study network structure and evolution characteristics. At present, many studies use social network analysis methods to study the network characteristics of many industries, but they ignore the express industry, an important industry, especially the exploration of the express industry’s spatial correlation network at the provincial level. Therefore, based on the express income data of each province, this study constructed a provincial express income spatial correlation network and explored its network characteristics and evolution rules to compensate for the lack of relevant literature.
Second, previous studies have not considered the influence of space factors. Judging from the existing literature, some scholars have used methods such as gray correlation and multiple regression to study the factors affecting the development of the express industry, but few have applied spatial econometric methods to the study of the express industry. Therefore, this study constructs a moderating effect model based on the spatial Durbin model, fully considering the spatial effects of network characteristics and other factors.

3. Materials and Methods

3.1. Data Source and Network Composition

The sample period of this study was 2012–2020, and the provincial quarterly data of China Express Revenue during this period was selected to build a courier income-related network. The data originated from the monthly “Operation Report of the Postal Industry” announced by the State Post Office. The data are based on a monthly basis because these data were designed to form a correlation with the province quarterly and the period of data during the quarter as the node is formed. The data released on the provincial express delivery industry mainly include business volume, business income, number of employees, and number of service outlets, but the data that can measure the overall development of the express delivery industry are business volume and business income. At the same time, considering that the volume of the express delivery business in China is increasing year by year, but the per capita express delivery income is decreasing year by year, the development of the express delivery industry may be reflected by the express delivery business volume that has no economic factors. In addition, the express revenue of each province is the core data reflecting the development of the express delivery industry in each province. It reflects the economic vitality of the express delivery industry in each province, the ranking in the entire national express delivery market and the differences in express delivery development among regions. Since the research content of this paper is the network pattern and evolution mode of the development of the express industry, the express revenue data are selected as the original data for the construction of the spatial correlation network of the provincial express industry. Moreover, this study also employed the panel data of the express industry from 2012 to 2020, the proportion of the tertiary industry, the proportion of the urban population, telephone penetration, and internet broadband access ports to build a regulatory effect inspection model from the “Statistics of the Postal Industry Development Statistics” and “China Statistics Yearbook” of each year, the reasons for selecting these panel data are discussed in Section 3.4.
The social network analysis method primarily studies a set composed of nodes and lines between nodes. The use of social network analysis to complete the construction of the network requires the determination of the nodes, edges, and connection rules. This study—based on 31 provinces (excluding Hong Kong, Macao, and Taiwan) in mainland China—built network nodes and used the following principles to form network connected edge, connection, and threshold rules.
(1) Selection of connection. To construct a network of relations in the express delivery industry, forming a connection between provinces is necessary. First, we used the courier income data of each province for four quarters as the basic data. The correlation coefficient of the courier income data between the provinces was calculated. Thus, the correlation coefficient matrix Bij was formed, the matrix elements were thresholded, and finally, the matrix elements after thresholding were used as the edges between the nodes. According to the characteristics of the correlation coefficient, the absolute value of the connection is between 0 and 1; the larger the value, the stronger the correlation.
(2) Connection rules. After specifying the construction of the points and edges, connection rules were set. If the connection is not processed, it will become a fully linked network, and the network will lose its meaning because the correlation coefficient is rarely 0. Therefore, based on the correlation coefficient matrix Bij of each province, this study uses Li Mao’s research method to process it [32] and transforms it into a simplified matrix Eij to form the connecting edges of the basic network, thereby building a basic spatial network model of China’s express revenue among 31 nodes. The formula is as follows:
e i j = b i j , i f   b i j t , i j e i j = 0 , i f   b i j < t , i j e i j = 1 , i f   i = j i , j 1 , 2 , 3 , , 31
where i and j represent nodes in provinces i and j, respectively, bij represents the degree of correlation between express revenues in provinces i and j, t represents the threshold, and eij represents the connection between provinces i and j after bij is simplified by the threshold side.
(3) Optimization of the threshold, or the streamlined of Lianbian. Based on the best threshold determination method proposed by Ren Huiming and Ye [33], first, we determined the effective threshold interval of the network. Thereafter, the number of nodes in the maximal connected subgraph according to the threshold was changed to determine the optimal threshold. We obtained the probability density distribution based on the correlation coefficients of courier income between provinces. We observed the density distribution diagram. The interval of the optimal threshold in this study was 50%–70% of the probability distribution, thereby determining the optimal distribution. From the aforementioned threshold intervals, the relationship between the largest connection of the maximal connected subgraph was formed to select the appropriate threshold, complete the streamlined connection, and build a provincial express delivery income-related network. The representatives 2012, 2016, and 2020 were taken to display the threshold judgment process, as follows: The interval between the accuracy of the screening data of 0.002 was selected, and the results are presented in Table 1, which reveals that after the 2012 network diagram (the first line in the table), the threshold was 0.986, and the number of nodes began decreasing significantly. According to the above principles, it was determined that 0.986 was the optimal threshold (the corresponding threshold of the 2012 node is 27). Similarly, the threshold of the maximum connected sub-map of the network diagram in 2016 was 0.986, and the number of corresponding nodes was 30. Notably, when the threshold was taken in 2020, the number of nodes in the maximum of the maximal connected subgraph was stable at the thresholds 0.978 and 0.982. Considering the principle of retaining the most nodes, the final selection of the threshold was 0.978. (The corresponding number of nodes is 28).

3.2. Network Structure Parameter Indicator

The research content of complex network statistical characteristics is predominantly divided into overall network features, individual network features, and cohesive subgroup analyses. The characteristics of the network express income network in China were considered, and the path length (including the average path length and diameter) and the clustering coefficient were selected as the overall network feature indicator; degree center, structure hole’s limit degree, and effective scale were used to describe the characteristics of the individual space related network. Subgroup density was used to measure subgroup salience to represent cohesive subgroup analysis of association networks.
Path length indicates the shortest distance between the two nodes in the network. The indicators of path length are divided into average path length and diameter. The average path length represents the average distance between all sections in the network, describing the measuring speed of the network information transmission speed, that is, how much the network transmission is, generally expressed by L. For example, in the human social relationship network, L represents the average number of friends between two people in the shortest relationship chain. The longer the length of the network path, the looser the connection between the two nodes in the network—where Dij indicates the number of nodes in the shortest path connecting nodes i and j, and N is the number of nodes. The formula is as follows:
L = 1 1 2 N N 1 i j d i j
Diameter represents the maximum value between the arbitrary two nodes in the network, which is generally represented by the letter D. The longer the diameter of the network, the more the connection between the two nodes in the network is alienated—where Dij indicates the shortest path connecting the two nodes. The formula is as follows:
D = max d i j
The clustering coefficient is used to describe the degree of connection between the adjacent points of each node in the network. Generally, the clustering coefficient is represented by the letter C. For example, in social networks, C represents the degree of familiarity between friends, showing the degree of agglomeration of social networks. The larger the clustering coefficient of the network, the closer the node in the network is—where Formula (3) represents the calculation of the clustering coefficient of each node, and Formula (4) is the clustering coefficient of the overall network. Among them, Ci represents the clustering coefficient of the i node; and Ki represents the number of connection points of the node i. Fi represents the actual number of edges between Ki neighboring contact of the node. The average number of clustering coefficients of all nodes is the clustering coefficient of the associated network. The network is more closely connected or clustered if the value is larger. The formula is as follows:
C i = 2 F i K i K i 1
C = 1 N i = 1 N C i
The degree centrality of the nodes in the network is represented by the letter M. In the network, the adjacent edge of a node i is the degree centrality of the node. For example, in the interpersonal network, the larger the centrality of a person is expressed, the greater the connection between the person and other people; that is, the person holds an important position in the network. We measured the importance of each node in the network or its location relationship. The larger the degree, the higher the degree of correlation with other nodes in the space network. Among them, Xij represents the number of edges connected to nodes i and j, and N represents the number of nodes. The formula is as follows:
M i = j = 1 N x i j
The structural hole’s limit degree: the two nodes in the network must be connected through the third node; hence, the third node occupies a structural hole in the network. The node occupying the structural hole is located at the hub of information transmission, which has advantages in obtaining key information and the latest knowledge. The degree of restrictions is used to measure the ability of the node to use the structure hole in the network, which is expressed by the letter G. For example, in a social network, you can obtain something from one friend to limit the time and energy invested in this friend and another friend [34]. The smaller the limit degree of the structural hole, the more structured holes in the node, and the more key information and knowledge can be obtained—where Gij indicates that node i is limited by j; Pij and Piq indicate that in the entire connection of node i; and the connection of node j and node q accounts for the entire connection. In all connections, the line connected to node j is in proportion to the entire line. The formula is as follows:
G i j = ( p i j + q p i q p q j ) 2
The structural hole’s effective scale: the effective scale is a measure of the advantageous position of the node occupying the structure hole, and it is expressed by the letter W. In the network, the effective scale of a node is evaluated by how many non-redundant connection nodes are in a node. The larger the effective scale of the structural hole, the more important the position of the node occupying the structure hole. Wi represents the effective scale of node i. j represents all points connected to the node i. q represents a third party in each network except i or j. Piq indicates that in the entire connection of node i, the connection with node q accounts for the total connection. Ojq is the intensity of the relationship between a node to q. The second-value network of this study is invariably 1. The formula is as follows:
W i = j ( 1 q p i q o j q ) , q i , j
Cohesive subgroup analysis: In the association network, some nodes form a small group owing to closely related information, resources, and other factors, and this small group is called a cohesive subgroup. Nodes within the same cohesive subgroup were closely connected. The subgroup density is an index used to measure whether the node connection phenomenon in the subgroup is prominent. A higher subgroup density indicates that the nodes within the subgroup are more closely connected, and the flow of information resources is more frequent. This study uses the CONCOR algorithm in the UCINET software to analyze the cohesive subgroup of the network.

3.3. Empirical Model

In considering the impact of spatial effects, this study constructs an econometric model based on spatial panel data from 2012 to 2020. Before constructing the spatial econometric model, this study uses a spatial autocorrelation test to analyze whether the research objects have a spatial correlation. Should the research objects have spatial correlation, construct a spatial econometric model to test the moderating effect and explore the moderating effect of network structure parameters on express delivery revenue. If the spatial effect of the research object is not significant, we can choose other panel models.

3.3.1. Space Automatic Inspection Model

Spatial correlation aims to test whether the research object has a correlation in space, which is a necessary step before the measurement return. The Moran index is generally used for testing. According to the scope of the main body of the space, the Moran index can be divided into global and local Moran indexes. The global Moran index explores whether the research object exists in space correlation. The local Moran index explores the location of the abnormal value of the research object or the position of the gathering of the agglomeration and the emergence of the agglomeration scope. This study used the global Moran index to analyze whether the express income has a space correlation. The global Moran index formula is as follows:
I = n i = 1 n j = 1 n W i j ( x i x ¯ ) ( x j x ¯ ) i = 1 n ( x i x ¯ ) 2 i = 1 n j = 1 n W i j
where n = 31 represents 31 provinces and cities in mainland China; Wij is the information distance weight matrix; Xi and Xj represent the provincial express delivery income of nodes of i and j of the province, and x ¯ is the average value of courier income in 31 provinces. The Moran index belongs to the reasonable number within the range of [−1, 1]. If it is greater than 0, it means that the space is positively correlated, and the space agglomeration is evident. The larger the value, the stronger the spatial correlation; that is, the high courier income and the high courier income areas are gathering, and low courier income and low express income areas have gathered; if the value is less than 0, it means that the space is negative, the difference between the region is evident, and the smaller the value, the lower the spatial correlation, which indicates that the high courier income and the low express income areas correlate; if its value is equal to 0, it indicates that the distribution of express delivery income space in each node of the express delivery industry is random and has no spatial correlation.

3.3.2. Space Panel Model Settings

The spatial metering model is generally used in the space Durbin model (SDM), the spatial lag model (SAR), and the spatial error model (SEM). SDM explores the interactive effect of internal and external space. It is a general form of spatial lag and error models and is universal. Therefore, this study temporarily used the SDM model for network structure parameters to adjust the effect of express income. We referred to the methods of the established model of inspection and adjustment effects based on the space Durbin model inspection and adjustment effect of Yu Binbin and Su Yimei [30], as expressed below:
ln E I i t = α 0 + ρ i = 1 n W i j ln E I i t + α 1 ln P S E i t + π 1 i = 1 n W i j ln P S E i t + ln X i t + π 2 i = 1 n W i j ln X i t + v t + ξ i t
ln E I i t = α 0 + ρ i = 1 n W i j ln E I i t + α 1 ln P S E i t + π 1 i = 1 n W i j ln P S E i t + α 2 M i t + π 2 i = 1 n W i j M i t + φ ln X i t + π 3 i = 1 n W i j ln X i t + v t + ξ i t
ln E I i t = α 0 + ρ i = 1 n W i j ln E I i t + α 1 ln P S E i t + π 1 i = 1 n W i j ln P S E i t + α 2 M i t + π 2 i = 1 n W i j M i t + α 3 ln P S E i t M i t + π 3 i = 1 n W i j ln P S E i t M i t + φ ln X i t + π 4 i = 1 n W i j ln X i t + v t + ξ i t
where T represents the rank T period, T = 1, 2, …, t; i represents the number of regions, and InEIi is expressed as a pair of courier income. InPESit refers to human capital investment in the express delivery industry. In the number, Xit represents the control variable set. Mit represents the network structure parameter set. W represents the spatial weight matrix of the n × n order. Vi represents the time effect. εt represents random disturbance items. Wij is a spatial weight matrix used to measure the adjacent relationship of data in space. Considering the development of the express industry relying more on the coverage of the information network, we built an empirical study of the information distance weight matrix for empirical research. The specific calculation formula is as follows:
W i j = 1 H ¯ i H ¯ j ( i j )
Formula (12) is the matrix formula set by the absolute value of the internet access ports among various provinces in China. The smaller the difference, the greater the space weight. H ¯ i and H ¯ j are expressed as the average number of Internet access ports during the inspection period i and regions of j and region.

3.4. Variable Description

Variable Selection
(1) Explained variables. Express delivery of all provinces (EI). The fundamental goal of studying the factors affecting the output of the express industry is to increase its income of express industry and enhance its economic vitality of the express industry. Therefore, this study chooses express revenue data to represent express industry output, which comes from the statistical yearbook of each province. The higher the express revenue, the higher the express industry output, and the smaller the express revenue, the lower the express output.
(2) Explanation variables. Express industry human capital investment (PES) uses the number of employees of postal businesses in various provinces to indicate that the data is from China’s Statistical Yearbook. Human capital is necessary for the development and survival of the express delivery industry. When many scholars study the factors affecting express delivery output, considering that the express delivery industry is a labor-intensive industry and industrial output is greatly affected by labor input, they all choose the human capital input of the express delivery industry as their core explanatory variable and use the postal industry, which is represented by the number of employed persons [12,31]. Employees of express delivery companies can be divided into four categories: management personnel, professional and technical personnel, marketing personnel, and production personnel. Among them, production personnel includes front-line employees engaged in a series of tasks, such as transportation and sorting, and their number accounts for a very large proportion. Therefore, it is more important to pay attention to the number of members of the labor force than the quality and potential of the labor force.
(3) Regulating variables. Degree centrality (PDC), limit degree (LS), and effective scale (ES). The network structure parameters (M) of these three express-income-related networks (M) are used as the regulatory variable. The data comes from the calculation formula of Section 3.2 of the network parameter index. Degree centrality is an index reflecting the importance of each node. If the value is larger, there are more nodes directly connected to it, which means that more information sources and channels are available. The limitation and effective scale of the structural hole reflect the degree of control of each node to other nodes in the individual network. The smaller the limit and the larger the effective scale, the better the node is in the network. The courier industry’s related network itself does not have a cause and effect pertaining to express income, but it provides a constraint structure for the flow of express elements, adjusts the degree of connection between nodes in various provinces in the network, and affects the linkage effect of express development of various provinces. Therefore, the network structure parameters are selected as a regulatory variable.
(4) Control variables. Industrial structure (PTI) is characterized by the proportion of third industries to GDP. The optimization of the industrial structure can promote economic development, which can increase the demand for the express delivery business. Therefore, the industrial structure variable affects the output of the express delivery industry and is used as the control variable. The level of urbanization (PUP) is measured as the ratio of the urban population to the total population. An increase in the level of urbanization can improve the level of public services, thereby improving the timeliness of express delivery demands and services. Therefore, the level of urbanization is also used as a control variable. The communication level (PC) is represented by the telephone penetration rate. The express service of an e-commerce platform is the most important part of the express service, which is mainly realized by the communication technology platform. Therefore, the level of communication affects the volume of express delivery, and the level of communication is also used as a control variable. At the same time, the data for the above three variables were obtained from China’s Statistical Yearbook.
As the explanatory, interpretation, and control variable values are large, the number is the corrected number. Prior to regression analysis, a collinearity test was conducted. The minimum VIF value of all variables was 1.311, the maximum was 3.040, and the average was 2.239. The collinearity between variables was small, and these variables were selected for the regression test. Following previous studies [11,12,13,14,15,16,17,18], the above research hypothesis between the explanatory variable and the control variable for the explained variable is proposed, and the specific situation is shown in Table 2. See Table 3 for the selection and descriptive statistics of all variables.

4. China Provincial Express Revenue Space Reconciliation Network Structure Characteristics

We used ArcGIS 10.2 software and combined the construction network and research and design steps of Section 3.1 to obtain the network diagram of the provincial express delivery space in China from 2012 to 2020. Based on space limitations, only network diagrams of 2012, 2016, and 2020 are given. According to Figure 1, the network structure fluctuates from discrete to gathering. From the perspective of node connection density, in the 2012 Chart (A), Tianjin, Henan, and Tibet with other provinces are highly intensive. In 2016 Chart (B), Hebei, Jiangsu, Anhui, and Guangdong have a high degree of connection and other provinces. in the 2020 Chart (C), Tianjin, Shanxi, Heilongjiang, Shanghai, Anhui, Henan, and Qinghai exhibit a high degree of connection and other provinces. The connection density of coastal provinces is increasing. Although the evolution of node distribution with a high degree of connection density has a certain law of alienation and gathering, it will be further explored to find the evident characteristics and internal drivers of the network structure.

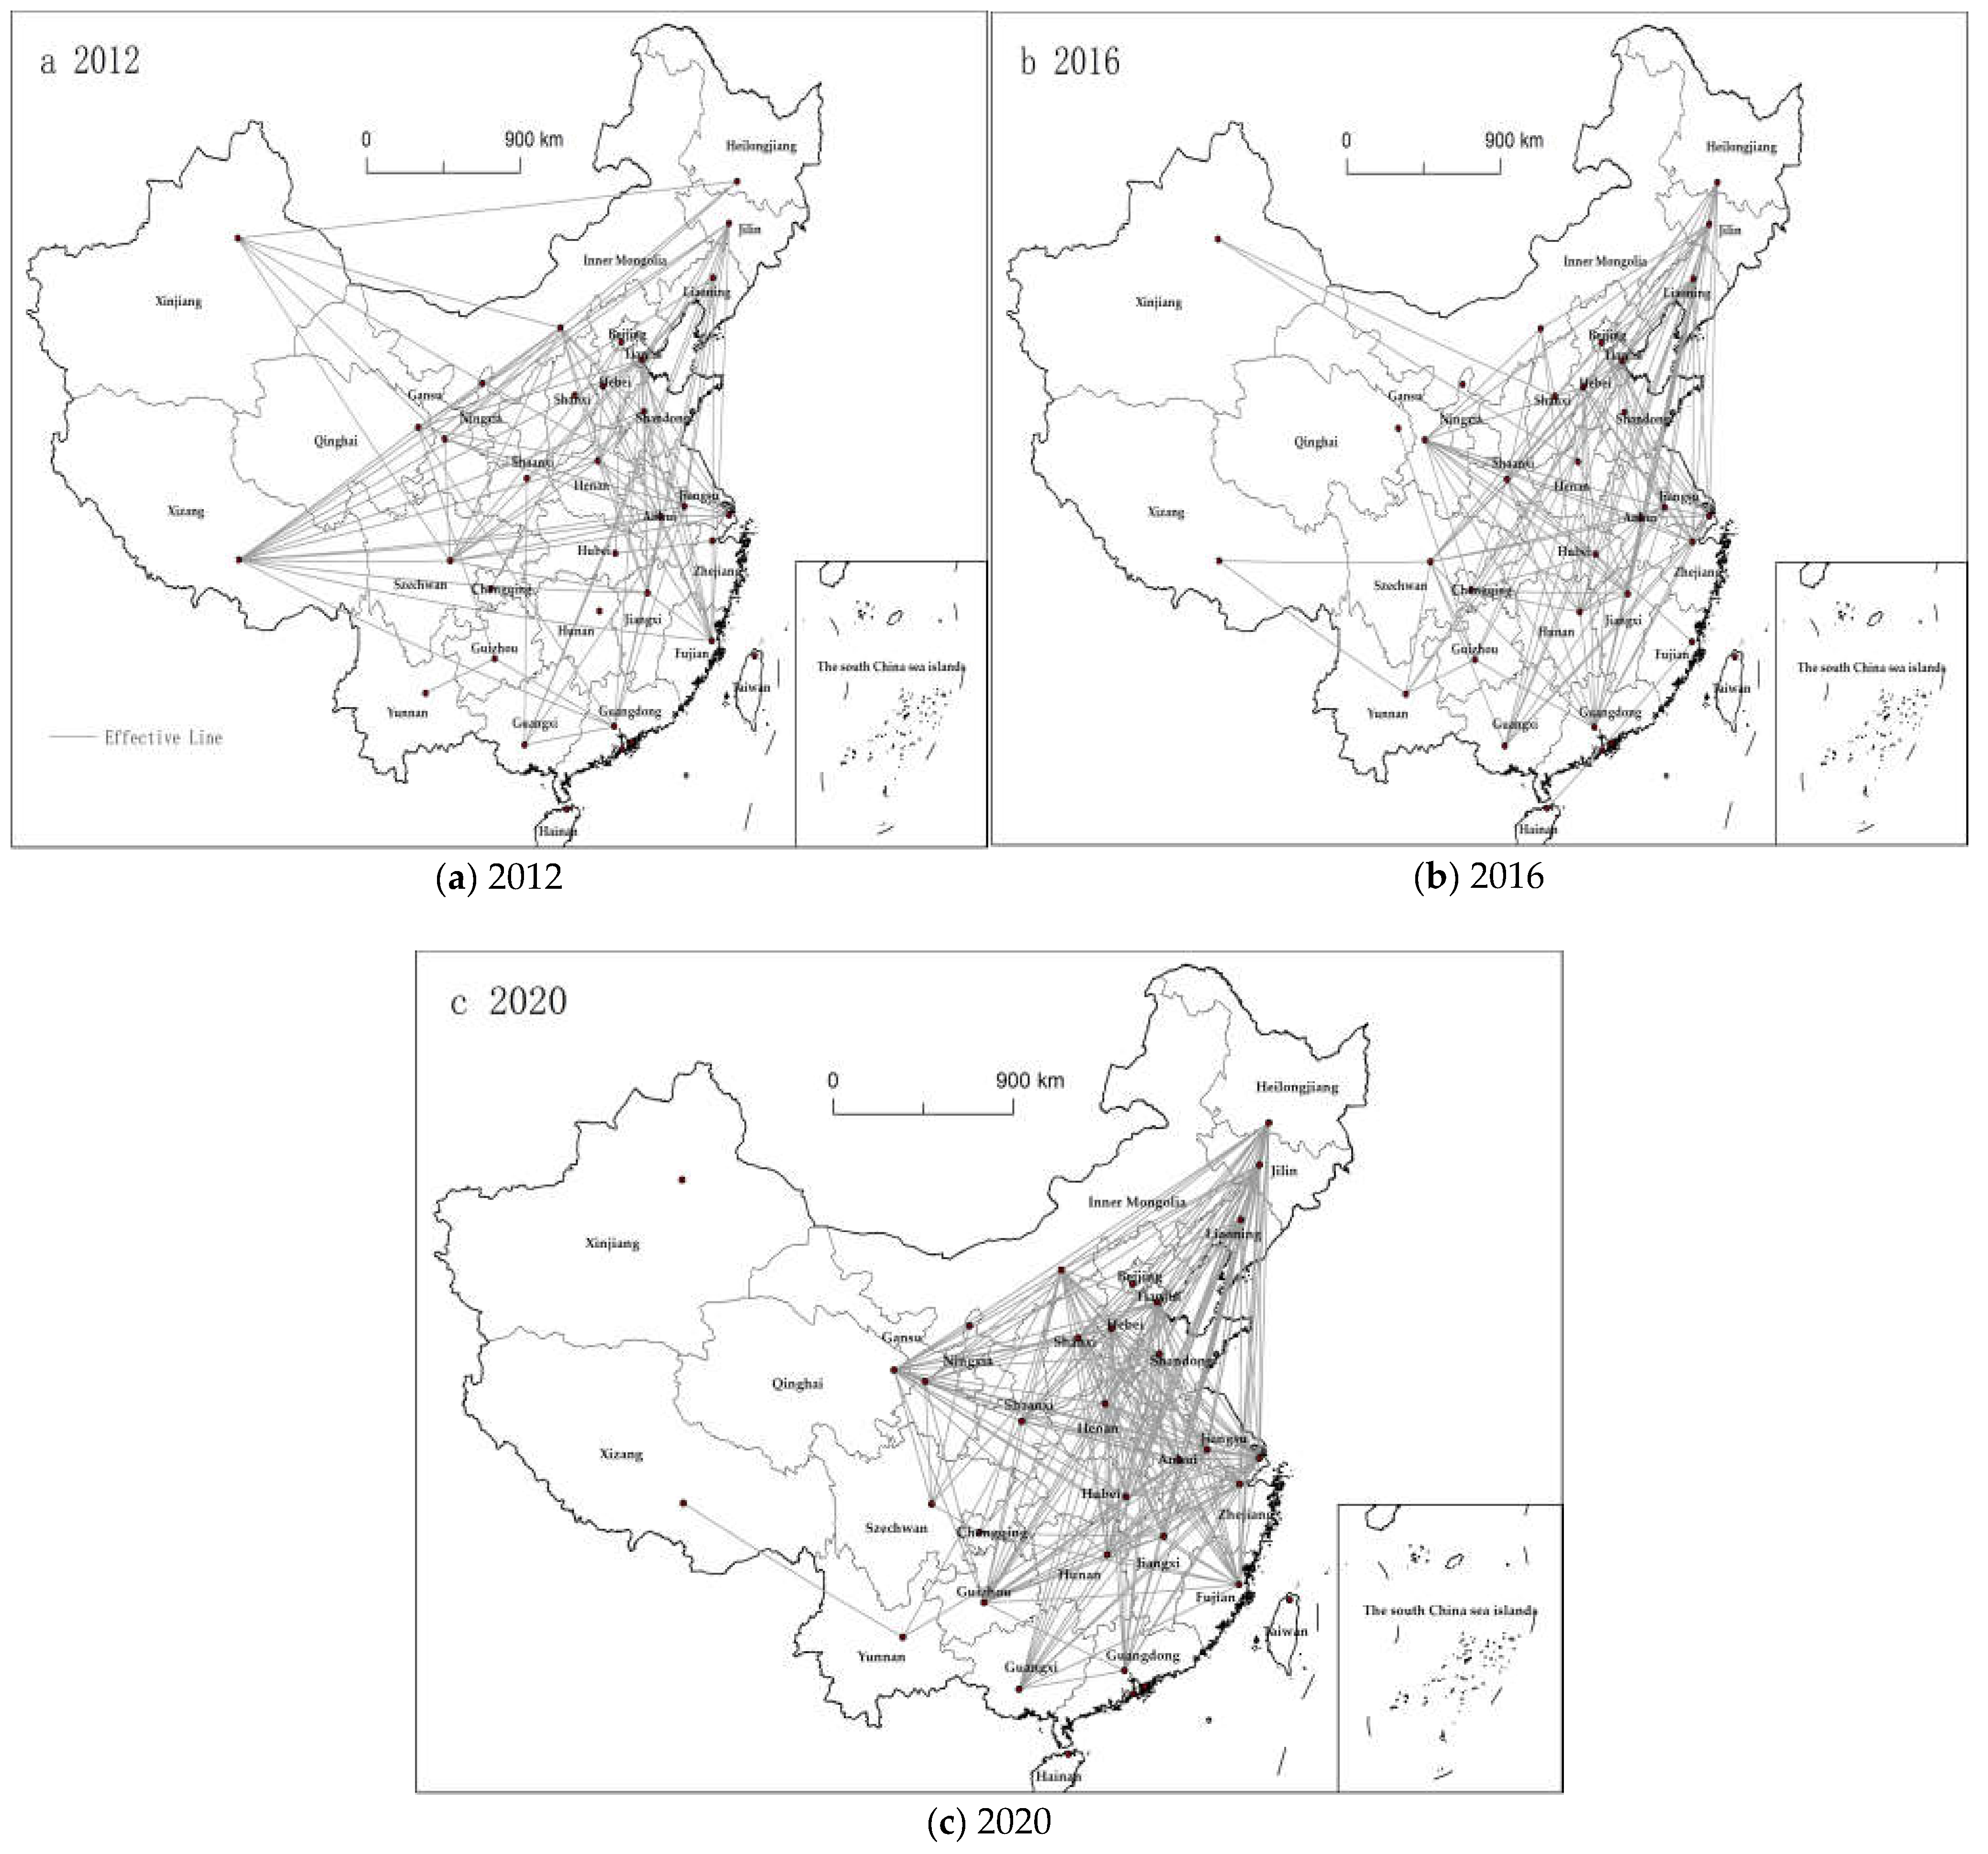
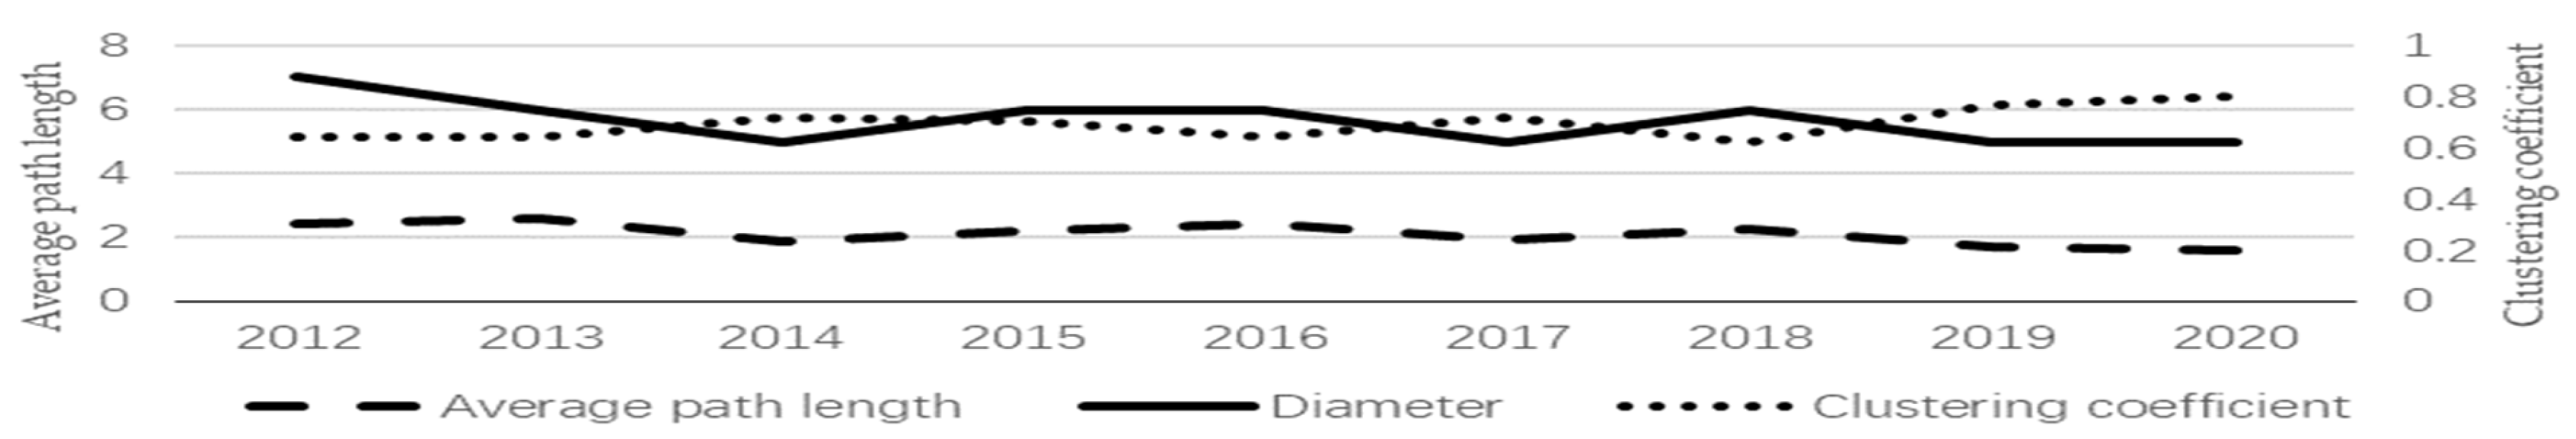
4.1. Analysis of the Features of the Overall Network Structure

Based on the calculation formula of Section 3.2 network structure parameter indicator path and clustering coefficient, Figure 2 presents the main parameter values and motion trends of the network structure of the provincial express delivery income space in China from 2012 to 2020, including the average path length, the length of the path diameter and cluster coefficient. The average path length of the line reveals that the trend from 2012–2018 fluctuated. It was unstable and maintained a downward trend until 2018. The trend of diameter changes reveals that the fluctuations in 2012–2018 and the decline in 2018–2020 are verified with the trend of changes in the average path—where the largest average path length was 2.581, less than 3, and the largest diameter was 7, which has the “small world” network characteristics. Furthermore, the clustering coefficient in the figure presents the trend of fluctuations in 2012–2018 and a steady rise in 2018–2020. These three indicators, from the perspective of network aggregation and discreteness, reflect the continuous and repeated changes of initial network agglomeration-discrete and the process of gathering the network in the later period.
For the possible causes of the above trend, we provide the following explanations: Before 2017, the pattern of expansion of the express industry mainly showed the scale of China’s express delivery industry was increasing. After 2017, the growth rate slowed, and the speed started reducing. It was speculated that the proportion of markets in various enterprises in the express delivery industry has gradually stabilized. Relevant leading enterprises, such as SF, JD.com, Shentong, and Debon, have completed the reconstruction of major business structures, including the listing and merger of the enterprise around 2016, making the competitive market a relatively stable situation. Consequently, the overall express delivery industry has gradually become more stable in the development of various provinces.

4.2. Individual Network Analysis

This study used the degree of centrality, the limit degree of the structural hole, and the effective scale of the structural hole to measure individual network characteristics. The centrality of the central degree indicator shows the importance of the node in the network. The larger the value, the higher the importance of the node in the network. The structural hole’s limitation and effective scale indicators reflect the node’s control ability in the individual network. The smaller the limit degree of the node, the larger the effective scale. The node has the larger ability to control other nodes in the network. We selected from the characteristics of the related network of provincial express delivery income in 2012, 2016, and 2020 as the year of typical representatives. The specifications are presented in Table 4 and Table 5.
(1) Central degree analysis. This study used the degree centrality as a centrality analysis of each node. The specifications are presented in Table 4. According to Table 4, from the perspective of the degree centrality in 2012, the average center of the province’s degree was 5.81, and the degree centrality of 16 provinces exceeded the average. The nodes with a large degree are Tianjin, Inner Mongolia, Anhui, Fujian, Henan, Sichuan, and Tibet. The distribution is relatively scattered; the smallest nodes are Shanxi, Hunan, Hainan, and Ningxia, which are mainly distributed in inland areas. The most likely reason for the formation of the above pattern is that China’s express industry had just entered a period of rapid development in 2012. The labor intensity and economic growth rate significantly impact the development of the express industry. Provinces with average economic development are highly related to other provinces, which can better drive the coordinated development of other provinces.
From the perspective of the central degree centrality of 2016, the average number of provinces’ degrees was 7.48, and the centrality of 16 provinces exceeded the average. The nodes with a large degree are Hebei, Liaoning, Jiangsu, Anhui, Zhejiang, Hunan, Guangdong, and Gansu. They are predominantly distributed in coastal areas; the node with the smallest degree is Ningxia, northwest of China. The possible reason is that 2016 was the golden year of express delivery. The coverage rate and traffic conditions of express delivery outlets greatly affected the development of the express industry. The degree of correlation between the provinces and other provinces in coastal areas can drive the development of other provinces. From the perspective of the central degree of the number of 2020, the average degree of each province was 14.06, the degree of 20 provinces exceeded the average value, and the provinces in the Internet were high. The nodes with a large degree are Tianjin, Shanxi, Heilongjiang, Shanghai, Anhui, Henan, and Qinghai: they are mainly in adjacent provinces in the east. The nodes with the smallest degree of degree are Beijing, Hainan, and Xinjiang. It was speculated that the reason is that in the period of express development in 2020, geographical location factors have greatly affected the development of the express delivery industry. The courier income of neighboring provinces can cooperate and develop together, thereby promoting the coordinated development of the express delivery industry. (Beijing is affected by the adjustment of urban functions and the transfer of industrial investment. Therefore, the data for this year is exceptional and not representative).
Generally, Zhejiang, Shanghai, Jiangsu, and Guangdong provinces are located in the eastern coastal areas and have relatively complete transportation infrastructure. The growth rate and market share of courier income are high (13.7, 11, and 11.3). The degree of correlation with other provinces is also relatively high, which can drive the development of the express industry in other provinces. Hainan, Yunnan, Ningxia, and Xinjiang are located in the western region and have relatively backward economic development. Express revenue and market share are not high. The average degree of nodes in the three years is relatively low (0.3, 3.0, 0.3, and 2.3). The degree of correlation with other provinces is also relatively low, and more connections with other provinces need to be established.
(2) Structural hole analysis. This study used the limited degree and effective scale indicators to analyze the structure hole of each node. According to Table 5, in the provincial express delivery income space-related network in 2012, 2016, and 2020, Tianjin, Shanghai, Jiangsu, Anhui, Zhejiang, and Guangdong have always had a lower limit degree and greater effective scale, indicating that these six provinces occupy many structural holes in the network, are in the advantages of the network, and can control the connection with other provinces in the network. Compared with other provincial nodes, the six provinces’ nodes are in the information center of the network, which can drive the development of other provinces’ express delivery industry. Simultaneously, nodes in Tibet, Ningxia, and Xinjiang have presented a high degree of limit and lower effective scale in the network, indicating that these three provinces are at the edge of the network, less connected to other provinces, and have control capabilities for core resources. They need to strengthen the connection with the core provinces in the express network.
Generally speaking, China’s information technology level has been continuously enhanced, transportation infrastructure has been continuously improved, and provinces have gradually increased their investment in the infrastructure and human capital of the express delivery industry, prompting the effective scale of node provinces in the provincial express delivery income connection network in China. The express delivery industry in various provinces has been better developed, and the network courier income connection network in China has become increasingly gathering.

4.3. Cohesive Subgroup Analysis

The CONCOR algorithm in UCINET software was used to analyze the cohesive subgroup of the express income association network to classify the association network and further explore the closeness of the express income. When performing cohesive subgroup division, the maximum segmentation depth was taken as two, and the convergence criterion was 0.2. After cluster analysis of the association network, it was found that the annual network could be divided into four cohesive subgroups, and the order of subgroup density from high to low was the first to fourth subgroup. In considering the limitation of the length of the article, 2012, 2016, and 2020 were still selected as typically representative years to display the provincial nodes within each subgroup in the associated network, as shown in Table 6.
When combining Table 6 and Figure 1 above, it can be seen that in terms of the internal nodes of each cohesive subgroup, most of the internal nodes of the cohesive subgroup in 2012 were geographically adjacent provinces, and the number of internal nodes in each subgroup was similar. In 2016, the internal nodes of the subgroup were provinces with similar economic and human resource levels, and the number of internal nodes in each subgroup varied greatly. Provinces with great economic strength and rich human resources have the most provincial nodes in the cohesive subgroup, and in 2020, there were more nodes in the subgroup. It is a province with a similar express delivery growth rate, and the gap in the number of nodes within each subgroup was further widened compared to 2016. In addition, from the perspective of subgroup density indicators, in the beginning, the subgroups with higher density were provinces with higher economic strength and geographical location, and they had a strong ability to affect other provinces. Inter-regional information exchange breaks geographical restrictions and is frequent, the degree of agglomeration increases, and the subgroup with the higher density is a collection of provinces with similar development growth rates. In general, the degree of correlation between express delivery income among provinces is increasing, and the number of internal nodes in subgroups with higher economic strength and express delivery industry development levels is also increasing.

5. Empirical Results and Analysis

5.1. Examination of Express Income Space Correlation Test

According to Formula (9), the Moran index can obtain the annual courier income. The specific calculation results are shown in Table 7. The value of Moran’s I of the provincial express revenue in China from 2012 to 2020 was significantly positive at a level of 1%, and the index value was about 0.3, indicating that the distribution of express delivery income in each province is not random, with space correlation. There is obvious positive dependence under the condition of similar information levels: that is, the space overflow effect of information distance attenuation. Simultaneously, the global Moran index of China’s provincial express revenue in 2012–2020 also exhibited an increasing trend, indicating that the positive correlation of the provincial express delivery income space has increased.

5.2. Analysis of Empirical Results

Before the return analysis of the space Durbin model, the space measurement model was to be tested to ensure the rationality and scientificity of the selection of panel models. We chose the following from a certain method for fixed and random effects—SEM, SAR, and SDM panel models. First, we used the Hausman test to distinguish the fixed effects and the random effect; second, the LM tested and stabilized the space interaction effect and error item interactive effect on the determined panel model and obtained the four tests of the panel model. LM test motivation was used to make preliminary choices for SDM, SAR, and SEM models. Third, if the LM space lags, LM space errors, stable LM space lag, and stable LM space errors are rejected, the SDM model is determined. However, if the four values are not rejected, we would use Wald and LR tests. Fourth, the Wald and LR test can be tested whether the SDM model can be degraded into SEM or SAR models and is used to accurately choose SDM, SAR, and SEM models. The specific inspection is presented in Table 8 below. Through the above analysis, this study used a fixed effect SDM model to study the relationship between network structure parameters and provincial express income. Simultaneously, we returned to the analysis of express income from various provinces from the three Durbin models of space-fixed, time-fixed, and time-space. The absolute value of R2 and Log-likelihood of Durbin models fixed in time is the largest; hence, the following analysis of the results of fixed SDM models will be analyzed.

5.2.1. The Causal Relationship between Human Capital Input and Express Income

Based on Model 10, this study tests the regression model of the express delivery industry’s human capital investment (PES) as an independent variable and the industrial structure (PTI), urbanization level (PUP), and communication level (PC) as control variables for express delivery income. The results of the measurements are shown in Column (1a) of Table 9.
The Observation column (Column 1a) shows that the PES coefficient value is 0.394 and is highly significant. The R2 at the bottom of the table is 0.913, indicating that the explanation of the express delivery income of the express delivery industry is very high and has a positive impact. Simultaneously, the spatial spillover effect test of PES is also highly significant, and the coefficient value is positive, indicating that the increase in human capital investment can promote the growth of express delivery income in the province while increasing the express delivery income of neighboring provinces. In areas with abundant human capital, express delivery companies experience fewer labor shortages, and this ensures that the delivery capacity of the express delivery industry is sufficient during periods with a high demand for express delivery, such as the “Double Eleven” shopping festival, which can improve the quality and efficiency of express delivery services. However, express delivery companies that have more high-quality talent can obtain a greater output with fewer inputs, maintain their competitive advantages, and are thus able to promote the development of the express delivery industry. Simultaneously, for neighboring areas, the province’s rich human capital can also drive labor mobility and talent exchanges with neighboring areas and promote the development of the express delivery industry in neighboring provinces.
Furthermore, the three control variables in the model have a certain impact on express revenue. The direct effect of PTI and PUP on express income is positive at the 1% significance level, while the spatial spillover effect is significantly negative. This indicates that the optimization of industrial structure and urbanization level improvement can promote an increase in the province’s express income but has a dampening effect on the express revenue of neighboring provinces. A possible reason for this is that the industrial structure adjustment can promote rationalization, which promotes the efficiency of the express delivery industry in this province, but it has a crowding-out effect on the express delivery industry in neighboring provinces. The improvement in the urbanization level can promote the continuous spread of the express delivery industry in the province to the surrounding areas, expand the scope of services, and increase the demand for express delivery services. However, competition with neighboring provinces has resulted in express delivery services impacting neighboring provinces. Additionally, PC has a positive direct and spatial spillover effect on express delivery revenue, which is significant at the 1% level. This shows that an improvement in the communication level can promote the development of the express delivery industry in this province and its neighbors. Communication technology is the core of the express delivery industry. The improvement of its technical level can promote the efficiency of information exchange in the province’s express delivery industry on the one hand, while it can also drive the improvement of the technological level of neighboring provinces with the flow of talent on the other.

5.2.2. The Moderating Relationship between Network Structure Parameters and Express Revenue

In order to verify whether the network structure parameters of China’s provincial express income spatial correlation network have a moderating effect on express delivery output, this study constructs a moderating effect model based on spatial Durbin for testing. The measurement results based on models 11–12 are shown in Table 9. The network structure parameters were divided into three columns: degree centrality (PDC), limit degree (LS), and effective scale (ES).
Column (1) shows the results with Degree Centrality (PDC) as the moderator variable. Among them, Column (1a) is, on the one hand, the result of the regression test of human capital investment on express delivery income, and it is also the basis for the test of all moderator variables on the other. This has been introduced above and is not repeated here. Column (1b) is based on Column (1a) and adds the central degree (PDC) of the associated network as the regression analysis of the regulatory variable. The test coefficient is not significant. Based on Column (1c) and Column (1b), we added the product of the Express Industry Human Capital Investment (PES) and the Meritability (PDC) product as interactive items. (1a) The R2 is even larger, indicating a regulatory effect between the courier income and the degree of centrality. In combination with the main effect, the centrality of the degree as a regulatory variable has a positive adjustment effect, and the centrality of the number enhances the positive impact of the courier’s human capital investment on the courier’s income. The greater the centrality of provincial nodes, the more technical capabilities and information resources can be obtained from outside of the network, and the more it can promote the improvement of employees’ technical level in the express industry. Thus, human capital investment’s impact on income in the express industry is enhanced.
Similarly, Columns (2a), (2b), (3a), and (3b) are the test results of the adjustment effect as the limit (LS) and the effective scale (ES) (omitted the public Column(1a)). Column (2a) is based on Column (1a). The limit degree of the network is added as the regression analysis of the regulatory variable. The express delivery industry input (PES) and limit (LS) are added as interactive items based on Column (2a). It shows that the impact of human capital investment in the express industry on courier income is related to the limit of the network. In considering the results of the public Column (1a), the restriction system has a negative adjustment effect as a regulating variable, which inhibits the positive impact of the courier industry’s human capital investment on the courier income. Column (3a) is the effective scale (ES) of the related network (ES) based on Column (1a) for regulating variables, and its coefficient is not significant. After the interactive express delivery industry’s human capital investment (PES) and effective scale (ES) are added to Column (3b), the model R2 becomes larger, the coefficient of the interaction item is 0.203, and it is significant at 10%. Therefore, Columns (1a), (3a), and (3b) reveal that the effective scale as a regulating variable has a positive adjustment effect; that is, the effective scale of the effective scale has strengthened the positive impact of the courier’s human capital investment on the express delivery. The stronger the ability to use structural holes in provincial nodes, the more they can use their location advantages to obtain more internal network resources, thereby increasing the attractiveness of funds and talent in the region and promoting human capital investment’s impact on revenue in the express industry.
Therefore, according to the test results of Table 7, it can be seen that the degree, limit, and effective scale of related networks have a regulatory effect on express delivery. The network structure parameter has adjusted the degree of fit between production factors and internal needs of industrial development such that the input elements can better play their efficiency.

5.3. Stability Analysis and Inspection

The analysis of the results of the network structure parameter adjustment effect reveals that different network structure parameters have regulating effects on express income. To further test the adjustment effect of network structure parameters on the output of express delivery, we replaced the number of couriers with the variable in the model, and other variables in the model remain unchanged to test the adjustment effect of network structure parameters. Among them, the number of courier data was derived from China’s Statistical Yearbook. The specifications are presented in Table 10 below.
According to Table 10, the test results of the regulating effect are divided into three columns. Column (1) shows the test degree centrality (PDC) regulating effect. Column (2) shows the limit degree (LS) adjustment effect, and Column (3) shows the effective scale (ES) adjustment effect. Among them, Column (1a) shows an inspection of the regression model of the courier in the courier industry’s human capital (PES). The factor is 0.513 and is very high. It is the basis for testing all network structure parameters. It is also a public column. According to the results in Column (1), the interactive item coefficient of the human capital investment and degree of human capital investment and degree of the courier industry is positive at a significant level of 1%, and the degree of interpretation of the interactive item is higher. A regulatory effect exists between the centrality and the number of express delivery, which is a positive adjustment. Likewise, according to the results in Columns (2) and (3), the discovery limit, effective scale, and the number of couriers have the adjustment effect, which is a negative and positive adjustment, respectively.
In summary, the results after the replacement due to variables are consistent with the above analysis results; that is, the results are stable. Additionally, the analysis of stable results shows that network structure parameters exhibit a regulatory effect on express delivery; that is, network structure parameters significantly influence the growth of the express industry.

6. Conclusions and Discussion

Based on China’s provincial courier revenue data and economic geography theory, this study used social network analysis methods to establish a network structure model and studied the space-related network characteristics of express delivery income in China, revealing its inherent evolution law. Simultaneously, adopting the pace Durbin model to test the adjustment effect between network structure parameters and express income in China’s provincial express delivery income. The conclusions are as follows.
First, the network structure and evolution reveal that the network of express delivery income from China has demonstrated the law of alienation-gathering. With the increase in information technology and human capital investment, the cooperation and exchanges of the express delivery industry in various provinces have increased, and the connection is growing closer. The development of the industry is becoming increasingly stable.
Second, the network structure parameter analysis indicates that the maximum average path length of the space-related network is 2.581, less than 3, and the maximum diameter is 7, which has the characteristics of the “small world” network. At the same time, Zhejiang, Shanghai, Jiangsu, and Guangdong provinces in the eastern coastal areas have a high degree of centrality, large effective scale, and small limit degree. It indicates that these provinces are more important and controlled in the network, driving the growth of the express industry in other provinces. Ningxia and Xinjiang are located in the western provinces. The average degree of centrality and effective scale of the three-year nodes are relatively low, and the degree of correlation with other provinces is relatively low. It is on the edge of the network and needs to establish greater connections with other provinces. Furthermore, this study analyzes the cohesive subgroups of the association network. It finds that the network has formed four cohesive subgroups, showing a clustering pattern that changes from adjacent to express development with similar growth rates.
Third, the measurement analysis of courier income shows that human capital investment significantly contributes to express income, indicating that human factors have a great influence on the express industry’s growth. Simultaneously, a regulatory effect exists between network structure parameters and courier income, indicating that network structure parameters can affect express income through influencing factors. Among them, the centrality and effective scale of the degree can strengthen the positive impact of the courier industry’s human capital investment on the courier income; the limit of the degree has weakened the positive effect of the courier industry’s human capital investment on the courier income.
In considering these conclusions, the following suggestions are put forward. First, increase human capital investment in the express delivery industry to promote further development of this business. All provinces should improve express delivery employees’ professional level, increase investment in express delivery employees’ education, introduce advanced technology platforms, and focus on professional skills training. Second, cooperation and exchanges in various provinces’ express delivery businesses should be promoted, and the degree of correlation between the express delivery industries in various provinces should increase. All provinces need to improve transportation construction connected with neighboring provinces to reduce the cost of the express delivery business in each province. Third, regional coordinated development of the express delivery industry must be promoted, and the sustainable development of the express delivery industry should also be promoted. Provinces in the eastern coastal areas with a high degree of connection in the network can give full play to the “learning effect”, a practical export experience to the central and western regions and promote other provinces’ development. The central and western regions consider their own developmental advantages and formulate feasible policies to promote the express delivery industry’s local development.
However, this study has some limitations. First, owing to scant data on the public’s income of Chinese express enterprises, we studied the development of the express delivery industry by analyzing the provincial express delivery income and factors affecting the development of the express industry from the perspective of the enterprise. Second, this study used three network structure parameters to test the relationship between the network structure and its industrial output. The indicators are not sufficient in number and depth. For future research, we intend to study the relevant network conditions of express enterprises and explore the characteristics and evolution laws of the related network of courier companies. Simultaneously, more network parameters were introduced to explore network structure and performance further.

Author Contributions

G.W.: Conceptualization, Verification, Write comments and edit. J.Y.: Prepare the first draft, Data curation. F.X.: Data collection, Formal analysis, Project funding. All authors have read and agreed to the published version of the manuscript.

Funding

This research was supported by the Humanities and Social Sciences Research Planning Fund of the Ministry of Education with project number 18YJA790075 and the title “Analysis of Spatial Topology Network of Monopolistic Enterprises and Research on Network Paths”.

Institutional Review Board Statement

Not applicable.

Informed Consent Statement

Not applicable.

Data Availability Statement

Monthly data of express delivery revenue of 31 provinces in the Chinese Mainland, which is taken from the Monthly Postal Industry Operation Report published by the State Postal Administration, website: (https://www.spb.gov.cn/gjyzj/c100276/common_list.shtml, disposed on 20 March 2021). Other data are largely from China’s Statistical Yearbook website: (https://data.stats.gov.cn/easyquery.htm?cn=E0103, disposed on 20 March 2021).

Conflicts of Interest

The authors declare no conflict of interest.

References

  1. Zhao, D.; Wang, Y.H.; Zhang, S.W.; Liang, X. Analysis on development problems and paths of express industry in China. China Mkt. 2021, 25, 50–51. [Google Scholar]
  2. Zhao, Y.Y.; Chen, L.M. Analysis on the contribution of express delivery industry to service industry under the background of “double cycle”. Tim. Econ. Trade 2022, 19, 151–155. [Google Scholar]
  3. Li, M.T.; Mao, C.H. Research on the cooperation benefit effect of coupling between express industry and manufacturing industry in China. J. Commer. Econ. 2022, 4, 181–184. [Google Scholar]
  4. Yang, X.Y.; Lin, T.S. Differences of express service in Henan Province. Transp. Res. 2020, 6, 116–126. [Google Scholar]
  5. Li, M.G. Efficiency evaluation and Influencing factors analysis of provincial Express delivery industry: Based on DEA-ToBIT model. Logist. Sci. Technol. 2019, 2, 81–85, 95. [Google Scholar]
  6. Yang, M.M. An empirical analysis of the impact of express delivery industry on China’s domestic trade. Contemp. Econ. 2018, 12, 18–19. [Google Scholar]
  7. Li, L.L.; Su, Y.S.; Liu, J. Spatialization of Social Networks: A Case Study of Social geographic Networks in Shenzhen Media Industry. Hum. Geogr. 2013, 28, 34–40. [Google Scholar]
  8. Chen, L.X. The Characteristics of Global production Service Trade Network and its Impact on the Division of Labor in Global Value Chain: A social network analysis perspective. Int. Bus. 2017, 04, 60–72. [Google Scholar]
  9. Wang, Z.S.; Zhou, Y.X.; Zhao, N. Spatial Correlation Network and Driving Effect of Carbon Emission Intensity in China’s Construction Industry. Buildings 2022, 12, 201. [Google Scholar] [CrossRef]
  10. Li, J.; Tian, W.; Xiao, L.I. Spatial correlation and influencing factors of agricultural investment growth in China. Stat. Decis. 2020, 36, 59–63. [Google Scholar]
  11. Wang, Y.Y.; Sun, Z.W.; Feng, Y. Spatial pattern and influencing factors of express business volume in China. Logist. Technol. 2017, 36, 10–14. [Google Scholar]
  12. Guo, M.D.; Li, H. Spatial econometric analysis of influencing factors of China’s express industry. Packag. Eng. 2019, 40, 196–202. [Google Scholar]
  13. Wang, L.Z.; Yao, S.Y.; Jia, Y.R. Analysis of factors influencing the development scale of express industry based on panel data. China Econ. Trade Her. 2020, 6, 34–36. [Google Scholar]
  14. Liao, Y.J.; Li, P.; Huang, W. Research on the Impact of GNI on Express Delivery Volume in China. J. Econ. Pub. Fin. 2020, 6, 3. [Google Scholar]
  15. Li, Y.M.; Xi, Q.Q.; Wu, Y.C. Research on spatial-temporal characteristics of agglomeration and development of express industry in China. J. Ind. Technol. Econ. 2017, 36, 99–105. [Google Scholar]
  16. Zhang, J.Y.; Lan, H.J. Analysis of factors influencing the differentiated development of urban express industry—A case study of Shandong province. Logist. Eng. Manag. 2021, 43, 1–5. [Google Scholar]
  17. Song, F.; Wang, L.H. Research on influencing factors of express industry in shandong province based on grey correlation analysis. Logist. Sci. Technol. 2015, 38, 56–59. [Google Scholar]
  18. Huang, F. Analysis on influencing factors of the development of China’s express industry based on B2C model. China Collect. Econ. 2016, 22, 16–17. [Google Scholar]
  19. Li, Y.J.; Wu, Q.T.; Zhang, Y.L.; Wu, K.M.; Zhang, H.G.; Jin, S.Q. Research on Spatial Structure and Formation Mechanism of E-commerce Express logistics network in Three urban agglomerations of China. Sci. Geogr. Sin. 2021, 41, 1398–1408. [Google Scholar]
  20. Ji, Y.J.; Zhang, Y.Y. Spatial correlation network and new mechanism of regional coordinated development for manufacturing upgrading in China. J. Shandong Univ. Technol. Soc. Sci. Ed. 2020, 36, 5–14. [Google Scholar]
  21. Wouter, J.C.; Cesar, D.; Peter, D.L. Integrating World Cities into Production Networks: Global Networks. Commod. Chains World Cities 2010, 10, 92–113. [Google Scholar]
  22. Tang, C.H.; Ma, X.G. Spatial Pattern and Structure of urban Networked logistics connections in China: Based on the data of express outlets. Prog. Geog. 2020, 39, 1809–1821. [Google Scholar] [CrossRef]
  23. Zhou, J.P.; Liu, C.J.; Xu, W.X. Logistics Network Structure and Self-organization Effect of Express Delivery Enterprises in the context of E-commerce: A Case study of ZTO Express. Econ. Geog. 2021, 41, 103–112. [Google Scholar]
  24. Li, J.; Wang, Z.Z. Network structure and proximity mechanism of Yangtze River Delta urban Agglomeration: Based on the perspective of express industry connection. Areal Res. Dev. 2021, 40, 58–63. [Google Scholar]
  25. Liu, G.W. Measurement and path Analysis of the impact of logistics technology innovation on the logistics industry: Based on the inter-provincial spatial Durbin panel data model from 2000 to 2015. China Bus. Mkt. 2018, 32, 38–46. [Google Scholar]
  26. Zhong, C.B.; Zhu, Z.H. The Influence of Provincial Social Capital on Logistics industry Agglomeration in the Yangtze River Economic Belt: An empirical analysis based on Spatial Durbin model. J. Changzhou Univ. Soc. Sci. Ed. 2019, 20, 44–53. [Google Scholar]
  27. Li, Z.Q.; Zhou, Q.Y.; Wang, Y. Impact of industrial policies on logistics industry agglomeration in the Yangtze River Economic Belt: An Empirical analysis based on spatial Durbin Model and Panel threshold Model. J. ShaoYang Univ. Nat. Sci. 2022, 19, 82–88. [Google Scholar]
  28. Wei, L.H.; Yang, X.B.; Gao, X.J. Does fiscal capacity affect the provision of public services?—Spatial test based on fiscal decentralization and urbanization regulation. Inq. Econ. Issues 2020, 12, 16–31. [Google Scholar]
  29. Yu, B.B.; Su, Y.M. How does land finance affect land use efficiency? Dynamic spatial Durbin model test from the perspective of scale and technology. Geog. Res. 2022, 41, 527–545. [Google Scholar]
  30. Wang, D.F.; Dong, Q.L. Spatial Structure Evolution and Influencing factors of urban logistics development in China. J. Beijing JiaoTong Univ. Soc. Sci. Ed. 2019, 18, 125–139. [Google Scholar]
  31. Sun, C.X.; Pei, X.Z.; Liu, C.J. Spatial network characteristics and driving mechanism of urban logistics innovation in China. Geog. Res. 2021, 40, 1354–1371. [Google Scholar]
  32. Li, M. The evolution and influence mechanism of industrial association network: Based on the analysis of 12 annual input-output tables in Beijing. Ind. Econ. Rev. 2016, 7, 50–66. [Google Scholar]
  33. Ren, H.M.; Ye, M.Q. Network structure characteristics and spatial pattern evolution of banking industry in Shanghai. Econ. Geogr. 2018, 38, 147–157. [Google Scholar]
  34. He, X.Y.; Zhang, M.Z. Research on the influence of cross-regional innovation cooperation network construction on innovation performance: A case study of Yangtze River Delta. Innov. Sci. Technol. 2021, 21, 42–51. [Google Scholar]
Figure 1. Spatial association network of China’s provincial express revenue in 2012, 2016 and 2020.
Sustainability 15 00276 g001
Figure 2. Movement trend of different parameters of the overall network of the express delivery industry from 2012 to 2020.
Sustainability 15 00276 g002
Table 1. Threshold and the Corresponding Maximum Number of Connected Subgraph Nodes.
Threshold
Value
0.9740.9760.9780.9800.9820.9840.9860.988
Year
20122727272727272723
20163030303030303025
20202828282727252424
Table 2. Description of Variables.
Variable NameSymbolMeaning and UnitExpected Symbol
Human capital investment in express delivery industryPSEPostal workers (persons)+
Point degree center degreePDCThe number of provinces directly linked to it+
Limit systemLSThe ability to use structural holes
Effective sizeESThe non-redundant factor of the structural hole+
industrial structurePTITertiary industry output/GDP+
Level of urbanizationPUPUrban population/total population+
Communication levelPCNumber of telephones and mobile phones per 100 inhabitants+
Table 3. Descriptive Statistics for Variables.
VariablesMean ValueSDMinMax
EI4.12080.43382.60515.7388
PSE4.33040.15092.92385.2228
PDC8.867434.35290.000022.0000
LS0.47920.08550.16601.1250
ES0.41580.07580.00000.9377
PTI1.67470.00631.49051.9238
PUP1.75800.00961.35931.9523
PC2.06030.00941.85552.3581
Table 4. Degree Centrality Analysis of Express Revenue Related Network.
Province201220162020Average of Three-Year Values
Beijing4 (19)6 (18)0 (29)3.3
Tianjin13 (1)11 (9)22 (1)15.3
Hebei4 (19)14 (1)20 (8)12.7
Shanxi0 (28)5 (21)21 (2)8.7
Inner Mongolia11 (4)5 (21)19 (13)11.7
Liaoning8 (10)12 (5)15 (19)11.7
Jilin9 (8)11 (9)20 (8)13.3
Heilongjiang3 (21)10 (12)21 (2)11.3
Shanghai6 (15)10 (12)21 (2)12.3
Jiangsu9 (8)13 (3)19 (13)13.7
Zhejiang1 (25)12 (5)20 (8)11.0
Anhui10 (6)13 (3)21 (2)14.7
Fujian10 (6)2 (24)19 (13)10.3
Jiangxi8 (10)7 (17)18 (16)11.0
Shandong8 (10)1 (27)20 (8)9.7
Henan12 (3)1 (27)21 (2)11.3
Hubei2 (23)9 (15)16 (18)9.0
Hunan0 (28)12 (5)18 (16)10.0
Guangdong8 (10)14 (1)12 (21)11.3
Guangxi5 (17)8 (16)12 (21)8.3
Hainan0 (28)1 (27)0 (29)0.3
Chongqing1 (25)6 (18)5 (25)4.0
Sichuan11 (4)11 (9)6 (24)9.3
Guizhou3 (21)6 (18)20 (8)9.7
Yunnan1 (25)5 (21)3 (26)3.0
Tibet13 (1)2 (24)1 (27)5.3
Shaanxi2 (23)10 (12)15 (19)9.0
Gansu6 (15)12 (5)9 (23)9.0
Qinghai7 (14)1 (27)21 (2)9.7
Ningxia0 (28)0 (31)1 (27)0.3
Xinjiang5 (17)2 (24)0 (29)2.3
The average5.817.4814.069.1
Table 5. Analysis of Relevant Indicators of Structural Holes in Express Revenue Related Network.
Province201220162020
Limit SystemEfficient ScaleLimit SystemEfficient ScaleLimit SystemEfficient Scale
Beijing0.5883.0060.4931.0271.0001.000
Tianjin0.2626.1760.3014.0420.1665.280
Hebei0.6481.0190.2456.5050.1813.679
Shanxi1.0001.0000.5282.6800.1735.190
Inner Mongolia0.2965.6960.5511.6840.1895.283
Liaoning0.3843.2480.2804.2750.2343.196
Jilin0.3543.2340.3014.5320.1813.769
Heilongjiang0.7661.0130.3272.6820.1744.559
Shanghai0.4802.4530.3223.9330.1744.204
Jiangsu0.3533.4320.2624.7600.1903.211
Zhejiang1.1251.0000.2804.2670.1813.592
Anhui0.3243.7550.2615.1840.1744.205
Fujian0.3273.9410.8401.6720.1903.798
Jiangxi0.3941.6970.4342.0180.1993.095
Shandong0.3941.6971.1231.0060.1813.681
Henan0.2805.1851.1251.0010.1744.205
Hubei0.8401.6700.3503.6180.2203.426
Hunan1.0001.0000.2815.0340.1992.368
Guangdong0.3833.4670.2456.2380.2841.531
Guangxi0.5452.0200.3922.1500.2841.841
Hainan1.0001.0001.1231.0051.0001.000
Chongqing1.1221.0070.4931.0180.5372.362
Sichuan0.2975.3580.2985.0320.4673.302
Guizhou0.7052.0070.4693.0180.1813.958
Yunnan1.1221.0070.5432.3450.7052.012
Tibet0.2605.7560.9261.0101.1231.005
Shaanxi0.9251.0090.3263.9390.2333.558
Gansu0.4822.1660.2815.0330.3592.037
Qinghai0.4233.2721.1241.0020.1735.183
Ningxia1.0001.0001.0001.0001.1211.010
Xinjiang0.5511.6840.8401.6701.0001.000
Table 6. Distribution table of condensed subgroups of China’s provincial express revenue correlation network.
Category201220162020
First subgroupBeijing, Shanghai, Gansu, Sichuan, Inner Mongolia, Xinjiang, HeilongjiangBeijing, Tianjin, Hebei, Guangdong, Guangxi, Liaoning, Jiangsu, Heilongjiang, Shanghai, Zhejiang, Anhui, ShandongBeijing, Xinjiang, Yunnan, Xizang, Hainan
Second subgroupShanxi, Hunan, Chongqing, Zhejiang, Ningxia, Yunnan, Hubei, HainanQinghai, Sichuan, Guizhou, Xizang, YunnanSichuan, Chongqing, Ningxia
Third subgroupAnhui, Jiangxi, Hebei, Xizang, Tianjin, Fujian, Qinghai, Henan, ShandongJilin, Gansu, Inner Mongolia, Hubei, Chongqing, Shanxi, Shaanxi, Hunan, JiangxiGuangxi, Hebei, Guangdong, Tianjin, Fujian, Jiangxi, Anhui, Shanghai, Henan, Hunan, Zhejiang, Heilongjiang, Liaoning, Jiangsu, Shandong
Fourth subgroupGuangxi, Jiangsu, Guangdong, Liaoning, Jilin, Shaanxi, GuizhouHainan, Fujian, Henan, Ningxia, XinjiangInner Mongolia, Jilin, Shanxi, Hubei, Gansu, Qinghai, Shaanxi, Guizhou
Table 7. Overall Moran Index of China’s Provincial Express Revenue from 2012 to 2020.
YearMoran’s IZYearMoran’s IZ
20120.267 ***3.77520170.330 ***4.576
20130.315 ***4.35720180.343 ***4.743
20140.309 ***4.28620190.351 ***4.848
20150.324 ***4.47820200.363 ***4.994
20160.331 ***4.576
Note: *** are significant at 10%, 5% and 1% statistical levels, respectively.
Table 8. Hausman, LM, LR and Wald Tests of Spatial Econometric Models.
Inspection MethodsStatistical Magnitudep ValueAnalysis of Inspection Results
Hausman test51.160.000Reject the null hypothesis and choose the fixed effect model
LM space lag test43.04130.000In addition to the robust LM space lag test, the null hypothesis was rejected, and SDM was considered.
Rejecting the null hypothesis, SDM cannot degrade SEM or SAR
analysis of inspection results
LM space error test15.77210.000
Robust LM space lag test28.76930.000
Robust LM space error test1.50010.221
LR space lag test122.05520.000Reject the null hypothesis and choose the fixed effect model
In addition to the robust LM space lag test, the null hypothesis was rejected, and SDM was considered.
LR space error test145.23660.000
Wald spatial lag test146.78970.000Rejecting the null hypothesis, SDM cannot degrade SEM or SAR
Wald spatial error test148.50160.000
Table 9. Regression Results for the Spatial Durbin Model.
VariablesPDC (1)LS (2)ES (3)
Column (1a)Column (1b)Column (1c)Column (2a)Column (2b)Column (3a)Column (3b)
PSE0.3940.3950.2750.3930.5960.3950.335
(5.544) ***(5.581) ***(3.555) ***(5.542) ***(6.303) ***(5.565) ***(4.320) ***
PDC-0.003−0.084----
(1.108)(−3.328) ***
LS---−0.0381.336--
(−0.790)(3.093) ***
ES-----−0.031−0.917
(−0.650)(−1.880) *
PSE * PDC--0.020
(3.385) ***
PSE * LS----−0.323
(−3.159) ***
PSE * ES------0.203
(1.794) *
PTI0.8170.8360.7980.8360.8360.7950.829
(2.946) ***(3.018) ***(2.956) ***(3.008) ***(3.073) ***(2.868) ***(3.013) ***
PUP1.3741.3611.4401.3731.4441.3391.359
(6.166) ***(6.089) ***(6.597) ***(6.163) ***(6.606) ***(5.972) ***(6.110) ***
PC1.2931.2981.2161.2881.1861.3331.268
(5.380) ***(5.378) ***(5.156) ***(5.348) ***(4.997) ***(5.505) ***(5.247) ***
W * PSE1.2231.1910.9861.2091.8131.3061.105
(5.907) ***(5.402) ***(4.166) ***(5.507) ***(5.532) ***(5.977) ***(4.538) ***
W * PDC-−0.002−0.228
(−0.264)(−2.664) ***
W * LS- 0.0373.959
(0.245)(2.488) **
W * ES- −0.162−3.652
(−1.048)(−2.032) **
W * PSE * PDC- 0.050
(2.568) **
W * PSE * LS- −0.905
(−2.446) **
W * PSE * ES- 0.799
(1.930) *
W * PTI−5.685−5.669−5.536−5.696−5.554−5.700−5.454
(−5.571) ***(−5.571) ***(−5.583) ***(−5.589) ***(−5.568) ***(−5.599) ***(−5.381) ***
W * PUP−3.117−3.018−2.598−3.072−2.724−3.327−3.177
(−2.895) ***(−2.780) ***(−2.440) **(−2.851) ***(−2.570) **(−3.050) ***(−2.934) ***
W * PC3.0042.9332.5572.9872.6823.1342.858
(4.048) ***(3.938) ***(3.478) ***(4.028) ***(3.665) ***(4.182) ***(3.804) ***
W * dep.var0.5280.5310.4740.5270.4770.5270.499
(7.004) ***(7.078) ***(5.985) ***(6.983) ***(6.038) ***(6.971) ***(6.444) ***
R20.9130.9130.9180.9130.9170.9130.915
Note: (1) *, **, *** are significant at 10%, 5% and 1% statistical levels, respectively, and (2) figures in parentheses are t statistics of coefficient estimation.
Table 10. Robustness Analysis.
VariablesPDC (1)LS (2)ES (3)
Column (1a)Column (1b)Column (1c)Column (2a)Column (2b)Column (3a)Column (3b)
PSE0.5130.5140.3700.5110.7600.5100.431
(6.263) ***(6.293) ***(4.160) ***(6.255) ***(6.971) ***(6.245) ***(4.819) ***
PDC-0.003−0.102----
(0.997)(−3.514) ***
LS---−0.0211.648--
(−0.366)(3.302) ***
ES-----−0.051−1.262
(−0.907)(−2.242) **
PSE * PDC--0.024----
(3.539) ***
PSE * LS----−0.391-
(−3.313) ***
PSE * ES------0.278
(2.128) **
PTI0.4210.4420.3980.4350.4300.4070.446
(1.326)(1.389)(1.292)(1.366)(1.379)(1.282)(1.414)
PUP1.5711.5661.6711.5711.6581.5471.569
(6.115) ***(6.072) ***(6.667) ***(6.117) ***(6.574) ***(5.988) ***(6.122) ***
PC1.0481.0430.9311.0440.9171.0760.994
(3.790) ***(3.75) ***(3.440) ***(3.764) ***(3.356) ***(3.863) ***(3.575) ***
W * PSE1.2581.2050.9051.2432.1201.3231.099
(5.315) ***(4.768) ***(3.335) ***(4.957) ***(5.598) ***(5.313) ***(3.921) ***
W * PDC-0.001−0.334 --
(0.113)(−3.388) ***
W * LS---0.0265.415
(0.146)(2.946) ***
W * ES-----−0.103−4.647
(−0.58)(−2.244) **
W * PSE * PDC--0.074- --
(3.332) ***
W * PSE * LS----−1.248-
(−2.919) ***
W * PSE * ES------1.040
(2.178) **
W * PTI−4.599−4.579−4.476−4.600−4.490−4.614−4.322
(−3.902) ***(−3.891) ***(−3.925) ***(−3.907) ***(−3.896) ***(−3.926) ***(−3.695) ***
W * PUP−3.218−3.076−2.502−3.192−2.752−3.437−3.263
(−2.585) ***(−2.448) **(−2.039) **(−2.562) **(−2.245) **(−2.729) ***(−2.607) ***
W * PC2.7992.7172.1662.7732.4022.9092.574
(3.322) ***(3.206) ***(2.599) ***(3.293) ***(2.882) ***(3.422) ***(3.009) ***
W * dep.var0.6060.6050.5280.6120.5280.6160.563
(8.93) ***(8.908) ***(7.046) ***(9.117) ***(7.01) ***(9.228) ***(7.826) ***
R20.9190.9190.9240.9190.9230.9200.921
Note: (1) *, **, *** are significant at 10%, 5% and 1% statistical levels respectively; (2) Figures in parentheses are t statistics of coefficient estimation.
Disclaimer/Publisher’s Note: The statements, opinions and data contained in all publications are solely those of the individual author(s) and contributor(s) and not of MDPI and/or the editor(s). MDPI and/or the editor(s) disclaim responsibility for any injury to people or property resulting from any ideas, methods, instructions or products referred to in the content.

