Article

Renewable Energy for Balancing Carbon Emissions and Reducing Carbon Transfer under Global Value Chains: A Way Forward

1
Department of User and Market Research, China Mobile Research Institute, Beijing 100053, China
2
School of International Trade and Economics, University of International Business and Economics, Beijing 100029, China
3
Department of Chemical Engineering, Tsinghua University, Beijing 100084, China
4
School of Economics and Management, Tsinghua University, Beijing 100084, China
*
Author to whom correspondence should be addressed.
Sustainability 2023, 15(1), 234; https://doi.org/10.3390/su15010234
Submission received: 7 November 2022 / Revised: 14 December 2022 / Accepted: 19 December 2022 / Published: 23 December 2022
(This article belongs to the Special Issue Toward Carbon Neutrality: Renewable Energy and Energy Engineering)

Abstract

:
Research on the relationship between a country’s renewable energy consumption and carbon emissions is of great significance for reducing carbon emissions embodied in international trade. There always exists a gap between production-based and consumption-based carbon emissions. Accordingly, this paper investigates the influence of renewable energy consumption on carbon emission balance, the ratio of production-based emissions to consumption-based emissions, in various countries using the ordinary least square (OLS) method and generalized method of moments (GMM) method. We found that a 1% increase in renewable energy consumption can decrease the carbon emission balance by 5.8%. Furthermore, renewable energy consumption can help narrow the gap between production-based and consumption-based carbon emissions in net emission exporters. In addition, renewable energy consumption can also weaken the negative impact of the global value chains (GVCs) division system on the carbon emission balance. The findings in this study fill the research gap by analyzing the heterogeneous impacts of renewable energy consumption on carbon emission balance embodied within a GVC division system in various countries and provide policy suggestions that renewable energy consumption should be encouraged in net emission exporters to reduce the carbon emission transfers.

1. Introduction

Recently, countries around the world have put forward their own carbon emission reduction targets. For example, in September 2020, China set the goal of “carbon peaking” by 2030 and “carbon neutrality” by 2060. In December 2021, the US President Joe Biden signed an executive order requiring the US federal government to become carbon neutral by 2050. European Union countries have also set carbon neutrality targets in law. In short, carbon emission reduction has become an important consensus worldwide.
Thirty percent of the global carbon emissions were embodied in the international trade in 2010 [1]. International trade not only increase the global consumption demand, leading to more carbon emissions, but also confuse the responsibility of carbon emissions by transferring carbon emissions. This causes the trade-off between international trade and carbon emissions to be an important topic to discuss. To distinguish the responsibility of carbon emissions of different countries is the basis of carbon emission reduction.
Many studies have debated who is responsible for the greenhouse gases emitted into the atmosphere. The early research clarifies the responsibility of carbon emissions based on production activities [2,3,4], that is, a country that produces the products and services domestically should assume the full responsibility for carbon emissions [5]. With the deepening of the global production fragmentation, based on global value chains (GVCs), emission balance is closely related to the reallocation of production units and energy use.
However, considering consumption demand is the driving force of production, it is important to consider both production and consumption perspectives to divide responsibility for carbon emissions [6,7]. Therefore, focusing on the gap between production- and consumption-based carbon emissions, carbon emission transfers or carbon leakage within GVCs, as typical phenomenon in the trade field, are widely studied. Carbon emissions are transferred embodied in GVCs mainly for two reasons: Firstly, countries with technological superiority have priority in choosing the production links they participate in. They are more willing to engage in production links with low pollution to realize the environmentally friendly goals, while other countries, mostly developing countries, have to engage in production links with relatively high pollution [5]. Secondly, due to the different intensity of environmental regulations and production cost in countries within GVCs [1,8], carbon-intensive industries are easily absorbed by countries with relatively moderate environmental regulations. These countries are often labeled as “polluted havens” [9]. The carbon emission balance, referring to the consistency of CO2 emissions attributed to production-based and consumption-based accounts [7], became an important indicator to describe and calculate the carbon transfer trend.
Theoretically, energy consumption is a factor causing CO2 emissions and global warming [10]. The high consumption of fossil energy in industries is an important reason for the rise in global carbon emissions [11]. Renewables, including solar, wind, hydro, bio-fuels, and others are increasingly widely used since the renewable energy is much more friendly to the environment and also sufficient for decreasing the transportation cost of gas and oil [12]. As shown in the report of the IEA [13], 6.6% of the final energy consumption in the world was modern renewable energy in 1990 and the share increased to 10.5% in 2017.
To date, based on the sustainable development goals, the effect of renewable energy on the environment has drawn attention from scholars [14,15,16,17,18]. Various scholars have suggested that renewable energy consumption has a significant impact on international trade and the environment with different approaches [19,20,21,22]. Although it is realized that renewable energy might be beneficial for the trade-off between economic development and carbon emission, few scholars systematically investigate and summarize the relationship between renewable energy consumption and carbon emission balance from the perspective of carbon emission transfers.
The main objective of the current study is to investigate: (1) the impact of the renewable energy consumption on carbon emission balance; (2) the national heterogeneity of the impact of renewable energy consumption on the carbon emission balance; and (3) the moderating effect of GVCP in the relationship between the renewable energy consumption and carbon emission balance.
The rest of the paper is organized as follows: Section 2 presents the literature review; Section 3 puts forward the methodology, including the model specification, the measurement of variables, and the data sources. Section 4 describes the empirical results and discussion. The conclusion, implications, and limitations are presented in Section 5.

2. Literature Review

2.1. Carbon Transfer and International Trade

Global production and trade facilitate the transfer of carbon emissions [6]. Developed countries, importing more but exporting less carbon-intensive products, transfer carbon emissions to developing countries [23,24,25]. In fact, the net carbon transfers from developing countries to developed countries through trade is also increasing [4,26]. One obvious feature triggered by carbon transfers is the inconsistency between the carbon emissions calculated based on consumption accounts and emissions based on production accounts, which causes it to be difficult to divide carbon emission responsibility among countries. Early researchers focus on the producers’ responsibilities for carbon emissions [2], but given that demand is the driving factor of production, some scholars hold that consumers should take full responsibility [26,27]. Recent studies suggest that carbon emissions should be shared by producers and consumers [6,7,28].
To describe and calculate the carbon transfer trend, some indicators have been applied including the trade-embodied carbon emissions based on Input-Output tables and carbon emission balance [1,5,29]. The carbon emission balance is a wider index compared with trade-embodied carbon emissions, since trade-embodied carbon emissions only calculate the emissions related to global production while the former treats a country as a whole, with all production and consumption included. Tracking carbon emissions in different countries using multi-regional input-output tables is an important consideration [30,31]. For example, Ma et al. [32] analyze indirect carbon emissions reflected by intermediate inputs and find that, in China, indirect CO2 emissions are much more than direct CO2 emissions.
Actually, the paths of transferring CO2 emissions have gradually shifted from traditional trade to GVC activities [33]. Under the GVCs division system, developed countries, with their technological advantages, transfer carbon-intensive manufacturing units to developing countries. Therefore, developing countries usually dominate global carbon-intensive industries leading to the increase in energy consumption and carbon emissions under production-based accounts [34]. There is also a contrary view that technology spillovers and labor transfer in GVCs contribute to the transfer of environmental and new energy technologies, reduce emissions, and increase the use of renewable energy [8,35,36]. In addition, participation in GVCs also means increased demand for transportation, which are regarded as a major carbon emitting sector of air pollutants [37,38]. Yan et al. [1] find that an economy’s role within its GVCs matters for its emissions embodied in trade, with an extended environmental Heckscher-Ohlin-Vanek model constructed.

2.2. The Impact of Renewable Energy on Carbon Emissions

As recognized by many scholars, renewable energy, compared with fossil energy, has a significant impact on reducing carbon emissions [22,39,40,41,42,43,44,45]. Furthermore, carbon compounds are also the components of syngas, a source of renewable energy for heating and electricity generation [46]. There are also several empirical studies focusing on the negative impact of renewable energy consumption on CO2 emissions [47,48]. Salem et al. [18] using the pooled mean group (PMG) method, find that renewable energy consumption and carbon dioxide emissions have an inverted U-shaped relationship. Furthermore, some scholars investigate the cointegration relationship between renewable energy consumption and CO2 emissions in the short and long run, separately. In the short term, the consumption of renewable energy cannot reduce emissions for being limited by technology to continuous and stable supply [49], but two-way causality between CO2 emissions and renewable energy consumption is proven to exist [40,50]. In the long run, both renewable and non-renewable electricity consumption increases CO2 emissions [51], while the renewable electricity production reduces CO2 emissions both in the short and long term [52]. Furthermore, there are also studies focusing on the impact of different kinds of renewable energy on carbon emissions, such as combustible renewable energy, renewable electricity from waste, and hydroelectric power, that have negative long-run effect on CO2 emissions [39].
As carbon emission transfers and carbon emission responsibility are becoming a topic in the environment and trade fields, scholars investigate the impact of renewable energy consumption on carbon emission balance, calculated by production-based emissions and consumption-based emissions [7]. The use and export of renewable energy reduced consumption-based carbon emissions [53]. Furthermore, there also exists a positive long-run relationship between carbon trade balances and carbon emissions for high-income countries [7].

2.3. The Literature Gaps

Based on the above literature reviewed in Section 2.1 and Section 2.2, renewable energy consumption is beneficial for reducing the amount of carbon emissions. However, the effect of renewable energy consumption on the carbon emission balance, as a typical feature of environmental issues in international trade, is worth considering and has not been reached. Furthermore, analyzing the heterogeneous impacts of renewable energy consumption on the carbon emission balance is quite conducive to developing an efficient policy system for cross-border carbon trade, but there are few studies considering the different influences of renewable energy consumption on carbon emission balances in various countries. In addition, although GVCs division system leads to carbon emission transfers in international trade, few researchers focus on the impact of renewable energy consumption on the balance of carbon emissions in countries with different GVC positions.

3. Methodology and Data

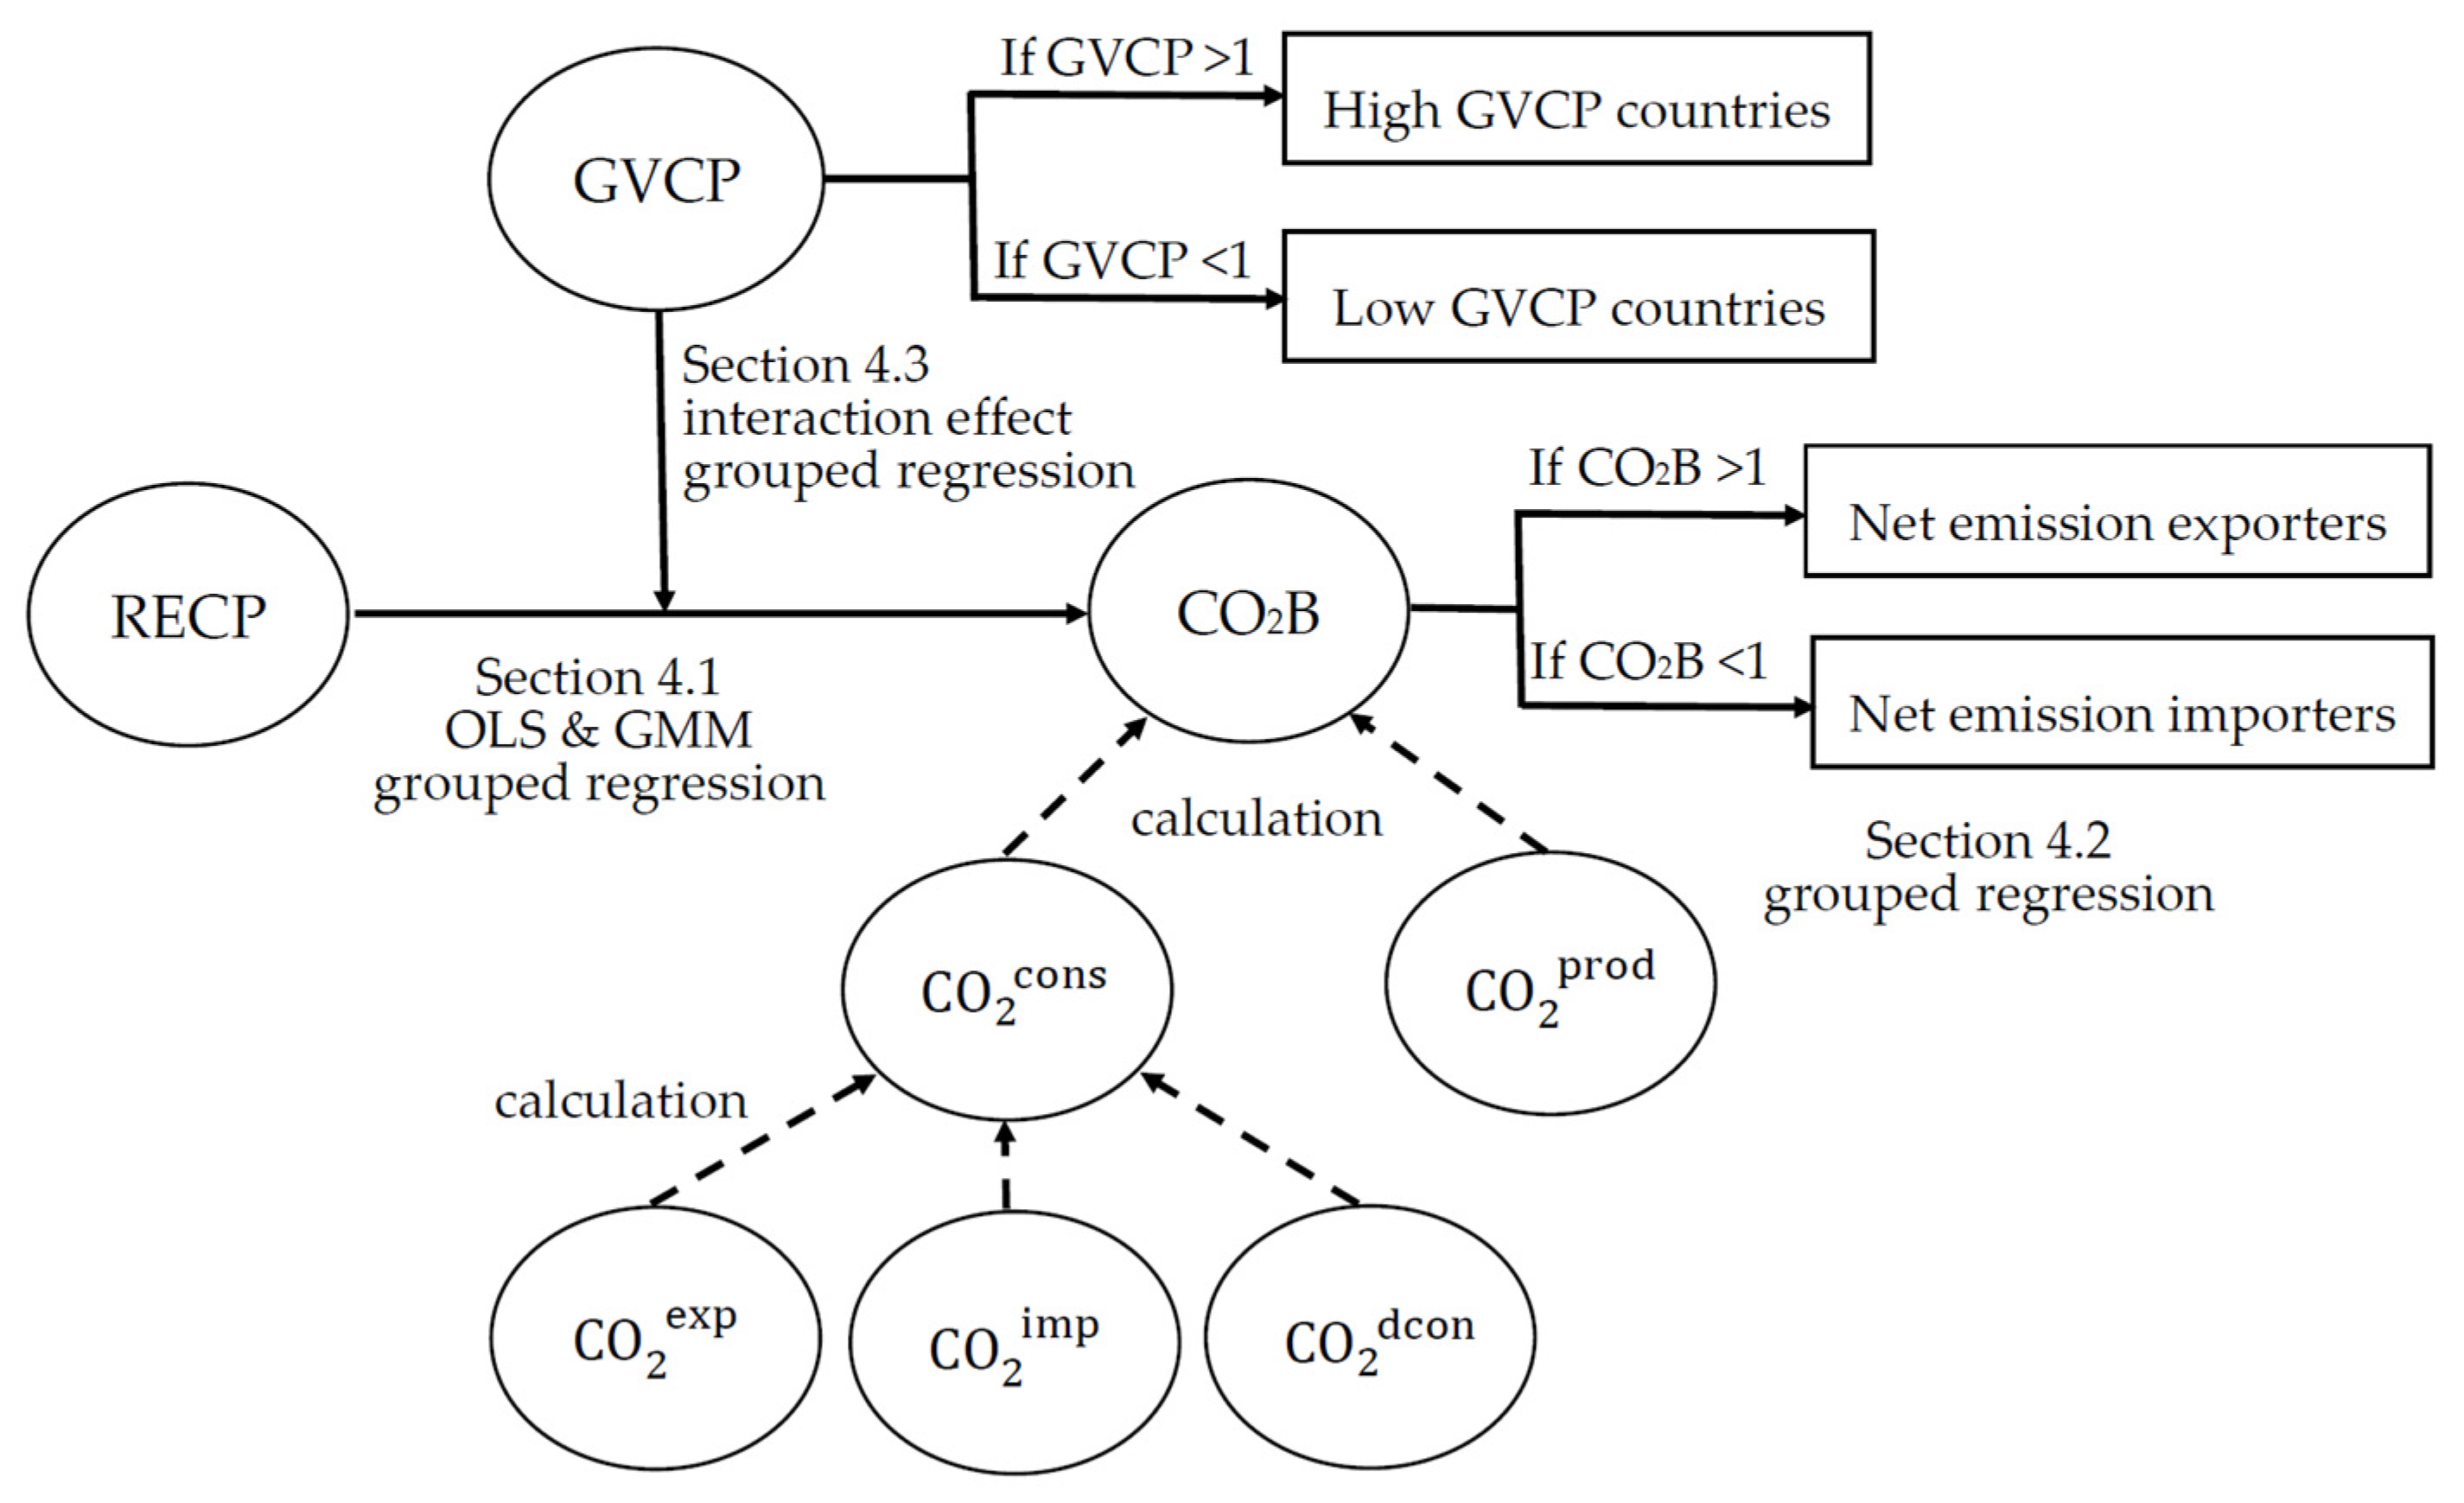
3.1. Model Specification

Based on the classic Impact of Population, Affluence, and Technology (IPAT) model first proposed by Ehrlich and Holdren [54], which has usually been adapted to measure the relationship between human activities and the environment, Dietz and Rosa [55] constructed the STIRPAT model to solve the unified elasticity problem [56]. Based on Dietz and Rosa [55]‘s model and according to the study of Yang and Liu [57], we further investigate the impact of renewable energy consumption on the carbon emission balance by adding GVC Position, renewable energy consumption, and the related variables. In order to obtain more consistent and efficient results, we construct a log-transformed econometric model to help remove autocorrelation and heteroscedasticity issues from the data [12]. The econometric model is constructed as follows:
LnCO 2 B it = α 0 + α 1 LnRECP it + α 2 LnGVCP it + k = 3 5 α k LnX it + μ i + γ t + ε it
where i denotes the country and t refers to the year. α 0 indicates the intercept term while α i refers to the estimated coefficients. CO 2 B it is the carbon emission balance of country i in year t; GVCP it represents country i’s position within GVCs in year t; RECP it represents renewable energy consumption penetration; X refers to the control variables, mainly including population intensity, real GDP at constant national price, and technology efficiency; μ i and γ t captures country and year-fixed effects; ε it is an error term which is independently and identically distributed.

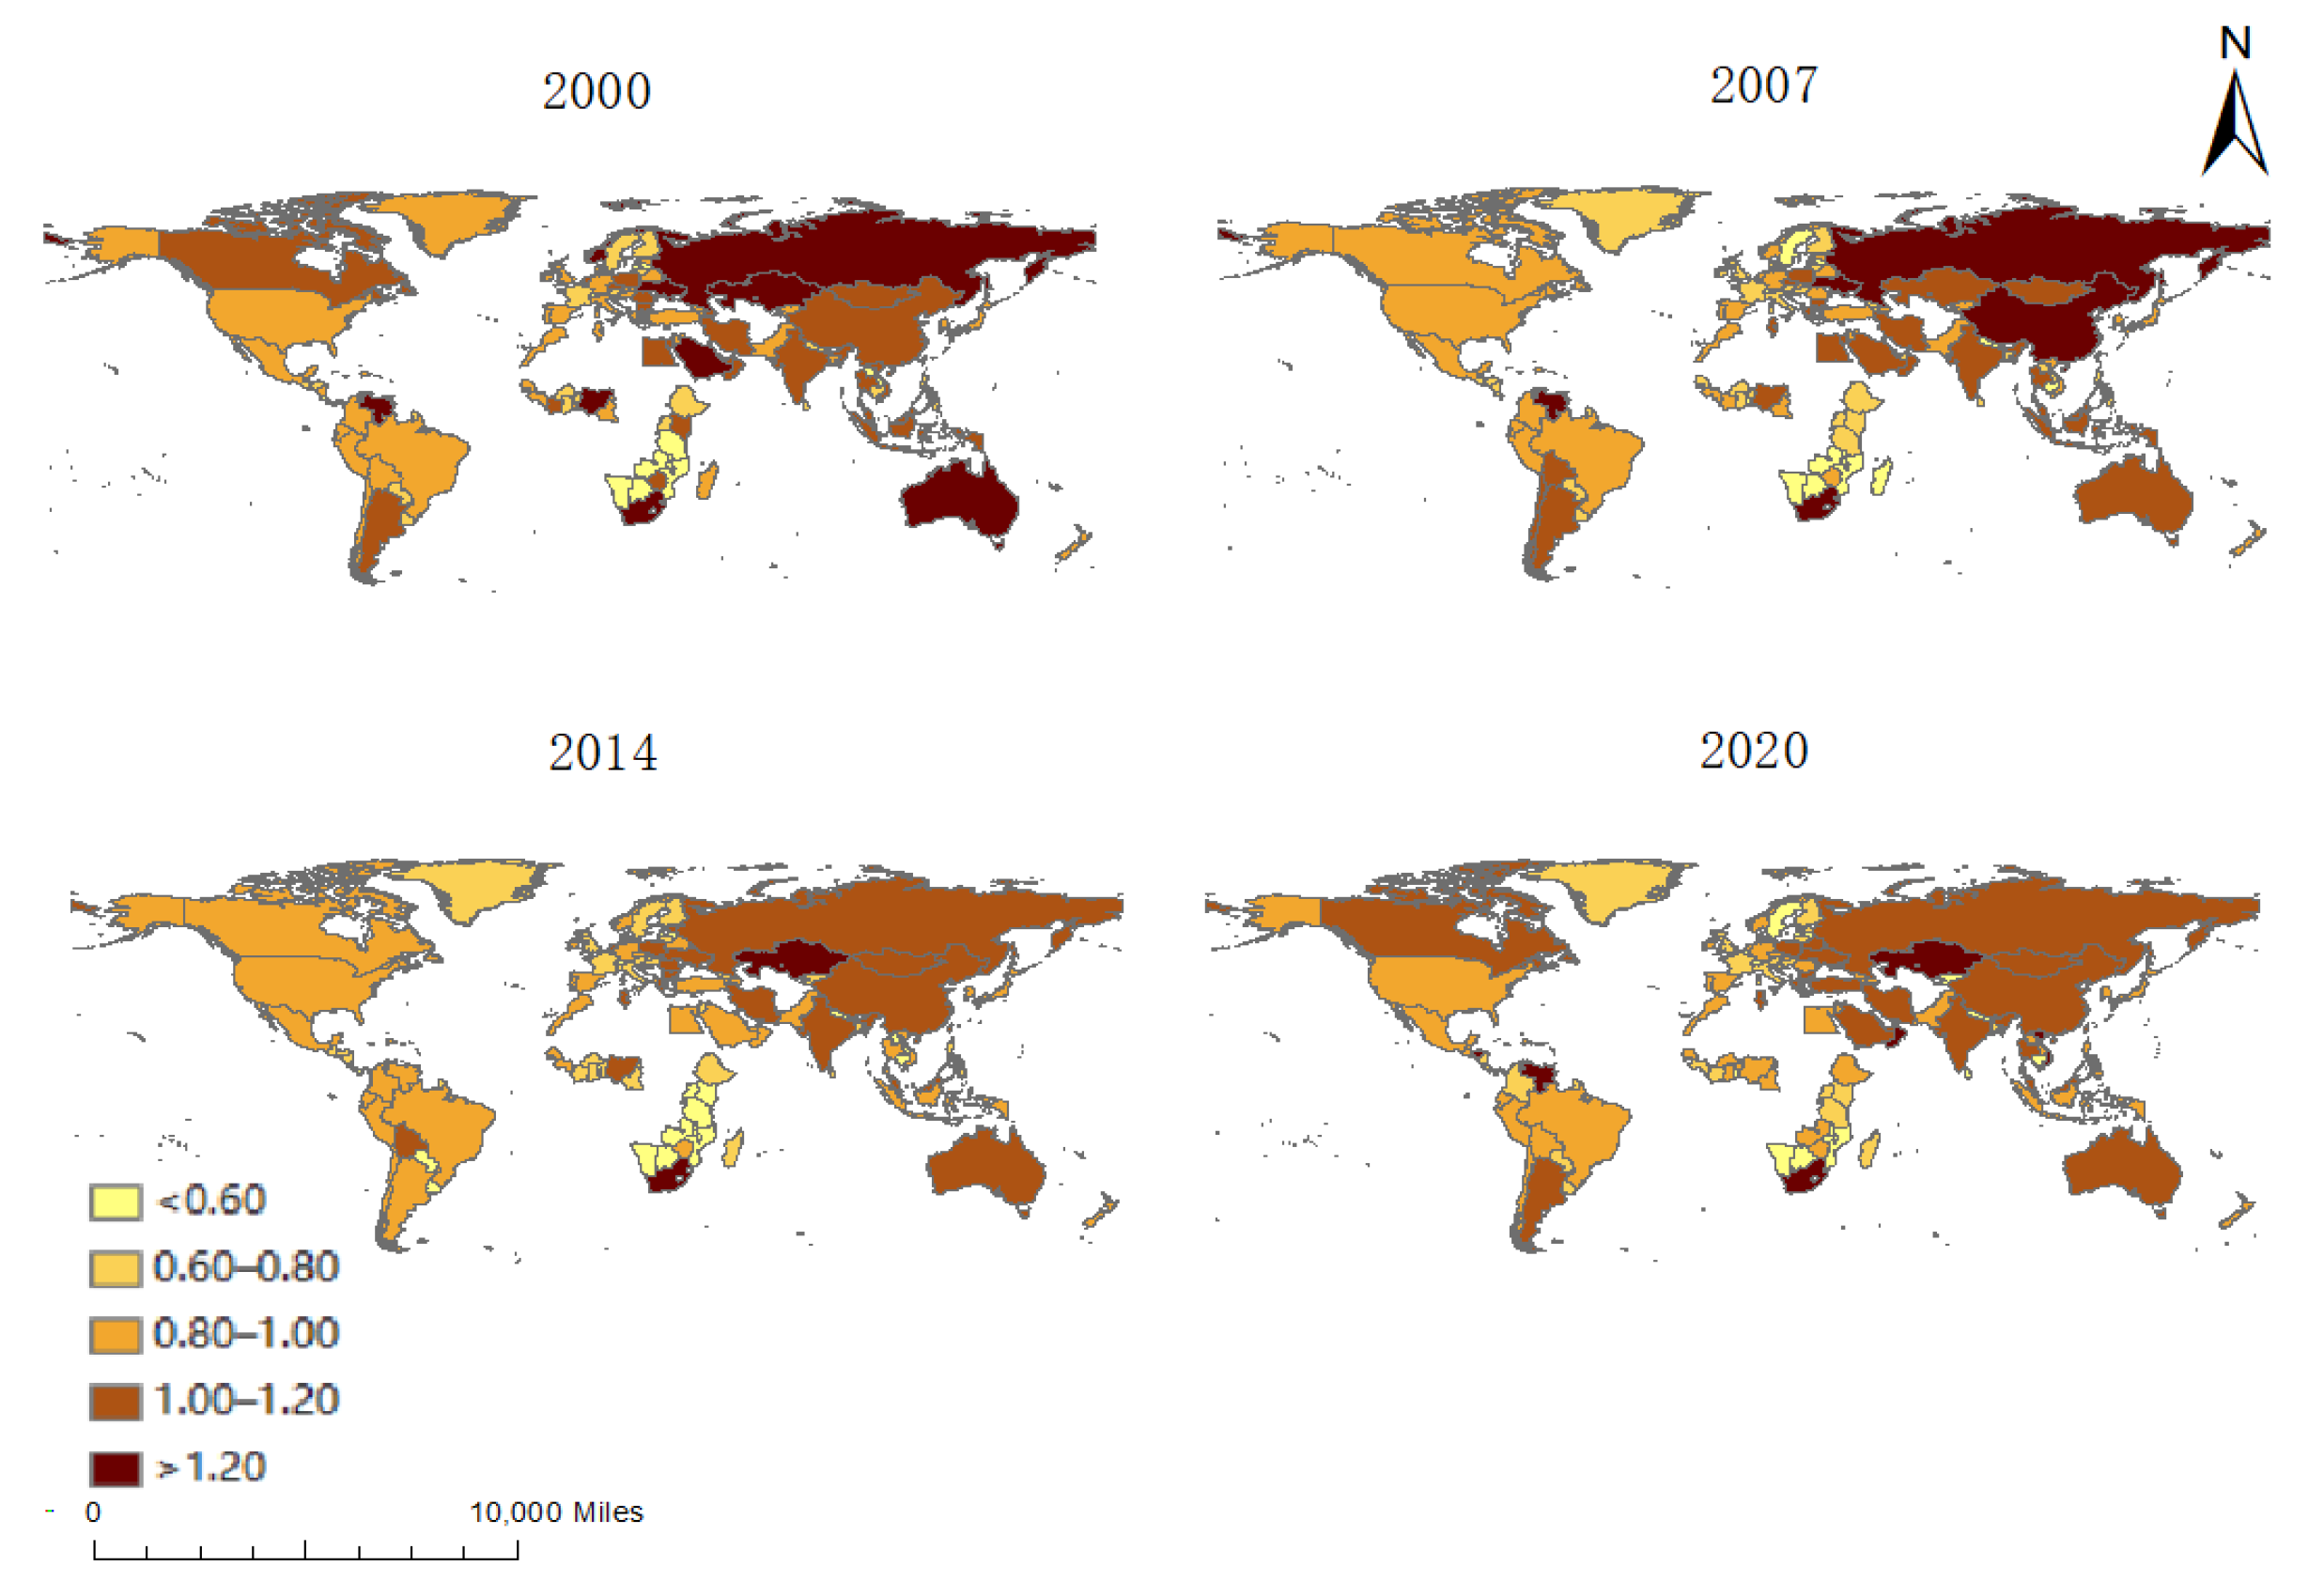
3.2. The Measurement of Carbon Emission Balance

With the deepening of the global production fragmentation and the cross-border trade, carbon emissions are transferred among countries. Countries prefer to reduce domestic emissions via transferring the emission-intensive industries to other countries. The transfers cause an emission gap between the production-based accounts and consumption-based account [7]. Yet, most previous works focused on production-based emissions. On one hand, consumption-based emissions are appropriate to be the basis for dividing carbon emission responsibilities for countries; on the other hand, cross-border consumption enable the transfer of the emissions through international trade. The works concentrated on consumption-based emissions and the comparison between two kinds of emissions are of a great significance [58,59,60]. Consumption-based CO2 emissions are measured during a country’s “consumption” of goods as well as services. According to Hotak et al. [7], consumption-based emissions are measured as follows:
CO 2 it   cons = CO 2 it   dcon CO 2 it   exp + CO 2 it   imp
where I denotes the country and t refers to the year; CO 2 it   cons refers to consumption-based CO2 emissions, which means the CO2 emissions caused by the countries’ consumption of goods and services; CO 2 it   dcon refers to CO2 emissions from domestic final consumption; CO 2 it   exp refers to CO2 emissions embodied in the imports of goods and services; and CO 2 it   imp refers to CO2 embodied in the exports of goods and services.
Based on the Global Carbon Budge [61], we use territorial emissions to measure carbon emissions based on production. Additionally, the ratio of production-based emissions to consumption-based emissions is applied to measure carbon emission balance. As follows:
CO 2 B it = CO 2 it   prod CO 2 it   cons
CO 2 it   prod refers to the production-based CO2 emissions that are commonly used by a country to report its emissions; CO 2 B it refers to carbon emission balance index. A country can be relatively considered as a net emission exporter (importer) if the CO 2 B it index is larger (smaller) than one. A smaller carbon mission balance index indicates that more of the country’s carbon emissions from its own consumption are transferred to other countries. After calculating the carbon emission balance index, this study further draws the spatial distribution of the country-level carbon emission balance in 2000, 2007, 2014, and 2020 (Figure 1) to show the time-trend.
As displayed in Figure 1, the carbon emission balance index of most countries in Asia and Oceania is bigger than those of countries in Europe (except Russia), Africa, and America, from 2000 to 2020. To be specific, the carbon emission balance index of the United States, Germany, France, United Kingdom, Italy, etc. is considerably lower than one, indicating that they are net carbon emission importers where production-based emissions are less than consumption-based emissions; however, the carbon emission balance index of China, India, Russia, Australia, etc. are quite higher than one, indicating that they are net carbon emission exporters where production-based emissions are more than consumption-based emissions. In addition, the carbon emission balance index of countries around the world shows a downward trend, from 2000 to 2020. It is worth noting that Egypt, the Czech Republic, Indonesia, Netherlands, and Norway have changed from net carbon emission exporters to net carbon emission importers and that Belarus, Brazil, Turkey, and Greece have transformed from net carbon emission importers to net carbon emission exporters, from 2000 to 2020.

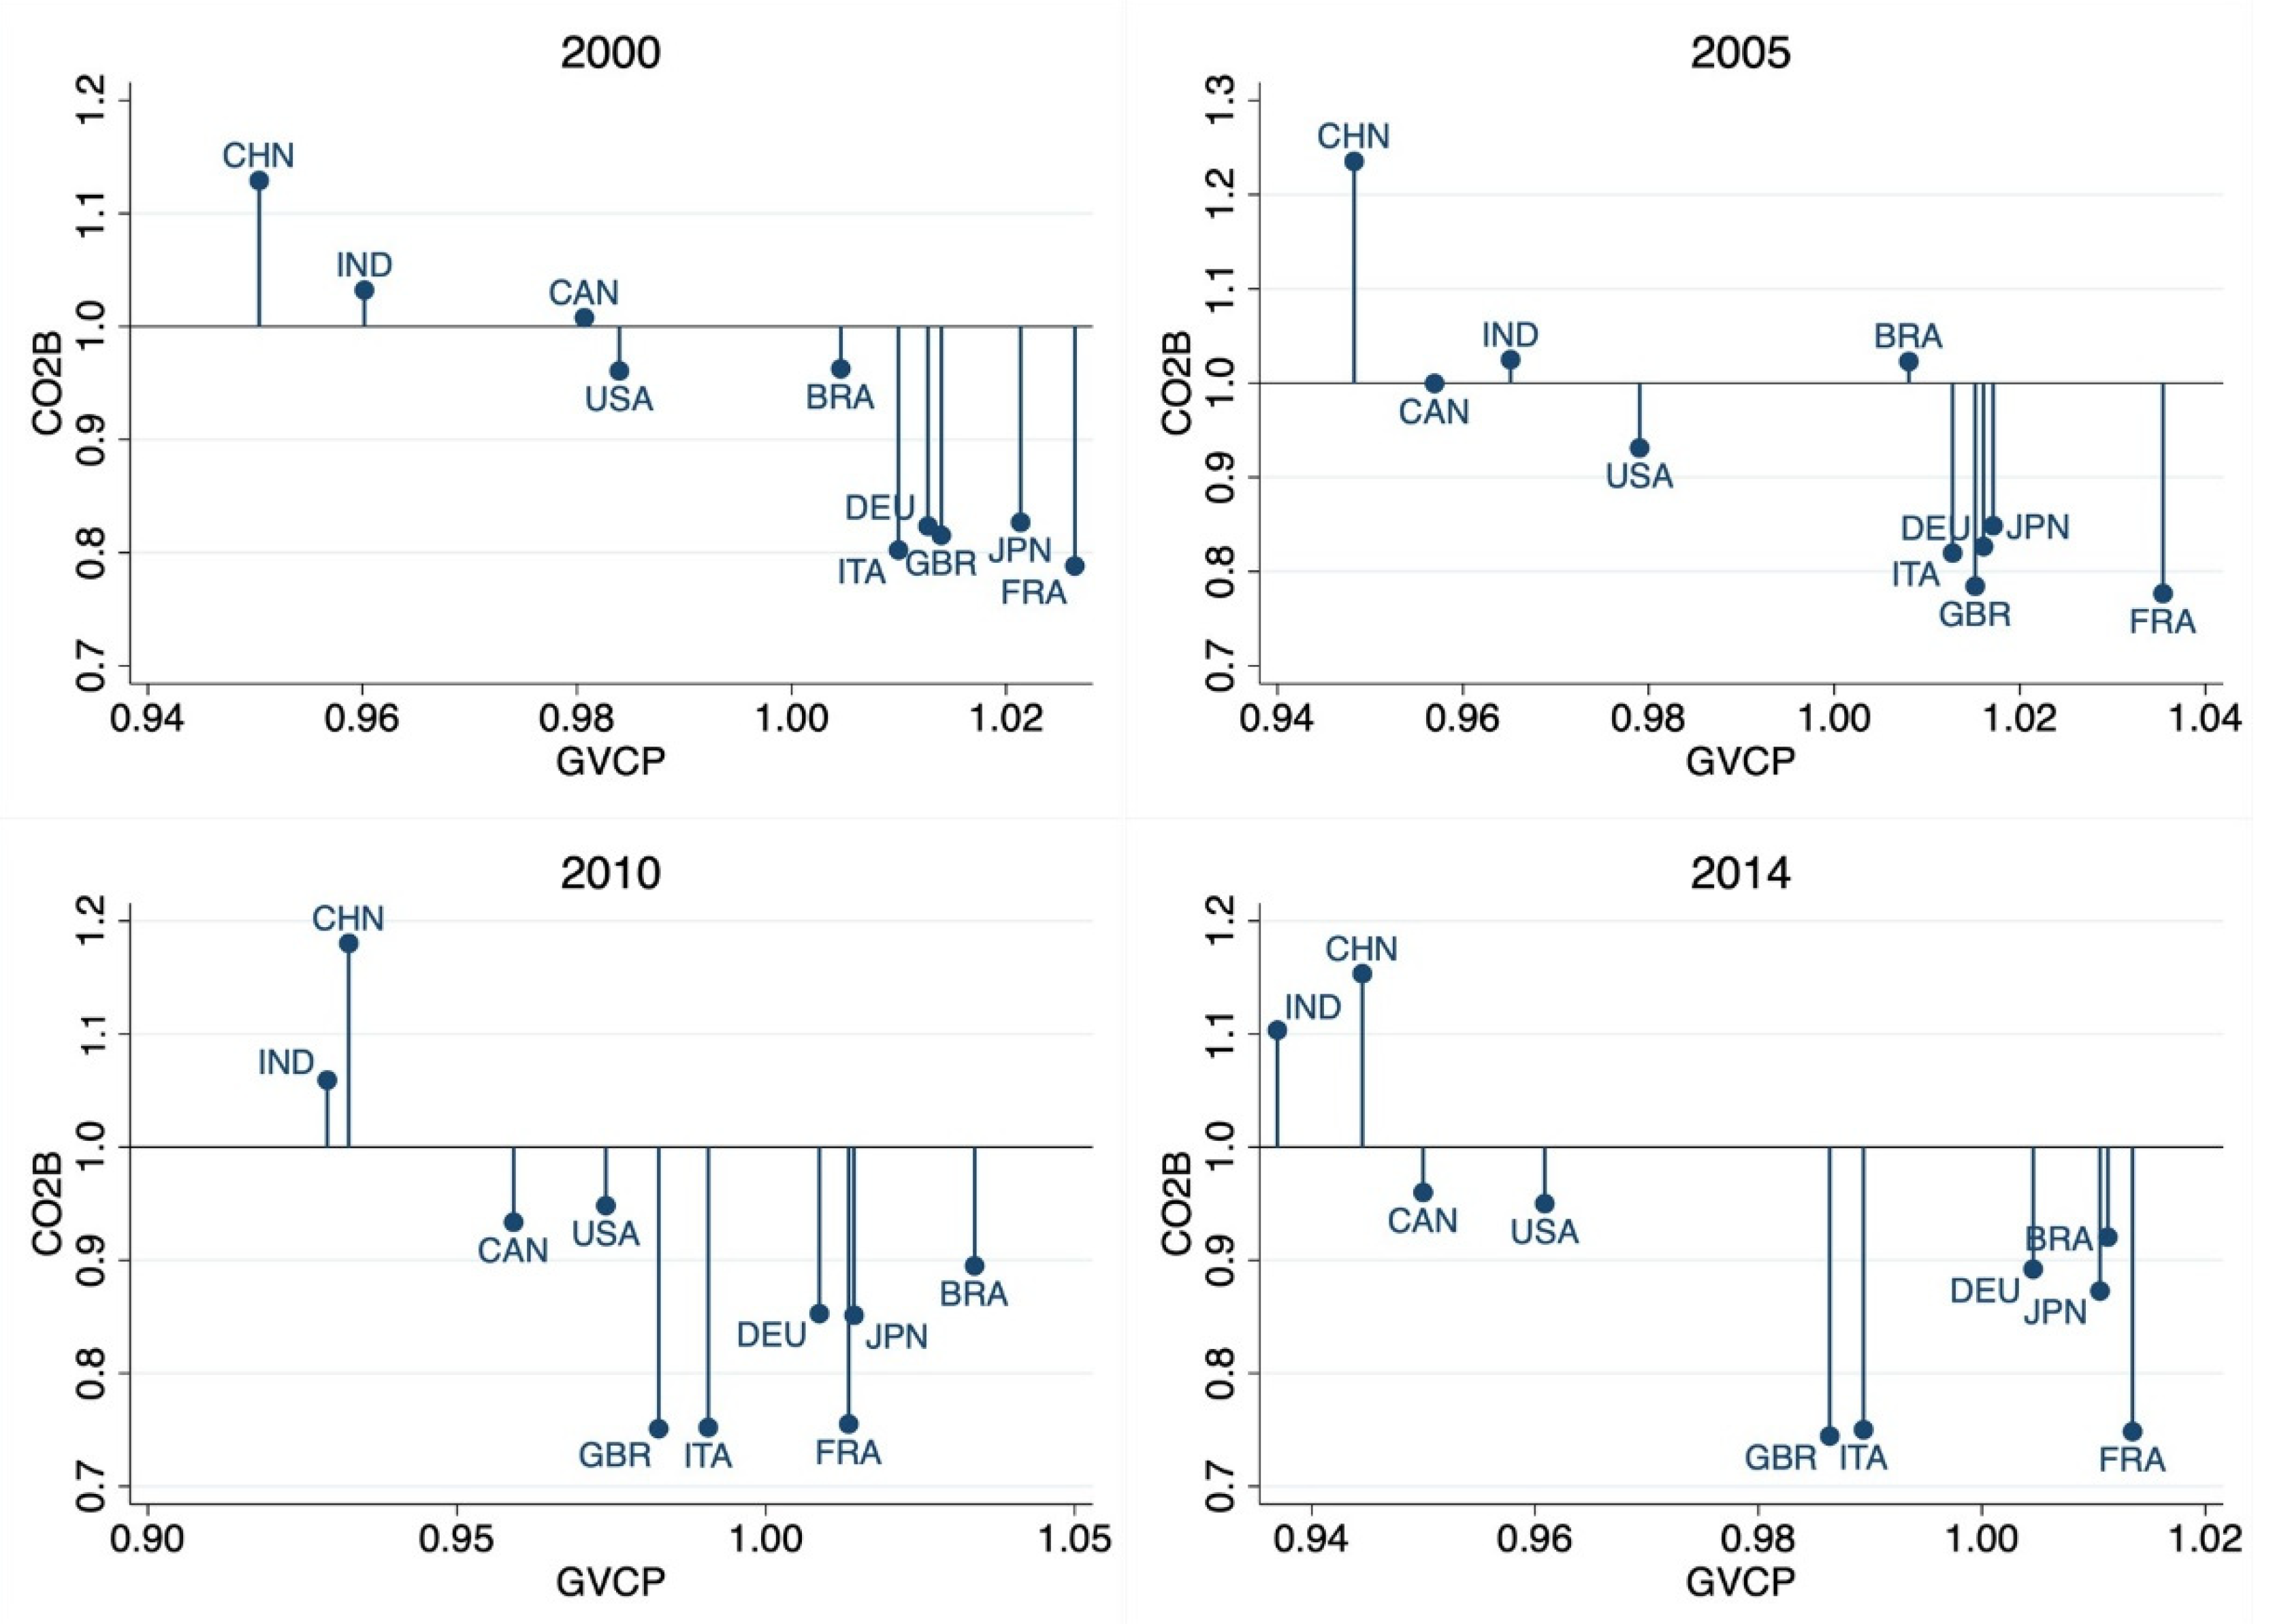
3.3. The Measurement of GVC Position

With the deepening of the fragmentation of international production, global value chains (GVCs) have become an important feature of globalization. There are several measurements for the GVC position. Starting with Fally [63], two measures including “upstreamness” (the average number of stages between production and final demand) and “downstreamness” (the average number of production stages embodied in each product) have been proposed to measure the position within GVCs. However, the “upstreamness” and “downstreamness” measures do not coincide with each other. Therefore, Wang et al. [64] proposed a new measure regarding the relative distance of a particular production length to both ends of a value chain.
According to the production decomposition framework proposed by Wang et al. [64], production activities, with a world multi-regional input–output model is constructed, can be divided into three parts, including value added that is domestically produced and consumed, value added that is embodied in final product exports, and value added that is embodied in exports or imports of intermediate goods and services. The last part measures production activities related to GVCs. Furthermore, the GVC production length has two segments, including output and value added absorbed directly by the importer and re-exports. The average production length forward (PLv_GVC) is the ratio of GVC-related domestic value added to the induced gross output while the average production length backward (PLy_GVC) is the ratio of GVC-related foreign value added to the induced gross output [64]. Specifically,
PLv _ GVC = Xv _ GVC V _ GVC
PLy _ GVC = Xy _ GVC Y _ GVC
According to Wang et al. [64], the country-level GVC position index is measured by the ratio of forward to backward linkage based on GVC production, as follows:
GVCP i = PLv _ GVC   [ PLy _ GVC ]
where GVCP i represents the global value chain position (GVCP) index, referring to the average production line position of country i. The greater the value of the Index, the higher position of the country i. It indicates that the country is closer to the production side (upstream) of the value chain while farther to the final consumption side of the value chain. The lower the value of the Index indicates that the country is closer to the final consumption side (downstream) of the value chain while farther to the production side of the value chain.
Figure 2 shows the global value chain position index and carbon emission balance index of the world’s top 10 economies in 2000, 2005, 2010, and 2014. It can be seen from Figure 2 that the carbon emission balance index of countries located in the upstream of the global value chain is much lower than that of the countries located in the downstream of the global value chain. Specifically, developed countries such as the United States, the United Kingdom, and France are located in the upstream of the global value chain and the carbon emissions caused by their domestic final consumption is much higher than the carbon emissions brought by their domestic production. Moreover, from 2000 to 2014, developing countries, such as China and India, located at the downstream of the global value chain from 2000 to 2014, and their carbon balance index is always greater than 1, that is, the carbon emissions from production is greater than the carbon emissions from consumption.

3.4. The Measurement of other Variables and Data Sources

To investigate the influence of renewable energy consumption on carbon emission balance quantitatively, this article employs a panel dataset of 42 countries from 2000 to 2014 for the empirical analysis. The research framework is depicted in Figure 3.
The carbon emission balance (denoted as CO2B), as the main dependent variable, is measured based on production-based emissions and consumption-based emissions. Both data of production and consumption emissions are derived from Global Carbon Atlas [62] and obtained for the index using the calculation introduced in Section 3.2.
Renewable energy consumption penetration (denoted as RECP), as the main independent variable, is measured by the ratio of renewable energy consumption to total energy consumption [13]. The renewable energy includes bioenergy, geothermal, solar, tidal, and wind, as shown in Table A1 in Appendix A. We obtain the data of energy consumption from the World Bank and IEA [66].
The global value chain position (denoted as GVCP) is measured based on the data of global input-output tables from the World Input Output Database (WIOD 2016) [65], because this set of data is the most established dataset that is available considering the period, countries covered, and the data quality and it is also widely used in the GVCs-related literature. The WIOD 2016 contains world input-output tables from 2000 to 2014. We obtain the index from the calculation in Section 3.3.
According to the STIRPAT model [55], the following three control variables are adapted, including the population intensity (denoted as PI), technology efficiency (denoted as TE), real GDP at constant national price (denoted as RGDP) to, respectively, measure the level of population, technology, and wealth in countries. All the data of these control variables are derived from the World Bank [67]. Table 1 displays descriptive statistics of the variables.

4. Results and Discussion

4.1. Results of the Impact of RECP on CO2B

Table 2 displays the double fixed-effect regression results, where column (1) only considers the impact of RECP on CO2B, column (2) adds control variables including PI, TE, and RGDP, and column (3) further adds GVCP as another control variable. We also classify countries where CO2B is more (less) than one as emission exporters (importers).
As shown in Table 2, after considering the control variables, including PI, TE, and RGDP, the influence coefficient of RECP on CO2B is −0.076 and it is significantly negative at the 1% level. Furthermore, after regarding GVCP as another control variable, we find that the influence coefficient of the RECP on the carbon emission balance is −0.077 and it is also significantly negative at the 1% level, revealing that the consumption of renewable energy can reduce the carbon emission balance index. From the point of GVCP, the influence coefficient of GVCP ( α = 0.573 , p < 0.05 ) is also negatively significant related to the carbon emission balance index.
To date, RECP has a negative effect on CO2B, but it has different effects in net exporters (LnCO2B > 0) and net importers (LnCO2B < 0). Column (4) and column (5) in Table 2 show the grouped regression results on the impact of RECP in net emission importers and exporters, respectively. We can find that the influence of RECP is much stronger in net importers ( α = 0.092 , p < 0.01 ) than that in net exporters ( α = 0.064 , p < 0.05 ) from both the views of the coefficient and significant level. As for the influence of GVCP on CO2B, the negative effect is only significant in net carbon importers (LnCO2B < 0), which means, in importing countries, the carbon emission transfers could be decreased by further improving its position within GVCs, but it is not an efficient solution in exporting countries.
For the robust analysis, considering the inertial effect of the economy and that the lagging variable (CO2Bi,t-1) may have an impact on the level of CO2Bi,t, we also add the lagging variable (CO2Bi,t-1) as another independent variable into the model. Furthermore, considering that endogeneity problems might exist, the instrumental variable (IV) method is often applied. Since the lagging variables as instrumental variables need to meet the spherical disturbance term assumption [68], this study employs the generalized method of moments (GMM) methods, mainly including system GMM(SYS-GMM) model and first differenced GMM(DIF-GMM) model, that are employed to estimate the dynamic panel data; the results are reported in the last two columns of Table 2. To be specific, as shown at the last two columns of Table 2, the p-values of the first-order (AR (1)) and second-order (AR (2)) differences are, respectively, lower and higher than 0.1, implying that the GMM method is reasonable in this research. To add, the p-values of the Hansen test are not significant (higher than 0.1), indicating that all the instrumental variables used in this study are effective [69]. After adding LnCO2Bi,t−1 into the regression model, the influence coefficient of RECP on the CO2B is also significantly negative at the 1% level. Therefore, the empirical results in this study are reliable and robust.

4.2. Results of the Impact of RECP on C O 2 p r o d and C O 2 c o n s

In order to further explore the reasons why RECP has a stronger effect in net importers, we investigate the mechanism of the impact RECP on CO2B. Since CO2B is measured based on production-based CO2 emissions (denoted as CO 2   prod ) and consumption-based CO2 emissions (denoted as CO 2   cons ) in Section 3, we explain the influence of RECP from the views of CO 2   prod and CO 2   cons . In this part, we consider CO2 embodied in the production and consumption separately to analyze the impact of RECP on CO2B in net emission exporters and importers. Table 3 shows the grouped regression results with country- and year-fixed effects, where column (1) and (4) show the influence of RECP on CO 2   prod and CO 2   cons within the whole samples, column (2) and (5) draw the impact of RECP on CO 2   prod and CO 2   cons in net importers, and column (3) and (6) reveal the same impact in net exporters.
Considering the net emission exporters (LnCO2B > 0), the impact of RECP is negatively significant on both CO 2   prod ( α = 0.241 , p < 0.01 ) and CO 2   cons ( α = 0.177 ,     p < 0.01 ), which indicates that RECP lowers the carbon emissions through both production and consumption. The CO2B goes down because the coefficient of the impact on CO 2   prod is much bigger than that on CO 2   cons , which means the CO 2   prod drops faster than CO 2   cons . In contrast, as for the net emission importers (LnCO2B < 0), the impact of RECP is negatively significant on CO 2   prod ( α = 0.058   ,   p < 0.01 ) but positive on CO 2   cons ( α = 0.034 , p < 0.05 ). The CO2B decreases through the reduction in the CO 2   prod and the induction of the CO 2   cons .
The essential cause of the carbon emission imbalance is the differences of environmental regulations and the production costs in countries. As for the net emission importers, the environmental regulations are relatively stringent [21,41]. The consumption of renewable energy lower CO2 emissions during production but raise the production economic cost, leading to the further transfer of production units abroad and the replacement of local products by imported products that are embodied with more CO2 emissions. More reliance on imports causes the increase in CO 2   cons . In contrast, as for the net emission exporters, the environmental regulations are relatively friendly [7,31]. There are more CO2 emissions but less cost embodied in products domestically produced than those overseas. Although the cost of domestic production is raised up by the application of renewable energy, it cannot easily reach the high cost in net emission importers. Therefore, the replacement of local products by imported products is limited. Even if the local products are partly replaced by imported products, the CO 2   cons is also induced for less CO2 emissions embodies in imported products. Furthermore, the renewable energy consumption surely reduces the production-based CO2 emissions, which in turn reduces the CO2 emissions based on consumption and is not replaced, leading to the drop of CO 2   prod and CO 2   cons .

4.3. Results of the Interaction Effect between RECP and GVCP on CO2B

Table 4 shows the impact of the interaction effect of RECP and GVCP on CO2B regarding the control variables, where column (1) displays the results within the whole samples, column (2) and column (3), respectively, summarize the interaction effect on CO2B in countries with the position within GVC closer to the downstream and upstream.
From Table 4, we find that the interaction effect between GVCP and RECP ( α = 0.529 , p < 0.01 ) is positively related to CO2B, which indicates that the negative effects on the carbon balance index caused by GVCP can be weakened by RECP. To further explore the different impact of RECP on CO2B, we decompose the countries into high GVCP countries (GVCP > 1) and low GVCP countries (GVCP < 1), according to whether the GVCP is greater than 1. Comparing the results of columns (2) and (3), the influence of RECP is obviously reflected in low GVCP countries ( α = 0.102 , p < 0.01 ), while the coefficient of RECP in high GVCP countries is not significant ( α = 0.017 , p > 0.1 ). This shows that the more renewable energy has been consumed, the lower the CO2B index in low GVCP countries. At the point of GVCP, it can be found that the GVCP only has the negative impact in high GVCP countries ( α = 1.387 , p < 0.01 ), while the coefficient of the GVCP in low GVCP countries is not significant ( α = 0.357 , p > 0.1 ).
As for the countries with low GVCP, the renewable energy consumption can significantly reduce the carbon emission balance index. That could be caused by two reasons. Firstly, the usage of renewable energy in production activities can reduce the production-based carbon emissions that can directly reduce the carbon emission balance index. Furthermore, renewable energy, compared to traditional fossil energy, leads to higher production cost, so renewable energy consumption in low GVCP countries can narrow the gap of production costs between low and high GVCP countries, thereby reallocating carbon-intensive production links. Therefore, renewable energy consumption can weaken the negative impact of the GVCs division system on the carbon emission balance and enable lower GVCP countries to achieve carbon emission balance (carbon emission balance index = 1). As for the countries with high GVCP, the countries are mostly developed countries, which are in a leading position in product design and technological innovation and have relatively low carbon emissions. Renewable energy consumption has a limited effect on the reduction in carbon emissions in these countries, so it has no significant effect on the reduction in the carbon balance index [25].

5. Conclusions

Using the panel data of 42 countries from 2000 to 2014, this study established an extended STIRPAT model to explain the impact of renewable energy consumption on the the carbon emission balance under global value chains. The main results are as follows:
Firstly, an economy’s carbon emission balance can be reduced by renewable energy consumption; this conclusion still holds after a series of robustness tests. Secondly, the impact of renewable energy consumption on the carbon emission balance is different in carbon emission exporting and importing countries. Specifically, for a net exporter of carbon emissions, renewable energy consumption can help narrow the carbon emissions gap to achieve carbon balance; however, for a net carbon emission importer, renewable energy consumption could increase its carbon emissions gap. Thirdly, there exists an impact of the interaction effect between GVCP and renewable energy consumption on the carbon emission balance, indicating that increasing renewable energy usage reduces the carbon emissions in low GVCP countries transferred from high GVCP countries.
Following the results of this study, there are some policy implications. First, encouraging the renewable energy consumption is an efficient policy to relieve the trade-off between participating in GVCs and solving the environmental problems. Second, considering that production-based carbon emissions are easily to be transferred from high GVCP countries to low GVCP countries, carbon emissions based on consumption should be considered in the calculation of national carbon emission responsibility and it is reasonable for high GVCP countries to provide basic climate or technology aid to the carbon emissions exporting countries to realize the global sustainable development.
Certain limitations are in the research due to data availability. Since renewable energy is used more widely, investigating the effect of renewable energy consumption on carbon emission balance is valuable. In the current research, the impact of renewable energy consumption on the carbon emission balance is investigated at the country level. However, the heterogenous impact among industries is meaningful but not involved in this paper. The impact of renewable energy consumption on the carbon emission balance at a multi-scale industry-level still needs further research.

Author Contributions

Conceptualization, X.G. and X.W.; methodology, X.G. and K.H.; resources, X.G.; data collection, X.G. and H.K; writing—original draft preparation, X.G. and K.H.; writing—review and editing, X.W. and L.L.; supervision, X.W.; project administration, X.W. All authors have read and agreed to the published version of the manuscript.

Funding

We acknowledge the support by the Tsinghua University Initiative Scientific Research Program.

Institutional Review Board Statement

Not applicable.

Informed Consent Statement

Not applicable.

Data Availability Statement

The data presented in this study are available on request from the corresponding author. http://www.globalcarbonatlas.org/en/CO2-emissions (accessed on 6 October 2022), http://www.wiod.org/ (accessed on 6 October 2022), https://data.worldbank.org/indicator/EG.ELC.RNWX.ZS (accessed on 6 October 2022).

Acknowledgments

We thank the anonymous reviewers and editors for their constructive comments and suggestions to improve the quality of this article.

Conflicts of Interest

The authors declare no conflict of interest.

Appendix A

Table A1. Breakdown of the renewable energy.
Categories
Renewable EnergyBioenergyPurpose-grown crops or trees in highly land-intensive process
Waste and residues
Black liquor from paper production
SolarSolar photovoltaic
Solar thermal
Geothermal
Tidal
Wind
Source: IEA (Renewables—Fuels & Technologies—IEA) and World Bank [66].

References

  1. Yan, Y.; Wang, R.; Zheng, X.; Zhao, Z. Carbon endowment and trade-embodied carbon emissions in global value chains: Evidence from China. Appl. Energy 2020, 277, 115592. [Google Scholar] [CrossRef]
  2. Gupta, S.; Bhandari, P.M. An effective allocation criterion for CO2 emissions. Energy Policy 1999, 27, 727–736. [Google Scholar] [CrossRef]
  3. Davis, S.J.; Peters, G.P.; Caldeira, K. The supply chain of CO2 emissions. Proc. Natl. Acad. Sci. USA 2011, 108, 18554–18559. [Google Scholar] [CrossRef] [PubMed] [Green Version]
  4. Peters, G.P.; Minx, J.C.; Weber, C.L.; Edenhofer, O. Growth in emission transfers via international trade from 1990 to 2008. Proc. Natl. Acad. Sci. USA 2011, 108, 8903–8908. [Google Scholar] [CrossRef] [Green Version]
  5. Fei, R.; Pan, A.; Wu, X.; Xie, Q. How GVC division affects embodied carbon emissions in China’s exports? Environ. Sci. Pollut. Res. 2020, 27, 36605–36620. [Google Scholar] [CrossRef]
  6. Peters, G.P.; Davis, S.J.; Andrew, R. A synthesis of carbon in international trade. Biogeosciences 2012, 9, 3247–3276. [Google Scholar] [CrossRef] [Green Version]
  7. Hotak, S.; Islam, M.; Kakinaka, M.; Kotani, K. Carbon emissions and carbon trade balances: International evidence from panel ARDL analysis. Environ. Sci. Pollut. Res. 2020, 27, 24115–24128. [Google Scholar] [CrossRef]
  8. Liu, H.; Zong, Z.; Hynes, K.; De Bruyne, K. Can China reduce the carbon emissions of its manufacturing exports by moving up the global value chain? Res. Int. Bus. Financ. 2020, 51, 101101. [Google Scholar] [CrossRef]
  9. Zhang, Z.; Zhu, K.; Hewings, G.J.D. A multi-regional input–output analysis of the pollution haven hypothesis from the perspective of global production fragmentation. Energy Econ. 2017, 64, 13–23. [Google Scholar] [CrossRef] [Green Version]
  10. Khan, S.A.R.; Jian, C.; Zhang, Y.; Golpîra, H.; Kumar, A.; Sharif, A. Environmental, social and economic growth indicators spur logistics performance: From the perspective of South Asian Association for Regional Cooperation countries. J. Clean. Prod. 2019, 214, 1011–1023. [Google Scholar] [CrossRef]
  11. Zafar, M.W.; Qin, Q.; Malik, M.N.; Zaidi, S.A.H. Foreign direct investment and education as determinants of environmental quality: The importance of post Paris Agreement (COP21). J. Environ. Manag. 2020, 270, 110827. [Google Scholar] [CrossRef]
  12. Zafar, M.W.; Shahbaz, M.; Sinha, A.; Sengupta, T.; Qin, Q. How renewable energy consumption contribute to environmental quality? The role of education in OECD countries. J. Clean. Prod. 2020, 268, 122149. [Google Scholar] [CrossRef]
  13. IEA. Renewable Energy Market Update 2021; International Energy Agency: Paris, France, 2021. [Google Scholar]
  14. Anser, M.K.; Hanif, I.; Vo, X.V.; Alharthi, M. The long-run and short-run influence of environmental pollution, energy consumption, and economic activities on health quality in emerging countries. Environ. Sci. Pollut. Res. 2020, 27, 32518–32532. [Google Scholar] [CrossRef]
  15. Sharif, A.; Raza, S.A.; Ozturk, I.; Afshan, S. The dynamic relationship of renewable and nonrenewable energy consumption with carbon emission: A global study with the application of heterogeneous panel estimations. Renew. Energy 2019, 133, 685–691. [Google Scholar] [CrossRef]
  16. Tiwari, A.K.; Shahbaz, M.; Adnan Hye, Q.M. The environmental Kuznets curve and the role of coal consumption in India: Cointegration and causality analysis in an open economy. Renew. Sustain. Energy Rev. 2013, 18, 519–527. [Google Scholar] [CrossRef] [Green Version]
  17. Chen, W.-J. Toward sustainability: Dynamics of total carbon dioxide emissions, aggregate income, non-renewable energy, and renewable power. Sustainability 2022, 14, 2712. [Google Scholar] [CrossRef]
  18. Salem, S.; Arshed, N.; Anwar, A.; Iqbal, M.; Sattar, N. Renewable energy consumption and carbon emissions—Testing nonlinearity for highly carbon emitting countries. Sustainability 2021, 13, 11930. [Google Scholar] [CrossRef]
  19. Amri, F. Renewable and non-renewable energy and trade into developed and developing countries. Qual. Quant. 2018, 53, 377–387. [Google Scholar] [CrossRef]
  20. Bai, C.; Feng, C.; Yan, H.; Yi, X.; Chen, Z.; Wei, W. Will income inequality influence the abatement effect of renewable energy technological innovation on carbon dioxide emissions? J. Environ. Manag. 2020, 264, 110482. [Google Scholar] [CrossRef]
  21. Cui, J. Induced clean technology adoption and international trade with heterogeneous firms. J. Int. Trade Econ. Dev. 2017, 26, 924–954. [Google Scholar] [CrossRef]
  22. Khan, S.A.R.; Yu, Z.; Belhadi, A.; Mardani, A. Investigating the effects of renewable energy on international trade and environmental quality. J. Environ. Manag. 2020, 272, 111089. [Google Scholar] [CrossRef]
  23. Antweiler, W.; Copeland, B.R.; Taylor, M.S. Is free trade good for the environment? Am. Econ. Rev. 2001, 91, 877–908. [Google Scholar] [CrossRef] [Green Version]
  24. Baumert, N.; Kander, A.; Jiborn, M.; Kulionis, V.; Nielsen, T. Global outsourcing of carbon emissions 1995–2009: A reassessment. Environ. Sci. Policy 2019, 92, 228–236. [Google Scholar] [CrossRef]
  25. Liu, H.; Li, J.; Long, H.; Li, Z.; Le, C. Promoting energy and environmental efficiency within a positive feedback loop: Insights from global value chain. Energy Policy 2018, 121, 175–184. [Google Scholar] [CrossRef]
  26. Davis, S.J.; Caldeira, K. Consumption-based accounting of CO2 emissions. Proc. Natl. Acad. Sci. USA 2010, 107, 5687–5692. [Google Scholar] [CrossRef] [Green Version]
  27. Munksgaard, J.; Pedersen, K.A. CO2 accounts for open economies: Producer or consumer responsibility? Energy Policy 2001, 29, 327–334. [Google Scholar] [CrossRef]
  28. Cadarso, M.-Á.; López, L.-A.; Gómez, N.; Tobarra, M.-Á. International trade and shared environmental responsibility by sector. An application to the Spanish economy. Ecological Economics 2012, 83, 221–235. [Google Scholar] [CrossRef]
  29. Jakob, M.; Marschinski, R. Interpreting trade-related CO2 emission transfers. Nature Climate Change 2012, 3, 19–23. [Google Scholar] [CrossRef]
  30. Liu, H.; Liu, W.; Fan, X.; Liu, Z. Carbon emissions embodied in value added chains in China. J. Clean. Prod. 2015, 103, 362–370. [Google Scholar] [CrossRef]
  31. Meng, B.; Peters, G.P.; Wang, Z.; Li, M. Tracing CO2 emissions in global value chains. Energy Econ. 2018, 73, 24–42. [Google Scholar] [CrossRef]
  32. Ma, N.; Li, H.; Tang, R.; Dong, D.; Shi, J.; Wang, Z. Structural analysis of indirect carbon emissions embodied in intermediate input between Chinese sectors: A complex network approach. Environ. Sci. Pollut. Res. 2019, 26, 17591–17607. [Google Scholar] [CrossRef] [PubMed]
  33. Li, Q.; Wu, S.; Li, S. Weighing China’s embodied CO2 emissions and value added under global value chains: Trends, characteristics, and paths. J. Environ. Manag. 2022, 316, 115302. [Google Scholar] [CrossRef] [PubMed]
  34. Li, J.; Lin, B. Does energy and CO2 emissions performance of China benefit from regional integration? Energy Policy 2017, 101, 366–378. [Google Scholar] [CrossRef] [PubMed]
  35. Bi, K.; Huang, P.; Ye, H. Risk identification, evaluation and response of low-carbon technological innovation under the global value chain: A case of the Chinese manufacturing industry. Technological Forecasting and Social Change 2015, 100, 238–248. [Google Scholar] [CrossRef]
  36. Jiang, X.; Liu, Y. Global value chain, trade and carbon: Case of information and communication technology manufacturing sector. Energy for Sustainable Development 2015, 25, 1–7. [Google Scholar] [CrossRef]
  37. Poulsen, R.T.; Ponte, S.; Sornn-Friese, H. Environmental upgrading in global value chains: The potential and limitations of ports in the greening of maritime transport. Geoforum 2018, 89, 83–95. [Google Scholar] [CrossRef] [Green Version]
  38. Wu, Z.; Hou, G.; Xin, B. The causality between participation in GVCs, renewable energy consumption and CO2 emissions. Sustainability 2020, 12, 1237. [Google Scholar] [CrossRef] [Green Version]
  39. Al-Mulali, U.; Ozturk, I.; Lean, H.H. The influence of economic growth, urbanization, trade openness, financial development, and renewable energy on pollution in Europe. Nat. Hazards 2015, 79, 621–644. [Google Scholar] [CrossRef]
  40. Bengochea, A.; Faet, O. Renewable energies and CO2 emissions in the European Union. Energy Sources Part B Econ. Plan. Policy 2012, 7, 121–130. [Google Scholar] [CrossRef]
  41. Bilgili, F.; Koçak, E.; Bulut, Ü. The dynamic impact of renewable energy consumption on CO 2 emissions: A revisited Environmental Kuznets Curve approach. Renew. Sustain. Energy Rev. 2016, 54, 838–845. [Google Scholar] [CrossRef]
  42. Lopez-Menendez, A.J.; Perez, R.; Moreno, B. Environmental costs and renewable energy: Re-visiting the Environmental Kuznets Curve. J. Environ. Manag. 2014, 145, 368–373. [Google Scholar] [CrossRef] [PubMed]
  43. Sadorsky, P. Renewable energy consumption, CO2 emissions and oil prices in the G7 countries. Energy Econ. 2009, 31, 456–462. [Google Scholar] [CrossRef]
  44. Liu, Z.; Wang, S.; Lim, M.Q.; Kraft, M.; Wang, X. Game theory-based renewable multi-energy system design and subsidy strategy optimization. Adv. Appl. Energy 2021, 2, 100024. [Google Scholar] [CrossRef]
  45. Jia, J.; Lei, J.; Chen, C.; Song, X.; Zhong, Y. Contribution of renewable energy consumption to CO2 emission mitigation: A comparative analysis from a global geographic perspective. Sustainability 2021, 13, 3853. [Google Scholar] [CrossRef]
  46. Li, J.; Li, L.; Tong, Y.W.; Wang, X. Understanding and optimizing the gasification of biomass waste with machine learning. Green Chem. Eng. 2022; in press. [Google Scholar] [CrossRef]
  47. Ben Jebli, M.; Ben Youssef, S.; Ozturk, I. Testing environmental Kuznets curve hypothesis: The role of renewable and non-renewable energy consumption and trade in OECD countries. Ecol. Indic. 2016, 60, 824–831. [Google Scholar] [CrossRef]
  48. Chiu, C.-L.; Chang, T.-H. What proportion of renewable energy supplies is needed to initially mitigate CO2 emissions in OECD member countries? Renew. Sustain. Energy Rev. 2009, 13, 1669–1674. [Google Scholar] [CrossRef]
  49. Apergis, N.; Payne, J.E.; Menyah, K.; Wolde-Rufael, Y. On the causal dynamics between emissions, nuclear energy, renewable energy, and economic growth. Ecol. Econ. 2010, 69, 2255–2260. [Google Scholar] [CrossRef]
  50. Shafiei, S.; Salim, R.A. Non-renewable and renewable energy consumption and CO2 emissions in OECD countries: A comparative analysis. Energy Policy 2014, 66, 547–556. [Google Scholar] [CrossRef] [Green Version]
  51. Farhani, S.; Shahbaz, M. What role of renewable and non-renewable electricity consumption and output is needed to initially mitigate CO2 emissions in MENA region? Renew. Sustain. Energy Rev. 2014, 40, 80–90. [Google Scholar] [CrossRef]
  52. Cerdeira Bento, J.P.; Moutinho, V. CO2 emissions, non-renewable and renewable electricity production, economic growth, and international trade in Italy. Renew. Sustain. Energy Rev. 2016, 55, 142–155. [Google Scholar] [CrossRef]
  53. Adebayo, T.S.; Rjoub, H. Assessment of the role of trade and renewable energy consumption on consumption-based carbon emissions: Evidence from the MINT economies. Environ. Sci. Pollut. Res. 2021, 28, 58271–58283. [Google Scholar] [CrossRef] [PubMed]
  54. Ehrlich, P.R.; Holdren, J.P. Impact of population growth. Science 1971, 171, 1212–1217. [Google Scholar] [CrossRef] [PubMed]
  55. Dietz, T.; Rosa, E.A. Effects of population and affluence on CO2 emissions. Proc. Natl. Acad. Sci. USA 1997, 94, 175–179. [Google Scholar] [CrossRef] [Green Version]
  56. York, R.; Rosa, E.A.; Dietz, T. STIRPAT, IPAT and ImPACT: Analytic tools for unpacking the driving forces of environmental impacts. Ecol. Econ. 2003, 46, 351–365. [Google Scholar] [CrossRef]
  57. Yang, N.N.; Liu, Q.M. The interaction effects of GVC involvement and domestic R&D on carbon emissions: Evidence from China’s industrial sectors. Technol. Anal. Strateg. Manag. 2022, 34, 687–702. [Google Scholar] [CrossRef]
  58. Hasanov, F.J.; Liddle, B.; Mikayilov, J.I. The impact of international trade on CO2 emissions in oil exporting countries: Territory vs consumption emissions accounting. Energy Econ. 2018, 74, 343–350. [Google Scholar] [CrossRef]
  59. Knight, K.; Schor, J. Economic growth and climate change: A cross-national analysis of territorial and consumption-based carbon emissions in high-income countries. Sustainability 2014, 6, 3722–3731. [Google Scholar] [CrossRef] [Green Version]
  60. Liddle, B. Consumption-based accounting and the trade-carbon emissions nexus. Energy Econ. 2018, 69, 71–78. [Google Scholar] [CrossRef]
  61. Le Quéré, C.; Andrew, R.M.; Friedlingstein, P.; Sitch, S.; Hauck, J.; Pongratz, J.; Pickers, P.A.; Korsbakken, J.I.; Peters, G.P.; Canadell, J.G.; et al. Global carbon budget 2018. Earth Syst. Sci. Data 2018, 10, 2141–2194. [Google Scholar] [CrossRef]
  62. Global Carbon Atlas. 2022. Available online: http://www.globalcarbonatlas.org/en/CO2-emissions (accessed on 1 December 2022).
  63. Fally, T. Production Staging: Measurement and Facts; University of Colorado-Boulder: Boulder, Colorado, CO, USA, 2012; pp. 155–168. [Google Scholar]
  64. Wang, Z.; Wei, S.-J.; Yu, X.; Zhu, K. Characterizing Global Value Chains: Production Length and Upstreamness; NBER Working Paper Series; National Beaureu of Economic Research: Cambridge, MA, USA, 2017; p. No. 23261. [Google Scholar] [CrossRef]
  65. World Input Output Database (WIOD 2016). 2016. Available online: http://www.wiod.org/ (accessed on 6 October 2022).
  66. IEA & World Bank. 2022. Available online: https://data.worldbank.org/indicator/EG.ELC.RNWX.ZS (accessed on 6 October 2022).
  67. World Bank. 2022. Available online: https://data.worldbank.org.cn/ (accessed on 6 October 2022).
  68. Bun, M.J.G.; Windmeijer, F. The weak instrument problem of the system GMM estimator in dynamic panel data models. Econom. J. 2010, 13, 95–126. [Google Scholar] [CrossRef] [Green Version]
  69. Roodman, D. How to do Xtabond2: An introduction to difference and system GMM in Stata. Stata J. Promot. Commun. Stat. Stata 2009, 9, 86–136. [Google Scholar] [CrossRef]
Figure 1. Spatial distribution of country-level carbon emission balance for selected years. Data source: calculated based on the Global Carbon Atlas database [62].
Sustainability 15 00234 g001
Figure 2. Global value chain position and carbon emission balance index of the world’s top 10 economies in selected years. Data source: Calculated based on the Global Carbon Atlas database [62] and the World Bank Database [65].
Sustainability 15 00234 g002
Figure 3. Research framework. Source: Author(s) depiction.
Sustainability 15 00234 g003
Table 1. Descriptive statistics of the variables.
VariableDefinitionMeanStd.DevMinMax
LnCO2BCarbon emission balance−0.17290.2489−1.14820.3858
LnGVCPGVC Position0.00160.0344−0.07800.1273
LnRECPRenewable energy consumption penetration2.38081.08210.92501.1358
LnPIPopulation intensity4.44441.24880.91357.2138
LnTETechnology efficiency2.03630.39290.47983.0072
LnRGDPReal GDP at constant national price9.78691.08666.094311.6854
Source: Author(s) computation.
Table 2. Results of the impact of RECP on CO2B.
VariableStatic Panel EstimationDynamic Panel Estimation
OLSSYS-GMMDIF-GMM
All CountriesImporterExporterAll Countries
(1)(2)(3)(4)(5)(6)(7)
LnCO2Bi,t-1 0.487 ***0.288 **
(2.78)(2.50)
LnRECP−0.058 ***−0.076 ***−0.077 ***−0.092 ***−0.064 **−0.044 **−0.079 ***
(−4.38)(−5.50)(−5.58)(−7.39)(−2.41)(−1.99)(−2.67)
LnRGDP −0.091 ***−0.090 ***−0.140 ***−0.030−0.079 ***−0.062 *
(−3.68)(−3.62)(−4.43)(−0.83)(−2.85)(−1.94)
LnTE −0.218 ***−0.230 ***−0.162 ***−0.202 ***0.119−0.160
(−3.98)(−4.21)(−2.77)(−2.95)(1.21)(−1.52)
LnPI −0.990 ***−0.946 ***−0.718 ***−0.573 ***−0.064 **−0.829 **
(−8.29)(−7.86)(−5.84)(−3.32)(−2.22)(−2.43)
LnGVCP −0.573 * *−0.636 **−0.340−0.3840.186
(−2.33)(−2.49)(−1.29)(−0.59)(0.52)
Constant0.236 ***2.474 ***2.448 ***2.645 ***1.418 ***0.825 ***
(6.34)(8.66)(8.60)(7.03)(3.41)(2.44)
Country-fixed effectYESYESYESYESYESYESYES
Year-fixed effectYESYESYESYESYESYESYES
R-squared0.8720.8890.8900.9040.720
AR (1) 0.0260.055
AR (2) 0.6310.891
Hansen test 0.9661.000
Observations627627627469158586544
Source: Author(s) computation. Notes: *, **, and ***, respectively, indicate statistical significance at the 10%, 5%, and 1% levels; the values in parentheses of static panel estimation represent t-statistics, while the values in parentheses of dynamic panel estimation indicate z-statistics.
Table 3. Results of the impact of RECP on CO 2   prod and CO 2   cons .
Variable C O 2     p r o d C O 2     c o n s
All countriesImporterExporterAll countriesImporterExporter
(1)(2)(3)(4)(5)(6)
LnRECP−0.09 ***−0.058 ***−0.241 ***−0.0130.034 **−0.177 ***
(−8.33)(−5.54)(−6.64)(−0.79)(2.21)(−4.96)
LnRGDP0.438 ***0.395 ***0.423 ***0.527 ***0.535 ***0.453 ***
(22.58)(14.86)(8.55)(17.87)(13.62)(9.31)
LnTE−0.596 ***−0.516 ***−0.775 ***−0.365 ***−0.354 ***−0.573 ***
(−13.89)(−10.49)(−8.26)(−5.59)(−4.86)(−6.21)
LnPI−0.156 *−0.367 ***−0.0950.791 ***0.350 **0.478 **
(−1.65)(−3.56)(−0.40)(5.51)(2.30)(2.06)
LnGVCP−0.978 ***−0.443 **−1.904 ***−0.4050.193−1.565 ***
(−5.08)(−2.06)(−5.27)(−1.38)(0.61)(−4.40)
Constant−14.034 ***−13.681 ***−13.387 ***−16.481 ***−16.326 ***−14.804 ***
(−62.91)(−43.32)(−23.47)(−48.54)(−34.97)(−26.39)
Country-fixed effectYESYESYESYESYESYES
Year-fixed effectYESYESYESYESYESYES
R-squared0.9890.9860.9960.9780.9730.996
Observations627469158627469158
Source: Author(s) computation. Notes: *, **, and ***, respectively, indicate statistical significance at the 10%, 5%, and 1% levels; t-statistic is displayed as values in parentheses of static panel estimation.
Table 4. Results of the interaction effect between RECP and GVCP on CO2B.
All CountriesLow GVCP CountriesHigh GVCP Countries
(1)(2)(3)
LnRECP−0.082 ***−0.102 ***−0.017
(−50.89)(−70.39)(−0.59)
LnGVCP−10.83 ***0.357−10.387 ***
(−30.15)(10.04)(−20.83)
LnRECP*LnGVCP0.529 **
(20.38)
LnRGDP−0.091 ***−0.083 ***−0.106 **
(−30.70)(−30.46)(−20.14)
LnTE−0.221 ***−0.275 ***−0.167
(−40.04)(−40.83)(−10.58)
LnPI−0.987 ***−0.816***−10.186***
(−80.15)(−50.17)(−50.95)
Constant20.501 ***20.372 ***20.721 ***
(80.79)(70.40)(50.21)
Country-fixed effectYESYESYES
Year-fixed effectYESYESYES
R-squared0.8910.9590.819
Observations627319308
Source: Author(s) computation. Notes: **, and ***, respectively, indicate statistical significance at the 5%, and 1% levels; t-statistic is displayed as values in parentheses of static panel estimation.
Disclaimer/Publisher’s Note: The statements, opinions and data contained in all publications are solely those of the individual author(s) and contributor(s) and not of MDPI and/or the editor(s). MDPI and/or the editor(s) disclaim responsibility for any injury to people or property resulting from any ideas, methods, instructions or products referred to in the content.

