Article

Quantitative Ground Risk Assessment for Urban Logistical Unmanned Aerial Vehicle (UAV) Based on Bayesian Network

1
School of Air Traffic Management, Civil Aviation University of China, Tianjin 300300, China
2
Zhe Jiang Key Laboratory of General Aviation Operation Technology, Jiande 311612, China
3
Department of General Aviation, Civil Aviation Management Institute of China, Beijing 100102, China
4
Key Laboratory of Flight Techniques and Flight Safety, Civil Aviation Administration of China (CAAC), Guanghan 300201, China
*
Author to whom correspondence should be addressed.
Sustainability 2022, 14(9), 5733; https://doi.org/10.3390/su14095733
Submission received: 7 April 2022 / Revised: 3 May 2022 / Accepted: 7 May 2022 / Published: 9 May 2022
(This article belongs to the Special Issue Airspace System Planning and Management)

Abstract

:
The Unmanned Aerial Vehicle (UAV) has been used for the delivery of medical supplies in urban logistical distribution, due to its ability to reduce human contact during the global fight against COVID-19. However, due to the reliability of the UAV system and the complex and changeable operation scene and population distribution in the urban environment, a few ground-impact accidents have occurred and generated enormous risks to ground personnel. In order to reduce the risk of UAV ground-impact accidents in the urban logistical scene, failure causal factors, and failure modes were classified and summarized in the process of UAV operation based on the accumulated operation data of more than 20,000 flight hours. The risk assessment model based on the Bayesian network was built. According to the established network and the probability of failure causal factors, the probabilities of ground impact accidents and intermediate events under different working conditions were calculated, respectively. The posterior probability was carried out based on the network topology to deduce the main failure inducement of the accidents. Mitigation measures were established to achieve the equivalent safety level of manned aviation, aiming at the main causes of accidents. The results show that the safety risk of the UAV was reduced to 3.84 × 10⁻⁸ under the action of risk-mitigation measures.

1. Introduction

In recent years, UAVs have been successfully used in agriculture, forestry, plant protection, search and rescue, environmental monitoring, logistics, and other relevant fields [1,2]. The RAND Corporation, an internationally renowned consultancy, predicted that, by 2030, drones will replace more than 20% of ground logistical deliveries. The total takeoffs and landings would exceed to more than 3 million per day in a medium-sized city. However, at the same time, the safety risks caused by UAV ground-impact accidents are also increased gradually, posing a serious threat to the safety of ground personnel. Due to the complex structure of the UAV system, diverse operation scenarios, and strong dependence on navigation and communication infrastructure, it is necessary to comprehensively consider various internal system and external support system failures when evaluating UAV operation safety risks, bringing great challenges to its operation safety.
The operating risks are divided into mid-air collision and crash failure by Joint Authorities for Rulemaking on Unmanned Systems (JARUS) [3]. The interval between the aircrafts and the highest obstacles on the ground should always keep a distance of more than 600 m based on the regulation of the procedures of civil aviation flights over cities and nearby areas [4]. Thus, the probability of collision between urban logistical UAV and civil aviation flights is low while operating 70~150 m above the ground. Therefore, before the number of drones in operation has reached a significant level, more attention should be paid to the failure problem of UAV and ground impact accidents when they fly over people in urban logistical scene at the present stage. This is also confirmed by existing statistics on historical safety accidents. A lot of research studies have been performed on UAV risk assessment. The existing literature could be summarized into two aspects. The first is the prediction of probability of ground impact accidents; this usually focuses on the reliability of UAV system. To solve this problem, existing studies assume one specific failure mode and failure probability of components [5,6]. Then a fault tree, event tree analysis, or Bayesian network [7,8,9] is adopted to determine the system reliability [10]. The Bayesian network plays a prominent role in the uncertainty and correlation analysis of a multifactor causal relationship [11]. Barr et al. [7] put forward the safety risk management strategy of UAV by using a Bayesian network based on the analysis of UAV crash and air collision accidents. Ancel et al. [8] used a Bayesian network to estimate the failure probability of UAV in the air traffic management system and evaluated the risks to ground personnel. James et al. [12] studied the risk of UAV integrating into national airspace due to communication link failure based on the Bayesian network. Kevorkian [9] used the fault tree method to analyze the failure causal factors of small fixed-wing UAV developed by Virginia Tech. The fault tree model was transformed into a Bayesian network model, and a quantitative evaluation of its failure probability was conducted. The second aspect is the evaluation of accidental severity which focuses on the impact of casualty rate of ground personnel. Weibel and Hansman [13,14] established the relationship between UAV crash injury criteria and the kinetic energy and proposed the empirical formula of casualty rate based on kinetic energy. Dalamagkidis [15,16] modified Weibel’s casualty rate model according to its protective effect on human body. Based on these studies, some scholars put forward the research framework of UAV safety risk and mitigation [17,18].

1.1. Task and Operation Scenario of Urban Logistical UAV

In order to evaluate the operation risk of urban logistical UAV, the task and operation scenario should be analyzed first. The task of urban logistical UAV is commodity distribution in the city and its nearby suburbs. Considering the impact of task attributes on the flight altitude, speed, and distribution distance, some typical type of urban logistical UAV, the operation scenarios, and risk categories were shown in Table 1. As shown in the table, multi-rotor UAVs are mainly used for urban logistical distribution with maximum takeoff weight between 15.5 and 37 kg. The payload weight is usually less than 5 kg. The distribution distance is within 15 km, and the flight altitude is generally less than 100 m. According to the proposed classification based on takeoff weight or risk of the aviation authorities and international organizations, urban logistical UAVs are generally small multi-rotor UAVs with medium risk. This specific type of UAV and its operation risk are seldom covered in the current literature. Additionally, as an important part of operation scenario, strong winds, heavy rains, and strong electromagnetic interference may happen unexpectedly and cause unexpected failure of the UAV system. Therefore, it is necessary to analyze the failure mode, failure causal factors, and probability based on the actual operation data of urban logistical UAV and carry out risk assessment and mitigation according to the characteristics, so as to reduce the safety risk to ground personnel below.

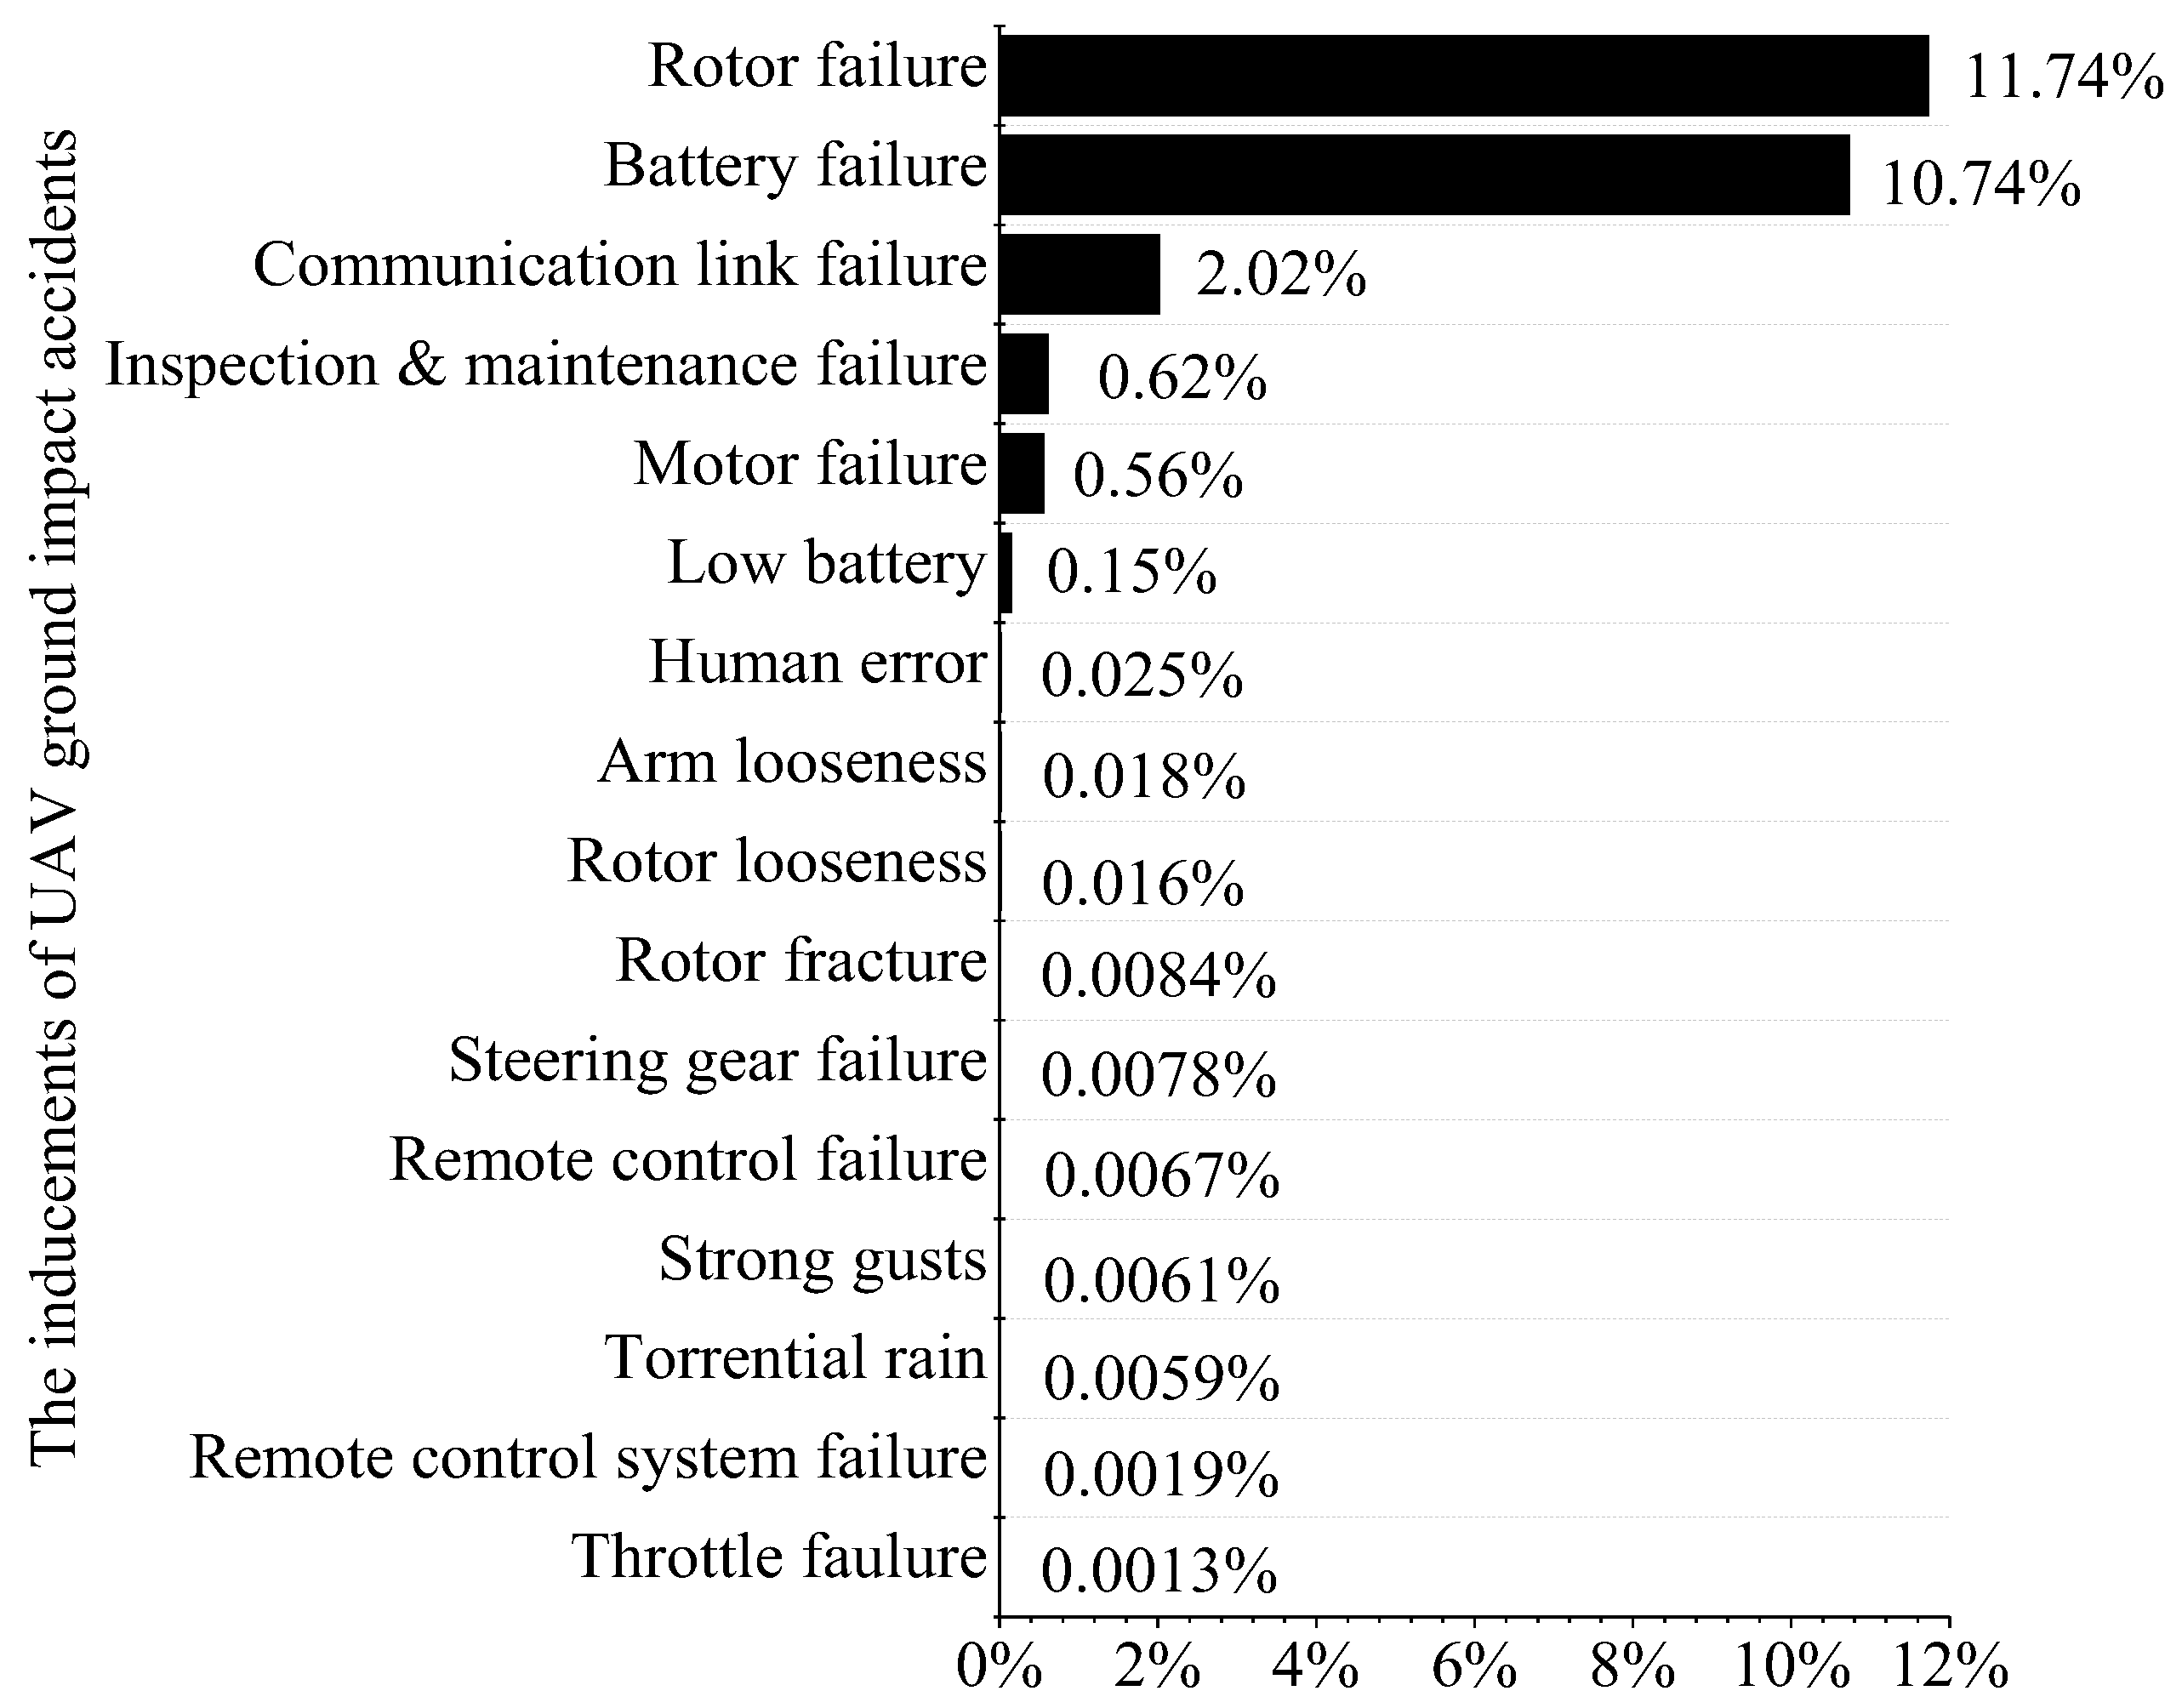
1.2. Incidents and Their Respective Failures History

At the same time of rapid development, many public safety incidents have occurred in the flight of urban logical UAV. On January 2021, hundreds of UAVs crashed to the ground due to the failure of the main control computer during the formation flight in Chaotianmen square, Chongqing. On May 2020, in Hong Kong, a four-axis rotor UAV crashed out of control due to interference. On June 2019, in Yangzhou City, a four-axis rotor UAV crashed out of control due to an operation error. On May 2019, in Qingdao, the battery of a four-axis rotor UAV fell, causing the front windshield of the bus to be smashed. Compared with traditional transport aircraft and general-purpose aircraft, although UAVs are small in size, they have a large number, lower flight altitude and are close to the ground. Therefore, the risk of injury to ground personnel and property cannot be underestimated.
The above cases are summarized in Table 2.
The above examples show that, during the rapid development of UAV, under the joint action of many adverse factors, such as UAV system failure, operator misoperation, electromagnetic interference, and bad weather, small rotor UAVs operating in cities have the risk of falling to the ground and injuring people and objects; this issue is worthy of special attention. From the cause and form of the accident, there are not only free falls after UAVs go completely out of control, but also dynamic impact caused by operator error, and re-crash after impact. At the same time, due to the flight close to the ground and close to the crowd, in addition to the general blunt damage, the rotating rotor will cause greater splitting damage to the human body. Although the above unsafe incidents are not caused by logistics UAVs, they are small rotor UAVs flying in cities. If they cannot ensure flight safety and reduce injuries to people and objects, it will undoubtedly be very unfavorable to industrial development.
Based on the operation data of about 20,000 flight hours and 100,000 takeoff and landings of urban logistical UAV accumulated in Hangzhou, this paper assessed the risk and mitigation of urban logistical UAV. This paper aims to analyze the factors affecting the safety of urban logical UAV, obtain effective risk-mitigation measures, and provide a safety barrier for UAV to integrate into low-altitude airspace. Starting from the processing of actual operation data, this paper constructs a quantitative risk assessment model and provides an application case in Hangzhou to provide theoretical support for UAV quantitative risk assessment. The contributions and highlights of this work are summarized as follows:
(1)
Based on the accumulated operation data of UAVs in urban logistical scene and investigation of the ground impact incidents, failure causal factors and failure modes are classified and summarized.
(2)
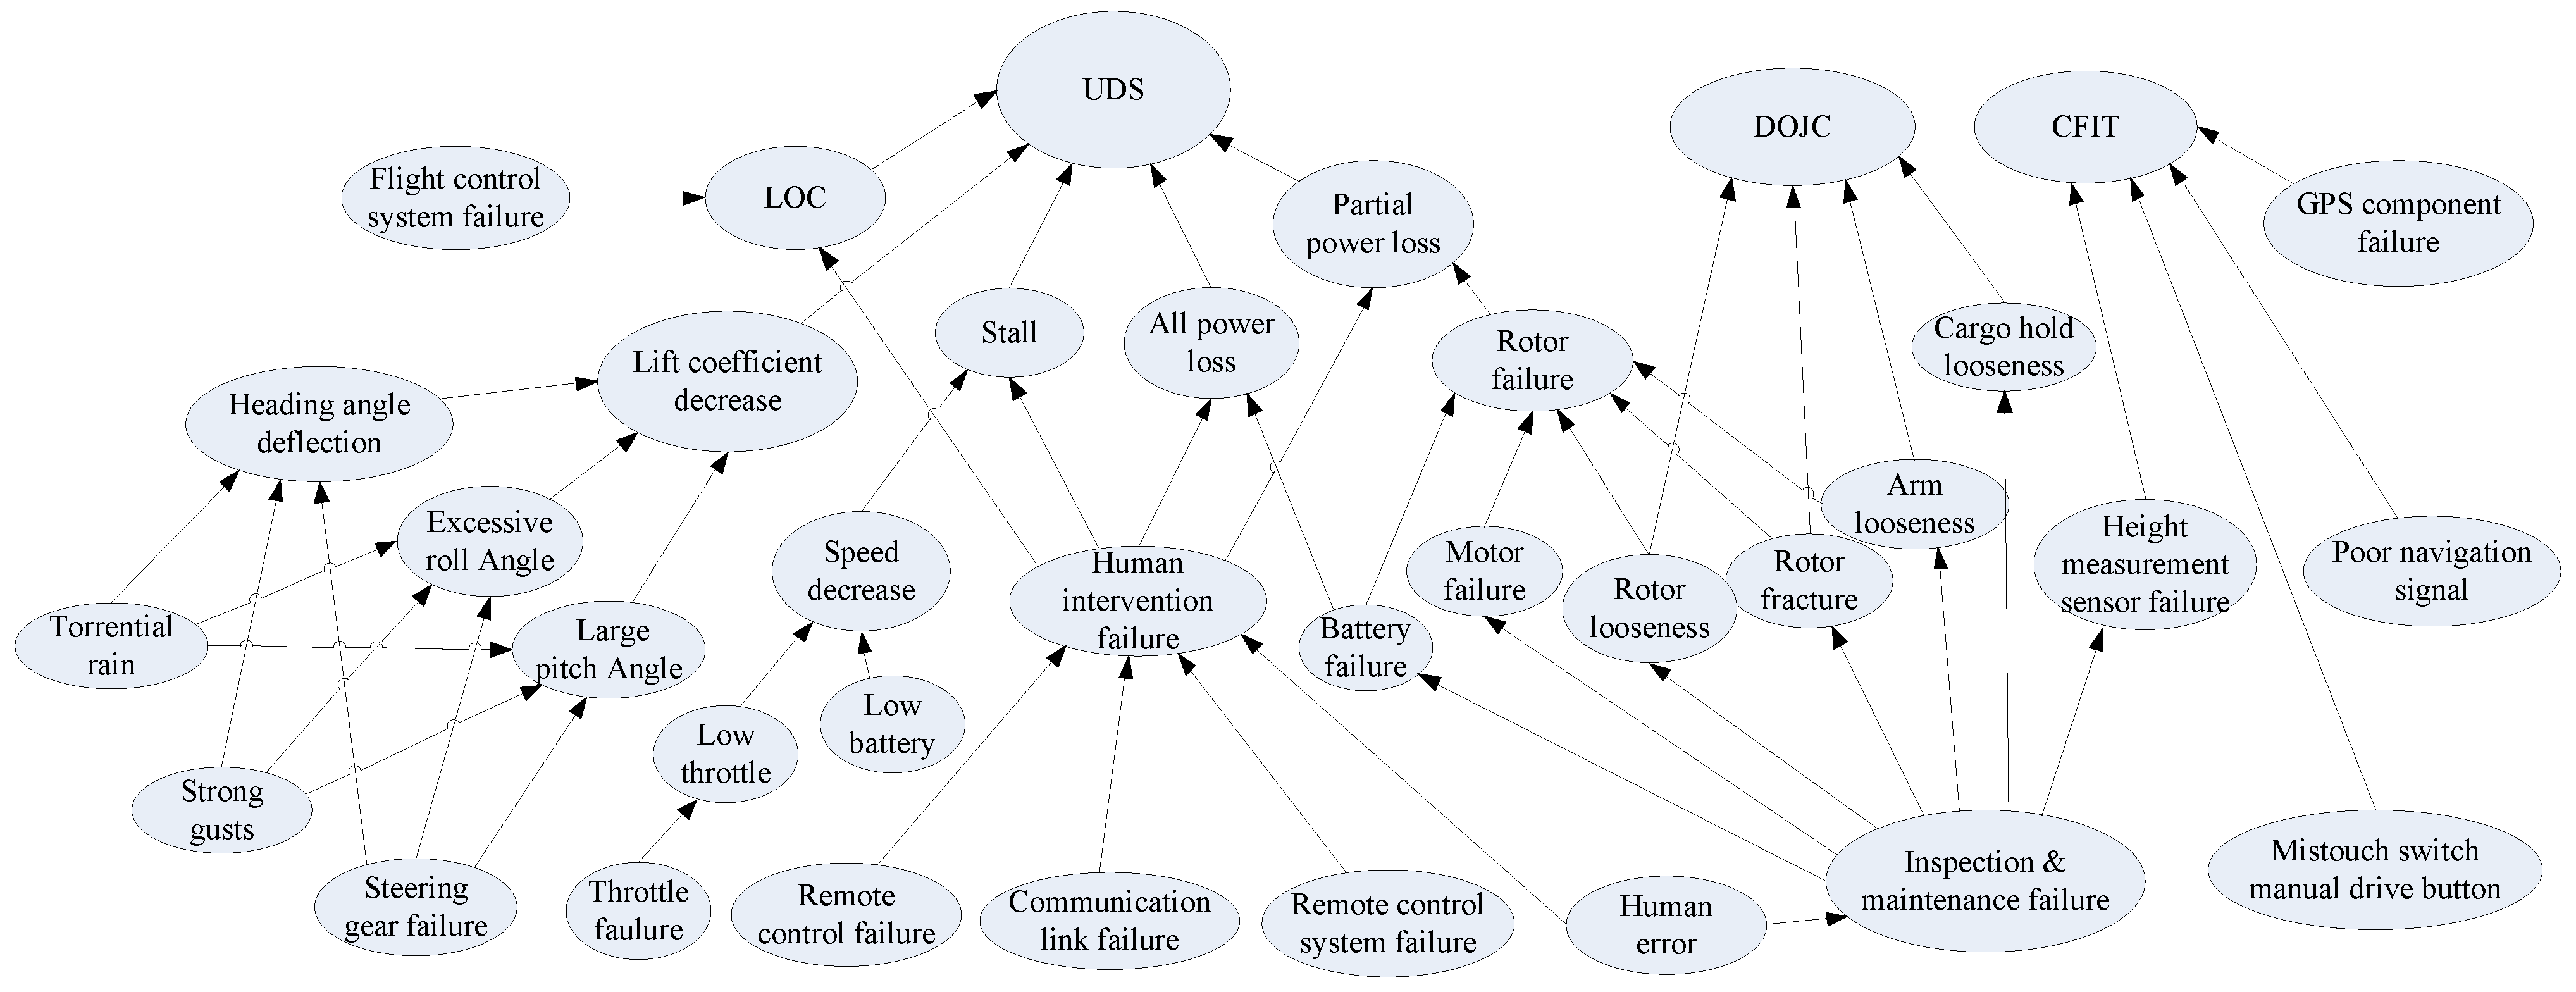
The risk assessment model based on the Bayesian network is built. The main risk sources affecting the operation safety of UAVs in urban scene are obtained respectively.
(3)
Mitigation measures are established to achieve the equivalent safety level of manned aviation, aiming at the main causes of accidents.
Section 2 is the analysis of the failure causal factors of urban logistical UAV. Section 3 gives the failure assessment model and quantitative evaluation model. Section 4 gives the quantitative assessment of ground risk and discussions on results. Section 5 contains the conclusions.
The specific vocabularies used in this article are listed as follows. Operation risk defined as the risk of injury to third parties in the air or on the ground or damage to critical infrastructure on the ground while UAVs are operating in existing airspace. Ground-impact risk assessment defined as qualitative or quantitative assessment carried out on the possibility of UAV ground impact accidents and the harm degree of accidents and formulated reasonable risk-mitigation measures. Failure causal factor means factors which cause system failure in the operation of UAV. Casualty defined as the people sustaining injuries of a certain severity and over. The casualty rate is based on injury cases that required hospitalization or transfer to other facilities, such as trauma centers.

2. Causal Factors

JARUS has published Guidelines on Specific Operations Risk (SORA). The risk identification method in the operation of UAV was also provided in the document. In the process of this study, the risk identification method recommended by SORA was used. Based on the operation data, the failure causal factors were classified into three categories: UAV system, operation environment, and human factors.

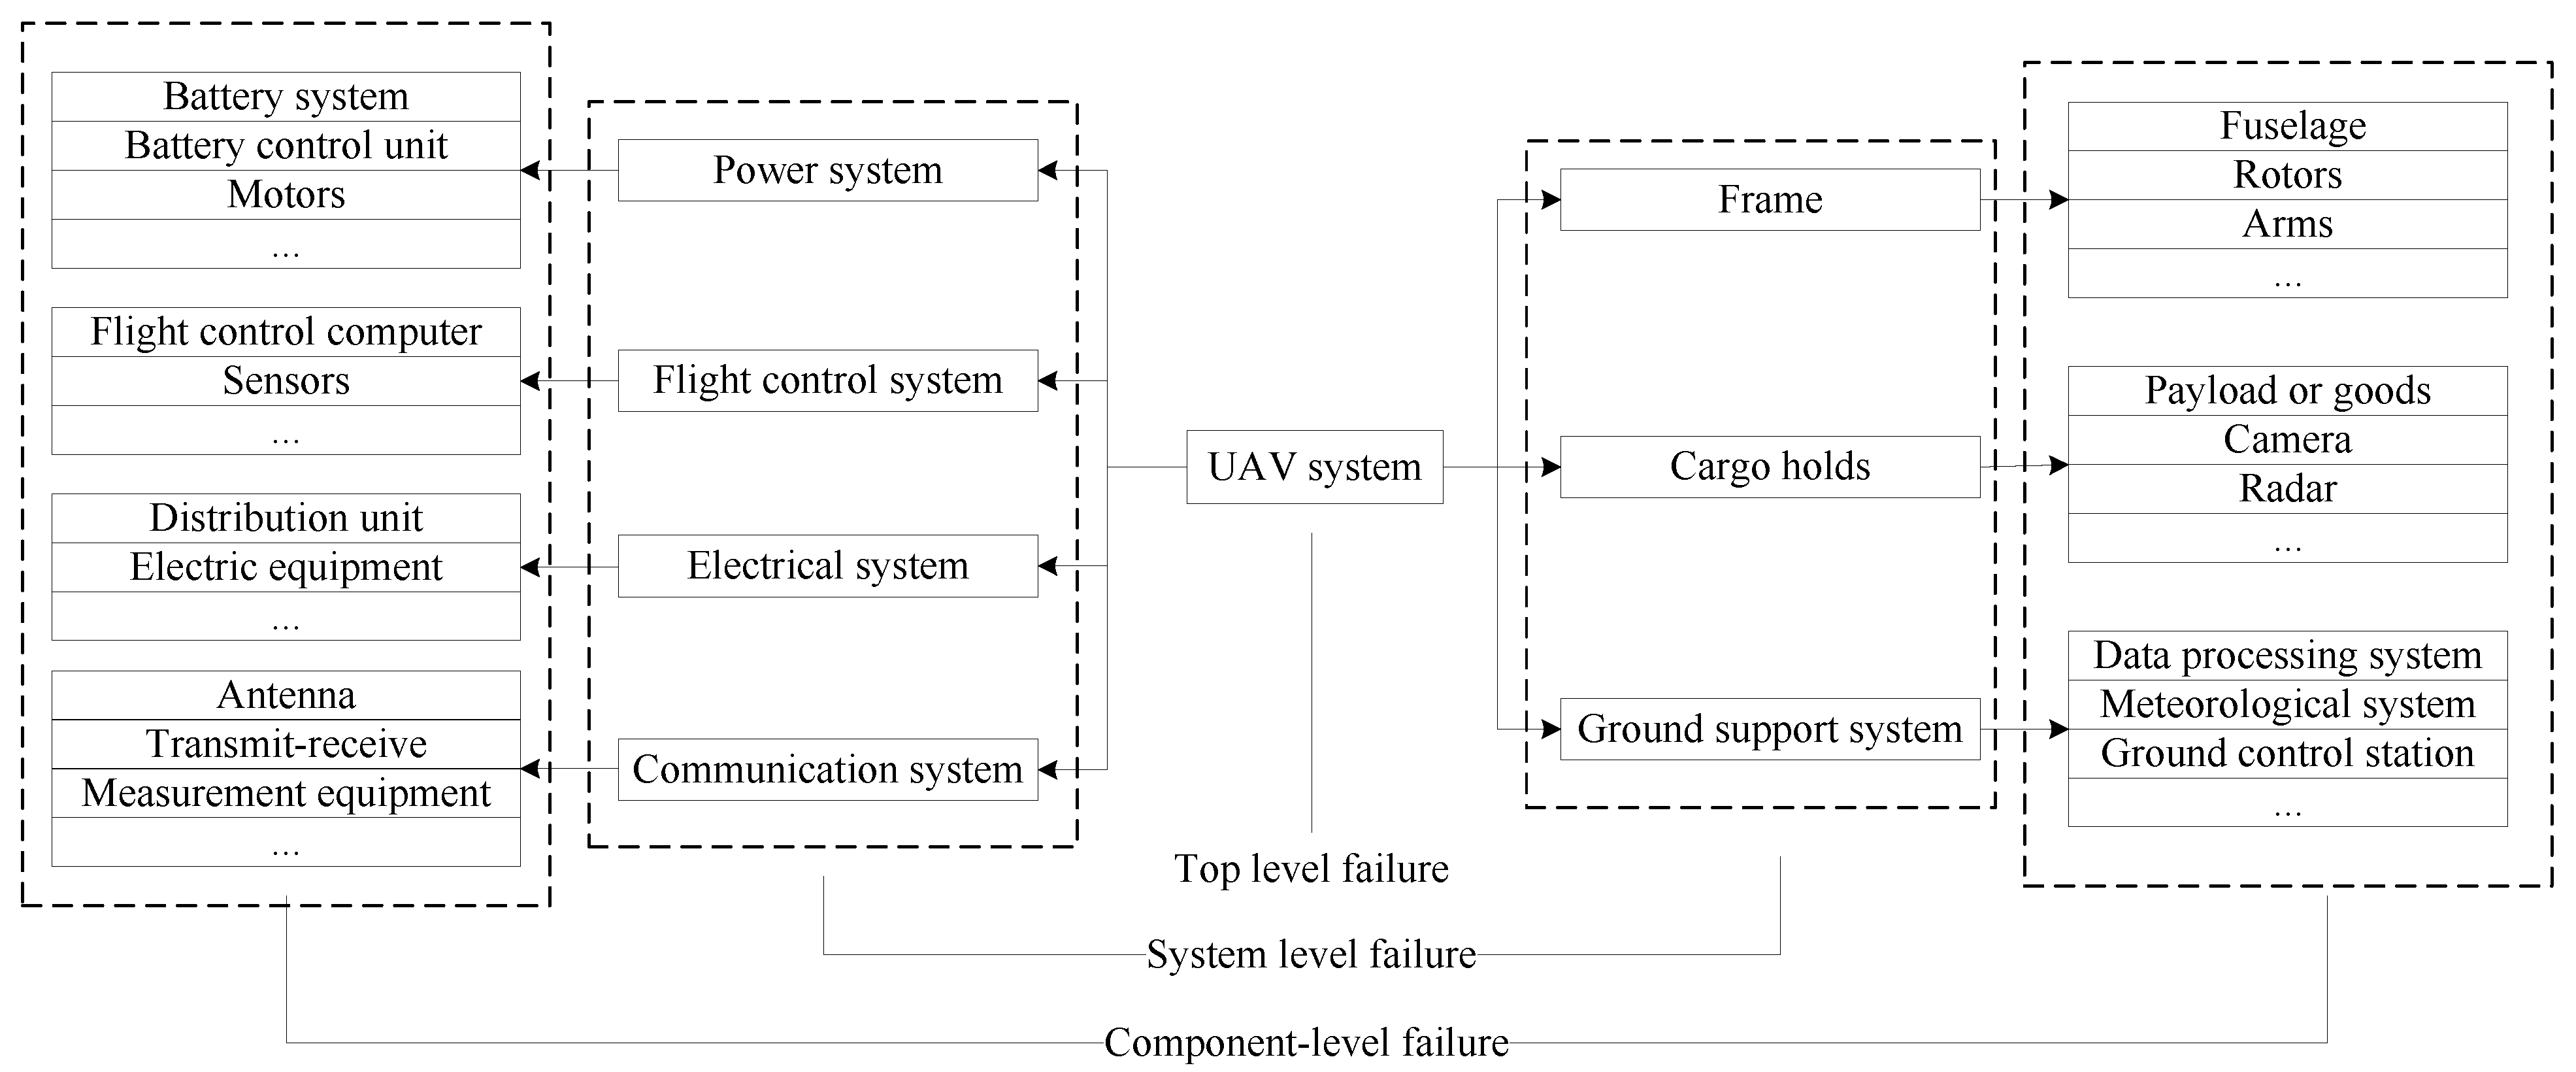
2.1. UAV System Failure

Take the logistical UAV which operated in Hangzhou as an example; the propulsion system and electronic devices are powered by lithium battery. Horizontal and vertical orientation is carried out through a GPS module and barometric altimeter. The delivery order for goods and planned distribution path are transmitted to the flight control system onboard wirelessly. The observer on the ground could monitor the flight status and take over flight control in case of emergency through the cloud connection control system. The rotors are driven by each motor, which provided a lift for the UAV and controlled the freedom of pitch, roll, and yaw. The goods were stored in the payload housing underneath the UAS. The process of takeoff and landing should rely on simple platform or the ground station. The landing targets on the ground were identified by the camera on board to ensure safe landing.
As shown in Figure 1, the typical structure of a UAV system includes a power system, electrical system, propulsion system, communication system, flight control system and relevant sensors, ground control system, and cargo loading devices [19]. Each system is composed of substructures and components. Any failure of the substructure may result in failure at the system level. According to the operation scene of urban logistical UAV and the statistical results of operation data of relevant enterprises, the failure causal factors of UAV components were analyzed.
The operation data, including the UAVs data, operational data, and maintenance information, are recorded in each flight. The pre-flight data include flight plan, predicted track, and pilot qualification information. The in-flight data include UAV operation time, takeoff and landing points, actual track, flight video data, and data link command data. The post-flight data include maintenance records, fault records, fault cause analysis, and other texts. The data sets of BN analysis are taken from the record. The authors put emphasis on the fault records and the comparison of the predicted track and actual track. Based on this consideration, the authors had carried out work in the early stage to extract the UAV failure probability under different causal factors from the operation data. Firstly, the operation scenarios according to the records of meteorological conditions and operation environment of each task are classified. Then the failure probability, failure form, and flight time records under each scenario are counted. According to the flight mode and system structure, the statistical results obtained from the cumulative flight hours were summarized in the operation database for various equipment failures of UAV, as shown in Table 3.

2.2. Environment Causal Factors

The environment causal factors are mainly related to the weather conditions, including strong gusts and torrential rain [20]. UAV operation would be greatly affected when the weather conditions exceeded the maximum indicator. A strong gust mainly leads to the change of flying altitude, which may cause the UAV to become out of control further. At the same time, the aircraft needs to use excessive power to maintain its altitude to fly in windy conditions, and this could lead to a crash. Torrential rain would mainly cause the short circuit of the electrical system and other electronic components of the UAV. Since it should be predetermined if the UAV should be sent out on a mission under bad environment weather, the probability of environment causal factors used here was conservative.

2.3. Human Factors

The operation support personnel include drone pilots and maintenance personnel. Failures caused by the pilots fell into the following two categories [21]. The first was mistakenly touching the manual driving button which switched from autopilot flight mode to manual. Since the UAV was still under the control of the pilots at this time, it should be classified as a controlled flight into terrain. The second was human intervention error. The pilots failed to take over the drone or performed correction actions after equipment failure, which may result in a crash. Among these incidents, the statistical probability of pilots’ mistakenly touching the manual driving button was about 2.1 × 10⁻⁸, and the probability of human intervention error was about 7.2 × 10⁻⁶.
Failure caused by ground maintenance personnel was mainly due to inspection or maintenance errors. The inspection or maintenance error could be divided into battery inspection error, rotor inspection error, motor inspection error, sensors inspection error, and so on. These errors would increase the risk of failure rate of corresponding components. Among them, frequency error of the remote-control equipment may lead to communication failure.

3. Methodology and Models

3.1. Failure Assessment Model

3.1.1. UAV Failure Mode

Based on the statistical results of operation data and the existing literature [22], UAV failure modes could be classified into four categories: loss of control (LOC), unpremeditated descent scenario (UDS), controlled flight into terrain (CFIT), and dropped or jettisoned components (DOJCs). The detailed definitions of each failure mode are shown in Table 4.

3.1.2. Bayesian Network

The Bayesian network was suitable to solve complex joint probability distribution problem by breaking it into a series of relatively simpler factors through probabilistic reasoning. The difficulty of knowledge acquisition and uncertain reasoning problems could be reduced. Bayesian networks were based on Bayesian formulas in probability theory. The independent relation between variables was described by directed acyclic graphs based on network framework. A Bayesian network consists of a set of discrete nodes. There was a directed edge to describe the causal relationship between each two nodes. The edge pointed from the parent node to the child node. The Conditional Probability Table (CPT) was used to describe the probabilistic relationship. The conditional probability table for each node included all possible combinations of its parent nodes. The dependence of variables was described on their parent nodes with conditional probability distribution. The probability distribution and joint distribution attached to each variable could be calculated by the following formula [23].
P X 1 , , X i = i = 1 n P X i π X i
A Bayesian network can conduct qualitative and quantitative analysis at the same time; meanwhile, this algorithm can also be applied to the situation of high uncertainty in the absence of historical data. Moreover, the flexibility of causal relationship nodes in the network also suits for diversified configurations of different UAVs.
Based on the analysis of safety accidents of drones, the causal relationship of ground impact accidents was analyzed, and the networks between failure mode and causal factors were connected through a directed acyclic graph. Considering the causal factors and intermediate events, the Bayesian network of a UAV ground-impact accident is shown in Figure 2.
Based on the Bayesian topology network constructed in Figure 2 and the prior probability of causal factors in Table 2, the failure probability of various failure modes that can happen in the operation of the logistical UAV without risk-mitigation measures was calculated, as shown in Table 5.

3.2. Quantitative Evaluation Model

In order to evaluate the hazard of a ground-impact accident, the safety of ground personnel was taken into account as the primary factor, and the casualties of ground-impact accident per flight hour was selected as the quantitative index by referring to the risk assessment standard of civil aviation. The casualties per flight hour were related to the number of ground population affected by the accident and the casualty rate of the accident, as shown in Formula (2).
N f = N e × P f
where N f refers to the casualties in the ground impact accident per flight hour; P f means the probability of casualties of the ground impact accident per flight hour; and N e refers to the number of ground population affected by the accident. The probability of casualties could be expressed as follows:
P f = P U × P h
where P U is the probability of ground impact accident per flight hour, and P h is the casualty rate. The number of ground population affected by the accident could be expressed as the product of the area affected by accident and the population density of this area. Formula (2) could be expressed as follows:
N f = A e ρ P U × P h
where A e is the area affected by the accident, and ρ is the population density of the region.
The casualty rate for the ground-impact accident was related to a few factors, such as operation speed, altitude, type of UAV (rotor or fixed wing), and the protection ability of ground shelter (such as buildings or trees). Considering the impact energy, shield protection coefficient, and personnel injury threshold [7], the empirical formula of casualty rate is shown as follows [16]:
P h = 1 k 1 2 k + α β β E i 3 P s
where P s is the protection coefficient of ground shelter, its value range is P s 0 , , and the average value is 1; α is the impact energy required for 50% casualty rate when P s = 6 , and it could be valued as 100 kJ; β is the energy threshold of casualties when P s approaches 0, and it is set as 34 J; E i is the kinetic energy of the UAV when the ground-impact accident occurs; and k is the correction factor. As was shown in the following formula, 1.4 times of the maximum design speed was adopted as the estimated kinetic energy velocity.
E i = 1 2 m V i 2 = 1 2 m 1.4 V o p 2
where m is the mass of UAV, and V o p is the maximum design speed.

4. Results and Discussion

4.1. Calculation Parameters and Results

The design parameters of the selected urban logistical UAV for distribution tasks are shown in Table 6.
According to the above analysis, the population density and ground shelter were closely related to the operational risk. Combined with the actual flight data in operation, three representative mission scenarios were selected to describe the population density and ground shelter protection coefficient of each operation area, respectively, which are named as P1 to P3. The parameters of each scenario are shown in Table 7 [24]. The scenario P1 described the sparsely populated areas which selected the population density and shelter properties in rural areas as a template. Considering that high vegetation coverage could provide more protection to ground personnel, the protection coefficient was set to 6. The scenario P2 described the densely populated areas when UAV carried out distribution tasks in urban suburbs. In this scene, the population density was higher, while the vegetation coverage was lower. The scenario P3 was in the population gathering area for logistical distribution tasks in urban commercial settlements. In this scene, the population density was very high, and the ground personnel were seldom protected by the shelter.
According to the failure probability of the UAV system listed in Table 4, the casualty rate under three mission scenarios was calculated, respectively. Without risk-mitigation measures, the casualty rate of urban logistical UAV reached 6.2 × 10⁻⁴. The European Aviation Safety Agency (EASA) had proposed the Equivalent Safety Level Concept (ELS) in order to evaluate the operational risks of UAV, which required that the UAV system should not cause higher risks to the ground personnel than the corresponding manned aircraft [25]. At present, the risk of air transport was about 5.26 × 10⁻⁷ for each takeoff and landing. The existing target level of safety criteria provided in the Federal Aviation Administration (FAA) System Safety guidelines is about 10−9. The calculated probability exceeded the acceptable safety risk threshold at present. Therefore, it was necessary to analyze the causes and intermediate events under different working conditions and set risk mitigations according to the accident development process.

4.2. Risk Mitigation

The causal factors and probability of UAV failure were the basis and source of operation risk assessment [26,27]. The origin of injuries caused by UAV system failure was the failure of the UAV system. Due to the lack of research on the reliability of the UAV system and components, the operation data could only be used as the breakthrough point in the existing research process. The results could provide a basis for UAV risk mitigations.

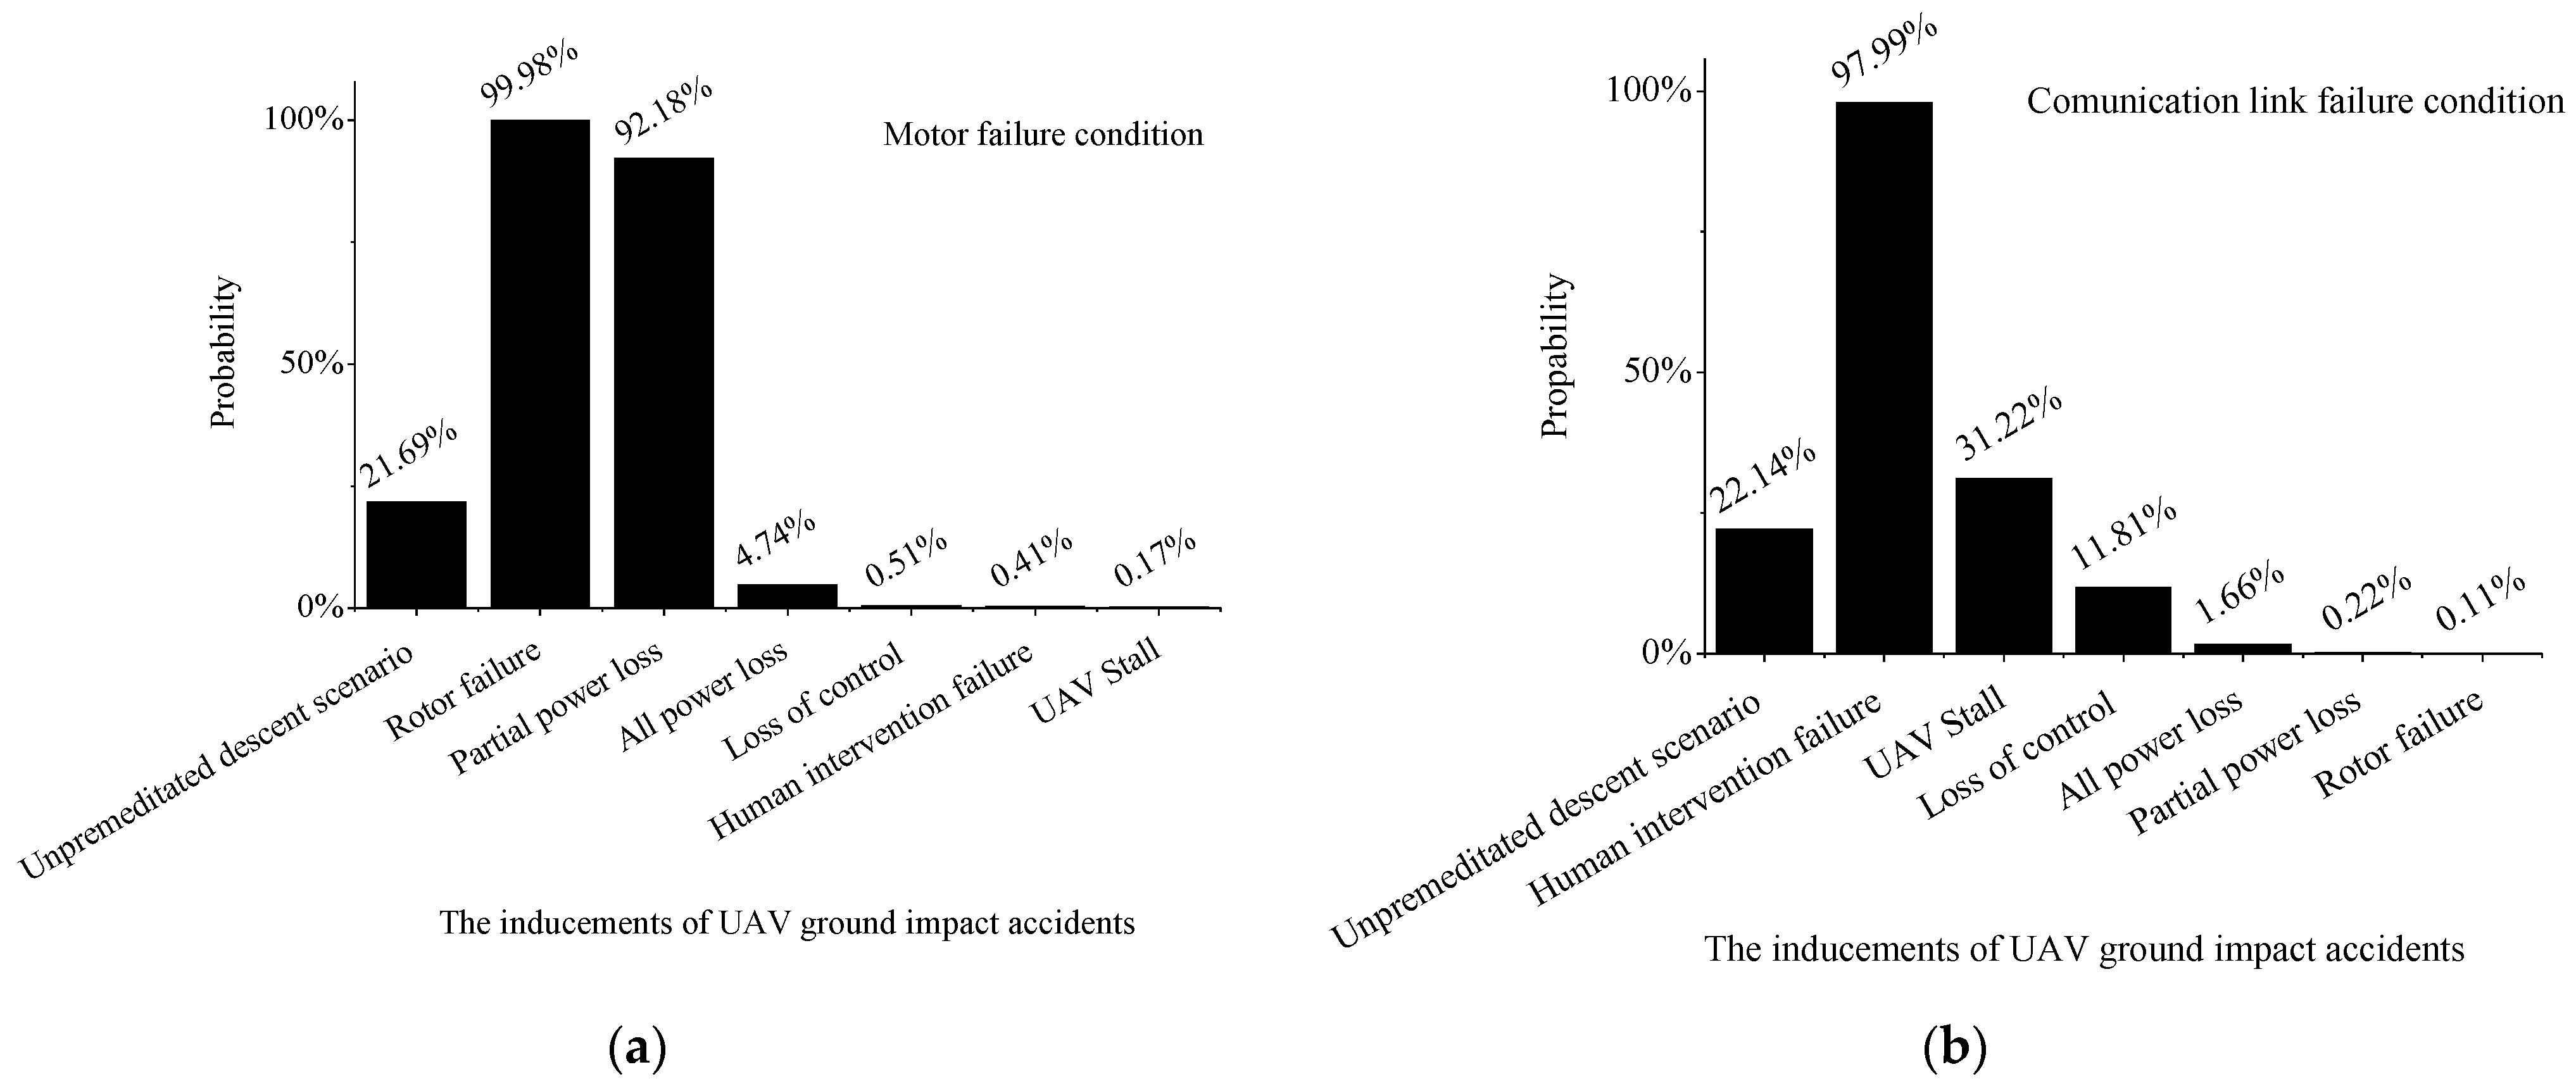
4.2.1. Risk Analysis of Ground-Impact Accident

Based on the equivalent safety level, the failure rate of the UAV system for the scenario P3 should be less than 1.74 × 10⁻⁶, which put forward high requirements for the reliability of UAV system. In order to formulate reasonable risk-mitigation measures, the development process of ground-impact accidents with different failure causal factors and the posterior probability of each failure causal factors were analyzed. Taking motor failure and communication link failure as examples, the accident probability and intermediate events were calculated, respectively. As shown in Figure 3, under the motor failure condition, the accident probability was 21.69%. Among these factors, the highest probability was rotor failure and partial power loss, which were 99.98% and 92.18%, respectively. Under the communication link failure condition, the accident probability was 22.14%. The probability of human intervention failure took the highest position of intermediate accident (97.99%). Stall and control failure followed closely. The results of these two conditions clearly demonstrated the occurrence probability of each intermediate event in the development process of different UAV accident causal factors to the ground-impact accident.
The posterior probability of each intermediate event calculated according to the Bayesian network and conditional probability table is shown in Figure 4. As shown in the figure, the probability of control failure and change of lift coefficient were 83.27% and 70.81%, respectively, which ranked top two in the middle accident. The result indicated that these two circumstances were high incidences of ground-impact accident. The probabilities of human intervention, failure, stalling, or lost power followed behind.
The probability of each accident factor is shown in Figure 5. Among them, low battery power, rotor failure, and battery failure were three major causal factors of the ground-impact accident. Communication link failure, motor failure, and inspection and maintenance failure were also major risk sources.

4.2.2. Formulation and Effect of Risk-Mitigation Measures

Based on the risk analysis results, risk-mitigation measures were respectively set for these four failure modes. The main idea of these measures was to increase the redundancy of equipment and reduce the risk caused by operation support personnel. The first mitigation was to equip the UAV with two independent power systems. In daily operation, the UAV was powered by the main power source. When the main power failed or was insufficient, the flight control system would automatically switch the power source to the standby power source and immediately executed the emergency return procedure to realize the seamless connection of the power system. This measure greatly reduced the failure probability of the UAV system in practical operation. Secondly, it stipulated that the support personnel must carry out cross-inspection. For the key part of operation, two ground-support personnel jointly checked and signed. Although the operation efficiency was reduced to a certain extent, this measure also significantly reduced the failure probability of the UAV system caused by human error. Thirdly, the replacement cycle of equipment consumables such as rotors should be shortened to reduce the failure probability from the perspective of system reliability. Finally, in regard to the point of view of the operating environment, the weather information on ground stations was connected to ensure that the meteorological conditions within the coverage of the air route were suitable for UAV operation. According to the risk-mitigation measures formulated according to the distribution of accident failure incentives, the probability of actual operational risk of logistical UAV decreased to 3.84 × 10⁻⁸ based on statistical data.

5. Conclusions

The tasks and environmental scenarios in the operation of urban logistical UAV were described. Failure causal factors and failure modes based on the operational data of actual logistical distribution were analyzed, and the risk assessment model was established based on the Bayesian network. According to the probability of the failure causal factors and the conditional probability, the probability of a UAV ground-impact accident was estimated. On this basis, casualties per flight hour were selected as the quantitative index to evaluate the severity of accidents. In order to reach the equivalent safety level of manned aviation, the causes of the accident were analyzed according to the Bayesian network, and the risk-mitigation measures were implemented according to frequent events and causal factors. Among them, battery power shortage, partial rotor failure, and battery failure were the three main causes of ground-impact accidents, which provided a basis for the formulation of risk-mitigation measures. Under these risk-mitigation measures, the operational risk of the logistical UAV was reduced to 3.84 × 10⁻⁸. In view of the ground personnel, safety was the primary risk of UAV operation; in the subsequent operation, it is still necessary to continuously carry out statistics and an analysis of the data and formulate relevant mitigation measures to reduce the probability of ground-impact accidents.

Author Contributions

Data curation, P.H., X.Y. and Y.Z.; formal analysis, P.H.; investigation, X.G.; resources, S.W.; writing—original draft, P.H. All authors have read and agreed to the published version of the manuscript.

Funding

This research was supported by the National Natural Science Foundation of China (National Natural Science Foundation of China, E52102419); Zhe Jiang Key laboratory of General Aviation Operation Technology (JDGA2020-8); and Key Laboratory of Flight Techniques and Flight Safety, CAAC (Open Fund of Key Laboratory of Flight Techniques and Flight Safety, CAAC, No. FZ2021KF17); Civil Aviation University of China (Talent scientific research startup fund of Civil Aviation University of China 2017QD09X).

Institutional Review Board Statement

Not applicable.

Informed Consent Statement

Not applicable.

Data Availability Statement

Data can be made available upon request.

Conflicts of Interest

The authors declare no conflict of interest.

References

  1. Guo, Y.; Fu, Y.H.; Chen, S.; Bryant, C.R.; Li, X.; Senthilnath, J.; Sun, H.; Wang, S.; Wu, Z.; Beurs, K. Integrating spectral and textural information for identifying the tasseling date of summer maize using UAV based RGB images. Int. J. Appl. Earth Obs. Geoinf. 2021, 102, 102435. [Google Scholar] [CrossRef]
  2. Joachims, T. Making Large-Scale SVM Learning Practical. Tech. Rep. 1998, 8, 499–526. [Google Scholar]
  3. Joint Authorities for Rulemaking of Unmanned Systems (JARUS). JARUS Guidelines on Specific Operations Risk Assessment (SORA), 2017. Available online: http://jarus-rpas.org/content/jar-doc-06-sora-package (accessed on 5 April 2022).
  4. International Civil Aviation Organization (ICAO). 2016-2030 Global Air Navigation Plan Fifth Edition (Doc 9750 AN/963); ICAO: Montreal, QC, Canada, 2016. [Google Scholar]
  5. Knott, M.; Cochran, R.; Burke, D. Third Party Risk Assessment Tool (3PRAT); Naval Air Warfare Centre Aircraft Division: Patuxent River, MD, USA, 2012. [Google Scholar]
  6. Lum, C.W.; Waggoner, B. A risk based paradigm and model for unmanned aerialsystems in the national airspace. In Proceedings of the AIAA Infotech Aerospace 2011 Conference, St. Louis, MO, USA, 29–31 March 2011; pp. 1–31. [Google Scholar]
  7. Barr, L.C.; Newman, R.L.; Ancel, E.; Belcastro, C.M.; Foster, J.V.; Evans, J.; Klyde, D. Preliminary risk assessment for small unmanned aircraft systems. In Proceedings of the 17th AIAA Aviation Technology, Integration, and Operations Conference, Denver, CO, USA, 5–9 June 2017. [Google Scholar]
  8. Ancel, E.; Capristan, F.M.; Foster, J.V.; Condotta, R.C. Real-time risk assessment framework for unmanned aircraft system (UAS) traffic management (UTM). In Proceedings of the 17th AIAA Aviation Technology, Integration, and Operations Conference, Denver, CO, USA, 5–9 June 2017; pp. 1–17. [Google Scholar]
  9. Kevorkian, C.G. UAS Risk Analysis Using Bayesian Belief Networks: An Application to the VirginiaTech ESPAARO. Ph.D. Thesis, Virginia Tech, Blacksburg, VA, USA, 2016. [Google Scholar]
  10. Ford, A.T.; McEntee, K.J. Assessment of the risk to ground population due to an unmanned aircraft in-flight failure. In Proceedings of the 10th AIAA Aviation Technology, Integration, and Operations (ATIO) Conference, Fort Worth, TX, USA, 13–15 September 2010; pp. 1–12. [Google Scholar]
  11. Belcastro, C.M.; Newman, R.L.; Evans, J.; Klyde, D.H.; Barr, L.C.; Ancel, E. Hazards Identification and Analysis for Unmanned Aircraft System Operations. In Proceedings of the 17th AIAA Aviation Technology, Integration, and Operations Conference, Denver, CO, USA, 5–9 June 2017; p. 3269. [Google Scholar]
  12. James, M.R.; Robson, S. Mitigating systematic error in topographic models derived from UAV and ground-based image neworks. Earth Surf. Processes Landf. 2014, 39, 1413–1420. [Google Scholar] [CrossRef] [Green Version]
  13. Weibel, R.E.; Hansman, R.J. Safety Considerations for Operation of Unmanned Aerial Vehicles in the National Airspace System; MIT International Center for Air Transportation: Cambridge, MA, USA, 2005. [Google Scholar]
  14. Weibel, R.E. Safety considerations for operation of different classes of unmanned aerial vehicles in the National Airspace System. In Proceedings of the AIAA 3rd Unmanned Unlimited Technical Conference, Chicago, IL, USA, 20–23 September 2004. [Google Scholar]
  15. Dalamagkidis, K.; Valavanis, K.P.; Piegl, L.A. Evaluating the risk of unmanned aircraft ground impacts. In Proceedings of the 16th Mediterranean Conference of Control and Automation, Ajaccio, France, 25–27 June 2008; pp. 709–716. [Google Scholar]
  16. Dalamagkidis, K.; Valavanis, K.P.; Piegl, L.A. On Integrating Unmanned Aircraft Systems into the National Airspace System: Issues, Challenges, Operational Restrictions, Certification, and Recommendations; Springer Science and Business Media: Berlin, Germany, 2011. [Google Scholar]
  17. Lum, C.W.; Dai, A.T. UAS Reliability and Risk Analysis; John Wiley and Sons, Ltd.: Hoboken, NJ, USA, 2016. [Google Scholar]
  18. Tyagi, A.; Zhang, Y.; Toussaint, S.; Luxhoj, J.T. Strategies to Model System Risk Using UAS Safety Analysis Model (USAM). In Proceedings of the 16th AIAA Aviation Technology, Integration, and Operations Conference, Washington, DC, USA, 13–17 June 2016. [Google Scholar]
  19. Balestrieri, E.; Daponte, P.; Vito, L.D.; Lamonaca, F. Sensors and Measurements for Unmanned Systems: An Overview. Sensors 2021, 21, 1518. [Google Scholar] [CrossRef] [PubMed]
  20. Usach, H.; Vila, J.A.; Gallego, U. Trajectory-Based, Probabilistic Risk Model for UAS Operations. In Risk Assessment in Air Traffic Management; IntechOpen: London, UK, 2020. [Google Scholar]
  21. Madasu, V.K. A generic model for quantification of risk posed by UAS ground impacts. In Proceedings of the Aiac16 Australian International Aerospace Congress, Melbourne, Australia, 23–24 February 2015. [Google Scholar]
  22. Washingtona, A.; Clothier, R.A.; Silva, J.A. Review of unmanned aircraft system ground risk models. Prog. Aerosp. Sci. 2017, 95, 24–44. [Google Scholar] [CrossRef]
  23. Zhang, L.W.; Guo, H.P. Introduction to Bayesian Networks; Science Press: Beijing, China, 2006; pp. 31–39. (In Chinese) [Google Scholar]
  24. Han, P.; Zhao, Y. Study on ground impact risk of UAV based on flight environment. China Saf. Sci. J. 2020, 30, 142–147. [Google Scholar]
  25. European Union Aviation Safety Agency (EASA). Introduction of a Regulatory Framework for the Operation of Drones. Available online: https://www.easa.europa.eu/document-library/notices-of-proposed-amendment/npa-2017-05 (accessed on 4 May 2017).
  26. Han, P.; Zhao, Y. An Air Route Planning Model of Unmanned Aerial Vehicles Under Constraints of Ground Safety. Trans. Nanjing Univ. Aeronaut. Astronaut. 2021, 38, 298–305. [Google Scholar]
  27. Denney, E.; Pai, G.; Johnson, M. Towards a Rigorous Basis for Specific Operations Risk Assessment of UAS. In Proceedings of the 2018 IEEE/AIAA 37th Digital Avionics Systems Conference (DASC), London, UK, 23–27 September 2018. [Google Scholar]
Figure 1. Typical structure of UAV system failures.
Sustainability 14 05733 g001
Figure 2. Bayesian network of UAV ground-impact accident.
Sustainability 14 05733 g002
Figure 3. Probability of each intermediate event in motor-failure condition and communication-link-failure condition: (a) motor-failure condition and (b) communication-link-failure condition.
Sustainability 14 05733 g003
Figure 4. Posterior probability distribution of intermediate events.
Sustainability 14 05733 g004
Figure 5. Probability distribution of accident causal factors.
Sustainability 14 05733 g005
Table 1. Some typical type of urban logistical UAV, operation scenarios, and risk categories.
OperatorUAV TypeOperation ScenarioCategory
Amazon“Prime Air” (Hexrcopter)Cities and Suburbs
Maximum takeoff weight of 60 lb
Distribution distance < 15 mi
Payload weight < 5 lb
Medium risk (JARUS)
Small size (FAA)
Small size (EASA)
Small size (CAAC)
JDcom“Y1” (Quadrotor)Cities and Suburbs
maximum takeoff weight of 37 kg
Distribution distance < 15 km
payload weight < 12 kg
Flight altitude < 100 m
Medium risk (JARUS)
Small size (FAA)
Small size (EASA)
Small size (CAAC)
“Y2” (Quadrotor)
S.F. Express“Ark” (Hexrcopter)Cities and Suburbs
maximum takeoff weight of 37 kg
Distribution distance < 15 km
payload weight < 12 kg
Flight altitude < 100 m
Medium risk (JARUS)
Small size (FAA)
Small size (EASA)
Small size (CAAC)
“H4” (Quadrotor)
Antwork“RA3” (Hexrcopter)Cities and Suburbs
maximum takeoff weight of 15.5 kg
Distribution distance < 15 km
payload weight < 5.5 kg
Flight altitude < 100 m
Medium risk (JARUS)
Small size (FAA)
Small size (EASA)
Small size (CAAC)
“TR7S” (Hexrcopter)
Table 2. Typical incidents and their respective causes of urban logical UAV.
CasesCause of AccidentAccident Impact
Chongqing (2021)Ground control computer downCrash after hitting a building
Hongkong (2020)Communication interferenceLoss of control and collision
Yangzhou (2019)Human operation errorHitting people by misoperation and blunt injury to the head
Qingdao (2019)UAV components fallThe battery fell and smashed the front windshield of the car
Dali (2019)Bad weatherOut of control and missing
Beijing (2018)Human operation errorMistakenly operate and hit people, and the rotor is cut and injured
Xi’an (2018)Communication interferenceFall directly
Table 3. UAV system failure causal factors and the description.
Failure
Component
DescriptionFailure Rate
MotorMotor failure caused the UAV rotor to stop rotating, which made the UAV lack of lift.1.24 × 10−4
Communication linkThe flight status of the UAV could not be monitored.5.96 × 10−4
BatteryThe battery system failure would cause lift and speed reduction.7.42 × 10−4
Cargo holdsThe cargo holds failure or loose would make the cargo hold and the transmitted goods to fall, which belonged to the failure mode of dropped or jettisoned components.8.81 × 10−5
Electron speed regulatorThe electron speed regulator failure affected the flight attitude of UAV, including heading angle, pitch angle, and roll angle. Among them, if pitch angle ≥30° or roll angle ≥28°, the aircraft may stall and fall, which belonged to the failure mode of unpremeditated descent scenario. The deflection of heading angle may cause the aircraft to fly out of the safe operation area and collide with obstacles.8.39 × 10−6
ThrottleThrottle failure could be divided into two categories: low throttle or high throttle. If the throttle was too low, the UAV would land unexpectedly due to insufficient lift, and the UAV may lose control due to a too-fast speed if the throttle is too high.7.61 × 10−6
Flight control systemThe UAV lost control. (Only contained representative out-of-control state event of the UAV due to obvious flight control logic errors.)6.71 × 10⁻⁶
Navigation systemNavigation system failure could be divided into two categories: poor navigation signal and GPS component failure. The integrity of navigation signal was determined by the horizontal positioning accuracy and satellite number. A poor navigation signal may cause switches of GPS signals, which made the UAV administrator and flight control system unable to locate UAV accurately.6.19 × 10−6
RotorRotor failure could be divided into two types: rotor fracture and rotor looseness. Among them, rotor looseness referred to the loosening of the screw fixing the rotor. The rotor fracture was caused by the rotor fatigue, aging, and other reasons. There were mainly two kinds of risks caused by rotor looseness and rotor fracture. One was the failure mode of dropped or jettisoned components due to rotor falling, and the other was the failure mode of unpremeditated descent scenario caused by the loss of rotor.4.95 × 10−6
ArmThe arm looseness would cause the arm and its associated motor and rotor to fall. At the same time, the UAV may fall due to insufficient lift, which belonged to two failure modes: unpremeditated descent scenario and dropped or jettisoned components.4.95 × 10−6
Altitude measurement sensorThe altitude measurement sensor failure would lead to the pilot being unable to accurately acquire the flight altitude, which may cause the aircraft to collide with the ground.2.13 × 10−6
Remote controlThe UAV lost control.2.13 × 10−6
Table 4. Common UAV failure modes.
Failure ModeDefinitionFailure Rate
LOCUAV loses control and has a high-speed impact on the ground.4.8 × 10−3
UDSUAV unable to maintain a safe altitude with ground objects or obstacles.7.2 × 10−3
CFITUAV accidentally collides with the terrain, such as a water surface, buildings, or obstacles while under the control of a qualified or certified autopilot.1.2 × 10−6
DOJCThe falling of UAV components (including its payload or cargo).9.6 × 10−5
Table 5. The failure probability of different UAV failure modes.
Failure ModeFailure Probability
UDS6.54 × 10−3
LOC4.11 × 10−3
CFIT1.39 × 10−6
DOJC1.28 × 10−4
Table 6. UAV type and design parameters.
UAV TypeMaximum Takeoff Weight/kgMaximum Speed/(m·s−1)Size/m
Antwork TR7S15.5201080 × 1230 × 320 mm
Table 7. Classification of task scenarios and the parameters.
No.ScenarioPopulation Density
(per km2)
Shelter Protection
Coefficient
Casualty Rate
(per Flight Hour)
P1sparsely populated areas10062.1841 × 10−6
P2densely populated areas100035.8587 × 10−5
P3population gathering area10,00016.2081 × 10−4
Publisher’s Note: MDPI stays neutral with regard to jurisdictional claims in published maps and institutional affiliations.

