Article

Assessment of Potentially Toxic Elements in the Urban Soil and Plants of Kirkuk City in Iraq

1
College of Agriculture, University of Kirkuk, Kirkuk 36001, Iraq
2
Environmental Science Department, Wageningen University and Research, 6700 AK Wageningen, The Netherlands
3
Department of Environmental Sciences, Jahangirnagar University, Dhaka 1342, Bangladesh
*
Author to whom correspondence should be addressed.
Sustainability 2022, 14(9), 5655; https://doi.org/10.3390/su14095655
Submission received: 31 March 2022 / Revised: 29 April 2022 / Accepted: 2 May 2022 / Published: 7 May 2022
(This article belongs to the Special Issue Assessment of Industrial and Man-Made Hazards Due to Chemicals)

Abstract

:
Kirkuk city is known for its industrial activities, especially oil and cement production, as well as its road traffic. The aim of this study was to assess potentially toxic elements (PTEs) in the soil and plants from urban areas by measuring pollution indices and estimating the effect that this pollution has on the environment. Leaf and soil samples were taken from 10 different locations in Kirkuk. These samples were pre-treated using the acid digestion method and concentrations of 12 elements were determined using inductively coupled plasma mass spectrometry (ICP-MS). The results indicate a high content of aluminum and magnesium (mg/kg) in the soil samples from all study sites. For leaf samples, the results showed a moderate to low amount of magnesium and aluminum. Based on our results, the PTE concentrations were found in the following order—Mg > Al > Ni > Cu > Cr > Pb > Co > As > Se > Cd > Hg > Ti—in leaf samples from all 10 study sites. However, in the soil samples, PTE concentrations were in the following order—Mg > Al > Cr > Ni > Cu > Pb > Co > As > Se > Ti > Cd > Hg—from all study sites. Pollution indices showed a moderate level of contamination of Pb, Cd, and Ni, and a high level of contamination of As and Hg in plant and soil samples from all study sites in Kirkuk city.

1. Introduction

Environmental pollution is one of the biggest challenges currently facing the globe. Pollution affects plants, animals, humans, and ecosystems. Pollution from PTEs is one of the most common forms of (inorganic) pollution, and those compounds can be found in high levels in plants and soil, especially in urbanized areas [1]. PTE levels have increased globally due to the fast-growing industrial and agricultural sectors (pesticides and fertilizers) [2]. Plants can absorb heavy metals from the air, soil, and water [3]. Therefore, concentrations of heavy metals found in plant leaves can be used as bio-monitors and bio-indicators to estimate the levels of pollution in specific geographical locations [4].
There are many PTEs that pose a risk to the environment. Cadmium, copper, lead, nickel, and mercury can be measured in areas close to roads with heavy traffic as well as industrial areas where toxic wastes such as oil, petrol, grease, and organic solvents are released into the environment [5]. Areas close to oil production fields, oil refineries, and cement companies are also known for pushing PTE concentrations in the environment to toxic levels [6]. These metals can accumulate in the food chain, eventually reaching human cells and forming complex compounds by binding to non-metallic elements such as molecular proteins [7].
PTEs such as lead and cadmium are harmful for plant growth, affecting leaves and chlorophyll. This in turn affects plant physiology and production and also causes major photochemical changes in the leaves. However, compounds like copper and zinc are crucial to maintaining healthy plant growth [8,9,10]. PTEs have long-term effects and can cause significant problems for soil sustainability. They can remain in the soil for many years, affecting the biota and contaminating water stored in the area. These pollutants can be taken up by plants and animals, and eventually transferred to humans. This contamination also affects soil quality, causing a decline in organic matter content. Research has focused on different types of soil contamination in recent years [11,12]. In urban areas, streets, domestic heating, and industrial activities are the most common source of PTE contamination [13]. In order to determine changes in soil properties and measure contamination in urban soil, agricultural soil, and mining area soil, many tools have been developed. These tools help with the early detection of changes in soil quality and protect soil for sustainable use. One example of this kind of tool is the soil monitoring network (SMN) tool developed in Europe, which has been used in many European countries for years. Researchers have provided assessments of various kinds of soil pollution in recent years, including heavy metal pollution, which helped to raise public awareness of soil contamination and pollution control [12,14]. The aim of this study was to investigate the concentrations of PTEs by measuring 12 toxic metals as a starting point for their potential abundance in soil samples and leaf samples from two trees, eucalyptus and Myrtus communis L. We wanted to see whether the industrial activities carried out in the urban area of the city were contaminating surrounding areas. By measuring pollution indices, we hoped to determine which possible effects pollution from PTEs have on the environment. Eucalyptus and Myrtus communis L. samples were taken from 10 study sites in Kirkuk city, since these are the most abundant trees located in the urban areas of the city. Since this study tried to cover most parts of the city (north, south, east, and west), it was important to keep the data synchronized and measure the PTEs in tree species that could be found in all study sites.

2. Materials and Methods
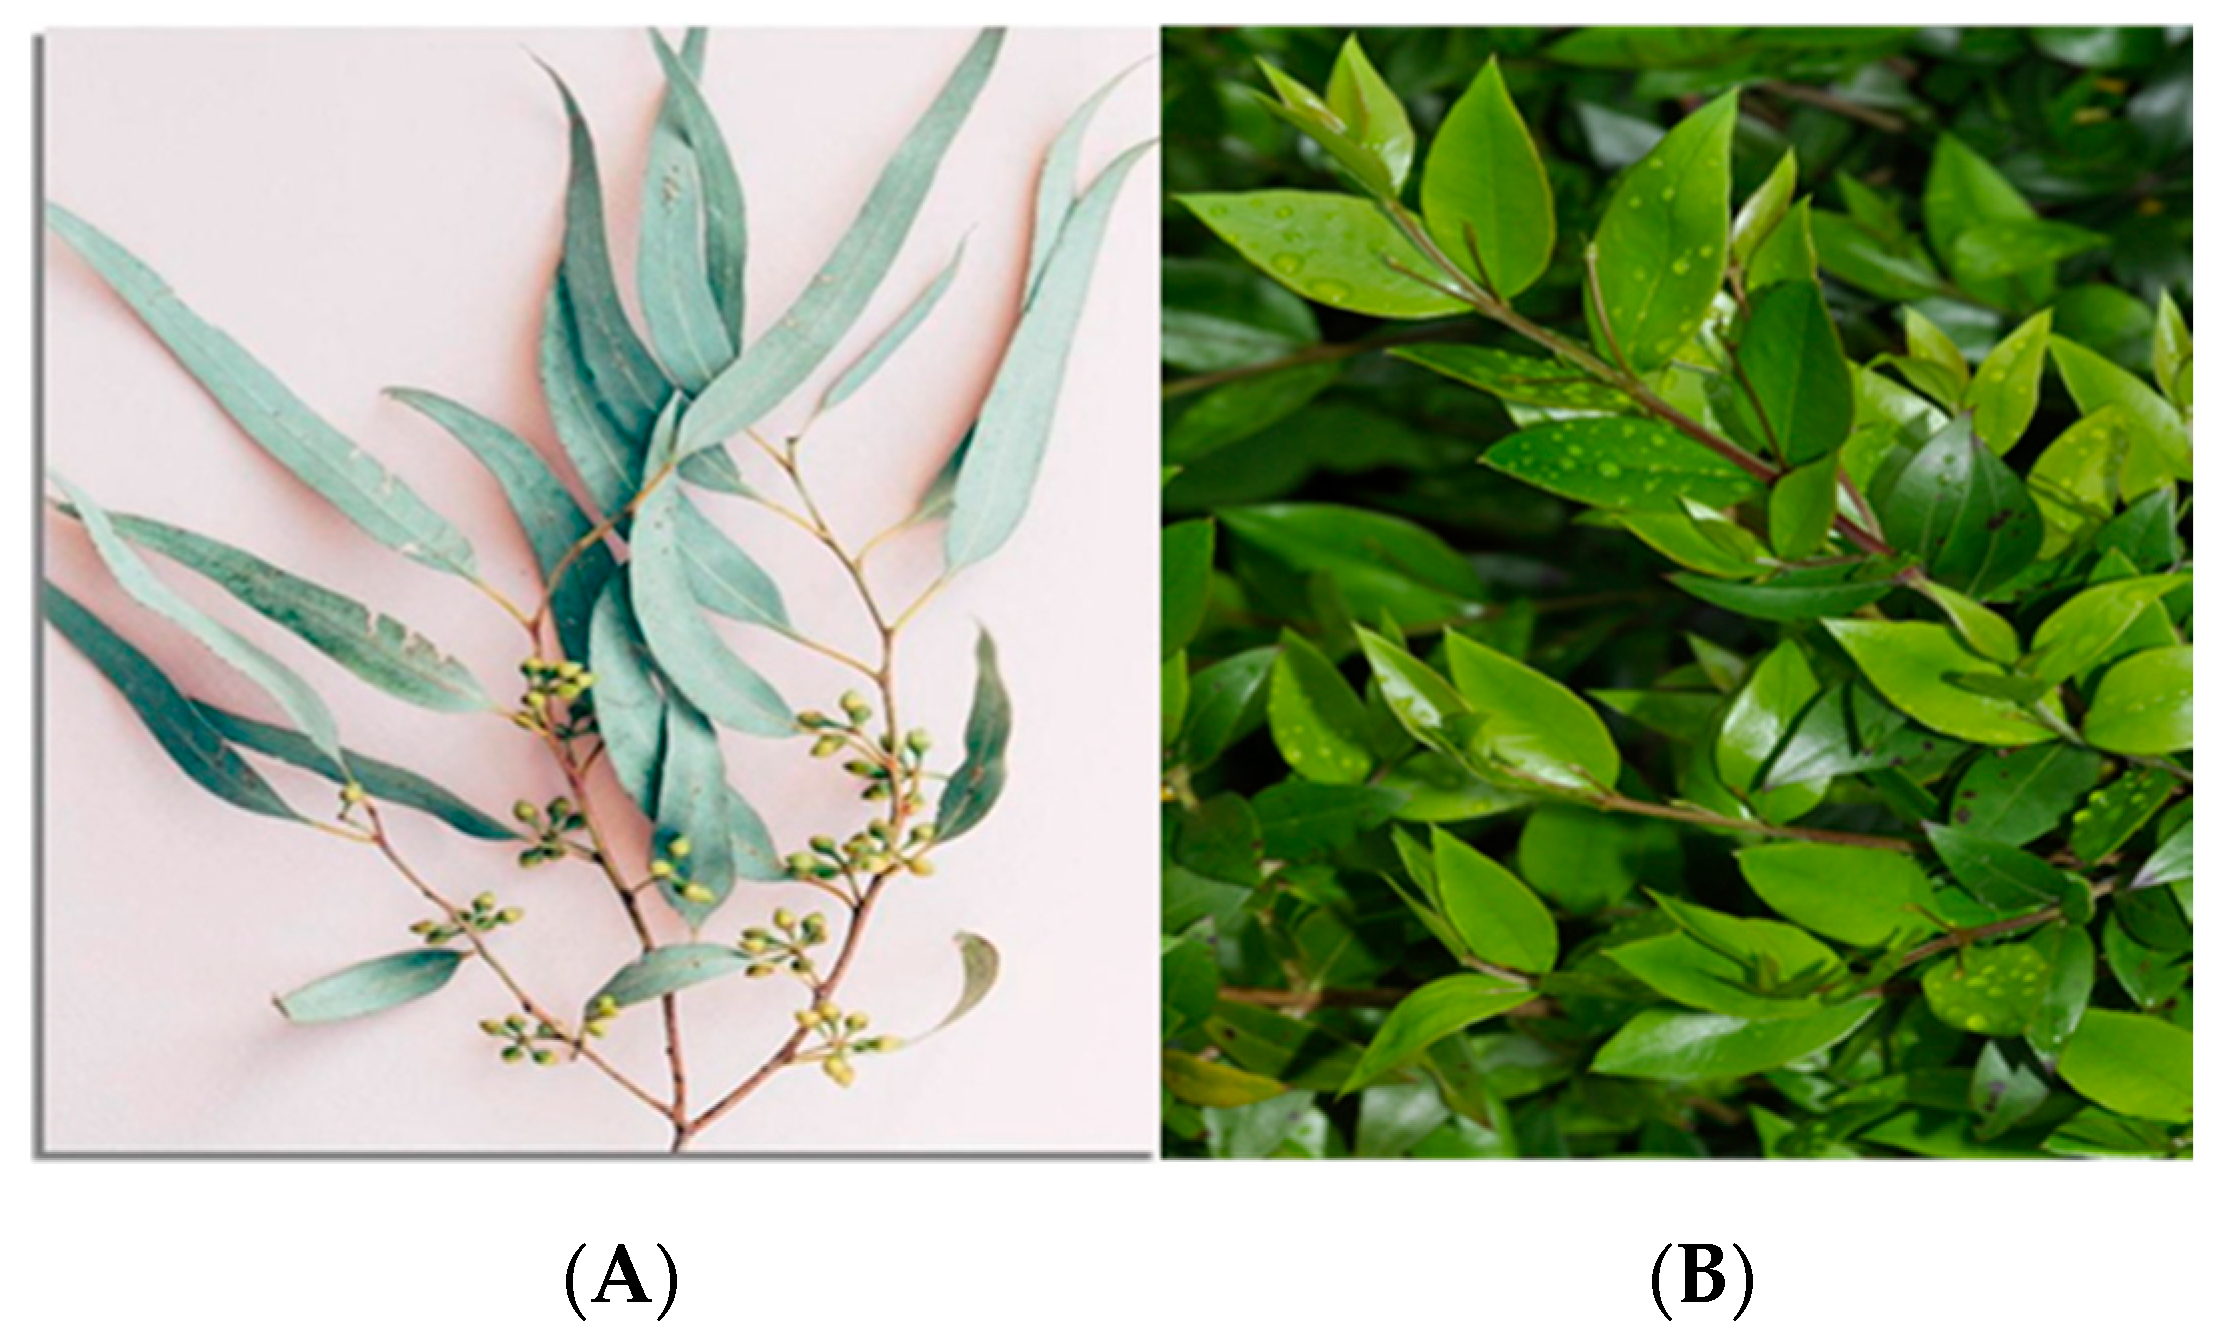
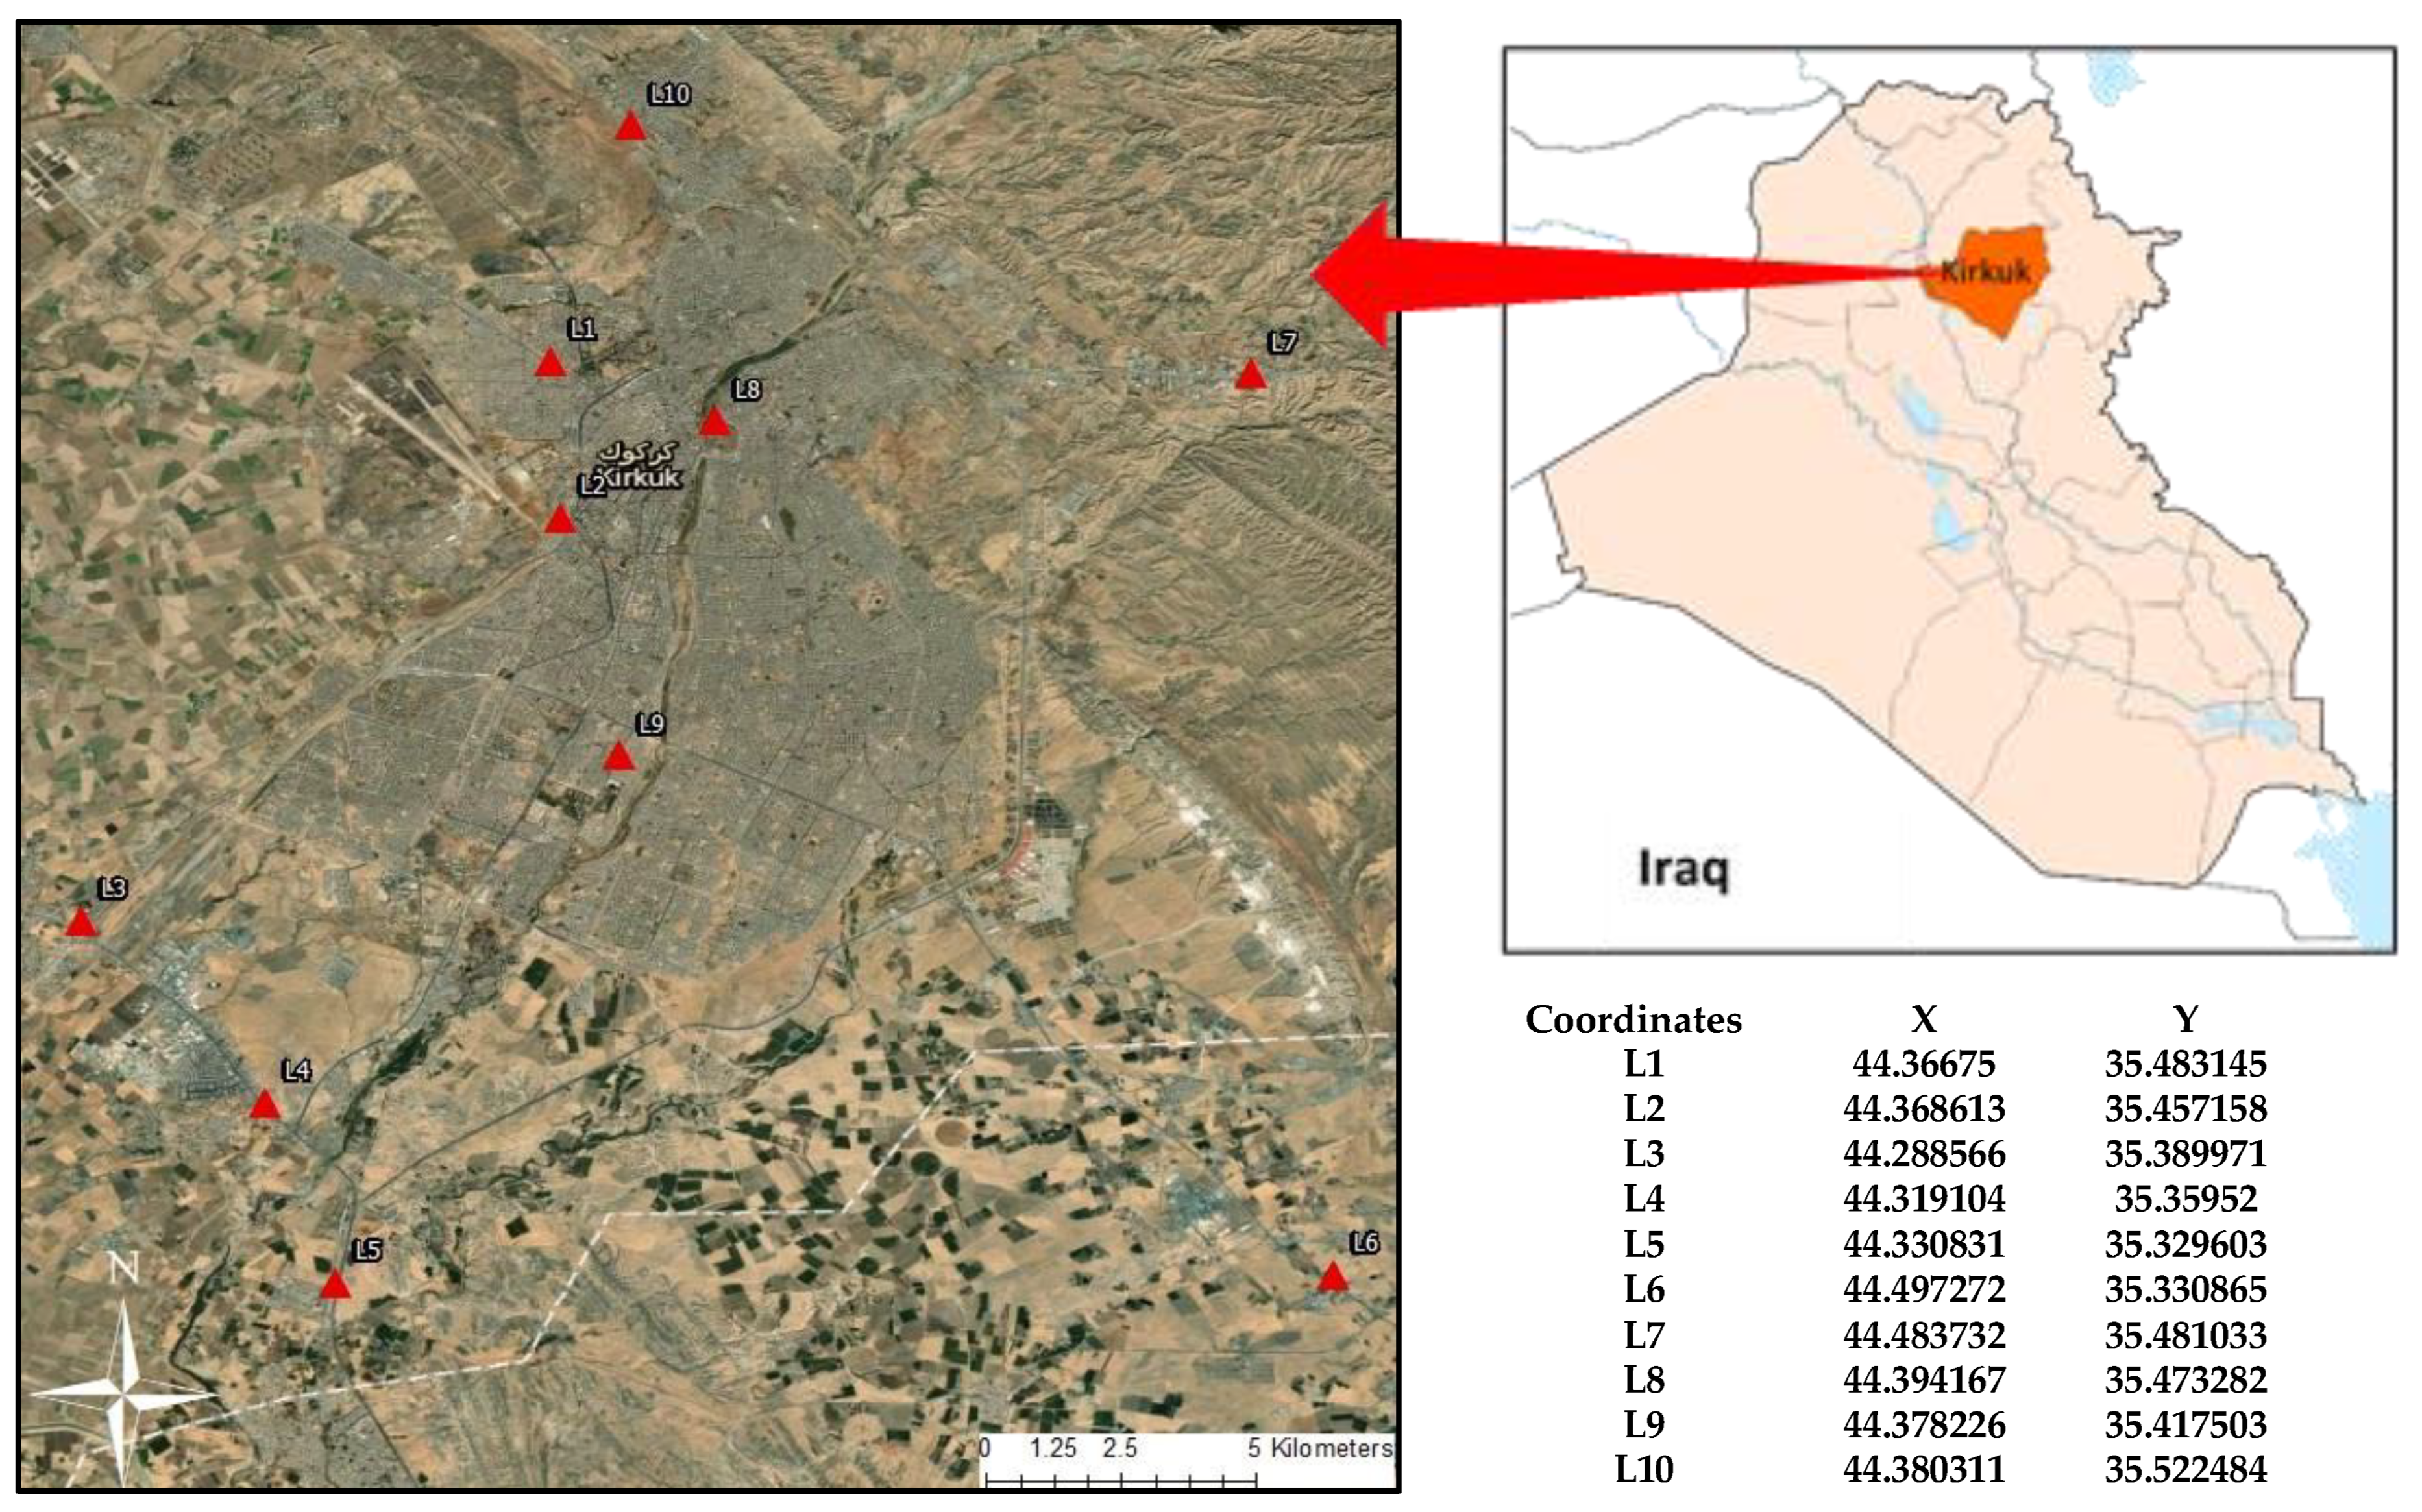
2.1. Sample Sites

Kirkuk city is ranked as the second largest industrial city in Iraq due to its oil and gas production. In recent years, a high number of private oil refineries and other industrial companies have been established in this area. With the noticeable growth in population and increasing numbers of cars on the roads, the city is currently facing a high level of pollution. Ten study sites in Kirkuk City were selected to collect soil samples and leaves from eucalyptus and Myrtus communis L. trees. Table 1 shows the locations, sample codes, and contributing sources of pollution for each sampling site. Green leaves from both trees were collected at each site. Samples were kept in dry, clean plastic bags and transferred to the lab. The leaves were washed with deionized water and air-dried for a few days [1].
The sampling locations are shown in Figure 1 on the ArcGIS (version 10.8.1) map. The samples were taken from the northern, middle, eastern, and western sides of Kirkuk city. The minimum distance between two samples was 3 km. The sample locations were first saved using Google Maps and then transferred as a KML file to ArcMap as a sampling layer (Figure 2).

2.2. Soil Physico-Chemical Characterization

The analysis of the physico-chemical parameters of the soil was carried out in the Soil Physics and Land Management laboratories at Wageningen University & Research. To investigate the quality of the soil, we collected soil samples from 10 study sites. The samples were taken at a depth of 0–25 cm from the soil surface. The samples were stored in clean bags and dried at 70 °C for 48 h. The pH and organic materials (OM) were measured. The pH measurements were made following the protocol introduced by Van Reeuwijk [10] using SI Analytics—pH Meter Lab 855 from the DKSH group. A total of 10.0 g of air-dried fine soil was transferred into 50 mL centrifuge tubes, then 25 mL of 1 M KCl was added. The tubes were then placed in a rotor shaker and extracted for two hours. A pH electrode was immersed in the upper part of each suspension. The pH was recorded when the reading stabilized. For the measurements of organic matters, first we put the clean crucibles into a muffle furnace at a temperature of 550 °C overnight. After 24 h, the crucibles were weighed, and the measurements recorded. Approximately 10 g of a soil sample was added to a crucible, which was then placed in the oven at 105 °C overnight to remove any moisture. After 24 h, each sample was weighed and put back into the oven at 105 °C. After 4 more hours, the weight of each crucible was taken and recorded again. The samples were then transferred to the muffle furnace, which was heated to a temperature of 550 °C. After 4 h, the weights of the crucible and samples were recorded again. For calculations, an Excel template from the Soil Physics and Land Management (SLM) group was used.

2.3. Acid Digestion of All Samples

Sample preparation was carried out at the Wageningen Food Safety Research (WFSR) Centre at Wageningen University and Research. Samples were pre-treated using acid digestion and a microwave oven (MARS express, CEM Corporation, Matthews, NC, USA). For the microwave digestion, 10 mL of concentrated nitric acid (69% Instra-analyzed nitric acid, J.T. Baker, Phillipsburg, NJ, USA) was added to 0.8 g of a sample in Teflon digestion vessels. The samples were placed in the microwave oven at a temperature of 210 °C. The digests were quantitatively transferred to 50 mL polypropylene (PP) centrifuge tubes (Greiner Bio-One, Frickenhausen, Germany) and diluted with deionized water to a final volume of 50 mL. The digests were diluted 5-fold and 200-fold prior to analysis with a final acid concentration of 2.8% v/v [10].

2.4. ICP-MS Analysis

Sample analyses were done at the WFSR Centre. Concentrations of 12 elements were determined using ICP-MS (NexION 300D, Perkin Elmer, Waltham, MA, USA). Samples were introduced into the ICP-MS using an SC-FAST autosampler (ESI, Omaha, NE, USA). The ICP-MS was equipped with a PFA-ST nebulizer, a quartz cyclonic spray chamber, and a quartz torch with a sapphire injector. The ICP-MS was operated in collision mode (KED) with helium as the collision gas for all elements, with a flow rate of 5.0 mL/min and an RPq of 0.25. Concentrations were determined using external calibration curves with rhodium as the internal standard [15].

2.5. Measuring Pollution Indices

Pollution indices were studied to identify the pollution level and potential environmental risks posed by PTEs in soil and plants from all study sites. Many indices were calculated, such as the geo-accumulation index (Igeo), bioaccumulation factor (BAF), contamination factor (CF), pollution load index (PLI), ecological risk (Eri), and potential ecological risk (PER). The geo-accumulation index (Igeo) compares the current and pre-industrial element concentrations in urban soils and dust as introduced by Müller and Atiemo [16,17]. However, for this study, the upper continental crust value by Taylor and McLennan (1985) [18] and McLennan (2001) [19] was the background value (Li et al., 2018; Alam et al., 2019). This index was calculated using the following equation.
I g e o = log 2 ( C n 1.5 B n )
where
Cn = concentration of measured metal in soil (or dust) samples.
Bn = the average continental upper crustal value of element n used by Taylor and McLennan (1985) [18] and McLennan (2001) [19] (Supplementary Table S1).
The bioaccumulation factor (BAF) or the transfer factor is used to compare the concentration of metal in plant biomass with its content in the source (soil or dust). It also allows for the classification of plants as trace element accumulators (BAF > 1) or excluders (BAF < 1). This index was calculated using the following equation:
B A F = C A P / C W W
In this equation, BAF stands for the bioaccumulation factor for a specified metal; CAP represents the specific metal concentration in aerial parts, expressed in mg/kg; and CWW represents the metal concentration in the growth environment like soil and dust, expressed in mg/kg.
The contamination factor (CF) is used to determine the contamination level of the examined environmental samples (leaf and soil) in the study [20]. It is expressed in the equation below:
C F = C s a m p l e C b a c k g r o u n d
where Csample is the metal content in the leaf from the study site, and Cbackground corresponds to the samples from the clean site (uncontaminated or very slightly contaminated).
The pollution load index (PLI) is the nth root of the product of the n CF and calculates the total contribution of all metals in a certain location [21]. Four classes outlined by Hakanson [22] are used to describe the contamination level (Supplementary Table S2).
P L I = ( C F 1 × C F 2 × × C F n ) 1 n
The PLI value representing soil quality is shown in Supplementary Table S3.
To determine the ecological impact of the metals, the potential ecological risk index was evaluated considering the ecological risk potentials of each metal, the contamination factor, and its biological toxicity, as suggested by Hakanson [22]. The potential ecological risk index RI(/PER) of the total metals can be calculated according to the equation below:
R I = i = 1 n E r i = T r i × C f i
where E r i is the potential ecological risk factor, T r i is the toxic response factor, and C f i is the contamination factor of the metals. The toxic response factors used in this study were Ni = 6, Cu = 5, As = 10, Cd = 30, Pb = 5, Zn = 1, Mn = 1, and Cr = 2. The category of the value of E r i and RI is given in Supplementary Table S4.

2.6. Statistical Analysis

The analysis of all the experiments was performed in triplicate and the data were presented as the mean ± standard error.

3. Results

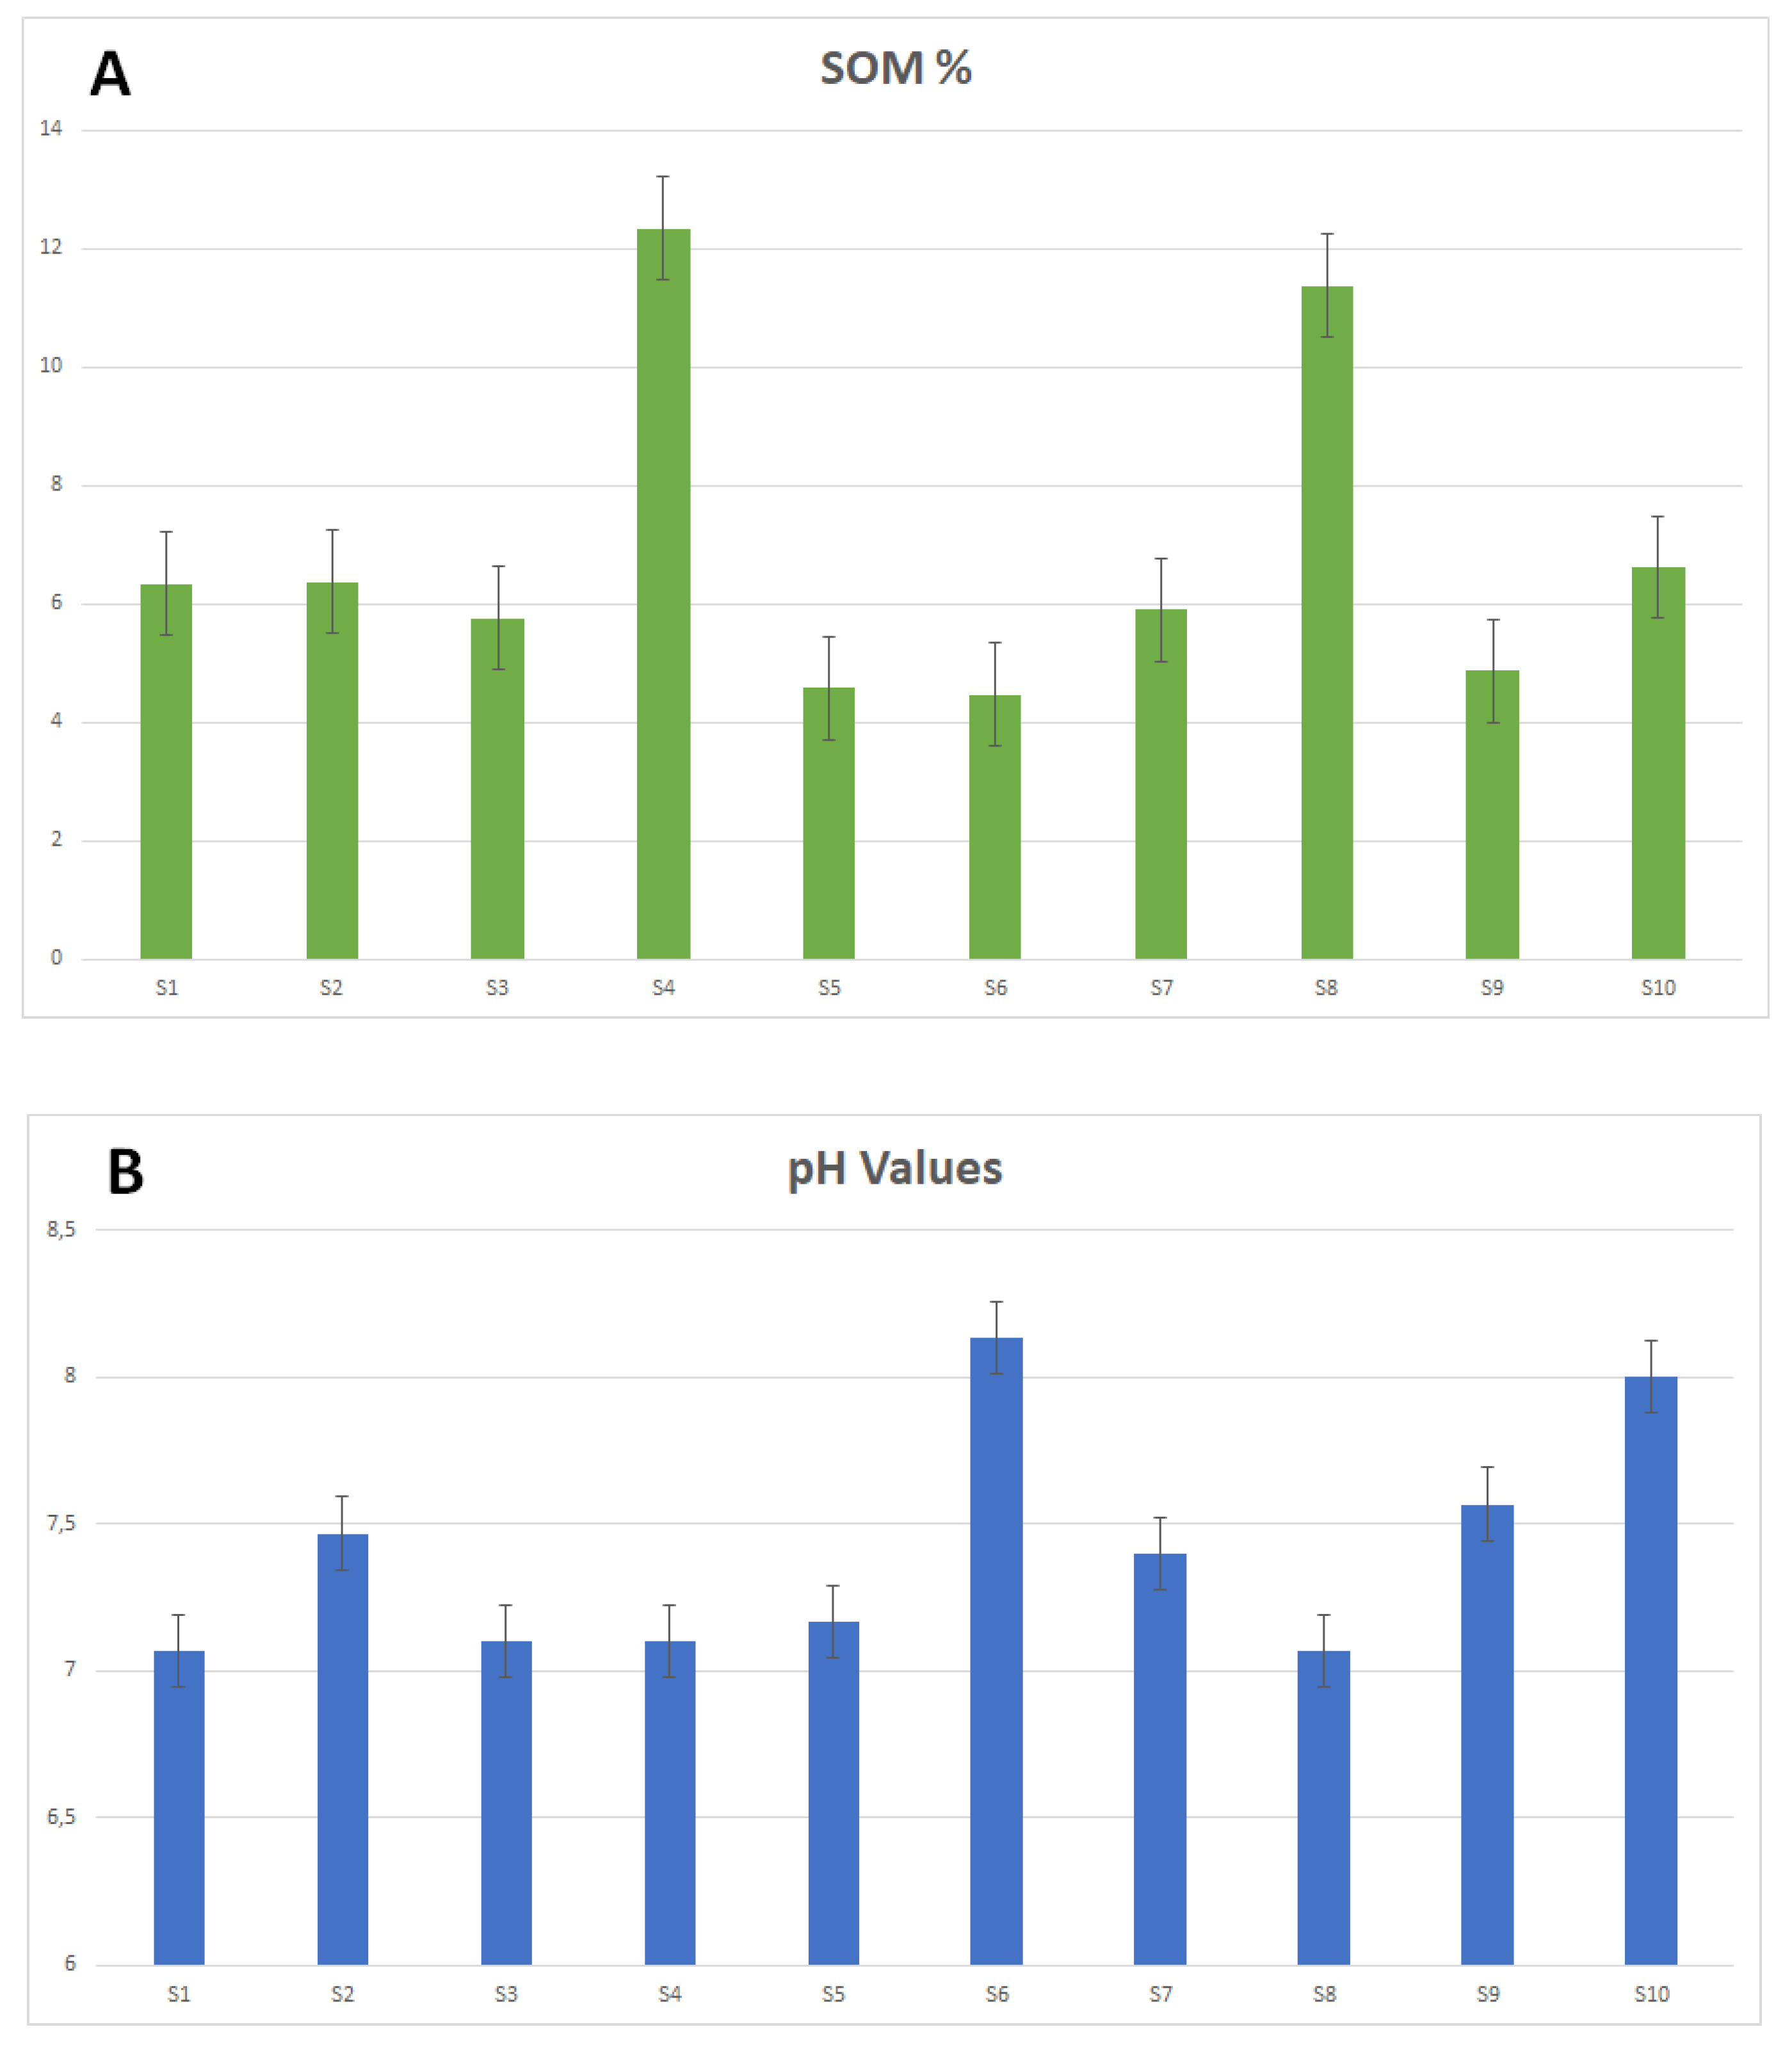
3.1. Physico-Chemical Soil Characterization

The results for physio-chemical soil characterizations are presented in Figure 3A,B. The pH of soil samples from the 10 study sites were measured as between 7.0 and 8.0. The pH indicates neutralized to weakly alkaline types of soil in all samples, as reported by Afloog (2020) [23]. For the soil organic matter (SOM), the results showed a relatively high amount of organic matter in the soil, which ranged between 4.60% and 12.41% on a weight basis in all samples. The study sites where soil samples were collected are irrigated during dry seasons, which might explain the high level of SOM in the samples. Irrigation may increase soil organic matter (SOM) due to higher biomass production [24]. According to Raheem and Omar [25], the soil from the southwestern zone of the city had the highest percentage of OM and soil from the northeastern to southeastern zones had the least OM. The study area was in the region that had the highest percentage of OM in the city (see Figure S1). SOM had remarkable effects on the soil quality, affecting not only the nutrition exchange but also the transfer ability, living organisms, soil moisture, plant growth, and presence of PTEs [26,27]. There is a strong correlation between soil pH, SOM, and soil contamination levels by PTEs. Slightly alkaline soil and a high content of organic matter together might increase the concentration of PTEs in the soil compared to non-alkaline soil with little OM [28].

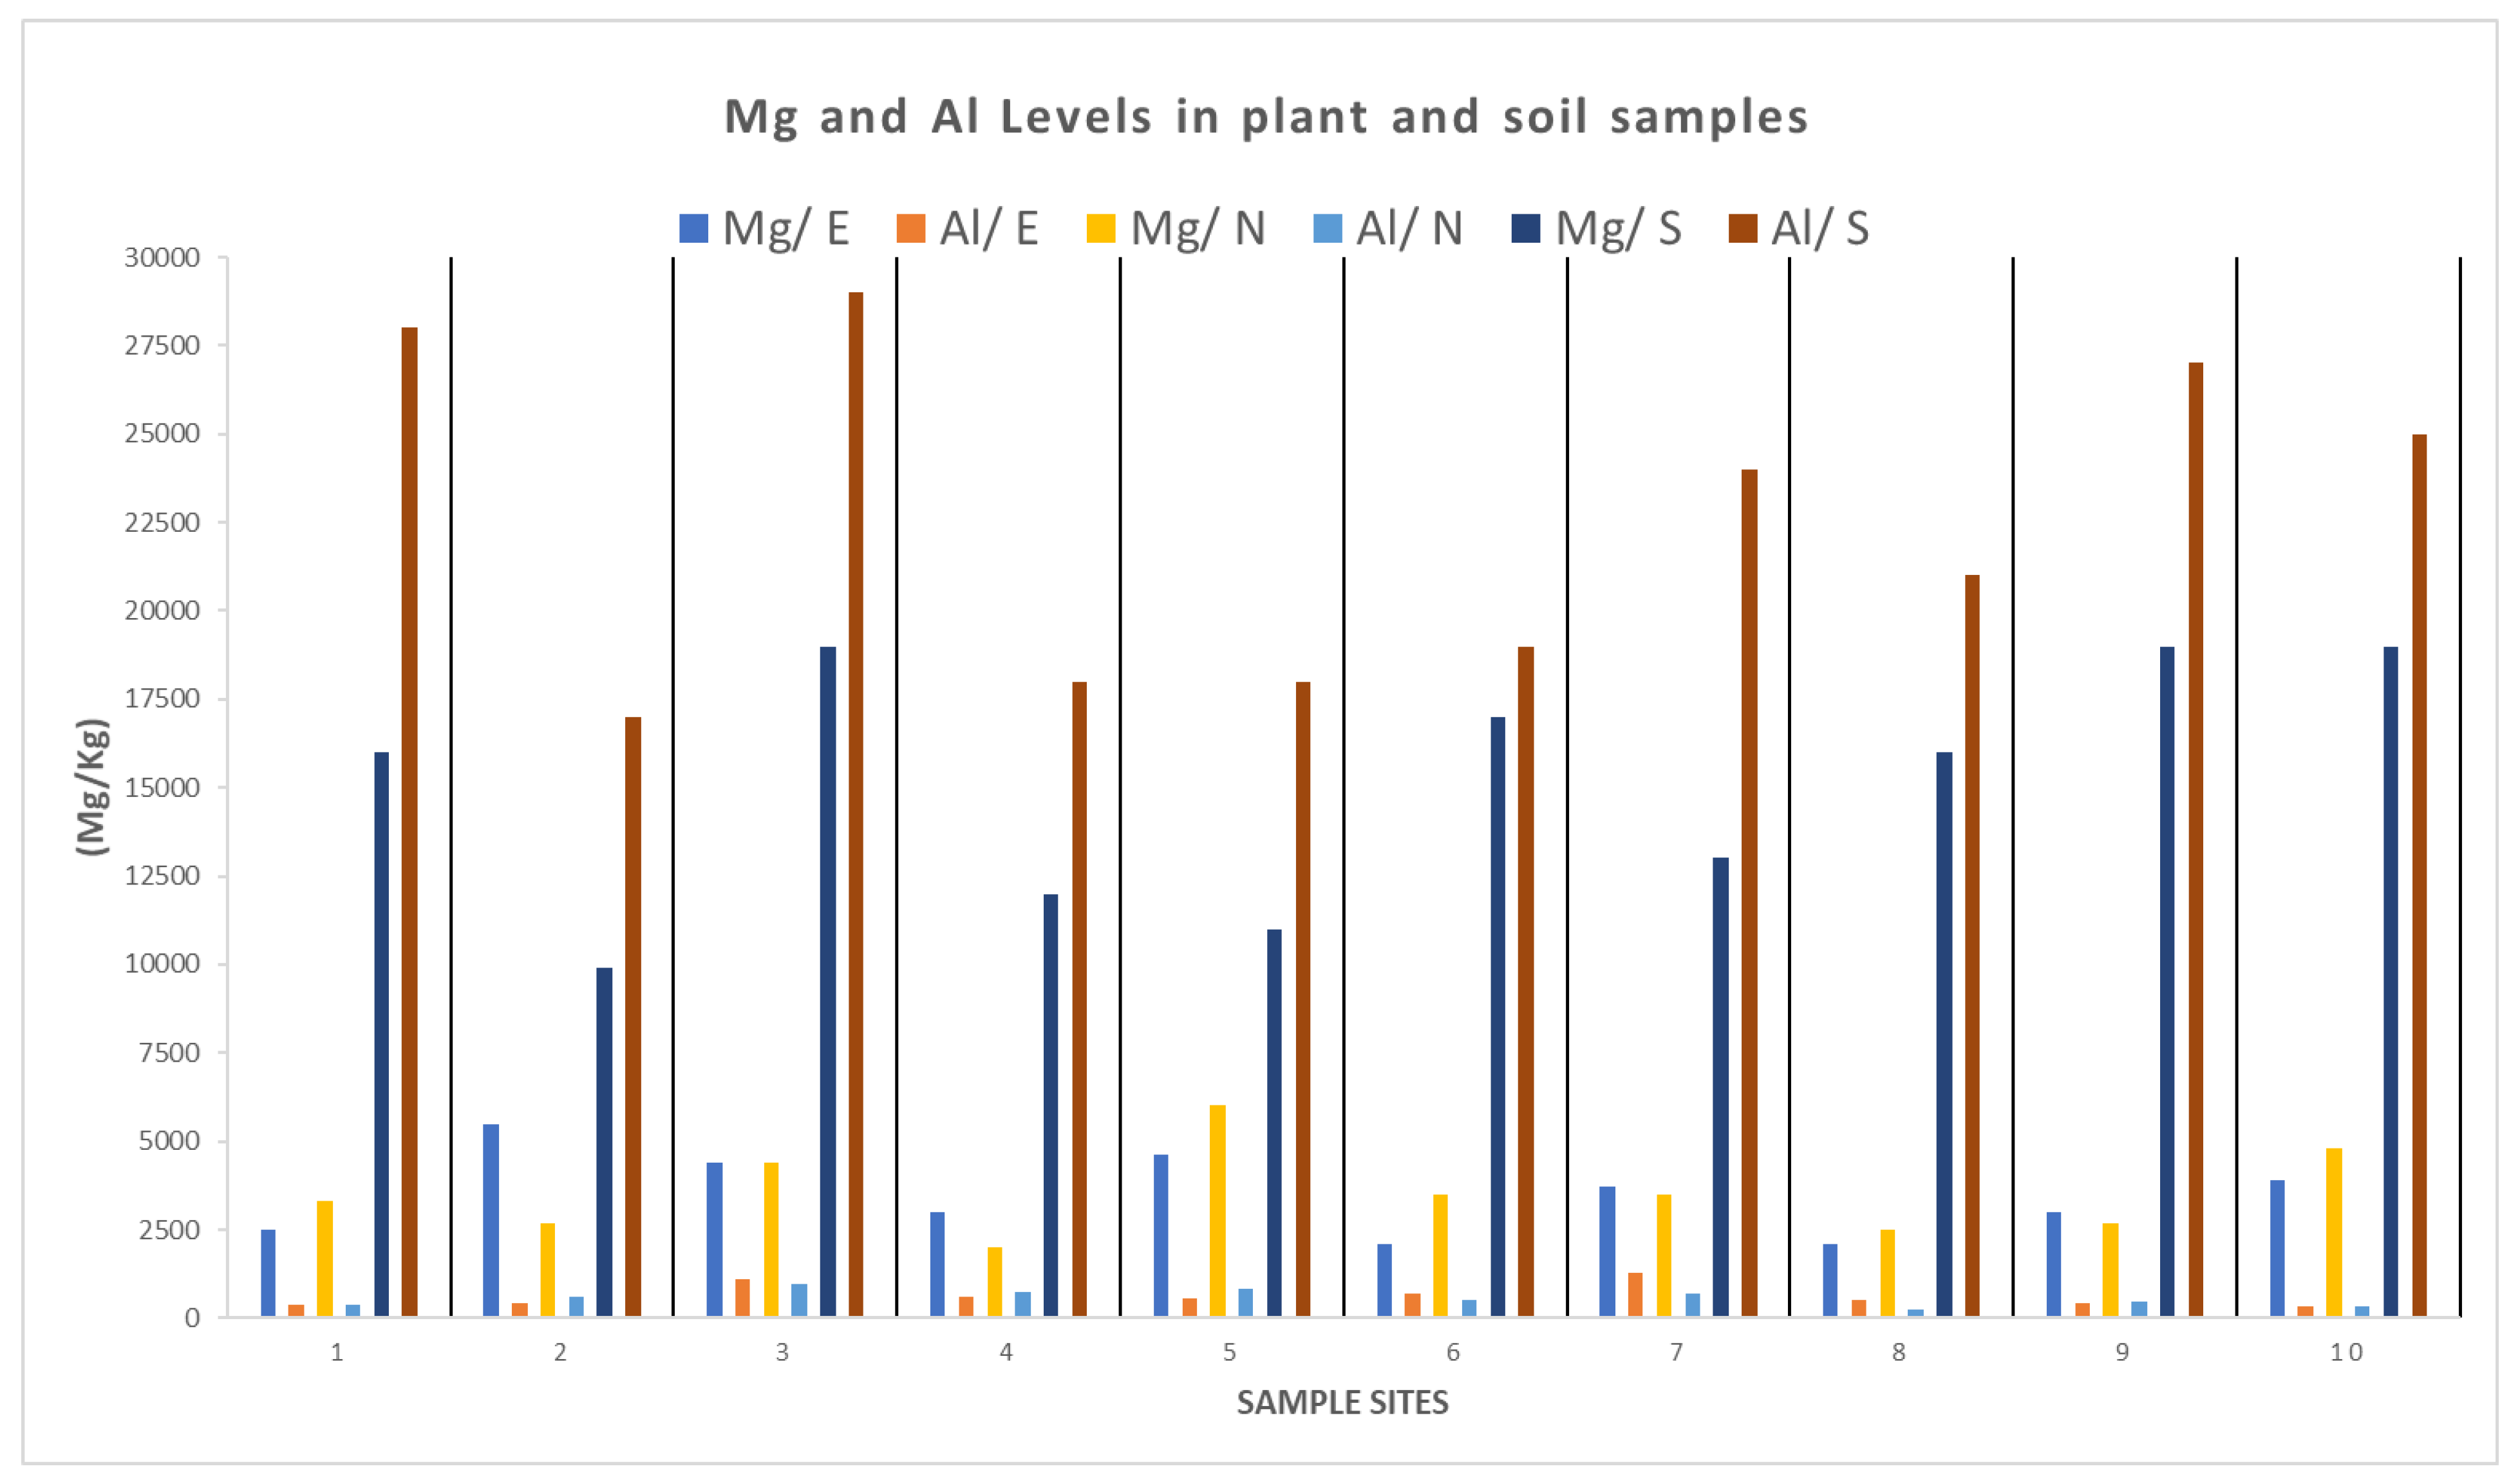
3.2. Potentially Toxic Element (PTE) Concentrations

The concentrations of 12 PTEs were determined in eucalyptus leaves, Myrtus communis L. leaves, and soil samples. The results (mg/kg) are shown in Table 2A–C. The results indicate a high content of aluminum and magnesium (mg/kg) in the soil samples from all study sites in comparison with other metal concentrations, whereas in leaf samples from both trees, the concentrations of magnesium and aluminum were lower than those found in soil samples (Figure 4). A high level of magnesium in the soil is strongly related to vehicle traffic, coal combustion, and industrial activities [29,30]. Aluminum has been recognized as an element that is toxic to plants and can cause soil contamination in industrial areas [31]. Future studies should measure Mg and Al in soil and plants from domestic and agricultural areas.
It is certainly hard to determine an acceptable amount of aluminum for soil, but aluminum in acidic soils where the pH is below 5.0 is almost certainly a problem and can become toxic to plants and other living organisms. However, for soil with a pH higher than 6.0, the toxicity may not be an issue because some of the organic matter in the soil may form a complex with aluminum and make it unavailable to plants. Aluminum levels in all samples had concentrations ranging from 1 to 30% (10,000 to 300,000 mg/kgAl), which makes it nonhazardous, as reported by other researchers [32].
Some metals such as Co, Fe, Mn, Cu, Mo, Ni, and Zn are essential for plant nutrition and growth; therefore, they are present in the soil but in limited amounts. However, excessive amounts of these metals in soils can be toxic for plants and soil biota [33]. Based on the results obtained in this study, the PTE concentrations were found in the order Mg > Al > Ni > Cu > Cr > Pb > Co > As > Se > Cd > Hg > Ti in leaf samples from both kinds of trees in all 10 study sites, whereas in soil, the PTE concentrations were found in the order Mg > Al > Cr > Ni > Cu > Pb > Co > As > Se > Ti > Cd > Hg in all study sites (Table 2). According to our results, the concentration of Ni was significantly high in all soil samples, ranging from 63 mg/kg in S5 to 130 mg/kg in S9. The concentrations in all locations were higher than the permissible limits of PTEs in soil (35 mg/kg) published by the WHO [34]. The concentration of Ni in eucalyptus leaves ranged from 0.67 mg/kg to 22 mg/kg in E9, whereas concentrations in Myrtus communis L. leaves ranged between 2.6 mg/kg and 24 mg/kg in N6. The permissible limit of Ni in plants is 10 mg/kg, as published by the WHO. The concentration of Cr in soil samples exceeded the permissible level of 100 mg/kg, except for S4, which was 85 mg/kg. Cr concentrations in both plants were within the permissible levels (1–3 mg/kg), except for E6 and E7, which were 4.3 mg/kg and 4.6 mg/kg, respectively. In Myrtus communis L. leaves, Cr exceeded permissible levels in samples N3 and N5, where it was 3.8 mg/kg and 3.9 mg/kg, respectively. A remarkable concentration was recorded for Cu in soil sample S2 followed by S5, where it was 210 mg/kg and 55 mg/kg, respectively. The other soil samples remained under the limit for the level of Cu in soil (36 mg/kg). The concentration of Cu for samples from both plants remained within the permissible limit (10 mg/kg). The presence of Cr, Co, and Cu in soil is crucial for plant growth. Pb and Cd are very toxic for plants and can cause dangerous diseases in humans, such as cancer [32]. The results showed a high concentration of Pb in one soil sample, S1, at 140 mg/kg. This could be the result of the heavy oil production activities in the area (North Oil Company location). The remaining soil samples were under the limit level for Pb in uncontaminated soil (85 mg/kg) [24]. The concentrations of Pb in eucalyptus leaves ranged between 0.55 mg/kg and 2.2 mg/kg, and in Myrtus communis L. leaves the levels were between 0.38 mg/kg in N10 and 3.9 mg/kg in N4, which exceeded the permissible limit of Pb in plants (2 mg/kg) [35]. This is clearly due to the industrial activities in location 4 (see Table 1). Industrial and vehicular emissions are the main reasons for the increasing contamination of soil and plants with Pb, Cd, Cr, Co, and Se [36]. Similar results were reported by Awadh (2019) in an evaluation of urban soil in Kirkuk [37].
According to the results obtained from the Igeo index for Mg, Al, Cr, Co, Ni, Cu, As, Se, Cd, Hg, Tl, and Pb in soil samples, the contamination level varied from uncontaminated (for Mg, Al, Cr, Co, Ni, Cu, Se, Cd, Hg, Tl, and Pb) to moderate contamination, and high contamination with As for all soil samples (Figure 5). A moderate contamination with Cd and Pb was recorded in soil samples from locations 2 and 4, respectively, which are industrial and high-traffic areas. Soil contamination with lead (Pb) and cadmium (Cd) resulted from the coal released from industrial activities and vehicle emissions [38]. Similar results were reported by Al-Obeidi (2020), who found significant pollution levels of lead, chromium, and copper in industrial areas of Kirkuk city [39]. Soil contamination with arsenic (As) can be a result of agricultural activities such as pesticide and phosphate fertilizer use, or it can be a result of waste disposal and coal burning [40,41].
The bioaccumulation factor for 12 PTEs was calculated for eucalyptus and Myrtus communis L. leaves from each study site, as shown in Figure 6 and Figure 7. Bioaccumulation is an indicator of a gradual increase in contaminants such as PTEs or pesticides in plants, animals, or humans. Calculating the bioaccumulation factor in tree leaves will give an estimation of the pollution levels of PTEs in the air [22]. Most of the PTEs examined in this study might have accumulated on the surface of plant leaves in the form of dust or accumulated from the soil. To our knowledge, there is no study in this area to determine the main source of contamination. Therefore, it is not clear whether PTE accumulation on plant leaves is from the air or from the soil. The BAF for all Mg, Al, Cr, Co, Ni, Cu, As, Se, Cd, Tl, Pb PTEs was <1, indicating that the accumulation of most metals was very low, with the exception of Hg. The BAF for Hg was greater than 1 for samples from both plants, except in samples from location 4 (E4 and N4) and location 8 (N8—Myrtus communis L. leaves). Leaves contaminated with Hg were the result of exposure to petrochemicals, household detergents, pesticides, batteries, and industrial activities [42,43].
Some plant species are known for their ability to remove PTEs from the air, soil, and water in a process known as phytoremediation [44]. These special plants are used to improve environmental quality. The plants absorb and store PTEs in their roots, thus reducing the bioavailability of the contaminants. Eucalyptus, for example, can effectively absorb PTEs from soil and dust and store it in its tissues [45]. Another study showed that Myrtus communis L. plants could bioremediate the soil, and they were effective in phytoremediation of Ni and Pb without showing any morphological changes [46]. Therefore, these species could be used as a tool to clean the environment in Kirkuk city.
An indicator of the contamination level depends on the calculation of the contamination factor (CF) in soil and plant samples [21]. Based on the results shown in Figure 8A–C, the contamination factors for Cr, Cu, Cd, and Pb were low in eucalyptus leaves, whereas the contamination factor for Ni was moderate and the contamination factor for As was moderate to considerable. For Myrtus communis L. leaves, contamination factors for Cr, Cu, Cd, Ni, and Pb were low and the contamination factor for As was moderate. Soil samples taken from roadsides and industrial areas showed low to moderate contamination levels of most of the studied PTEs, except for Pb and Cd, which showed considerable to high contamination levels in some study sites. Results showed moderate contamination levels of As in all study sites.
The potential ecological risk factor (ERi) showed low to moderate contamination with Cr, Ni, Cu, As, Cd, and Pb in both plant samples from all study sites (Figure 9). In the soil samples, moderate to heavy contamination with Cd (52–177.55 mg/kg) was found in all study sites. Moderate contamination with As (32–45 mg/kg) was observed, along with low to moderate contamination from Cr, Co, Ni, and Pb. The pollution load index (PLI) and potential ecological risk (PER) were also measured in this study to identify the potential risks that PTEs have on the environment [47]. The results are shown in Figure 10 and Figure 11. All PTEs found in both plant samples posed low risk to the environment since the mean value for the ecological risk assessment for all PTEs for each location was less than 40 [22]. However, for soil samples, the results showed very high ecological risk for all study sites, as the mean value for all PTEs per location was above 40 and ranged from a minimum of 113 to a maximum of 289. This was due to the contamination level of Cd in all locations. The potential ecological risk of Cd ranged from 52 to 177.
Most PTEs, such as Pb, Co, Cd, and As, can accumulate in living organisms due to the lack of biodegradation. Therefore, these compounds are well known for their negative effects on plants, animals, and humans, and become dangerous above certain levels [48]. PTEs can stay in the soil for a very long time (thousands of years) and affect the quality of the soil, microorganisms, plant growth, and ground cover and cause many health problems. PTEs can be found in two forms. Organic PTEs are used in pesticides, especially those used on cotton plants. Inorganic forms of PTEs can be very dangerous and toxic, depending on the tolerance of the species and the environmental conditions, such as pH levels or microbial and mineral compositions [48]. For example, As can bind to oxygen, chlorine, and sulfur in the environment. Generally, inorganic As is more toxic than organic As [49]. Plants and soil can be contaminated by Pb from car exhaust, dust, and emissions from industrial activities. Pb is very toxic to humans when present in certain amounts because it cannot be chemically or biologically degraded. It causes brain damage in humans, and it stays in the soil for many years [50]. It can accumulate in the upper 8 inches of soil and cause long-term contamination that can permanently damage soil. The amount of Pb absorbed by plants depends on other parameters such as pH and SOM [51]. Some plant species are able to act as accumulators, using phytoextraction strategies to survive in highly contaminated environments. Eucalyptus and Myrtus communis L. are able to store some PTEs. The shoot-to-root ratio of PTEs for these plants is above 1. This happens because they are able to biodegrade and transform substances and store the contaminants in their tissues. However, plants that act as excluders cannot transfer PTEs to their tissues; thus, the shoot-to-root ratio of the PTEs in these plants is below 1 [52,53].

4. Conclusions

This study measured the highest levels of two metals, aluminum and magnesium (mg/kg), in soil samples from all study sites and compared them to other metals and potentially toxic elements. Whereas moderate to low amounts of magnesium and aluminum were found in leaf samples, in both plants and soil samples, moderate to significantly high concentrations of PTEs such as Cr, Cu, Pb, As, and Ni were found in some study sites. This is because some of the study sites are more affected by traffic and higher amounts of industrial activity compared to other locations. The soil samples showed high ratios of organic matter. The PTEs detected in the plant leaves were deposited onto the leaves from the air or soil. Furthermore, the calculations of pollution indices (Igeo) showed low to moderate amounts of Mg, Al, Cr, Cu, Cd, Hg, Ti, Pb, and Ni, and a high level of As in the soil. The measurements of the other pollution indices for both plant samples showed low to moderate contamination with Cr, Cu, Pb, Ni, As, and Cd. In soil, high Pb and Cd contamination was found. Both plants showed low to moderate accumulation of Mg, Al, Cr, Ni, Cu, Pb, Co, As, Se, and Ti. High bioaccumulation of Hg was observed for both plant samples from all study sites. Low potential ecological risk was observed for both plant samples, whereas high potential ecological risk was reported for soil samples from all study sites. Further investigations are recommended for this region considering the health impacts for the inhabitants of Kirkuk and the nearby areas. In addition, further investigation of air, soil, and water quality is urgently needed.

Supplementary Materials

The following supporting information can be downloaded at: https://www.mdpi.com/article/10.3390/su14095655/s1.

Author Contributions

Conceptualization, C.A.K., O.I.A. and K.M.; data curation, C.A.K. and R.O.; formal analysis, C.A.K. and O.I.A.; investigation, C.A.K., R.O., K.M. and M.R.; methodology, C.A.K. and R.O.; resources, K.M, C.R. and M.R.; supervision, M.R.; validation, C.A.K. and K.M.; visualization, C.A.K. and K.M.; writing—original draft, C.A.K., K.M., C.R. and M.R.; writing—review and editing. All authors have read and agreed to the published version of the manuscript.

Funding

This research received no external funding.

Institutional Review Board Statement

Not applicable.

Informed Consent Statement

Not applicable.

Data Availability Statement

Not applicable.

Acknowledgments

The authors would like to thank Wageninegn Food Safety Reseach at Wageningen Univesity & Research for providing for their contribution and for the use of their facilities and instrumentation for executing the experiments. Special thanks to Larisa Assad Mohamood Assad, and Mohamood Jabar for helpingwith sample collection.

Conflicts of Interest

The authors declare no conflict of interest. The funders had no role in the design of the study; in the collection, analyses, or interpretation of data; in the writing of the manuscript, or in the decision to publish the results.

References

  1. Uddin, A.H.; Khalid, R.S.; Alaama, M.; Abdualkader, A.M.; Kasmuri, A.; Abbas, S.A. Comparative study of three digestion methods for elemental analysis in traditional medicine products using atomic absorption spectrometry. J. Anal. Sci. Technol. 2016, 7, 1. [Google Scholar] [CrossRef] [Green Version]
  2. Badamasi, H. Biomonitoring of Air pollution using plants. J. Environ. Sci. 2017, 2, 27–39. [Google Scholar]
  3. Wong, M.H.; Leung, A.O.; Wu, S.; Leung, C.K.; Naidu, R. Mitigating environmental and health risks associated with uncontrolled recycling of electronic waste: Are international and national regulations effective. In Environmental Contamination: Health Risks and Ecological Restoration; CRC Press, Taylor & Francis Group: Boca Raton, FL, USA, 2012; pp. 193–208. [Google Scholar]
  4. Barbes, L.; Barbulescu, A.; Radulescu, C.; Stihi, C.; Chelarescu, E.D. Determination of heavy metals in leaves and bark of Populus nigra L. by atomic absorption spectrometry. Rom. Rep. Phys. 2014, 66, 877–886. [Google Scholar]
  5. Kabir, M.H.; Kormoker, T.; Shammi, R.S.; Tusher, T.R.; Islam, M.S.; Khan, R.; Idris, A.M. A comprehensive assessment of heavy metal contamination in road dusts along a hectic national highway of Bangladesh: Spatial distribution, sources of contamination, ecological and human health risks. Toxin Rev. 2021, 40, 1–20. [Google Scholar] [CrossRef]
  6. Hseu, Z.-Y. Evaluating heavy metal contents in nine composts using four digestion methods. Bioresour. Technol. 2004, 95, 53–59. [Google Scholar] [CrossRef]
  7. Sinicropi, M.S.; Amantea, D.; Caruso, A.; Saturnino, C. Chemical and biological properties of toxic metals and use of chelating agents for the pharmacological treatment of metal poisoning. Arch. Toxicol. 2010, 84, 501–520. [Google Scholar] [CrossRef]
  8. Knudson, L.L.; Tibbitts, T.W.; Edwards, G.E. Measurement of Ozone Injury by Determination of Leaf Chlorophyll Concentration. Plant Physiol. 1977, 60, 606–608. [Google Scholar] [CrossRef]
  9. Denneman, C.A.; Robberse, J.G. Ecotoxicological risk assessment as a base for development of soil quality criteria. In Contaminated Soil’90; Springer: Dordrecht, The Netherlands, 1990; pp. 157–164. [Google Scholar]
  10. Van Beek, C.L.; Elias, E.; Yihenew, G.S.; Heesmans, H.; Tsegaye, A.; Feyisa, H.; Mengist, S. Soil nutrient balances under diverse agro-ecological settings in Ethiopia. Nutr. Cycl. Agroecosyst. 2016, 106, 257–274. [Google Scholar] [CrossRef] [Green Version]
  11. Andrews, S.S.; Carroll, C.R. Designing a soil quality assessment for sustainable agroecosystem management. Ecol. Appl. 2002, 11, 1573–1585. [Google Scholar] [CrossRef]
  12. Teng, Y.; Wu, J.; Lu, S.; Wang, Y.; Jiao, X.; Song, L. Soil and soil environmental quality monitoring in China: A review. Environ. Int. 2014, 69, 177–199. [Google Scholar] [CrossRef] [PubMed]
  13. Zhao, H.; Yin, C.; Chen, M.; Wang, W. Risk assessment of heavy metals in street dust particles to a stream network. Soil Sediment Contam. 2009, 18, 173–183. [Google Scholar] [CrossRef]
  14. Morvan, X.; Saby, N.P.A.; Arrouays, D.; Le Bas, C.; Jones, R.J.A.; Verheijen, F.G.A.; Bellamy, P.H.; Stephens, M.; Kibblewhite, M.G. Soil monitoring in Europe: A review of existing systems and requirements for harmonization. Sci. Total Environ. 2008, 391, 1–12. [Google Scholar] [CrossRef] [PubMed]
  15. van der Fels-Klerx, H.; Meijer, N.; Nijkamp, M.; Schmitt, E.; van Loon, J. Chemical food safety of using former foodstuffs for rearing black soldier fly larvae (Hermetia illucens) for feed and food use. J. Insects Food Feed 2020, 6, 475–488. [Google Scholar] [CrossRef]
  16. Muller, G. Index of geoaccumulation in sediments of the Rhine River. Geojournal 1969, 2, 108–118. [Google Scholar]
  17. Atiemo, M.S.; Ofosu, G.F.; Kuranchie-Mensah, H.; Tutu, A.O.; Palm, N.D.; Blankson, S.A. Contamination assessment of heavy metals in road dust from selected roads in Accra, Ghana. Res. J. Environ. Earth Sci. 2011, 3, 473–480. [Google Scholar]
  18. Taylor, S.R.; McLennan, S.M. The Continental Crust: Its Composition and Evolution; Blackwell: Malden, MA, USA, 1985. [Google Scholar]
  19. McLennan, S.M. Relationships between the trace element composition of sedimentary rocks and upper continental crust. Geochem. Geophys. Geosystems 2001, 2, 108–118. [Google Scholar] [CrossRef]
  20. Sobhanardakani, S.; Ghoochian, M.; Taghavi, L. Assessment of Heavy Metal Contamination in Surface Sediment of the Darreh-Morad Beyg River. Iran. J. Heal. Sci. 2016, 4, 22–34. [Google Scholar] [CrossRef] [Green Version]
  21. Sultan, M.B.; Choudhury, T.R.; Alam, N.-E.; Doza, B.; Rahmana, M. Soil, dust, and leaf-based novel multi-sample approach for urban heavy metal contamination appraisals in a megacity, Dhaka, Bangladesh. Environ. Adv. 2021, 7, 100154. [Google Scholar] [CrossRef]
  22. Håkanson, L. An ecological risk index for aquatic pollution control. A sedimentological approach. Water Res. 1980, 14, 975–1001. [Google Scholar] [CrossRef]
  23. Afloog, H.A.; Hassan, A.A. Environmental Geochemistry and Assessment of Pollution by Vanadium in Top Soil of Kirkuk, Northern Iraq. Iraqi Geol. J. 2020, 53, 74–95. [Google Scholar] [CrossRef]
  24. Núñez, A.; Cotrufo, M.F.; Schipanski, M. Irrigation effects on the formation of soil organic matter from aboveground plant litter inputs in semiarid agricultural systems. Geoderma 2022, 416, 115804. [Google Scholar] [CrossRef]
  25. Raheem, A.M.; Omar, N.Q. Investigation of distinctive physico-chemical soil correlations for Kirkuk city using spatial analysis technique incorporated with statistical modeling. Int. J. Geo-Engineering 2021, 12, 1–21. [Google Scholar] [CrossRef]
  26. Wosten, J.H.M.; Groenendijk, P.; Veraart, J.A.; van der Lugt, L.M. Soil Organic Matter and its Importance For Water Management; Stowa: Engelsbrand, Germany, 2019. [Google Scholar]
  27. Oades, J.M. An Introduction to Organic Matter in Mineral Soils. In Minerals in Soil Environments, 2nd ed.; Dixon, J.B., Weed, S.B., Eds.; Soil Science Society of America, Inc.: Madison, WI, USA, 1989; Volume 1, pp. 89–159. [Google Scholar]
  28. Li, G.; Lu, N.; Wei, Y.; Zhu, D. Relationship between heavy metal content in polluted soil and soil organic matter and pH in mining areas. IOP Conf. Ser. Mater. Sci. Eng. 2018, 394, 052081. [Google Scholar] [CrossRef]
  29. Skorbiłowicz, M.; Skorbiłowicz, E. Content of calcium, magnesium, sodium and potassium in the street dust from the area of Białystok (Poland). J. Ecol. Eng. 2019, 20, 125–131. [Google Scholar] [CrossRef]
  30. Lindsay, W.L. Chemical Equilibria in Soils; John Wiley: New York, NY, USA, 1979. [Google Scholar]
  31. Rout, G.R.; Samantaray, S.; Das, P. Aluminium toxicity in plants: A review. Agronomie 2001, 21, 3–21. [Google Scholar] [CrossRef]
  32. Arif, N.; Yadav, V.; Singh, S.; Singh, S.; Ahmad, P.; Mishra, R.K.; Sharma, S.; Tripathi, D.K.; Dubey, N.K.; Chauhan, D.K. Influence of High and Low Levels of Plant-Beneficial Heavy Metal Ions on Plant Growth and Development. Front. Environ. Sci. 2016, 4, 69. [Google Scholar] [CrossRef]
  33. Brzezicha-Cirocka, J.; Grembecka, M.; Szefer, P. Monitoring of essential and heavy metals in green tea from different geographical origins. Environ. Monit. Assess. 2016, 188, 183. [Google Scholar] [CrossRef] [Green Version]
  34. World Health Organization (WHO). Permissible Limits of Heavy Metals in Soil and Plants; WHO: Geneva, Switzerland, 1996. [Google Scholar]
  35. Cheng, J.-L.; Shi, Z.; Zhu, Y.-W. Assessment and mapping of environmental quality in agricultural soils of Zhejiang Province, China. J. Environ. Sci. 2007, 19, 50–54. [Google Scholar] [CrossRef]
  36. Irfan, M.; Hayat, S.; Ahmad, A.; Alyemeni, M.N. Soil cadmium enrichment: Allocation and plant physiological manifestations. Saudi J. Biol. Sci. 2013, 20, 1–10. [Google Scholar] [CrossRef]
  37. Awadh, S.M.; Al-Hamdani, J.A.J.M.Z. Urban geochemistry assessment using pollution indices: A case study of urban soil in Kirkuk, Iraq. Environ. Earth Sci. 2019, 78, 1–12. [Google Scholar] [CrossRef]
  38. Kaur, J.; Bhat, S.A.; Singh, N.; Bhatti, S.S.; Kaur, V.; Katnoria, J.K. Assessment of the Heavy Metal Contamination of Roadside Soils Alongside Buddha Nullah, Ludhiana, (Punjab) India. Int. J. Environ. Res. Public Heal. 2022, 19, 1596. [Google Scholar] [CrossRef] [PubMed]
  39. Al-Obeidi, A.H.; Al-Jumaily, H.A. Geochemistry and environmental assessment of heavy metals in surface soil in Al-Hawija, southwest Kirkuk. Iraqi Geol. J. 2020, 50, 36–61. [Google Scholar] [CrossRef]
  40. Wilson, S.C.; Tighe, M.; Paterson, E.; Ashley, P.M. Food crop accumulation and bioavailability assessment for antimony (Sb) compared with arsenic (As) in contaminated soils. Environ. Sci. Pollut. Res. 2014, 21, 11671–11681. [Google Scholar] [CrossRef] [PubMed]
  41. Hartley, T.N.; Macdonald, A.; McGrath, S.; Zhao, F.-J. Historical arsenic contamination of soil due to long-term phosphate fertiliser applications. Environ. Pollut. 2013, 180, 259–264. [Google Scholar] [CrossRef] [PubMed]
  42. Tangahu, B.V.; Sheikh Abdullah, S.R.; Basri, H.; Idris, M.; Anuar, N.; Mukhlisin, M. A Review on Heavy Metals (As, Pb, and Hg) Uptake by Plants through Phytoremediation. Int. J. Chem. Eng. 2011, 2011, 939161. [Google Scholar] [CrossRef]
  43. Mishra, A.K.; Singh, J.; Mishra, P.P. Toxic metals in crops: A burgeoning problem. In Sustainable Solutions for Elemental Deficiency and Excess in Crop Plants; Springer: Singapore, 2020; pp. 273–301. [Google Scholar] [CrossRef]
  44. US Environmental Protection Agency. “Introduction to Phytoremediation,” National Risk Management Research Laboratory, EPA/600/R-99/107. 2000. Available online: https://www.clu-in.org/download/remed/introphyto.pdf (accessed on 30 March 2022).
  45. Luo, J.; Qi, S.; Peng, L.; Xie, X. Enhanced phytoremediation capacity of a mixed-species plantation of Eucalyptus globulus and Chickpeas. J. Geochem. Explor. 2017, 182, 201–205. [Google Scholar] [CrossRef]
  46. Hasan, M.A.; Mahal, J.D.; Ali, H.A. Phytoremediation of Pb and Ni heavy metals found in soil using Myrtus communis. Eur. Asian J. BioSciences 2020, 14, 2069–2073. [Google Scholar]
  47. U.S. Department of Health and Human Services. Public Health Service Agency for Toxic Substances and Disease Registry. Division of Toxicology and Environmental Medicine. Arsenic. 2005. Available online: https://www.baltimorehealth.org/info/ATSDR%20fact%20sheet.pdf (accessed on 30 March 2022).
  48. Andrianisa, H.A.; Ito, A.; Sasaki, A.; Aizawa, J.; Umita, T. Biotransformation of arsenic species by activated sludge and removal of bio-oxidised arsenate from wastewater by coagulation with ferric chloride. Water Res. 2008, 42, 4809–4817. [Google Scholar] [CrossRef]
  49. National Ground Water Association, Copyright 2001. Arsenic. What You Need to Know. Available online: http://www.ngwa.org/ASSETS/A0DD107452D74B33AE9D5114EE6647ED/Arsenic.pdf (accessed on 28 February 2022).
  50. Pehlivan, E.; Özkan, A.M.; Dinç, S.; Parlayici, Ş. Adsorption of Cu2+ and Pb2+ ion on dolomite powder. J. Hazard. Mater. 2009, 167, 1044–1049. [Google Scholar] [CrossRef]
  51. Traunfeld, J.H.; Clement, D.L. “Lead in Garden Soils. Home and Garden,” Maryland Cooperative Extention. University of Maryland, 2001. Available online: https://www.hgic.umd.edu/media/documents/hg18.pdf (accessed on 28 February 2022).
  52. Salido, A.L.; Hasty, K.L.; Lim, J.-M.; Butcher, D.J. Phytoremediation of Arsenic and Lead in Contaminated Soil Using Chinese Brake Ferns (Pteris vittata) and Indian Mustard (Brassica juncea). Int. J. Phytoremediation 2003, 5, 89–103. [Google Scholar] [CrossRef]
  53. Interstate Technology and Regulatory Council. Phytotechnology Technical and Regulatory Guidance and Decision Trees. 2009. Available online: https://www.itrcweb.org/guidancedocument.asp?TID=63 (accessed on 28 March 2022).
Figure 1. (A) Eucalyptus tree; (B) Myrtus communis L. tree.
Sustainability 14 05655 g001
Figure 2. Distribution of the sample sites in Kirkuk city.
Sustainability 14 05655 g002
Figure 3. Physio-chemical characteristics of soil samples collected from 10 study sites. (A) The % of SOM; (B) the pH.
Sustainability 14 05655 g003
Figure 4. Magnesium and aluminum (mg/kg) levels in plant and soil samples. Mg and Al/E: in eucalyptus leaves, Mg and Al/N: in Myrtus communis L. leaves, Mg and Al/S: in soil samples.
Sustainability 14 05655 g004
Figure 5. Geo-accumulation index (Igeo) of soil samples from 10 study sites in Kirkuk city. The continental upper crust considered by Taylor and McLennan (1985) and McLennan (2001) was used for background values when calculating the Igeo index [18,19].
Sustainability 14 05655 g005
Figure 6. Bioaccumulation factor (BAF) in eucalyptus leaves from 10 study sites in Kirkuk city.
Sustainability 14 05655 g006
Figure 7. Bioaccumulation factor (BAF) in Myrtus communis L. leaves from 10 study sites in Kirkuk city.
Sustainability 14 05655 g007
Figure 8. Contamination factor (CF) in (A) eucalyptus leaves, (B) Myrtus communis L. leaves, and (C) soil samples from 10 study sites in Kirkuk city.
Sustainability 14 05655 g008aSustainability 14 05655 g008b
Figure 9. Ecological risk (Eri) in (A) eucalyptus leaves, (B) Myrtus communis L., and (C) soil samples from 10 study sites in Kirkuk city.
Sustainability 14 05655 g009
Figure 10. Pollution load index (PLI) in (A) eucalyptus leaves, (B) Myrtus communis L. leaves, and (C) soil samples from 10 study sites in Kirkuk city. Background values for plant samples were taken from Sultan et al. (2022) [21]. Background values for soil samples were calculated from Taylor and McLennan (1985) [18] and McLennan (2001) [19].
Sustainability 14 05655 g010
Figure 11. Potential ecological risk (PER) in (A) eucalyptus leaves, (B) Myrtus communis L., leaves, and (C) soil samples from 10 study sites in Kirkuk city.
Sustainability 14 05655 g011
Table 1. Description of the sample numbers, sample codes, study site names, and contributing sources of pollution.
Sample Code/SoilSample Code/Eucalyptus TreesSample Code/Myrtus communis L. TreesSample SitesContributing Sources of Pollution
S1E1N1North Oil CompanyIndustrial and domestic
S2E2N2Bus and long vehicle terminalsRoadside
S3E3N3Southwest city motorwayRoadside
S4E4N4Southern industrial siteIndustrial and roadside
S5E5N5Electricity power stationIndustrial
S6E6N6Cement production companyIndustrial
S7E7N7Northeast city motorwayRoadside and industrial
S8E8N8Old town centerRoadside and domestic
S9E9N9New city centerRoadside and domestic
S10E10N10Northwest city motorwayRoadside and industrial
Table 2. Concentration of potentially toxic elements (PTEs) (mg/Kg mean ±std) in (A) Eucalyptus leaves; (B) Myrtus communis L. leaves: and (C) Soil samples from 10 study sites. Red color indicates contamination above the permissible level, whereas light yellow indicates concentration within permissible level published by the WHO [34].
(A) Element Concentration (mg/kg) in Eucalyptus Leaves
ElementsMg ± StdAl ± StdCr ± StdCo ± StdNi ± StdCu ± StdAs ± StdSe ± StdCd ± StdHg ± StdTl ± StdPb ± Std
E12500 ± 56.6380 ± 1.30.05 ± 0.000.26 ± 0.0114 ± 0.54.1 ± 0.10.26 ± 0.010.75 ± 0.0110.058 ± 0.0020.041 ± 0.0010.05 ± 0.0030.72 ± 0.025
E25500 ± 121.6410 ± 1.41.9 ± 0.010.35 ± 0.0110 ± 0.45.8 ± 0.20.20.010.75 ± 0.0420.10 ± 0.0040.035 ± 0.0010.05 ± 0.0021.0 ± 0.035
E34400 ± 123.71100 ± 3.92.8 ± 0.100.47 ± 0.0214 ± 0.57.5 ± 0.30.32 ± 0.010.75 ± 0.0050.065 ± 0.0020.036 ± 0.0010.05 ± 0.0021.0 ± 0.035
E43000 ± 106.1590 ± 2.12.5 ± 0.090.34 ± 0.0110 ± 0.411 ± 0.40.26 ± 0.010.75 ± 0.0180.065 ± 0.0020.023 ± 0.0010.05 ± 0.0032.2 ± 0.078
E54600 ± 62.2550 ± 1.92.3 ± 0.080.39 ± 0.0114 ± 0.56.8 ± 0.20.24 ± 0.010.75 ± 0.0230.05 ± 0.0020.03 ± 0.0010.05 ± 0.0020.76 ± 0.027
E62100 ± 35.4700 ± 2.50.150.94 ± 0.037.9 ± 0.35.6 ± 0.20.79 ± 0.030.75 ± 0.0080.075 ± 0.0030.02 ± 0.0010.05 ± 0.0021.4 ± 0.049
E73700 ± 7.11300 ± 4.64.6 ± 0.160.51 ± 0.0217 ± 0.66.1 ± 0.20.63 ± 0.020.75 ± 0.0270.05 ± 0.0020.03 ± 0.0010.05 ± 0.0021.8 ± 0.064
E82100 ± 35.4510 ± 1.81.9 ± 0.070.28 ± 0.018.1 ± 0.36.2 ± 0.20.52 ± 0.020.75 ± 0.0130.067 ± 0.0020.039 ± 0.0010.05 ± 0.0020.93 ± 0.033
E93000 ± 14.1440 ± 1.61.9 ± 0.070.63 ± 0.0222 ± 0.87.6 ± 0.30.25 ± 0.010.75 ± 0.0270.05 ± 0.0020.044 ± 0.0020.05 ± 0.0020.68 ± 0.024
E103900 ± 17.7340 ± 1.21 ± 0.040.67 ± 0.020.67 ± 0.05.8 ± 0.20.16 ± 0.010.75 ± 0.0180.051 ± 0.0020.028 ± 0.0010.05 ± 0.0020.55 ± 0.019
(B) Element Concentration (mg/kg) in Myrtus communis L. Leaves
SamplesMg ± StdAl ± StdCr ± StdCo ± StdNi ± StdCu ± StdAs ± StdSe ± StdCd ± StdHg ± StdTl ± StdPb ± Std
N13300 ± 133.6370 ± 1.31.2 ± 0.041.5 ± 0.053.6 ± 0.16.3 ± 0.20.24 ± 0.010.75 ± 0.0130.21 ± 0.0070.049 ± 0.0020.05 ± 0.0020.93 ± 0.033
N22700 ± 14.1580 ± 2.11.6 ± 0.060.44 ± 0.023.1 ± 0.15.8 ± 0.20.19 ± 0.010.75 ± 0.0110.17 ± 0.0060.02 ± 0.0010.05 ± 0.0021.2 ± 0.042
N34400 ± 17.7960 ± 3.43.8 ± 0.131.9 ± 0.076.5 ± 0.25.8 ± 0.20.42 ± 0.010.75 ± 0.0110.11 ± 0.0040.02 ± 0.0010.05 ± 0.0021.5 ± 0.053
N42000 ± 3.5730 ± 2.63.1 ± 0.110.79 ± 0.035 ± 0.29.1 ± 0.30.33 ± 0.010.75 ± 0.0120.15 ± 0.0050.02 ± 0.0010.05 ± 0.0023.9 ± 0.138
N56000 ± 21.2810 ± 2.93.9 ± 0.140.83 ± 0.035.3 ± 0.26.3 ± 0.20.45 ± 0.020.75 ± 0.0140.13 ± 0.0050.02 ± 0.0010.05 ± 0.0021.4 ± 0.049
N63500 ± 84.9490 ± 1.72.9 ± 0.100.7 ± 0.0224 ± 0.85.2 ± 0.20.5 ± 0.020.75 ± 0.0270.076 ± 0.0030.042 ± 0.0010.05 ± 0.0021.1 ± 0.039
N73500 ± 38.9700 ± 2.52.7 ± 0.101.4 ± 0.056.9 ± 0.28.4 ± 0.30.46 ± 0.020.75 ± 0.0140.087 ± 0.0030.033 ± 0.0010.05 ± 0.0021.2 ± 0.042
N82500 ± 8.5240 ± 0.80.85 ± 0.030.47 ± 0.022.6 ± 0.15.3 ± 0.20.19 ± 0.010.75 ± 0.0290.11 ± 0.0040.02 ± 0.0010.05 ± 0.0020.88 ± 0.031
N92700 ± 7.1470 ± 1.71.9 ± 0.071.7 ± 0.065.6 ± 0.27 ± 0.20.27 ± 0.010.75 ± 0.0270.061 ± 0.0020.02 ± 0.0010.05 ± 0.0021.1 ± 0.039
N104800 ± 56.6330 ± 1.21.2 ± 0.040.21 ± 0.019.8 ± 0.36.2 ± 0.20.22 ± 0.010.75 ± 0.0190.067 ± 0.0020.036 ± 0.0010.05 ± 0.0020.38 ± 0.013
(C) Element Concentration (mg/kg) in Soil Samples
SamplesMg ± StdAl ± StdCr ± StdCo ± StdNi ± StdCu ± StdAs ± StdSe ± StdCd ± StdHg ± StdTl ± StdPb ± Std
S116,000 ± 141.428,000 ± 99.0120 ± 4.2415 ± 0.53100 ± 3.523 ± 0.86.3 ± 0.224.1 ± 0.1460.23 ± 0.0080.02 ± 0.0010.15 ± 0.00525 ± 0.884
S29900 ± 35.417,000 ± 60.1150 ± 5.309.6 ± 0.3465 ± 2.3210 ± 7.44.8 ± 0.172.9 ± 0.1020.52 ± 0.0180.02 ± 0.0010.095 ± 0.003140 ± 4.950
S319,000 ± 134.429,000 ± 102.5120 ± 4.2416 ± 0.57120 ± 4.225 ± 0.96.8 ± 0.245.1 ± 0.1800.28 ± 0.0100.02 ± 0.0010.17 ± 0.00627 ± 0.955
S412,000 ± 84.918,000 ± 63.689 ± 3.1511 ± 0.3970 ± 2.555 ± 1.95.4 ± 0.193.4 ± 0.1210.58 ± 0.0210.035 ± 0.0010.092 ± 0.00367 ± 2.369
S511,000 ± 77.818,000 ± 63.6120 ± 4.249.9 ± 0.3563 ± 2.224 ± 0.85 ± 0.183.5 ± 0.1230.17 ± 0.0060.02 ± 0.0010.086 ± 0.00330 ± 1.061
S617,000 ± 120.219,000 ± 67.2140 ± 4.9512 ± 0.4298 ± 3.517 ± 0.65.2 ± 0.183.4 ± 0.1220.18 ± 0.0060.02 ± 0.0010.087 ± 0.0039.1 ± 0.322
S713,000 ± 91.924,000 ± 84.9150 ± 5.3013 ± 0.4694 ± 3.326 ± 0.96.3 ± 0.223.6 ± 0.1270.29 ± 0.0100.02 ± 0.0010.12 ± 0.00434 ± 1.202
S816,000 ± 113.121,000 ± 74.2170 ± 6.0112 ± 0.4276 ± 2.724 ± 0.85.3 ± 0.193.7 ± 0.1300.25 ± 0.0090.029 ± 0.0010.11 ± 0.00433 ± 1.167
S919,000 ± 134.427,000 ± 95.5140 ± 4.9517 ± 0.60130 ± 4.627 ± 1.06.7 ± 0.244.7 ± 0.1670.24 ± 0.0080.02 ± 0.0010.14 ± 0.0059.1 ± 0.322
S1019,000 ± 67.225,000 ± 88.4150 ± 5.3014 ± 0.49110 ± 3.920 ± 0.76.4 ± 0.234.1 ± 0.1450.19 ± 0.0070.02 ± 0.0010.12 ± 0.00411 ± 0.389
Publisher’s Note: MDPI stays neutral with regard to jurisdictional claims in published maps and institutional affiliations.

