1. Introduction
Agriculture is land use that has a significant impact on the environment. The development and modernization of agricultural practices have resulted in some negative effects involving environment and product quality, such as the degradation of surface water and groundwater due to the release of fertilizers and pesticides [
1,
2,
3,
4], the accumulation of harmful substances, among them nitrates [
5,
6], into the vegetable products, and the general soil depletion due to erosion phenomena. Some long-term effects of intensive agriculture may include eutrophication of surface waters, diffuse pollution of nitrates in groundwater and soils, acidification, and global warming [
4,
7,
8,
9].
Nevertheless, the environmental impact of farming is considered more hazardous than that of agriculture [
10], since it consists of both rapid consumption and pollution of water resources. Great quantities of water are required for both animals growing and their feed production; moreover, manure contains high organic loads [
11]. Sewage and effluents produced by livestock contain high nutrient levels; this fact stimulated, over the centuries, the identification of practices of their optimal use in agriculture, by effectively transforming the sewage from waste to resources. The use of sewage as soil improver in agriculture involves the verification of its environmental sustainability. This can be made at a local, basin, and regional scale. Even if manure is an excellent source of nutrients that can locally contribute to increase crop production, its unregulated use in agriculture can produce diffuse nitrogen (N) losses that, long-term, give rise to excessive nitrate concentrations in groundwater and surface water, even far from the site of use, causing toxic effects in drinking water or eutrophication of surface waters [
10,
11,
12].
One of the global challenges regarding sustainability of the food chain is to produce enough vegetables and meat for the ever-growing world population, and, at the same time, to minimize the release of reactive nitrogen (N) into the environment. This could be made by finding an optimal balance between crops and farms in highly exploited lands. Since the 1980s, agriculture management in Western Europe has tended towards the reduction of N surplus, owing to gradually more restricting European Community policies [
13,
14]. The European Union adopted the Nitrates Directive (EU, 1991: directive 91/676/EEC), which induced all member states to guarantee the use of proper production methods to restrict pollution resulting from excessive use of nitrates. The main objective of the Nitrates Directive is to reduce water pollution, induced or directly caused by nitrates (or by phosphorus) from agricultural sources.
The natural concentration of nitrates in groundwater is usually less than 10 mg/L [
15,
16], while values greater than 50 mg/L, considered a threshold worthy of attention as a possible hazard, were found in 15% of European monitoring wells in the period 2004–2007 [
15]. Nitrate concentration exceeding 50 mg/L in surface water was observed in only 3% of European water bodies in the same period [
15]. Nitrate concentration values above this threshold were found in Campania Region, Italy (up to 200 mg/L) [
17], in Piedmont Region, Italy (up to 150 mg/L) [
18], in Sardinia Region, Italy (up to 150 mg/L) [
19].
The Nitrates Directive, EU 91/676/EEC, legally restricts application of nitrogen from organic manure on soils to 170 kg/ha of nitrogen (N) and, in case of derogation, up to 250 kg/ha [
20]. A direct consequence of this directive was the establishment of Codes for Good Agricultural Practices (CGAP) in each member state.
In theory, the optimal number of farms should be equal to or less than those producing manure applicable to soil. The question is: at what scale should this optimization be carried out? What is the maximum scale dimension at which manure application on soil (taking into account its transportation) is economically viable by respecting the Nitrates Directive?
In 2011, the European Union (EU) Nitrates Directive (European Commission, 2011) established the criteria for the delimitation of “Nitrate Vulnerable Zones (NVZs)”, highlighting the environmental pollution problems resulting from the excessive release of nitrates in surface water and groundwater, mainly focusing on the progressive degradation of waterbodies and the need to protect them from external sources of pollution [
21,
22].
This means that a comparative evaluation of the different available techniques for agriculture management has to be done for each NVZ, in order to identify which of them allow a satisfactory crop production, in accordance with the preservation of the natural elements and the balance of the ecosystem present in the NVZ. So, the optimization of farm numbers compatible with agriculture practices moves to the NVZs scale, which is often legally managed by different policy authorities.
In this work we describe the procedure adopted to estimate the potential and effective nitrate load from the different sources and to assess the previous and actual contamination by nitrate at different scales. We considered the contribution of civil sources, industry, agriculture, and livestock. We neglected atmospheric deposition (data related to Europe can be found in [
23]) as a source of nitrates in accordance with [
24], since the highest measured values in Italy are about 20–25 kg/(ha y) [
25,
26]. The proposed methodology produces results that can be directly used by the different policy authorities (from regional to basin to municipal) to define rules for farm sustainability and good agriculture practices.
The first step of the procedure is total hazard identification, i.e., the characterization of all the possible sources of nitrates, the potential generated load of nitrogen, and the potential affected groundwater and soil, also by taking into account soil vulnerability.
The second step is the estimation of the magnitude of diffuse N contamination from all of the sources in order to observe how agricultural loads are influenced by factors, such as management practices and type of fertilizers (organic or inorganic).
The third step consists in the evaluation of infiltration by a fully distributed hydrological model, in order to subsequently use the results to predict contamination from the known effective loads.
The study was applied to the Umbria region; a time series of four years of data, from 2008 to 2011, were analyzed.
2. Materials and Methods
2.1. Site Description
The Umbria region is located in central Italy, with a surface of 8456 km² and about 910,290 inhabitants. It is the only peninsular region not bordered by the sea. Umbria presents high pollution levels of aquifers, especially with respect to nitrates.
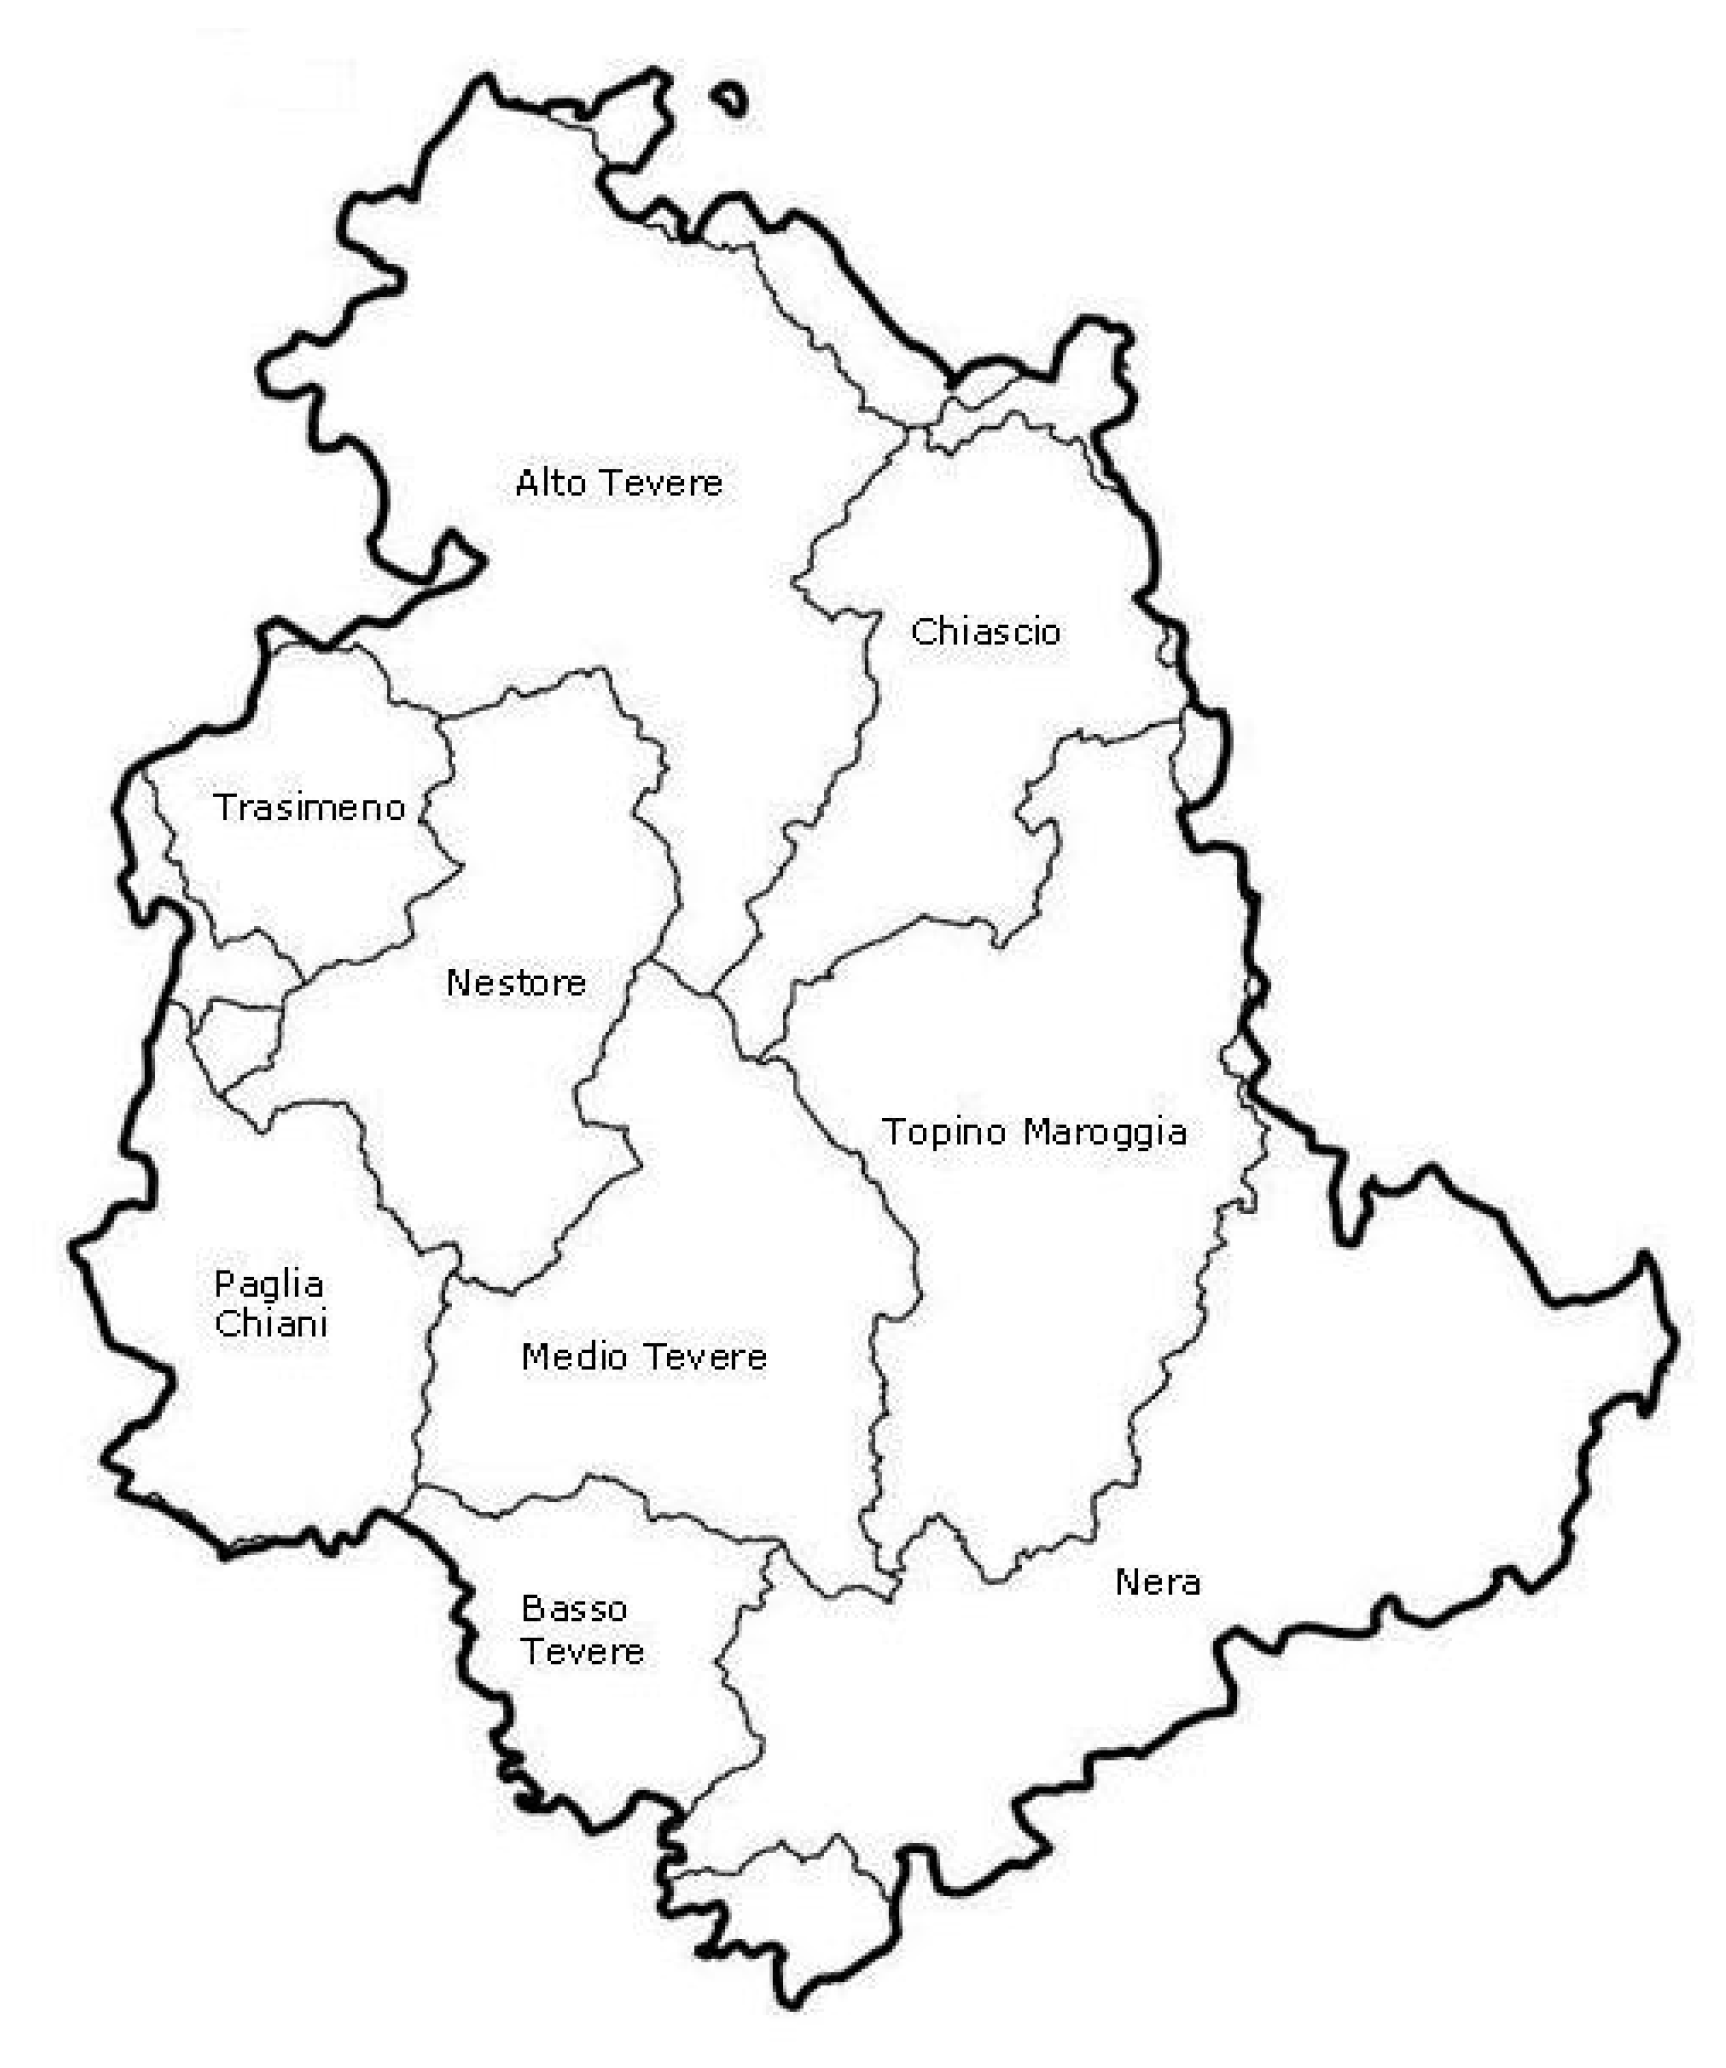
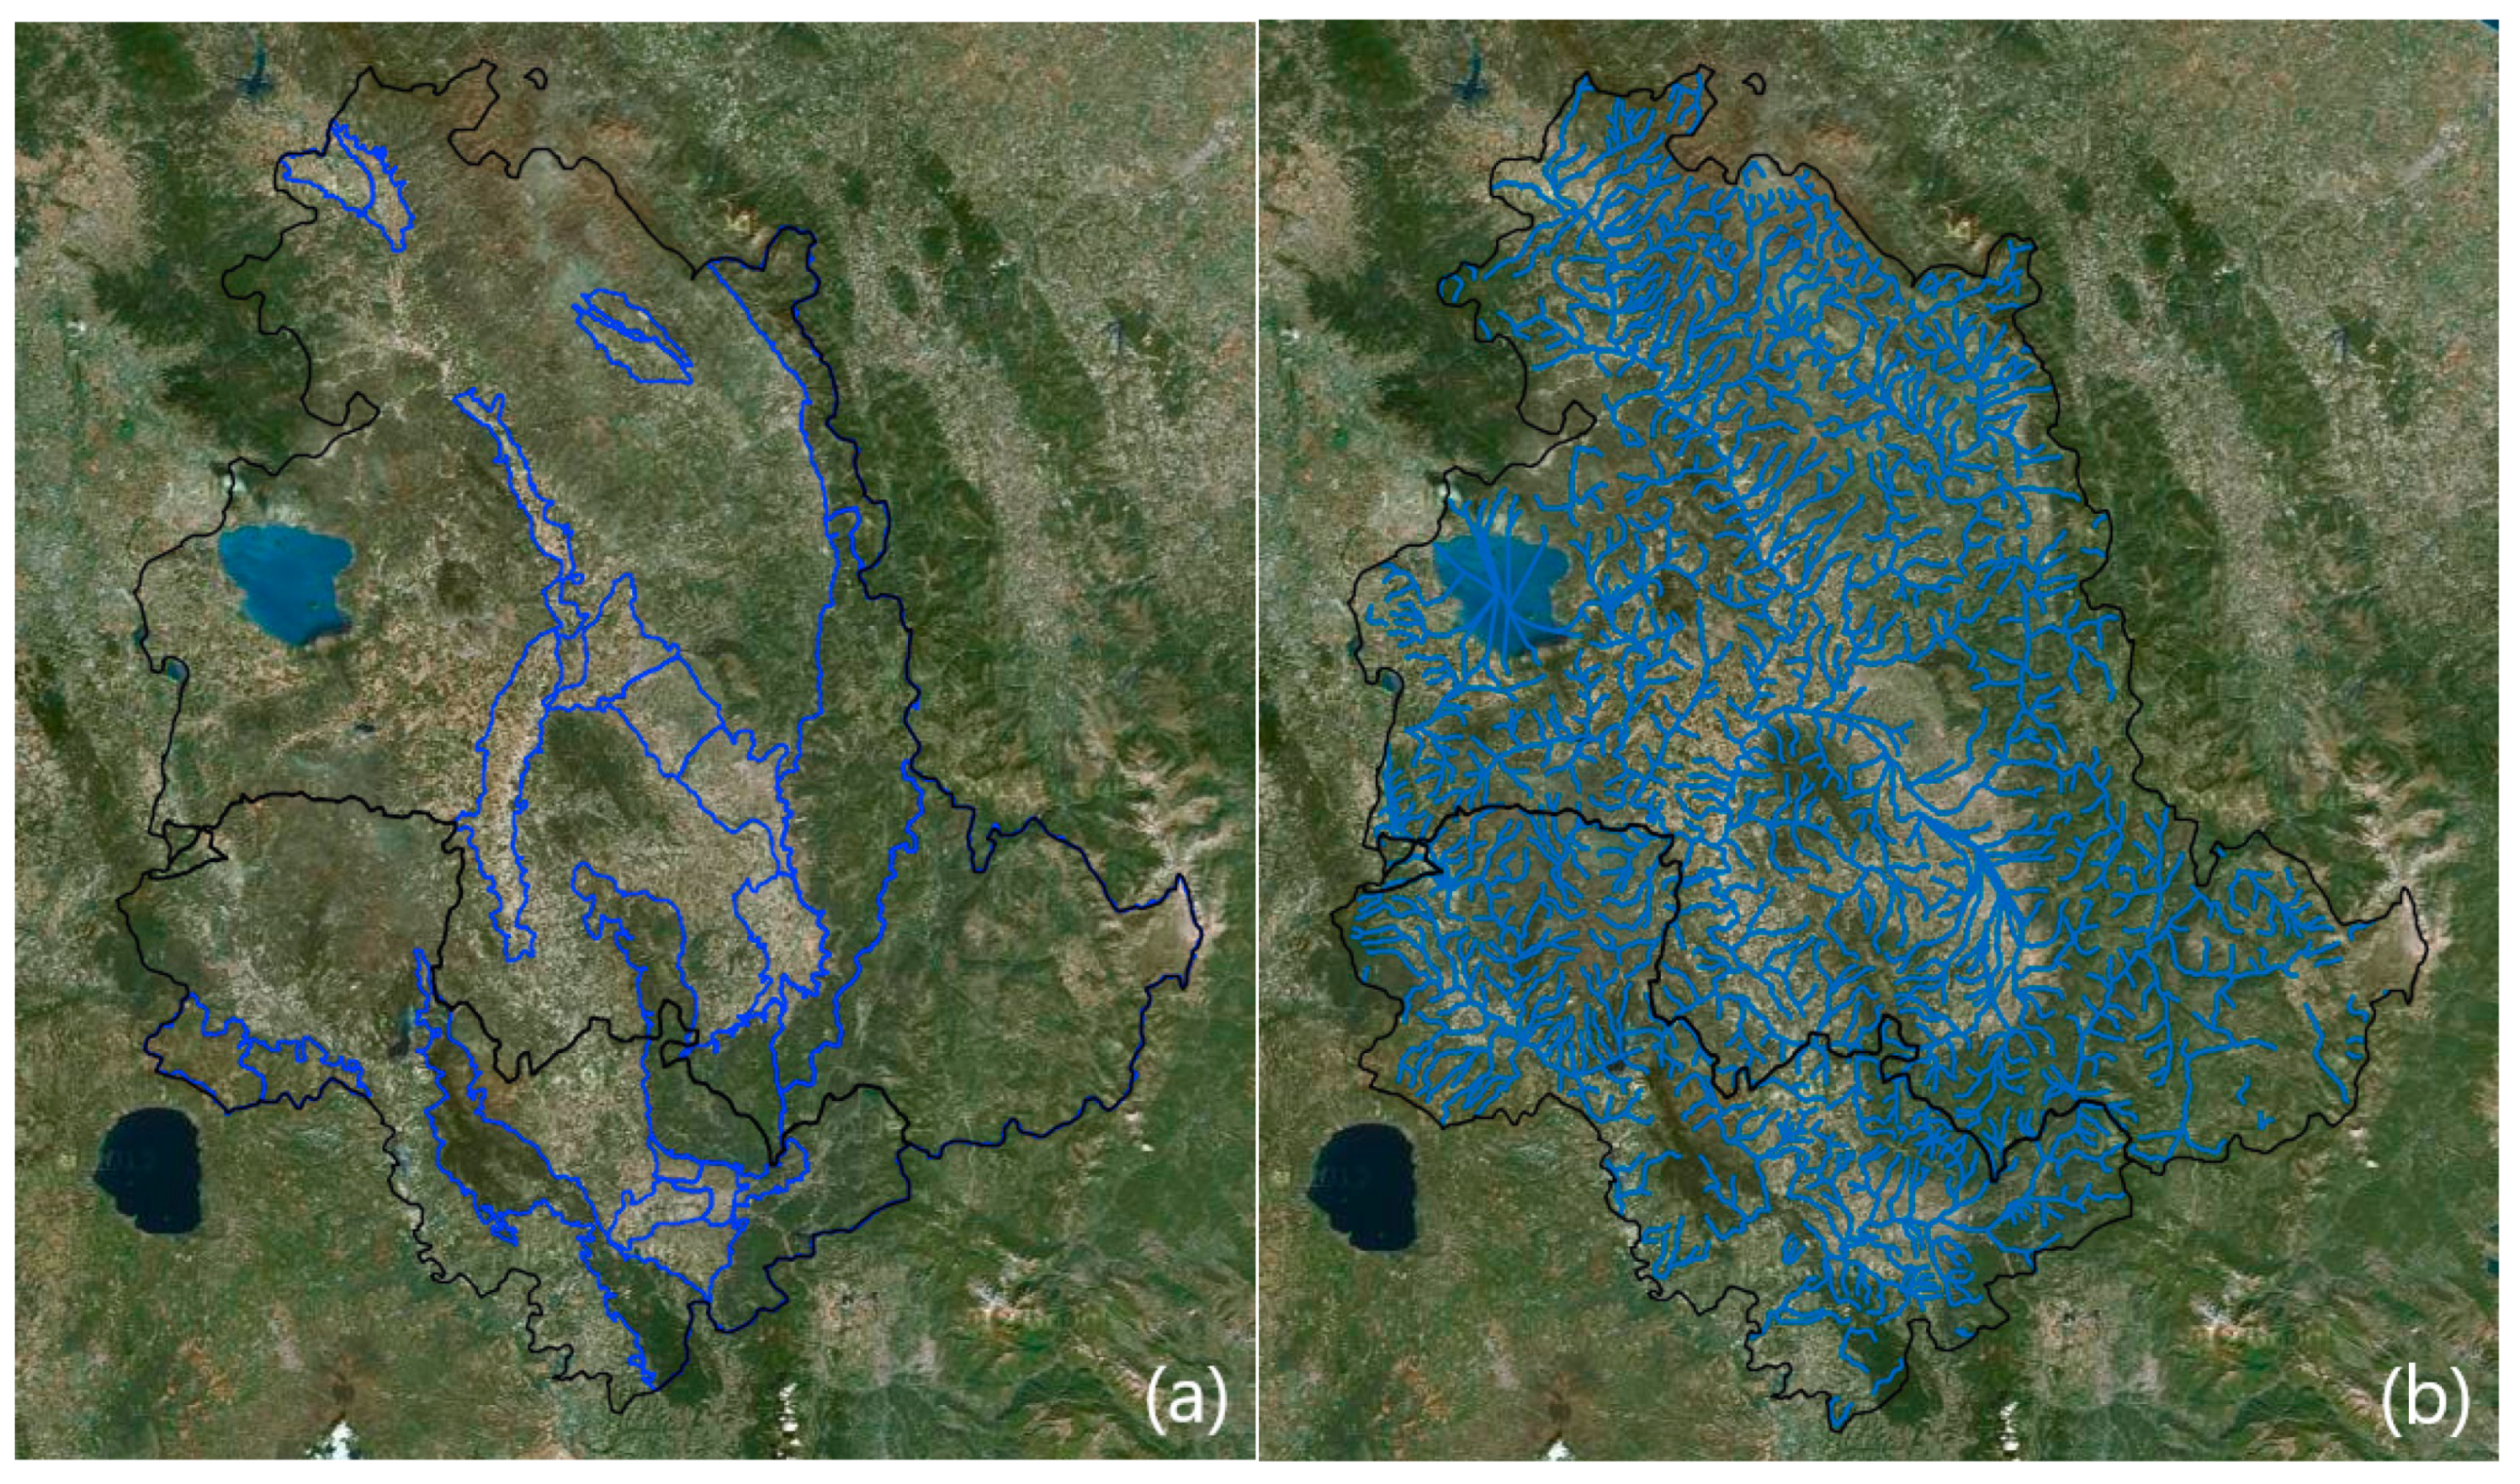
The territory of Umbria is included almost entirely within the catchment area of the river Tevere. It has a morphology that is mainly mountainous on the east side and hilly on the central and western sides. Morphological and lithological features of Umbria affect the location and characteristics of surface waters and groundwater. Nine regional sub-basins (main catchments) are identified (see
Figure 1); they fall, in whole or in part, within the region.
Only limited portions, in the eastern part of the region, fall in the catchment areas of rivers that, after crossing the territory of the Marche region, flow into the Adriatic Sea: Metauro, Esino, Potenza, and Chienti. Their total area is equal to 3% of the regional total. To the west of Lake Trasimeno, a small piece of land (about the 1% of the regional total) falls in the catchment area of the Arno River.
Figure 2 shows the hydrographic network and the main aquifers in Umbria region.
The most common lithologies are limestones, marly limestones, and limestone–marl. The major hill systems, located along the northeast and west part of the region, with prevailing direction northwest to southeast (NW)–(SE), are characterized by marly sandstone in various proportions.
The flat areas are characterized by the presence of alluvial compartments, grained highly heterogeneous, and of variable thickness, within which there are common sedimentary structures, such as ancient riverbeds and paleo fans (conoid).
The southwestern portion of the region is occupied by deposits of volcanic origin as a result of volcanic eruptions of the Vulsini which gave rise to powerful banks pyroclastics.
The morphological characteristics of the region, together with the lithological and structural conditions, of course, affect the location and characteristics of both surface and underground water bodies.
2.2. The Rough Datasets
We adopted an approach based on field tests at the regional level integrated with data from the sources: the type of fertilizer (inorganic or cattle manure), the type of industrial sources, the census of livestock, and hydrological and geological data. The large amount of field data were treated and grouped into a homogeneous database in order to be interpreted at the different scales, from local to basin to regional scale and to extract relevant information. We extracted data from 2001 to 2011. We aggregated data for the years 2008 to 2011.
Field data used mainly came from:
Most of these data are publicly accessible. The data from the monitoring networks are only publicly accessible in aggregate form; detailed information is only available by authorization from the Regional Environmental Agency (ARPA, Umbria region) [
27].
2.2.1. The Census of Farms
The data on the number of heads on farms are identified and made available on the Italian Ministry of Health website [
28]. The database can be queried by municipality, province, and region and reports livestock data for the whole year for each farm. It also contains information regarding the type of breeding, type of farm, and general features of farms. Data are available for swine, bovines, goats, and sheep, respectively; swine census also shows the values related to the maximum capacity of heads of each municipal farm. Missing data were replaced with data collected from other sources, such as interviews with farmers or access to the websites of breeder associations.
The nitrogen load, potentially generated by livestock on the soil, was estimated by applying load factors for type of species, i.e., by multiplying the load potentially generated for each head of cattle by the number of heads in each municipal area. Then, the amount of nitrogen load was aggregated at the different scales to correlate the contribution of each type of breeding with the measured nitrate contamination.
By using data available on the regional website of the Italian Ministry of Health (Azienda Sanitaria Locale of Regione Umbria, ASL) [
29], it was possible to construct a new database that linked each municipality with the related amount of heads in each livestock to assess nitrate hazards.
2.2.2. The Census of Crops
We used data from the 5th Census of Agriculture conducted by the National Institute of Statistics (ISTAT, Italy) in 2000 [
30]; data on parcels from the Municipal Urban Plan (Piano Urbanistico Comunale, PUC) of each municipality, detailing the different classes of crops; and data on extension of crops for the different classes of cultivation from the municipal agricultural land register of each municipality.
The global agricultural nitrogen load potentially generated was calculated by multiplying the average rate of use of inorganic fertilizers (utilized for each type of crop) to the value of the agricultural surface cultivated. Agricultural nitrogen load was estimated at the municipal scale from the nutrient requirements of each individual crop with reference to the Codes for Good Agricultural Practices (Italian CGAP) [
31]. Nutrient requirements represent the best possible estimate of the emissions into the environment from the agricultural sector.
The estimation procedure consists of the following steps:
- -
Grouping macro-field codes of use, relative to the needs of nutrients and assignment of specific needs (per hectare) of nutrients for each crop at municipal scale;
- -
Geo-referencing of parcels listed on the PUC for the different classes of crops;
- -
Aggregating the crops extension at the municipal scale for the different classes of crops;
- -
Estimating the agricultural needs of each municipality.
2.2.3. The Census of Industries and Population
Data on the resident population at the municipal scale were provided by the 14th General Census of Population and Housing carried out by ISTAT in 2001 [
30] and from the Municipal Register of Population.
Data on industries came from the Regional Land Urban Plan (Piano Urbanistico Territoriale, PUT) [
32].
2.2.4. Field Data from Monitoring Networks
Data on precipitation and water quality came from the specific reports produced by ARPA (Environmental Regional Protection Agency, Umbria region) [
27], and from the Regional Water Protection Plan (Piano Urbanistico Territoriale, PUT) [
32].
2.3. The Infiltration Model
Hydrological conditions influence leaching and transportation of nutrients to groundwater and surface waters. The flow of nitrates to groundwater depends, in a complex way, on both the amount of water that infiltrates the soil (and reaches the underground aquifers) and the chemical and biological mechanisms.
Infiltration is influenced by climatic, geomorphological, and lithological features that complicate the final estimation of nitrates concentration. Infiltration was estimated on the entire region using the distributed hydrological model CONTINUUM, developed by the Centro Internazionale di Monitoraggio Ambientale - CIMA Research Foundation [
33,
34], and embedded in a proper web GIS platform developed to the scope. The model solves the equations of mass balance and energy to a spatial scale of the order of 100 m.
The modules that constitute the CONTINUUM model are:
- (1)
Network of drainage: the identification of drainage directions and the hydrographic network is performed by starting from the Digital Elevation Model (DEM). Each cell in which the basin is discretized is classified as “slope” or “channel” by applying a morphological filter that takes into account the slope and the drained area upstream. Using the digital terrain model, the topographic slope (β) is also calculated. β is used in modules (d) and (e).
- (2)
Vegetation interception: it is the portion of precipitation that is intercepted by the vegetation cover (trees, turf, bushes, etc.) and which cannot reach the ground. It is modeled as a tank with maximum defined capacity that can be filled up to the maximum value, after which the precipitation falls to the ground, until evaporation at least partially empties the tank. Tank capacity is estimated using the Leaf Area Index (LAI) measured by satellite. When LAI data are not available, reference is made to data from literature or to information layers relating land use and vegetation cover.
- (3)
Infiltration and subsurface runoff: the model adopted explicitly links the soil moisture conditions at a certain instant with the maximum infiltration capacity. It can simulate the low intensity or intermittent rainfall as periods of rain followed by periods of no rain, percolation by gravity, and propagation of moisture from an area to another of the same basin. The soil is schematized as a reservoir of defined capacity.
- (4)
Deep runoff and groundwater flow: the deep runoff is modeled with a simplified approach that seeks to minimize the number of parameters and maintain the fully distributed structure of the model. The basic hypothesis is that in each point of the basin the soil layer above the bedrock has a thickness that is a function of the surface slope. For each cell, a tank is defined, whose maximum capacity and percolation coefficient are linked to the soil characteristics of the first soil layer. The depth of the soil is identified by the formulation based on the topographic slope tg (β).
- (5)
Surface runoff: the surface runoff follows two partially different patterns for the channels and the slopes. In the channel cells, which in the model represent the channeled network, the approach is similar to a kinematic schematization. For the slopes, the model uses a linear tank approximation.
- (6)
Energy balance and evapotranspiration: it explicitly solves the complete energy balance by determining the surface temperature of the soil with a force–restore approach for solving the heat equation in the soil.
The CONTINUUM model was calibrated for the flow in many relevant sections: main outputs are the aggregated results at different resolution scales, such as the catchment, municipal, and aquifer scale. The results are used to assess contamination by nitrates from the different sources and to assess vulnerability zones.
2.4. Software
Open source software was mainly adopted for this work. Google Earth was used to generate maps of the Umbria region. The open source Geographic Information System (GIS) MapWindow 4 was used to generate layers. Custom plugins were created in MapWindow 4 to connect the database and the mathematical models. The database was created in MySQL. The web-tool was developed in JavaScript and C++.
3. Results
All of the calculations are made for obtaining the following results:
- -
Source identification: a reliable estimation of nitrogen loads from the existing sources aggregated at different scales (from census data);
- -
Hazard assessment: assessment of nitrate contamination (using field data, aggregated at different scales);
- -
Infiltration assessment: a reliable estimation of infiltration, aggregated at the different scales (using precipitation, hydrologic, and geochemical data, GIS, and physically based mathematical models).
3.1. Estimation of Nitrogen Loads Potentially Generated in Umbria Region
The nitrogen loads are related to four main sources: civil, industry, agriculture, and livestock.
The estimation of the nitrogen loads potentially generated was obtained by applying coefficients of unit loads to the data representing the sources. The consistency of the sources here considered is related to the assessed population, workers in the industrial activities, and hectares dedicated to organic livestock. Data are mainly taken from the dataset of the most recent ISTAT Census [
30].
The loads generated and produced by the different sectors do not represent the nitrogen effectively discharged into the environment. As an example, for the civilian contribution, the polluting load generated is due to nitrogen and other pollutants produced before being sent to the sewage treatment systems. Releases into the environment can be estimated from the loads generated by applying a percentage of reduction or loss.
In regards to the analysis at a regional and sub-basin scale, data from the Water Protection Plan (Piano Urbanistico Territoriale, PUT) [
32] were used. This plan also shows the most important parameters to be monitored for each sector and those strictly related to the total load of nitrogen, as the total phosphorus, the Biological Oxygen Demand (BOD), and the Chemical Oxygen Demand (COD) for animal husbandry, population, and industry.
This assessment provides an estimation of the weight of the different compartments causing nitrogen emissions into the environment. The load is estimated as the potential load that theoretically can enter the territory.
3.1.1. Civil Load Potentially Generated
Civil load potentially generated is calculated by applying load factors per inhabitant reported in
Table 1, suggested in the Regional Plan of Drainage Water (PRRA, Umbria region), to data on the resident population, at the municipal scale provided by the 14th General Census of Population and Housing, carried out by ISTAT in 2001 [
19].
Data at the municipal scale have been restated for the nitrogen to sub-basin scale using the distribution of the municipal population within river basins, similar to what was done to estimate water needs. The results of the aggregation processing at the sub-basin scale are presented in
Table 2.
The contribution of nitrogen is very relevant, with over 3700 tons per year. However, this total load cannot be taken into account if civil wastewater is correctly treated in specific plants; in this way, it contributes to a smaller amount to the nitrate concentration in groundwater. The Italian decree Dgls 152/2006 set the limit of 15 mg/L for the total nitrogen concentration in the water released by urban wastewater treatment plants (10,000–100,000 inhabitants), and 10 mg/L for plants with higher potentiality. An efficiency of removal in the range 70–80% is also requested by Dgls. 152/2006. By considering an average efficiency equal to 70% applied to data in
Table 2, the estimated civil nitrogen load potentially generated is about 1100 tons per year.
3.1.2. Industrial Load Potentially Generated
The groundwater protection plan illustrates the industrial loads potentially generated in the Umbria region. For the estimation of the potential nitrogen load, we adopted the parametric coefficients proposed in [
35,
36], undifferentiated by type of industrial sector. Results are shown in
Table 3.
3.1.3. Agricultural Load Potentially Generated
The calculated loads do not distinguish between chemical and organic origin. It is reasonable to assume that fertilizers of zoo-technical origin are widely used in agriculture; the optimum management practice being the use of the maximum possible quantities of animal organic waste as a fertilizer in crops where this is allowed.
The value of the average rate of use of nitrogen for each crop is assumed to be equal to the dose indicated in the Good Agricultural Practice Code (Italian GAPC) [
31], see
Table 4.
Results at sub-basin scale are reported in
Table 5.
3.1.4. Zoo-Technical Load Potentially Generated
The nitrogen load potentially generated by livestock was estimated by applying load factors for type of species, provided by the PRRA survey, to the number of animals bred in the region, extracted from the 5th Census of Agriculture conducted by ISTAT in 2000 [
17], and grouped at the different scales (
Table 6).
Data at the municipal scale were reworked to a sub-basin scale using municipality distribution within the river basins. Therefore, the hypothesis that ascertains that livestock activities are uniformly distributed throughout the municipality is supported.
3.1.5. General Overview
Figure 3 shows a summary of the calculated potentially generated loads. It can be seen that the agricultural sector is the major contributor of nitrogen production and the calculated potential load is more than double the load generated by the other sources.
It should be stressed that the analyzed sources differently affect surface water and groundwater. In particular, civil and industrial substantially affect surface waters, with the exception of civilian discharge conveyed to treatment plants spilling on the soil that can reach groundwater. The agricultural sector has an impact on both surface water and groundwater, the latter being prevalent.
3.2. Analysis of Nitrogen Loads Generated in Umbria Region at Municipal Scale
We calculated the loads from agriculture and livestock at municipal scale, by reconstructing a comprehensive database for years 2008, 2009, 2010, and 2011.
3.2.1. Agricultural Load
Some results obtained at a municipal scale are reported in the following figures.
Figure 4 reports the spatial distribution of annual agricultural loads for each municipality. There is no substantial difference between years 2008, 2009, 2010, and the generated nitrogen loads are approximately constant over the three reference years. The effects of crop change (see
Figure 5) on nitrogen loads require times longer than one year to be appreciable.
Figure 5 represents the municipal distribution of the types of crops that most contribute to the agricultural nitrogen load at a municipal scale. It can be noted that arable lands are almost everywhere among the crops that have the greatest impact on nitrogen needs, and in some municipalities, olive trees and grape. If these results are compared with values contained in
Table 2, representing the potential nitrogen specific load for each crop, we can suppose that arable land overfertilization is greater than for olive trees.
Figure 6 shows, by way of example, the percentage of the agricultural nitrogen load at municipal scale due to arable lands and olive trees.
The vast majority of soil dedicated to agricultural use in the Umbria region is occupied by arable lands with almost 68% of the total. This is one of the reasons for the massive use of fertilizers in the sector in order to guarantee an appropriate/adequate production of the land designed for the scope. Moreover, it should be noted that, in part of the regional territory, to the north and east, arable lands account for more than 75%, while the olive trees are more concentrated in the central and southern part of the Umbria region.
3.2.2. Zoo-Technical Load
Regarding the results reported in paragraph 3.1.4, a specific assessment of the effective nitrogen released by livestock was carried out. Using data from the census, an accurate estimation of nitrogen able to reach the aquifer was made, by considering the losses due to evaporation of the lighter chemicals components as ammonia.
The amount of heads for each municipality was multiplied by the unitary load, subsequently, it was multiplied by the different averaged percentages of evaporation/release into the soil considered for each breed, due to the different physical characteristics of sewage and manure produced taken into consideration:
Results are:
Swine: 72% in soil and 28% evaporation;
Cattle: 50% in soil and 50% evaporation;
Sheep and goat: 100% in soil.
Calculations were made for each breed and for each one of the four years taken into account. The results represent the nitrogen load effectively released in a specific municipality by the zoo-technical sector. The main contribution is given by swine farms.
Figure 7 shows the nitrogen load effectively released by the sum of swine and cattle farms in years 2008, 2009, 2010 at municipal scale.
The study revealed a marked difference between the number of heads of cattle censored by the Italian Ministry of Health [
28] and the numbers of heads registered in the stables for some municipalities. Nitrogen loads were assessed in these cases by using the maximum capacity of each farm (stable capacity data), in order to consider the worst conditions in terms of potential nitrogen load at municipal scale.
3.2.3. Chemicals Supply
In the municipalities where the agricultural demand of nitrogen is too high with respect to its production by the zoo-technical sector in the same municipality, the use of chemical fertilizers is expected for the missing part. It is found that the nitrogen loads from livestock are always lower than the agricultural needs at a municipal scale, although there is a marked variation between municipalities.
The chemical loads are calculated simply as the difference between the municipality needs and the nitrogen loads from zoo-technical activities, such as livestock and farms.
This kind of evaluation could appear too simple; however, there are no data referred to the quantities and timing of the chemical fertilization.
3.3. Assessment of Nitrate Concentration
We developed a web tool, where two active layers are present. They allow a dynamic analysis of the trend of concentrations in surface water (Surface Water Nitrate Concentration Map) and in groundwater (Ground Water Nitrate Concentration Map), respectively. They also permit studying the behavior of maximum and average concentrations in the selected aggregation period (year, month, week) and the frequency/probability of exceeding defined thresholds (0.6, 2.4, 4.8 mg/L for surface water and 25, 50, and 100 mg /L for groundwater) over the selected period. The spatial resolution can be selected as municipality, province, single catchment, main catchments, alluvial aquifers, significant aquifers.
The period of investigation here reported is related to years 2008, 2009, 2010, and 2011.
3.3.1. Groundwater
The analysis of groundwater data was performed for significant aquifers, regional sub-basins, and municipalities, and involved the study of the probabilities of exceeding the proposed thresholds and the analysis of the maximum concentration values.
The first step concerned significant aquifers.
The 4-year analysis led to the evidence proposed in
Table 8, where the worst affected sites are those of Valle Umbra and the Media Valle (MV) del Tevere Sud. Trends refer to the analysis of the exceeding frequencies and the maximum concentration recorded for these aquifers. An example of the layer generated for the year 2010 is shown in
Figure 8a.
The second step concerned the analysis of concentration data at the main catchments scale (see
Figure 8b generated for year 2010), where the Chiascio regional sub-basin presents the worst situation averaged during the four years here considered. Moreover, Medio Tevere, Alto Tevere, and Topino Marroggia are characterized by significant exceeding frequencies, with respect to the thresholds of 25 and 50 mg/L of nitrates. Chiascio main catchment is affected by higher values than the other sub-basins in regards to the threshold of 100 mg/L. Furthermore, this sub-basin is marked by clearly higher absolute maximums than those occurring in the other sub-basins. Results are reported in
Table 9.
The third phase regarded data elaboration and aggregation at a municipal scale. At this scale, frequencies of exceeding the thresholds and concentration maximums worthy of attention were found for groundwater contamination in the municipality of Bettona, located in the province of Perugia. Data are shown in
Table 10.
Figure 9 shows the different layers generated at a municipal scale for the year 2008.
Groundwater concentration maps of years 2008–2011 were then compared in order to observe possible trends in nitrate contamination during time.
In 2008, the mean concentration over the whole year was dangerously high in the Medio Tevere sub-basin, included in the range 50–100 mg/L, the law limit being established equal to 50 mg/L (hazard quotient greater than 1 all year long). All of the other sub-basins in the north part of the region were found to be worthy of attention, since, even if the mean concentration registered during the year was under the threshold, maximum concentration exceeded the threshold during repeated periods.
By changing the spatial resolution to the municipalities, the critical zones were in Umbertide, where the mean concentration was over 100 mg/L in 2008; and Perugia, Marsciano, Deruta, Bettona, Campello sul Clitullo, Trevi, Castel Ritaldi and Spoleto, where the mean concentration of nitrate in groundwater was over the threshold.
A situation pretty different, but equally alarming, was found in the year 2011. The mean concentration in the main catchments of Trasimeno, Nestore, and Chiascio was in the range above the law limit, i.e., 50–100 mg/L. Instead, the municipalities at potential high risks were: Panicale, Deruta and Bettona, where the mean concentration was above 100 mg/L; and Lisciano Niccone, Castiglione del Lago, Assisi, Bastia, Torgiano, Colazzone, Trevi, Spoleto, Avigliano Umbro, Montecastrilli, and Stroncone where the mean concentration was in the range 50–100 mg/L.
Overall, it is noticeable that the massive presence of nitrates in groundwater remains an ascertained hazard for the inhabitants of some municipalities. Moreover, by analyzing all of the layers, it is confirmed that the contamination situation can vary quite rapidly over the years.
Finally, the layouts describing the probability of exceedance must be carefully analyzed: as a potential hazard for the population, two zones at equal mean nitrate concentrations, but different peak values of nitrates recorded during the year, can possess very different hazards (risk potential) for population.
3.3.2. Surface Water
The analysis of surface water data was also divided into different steps and involved the study of the probabilities of exceeding the proposed thresholds and the study of the maximum concentrations inside regional sub-basins and municipalities. Results of the years 2008, 2009, 2010 are here reported.
With reference to main catchments, the 3-year analysis led to the evidence proposed in
Table 11, where, globally, the worst sub-basins were Nestore and Alto Tevere. The consistency of the data of surface water was less than that collected of groundwater. All of the sub-basins showed pollution problems in the time range considered, but the two identified ones were considered the most affected by the presence of nitrates.
The second step of the analysis of concentration data in surface waters concerned the municipalities. At this aggregation scale, frequencies of exceeding the thresholds and maximums of concentration worthy of attention for surface waters were found in an appreciable number of municipalities, of which those with the highest hazards were Marsciano and Norcia, located in the province of Perugia (see
Table 12). The first falls into one of the worst sub-basins previously identified (Nestore). These sites were identified among the municipalities with a significant presence of measuring stations in the area (municipalities with a single station were not considered).
In conclusion it can be affirmed that during the four years, the frequencies and the maximums of both the municipalities and the contaminated sub-basins varied greatly. In general, however, the level of contamination varied less in the sub-basins (e.g., Nestore and Alto Tevere always remained at the top of the list). Therefore, it would have been desirable that policies for good practices, involving the optimization of the use of sewage and manure fertilizers, were defined at a sub-basin scale.
3.4. Estimation of Infiltration
The CONTINUUM model is used to estimate infiltration.
Figure 10 and
Figure 11 show, respectively, the precipitation (one of the main inputs of the CONTINUUM model that can be supplied at different aggregation scales) and soil evapotranspiration, calculated by the model for years 2007 and 2010.
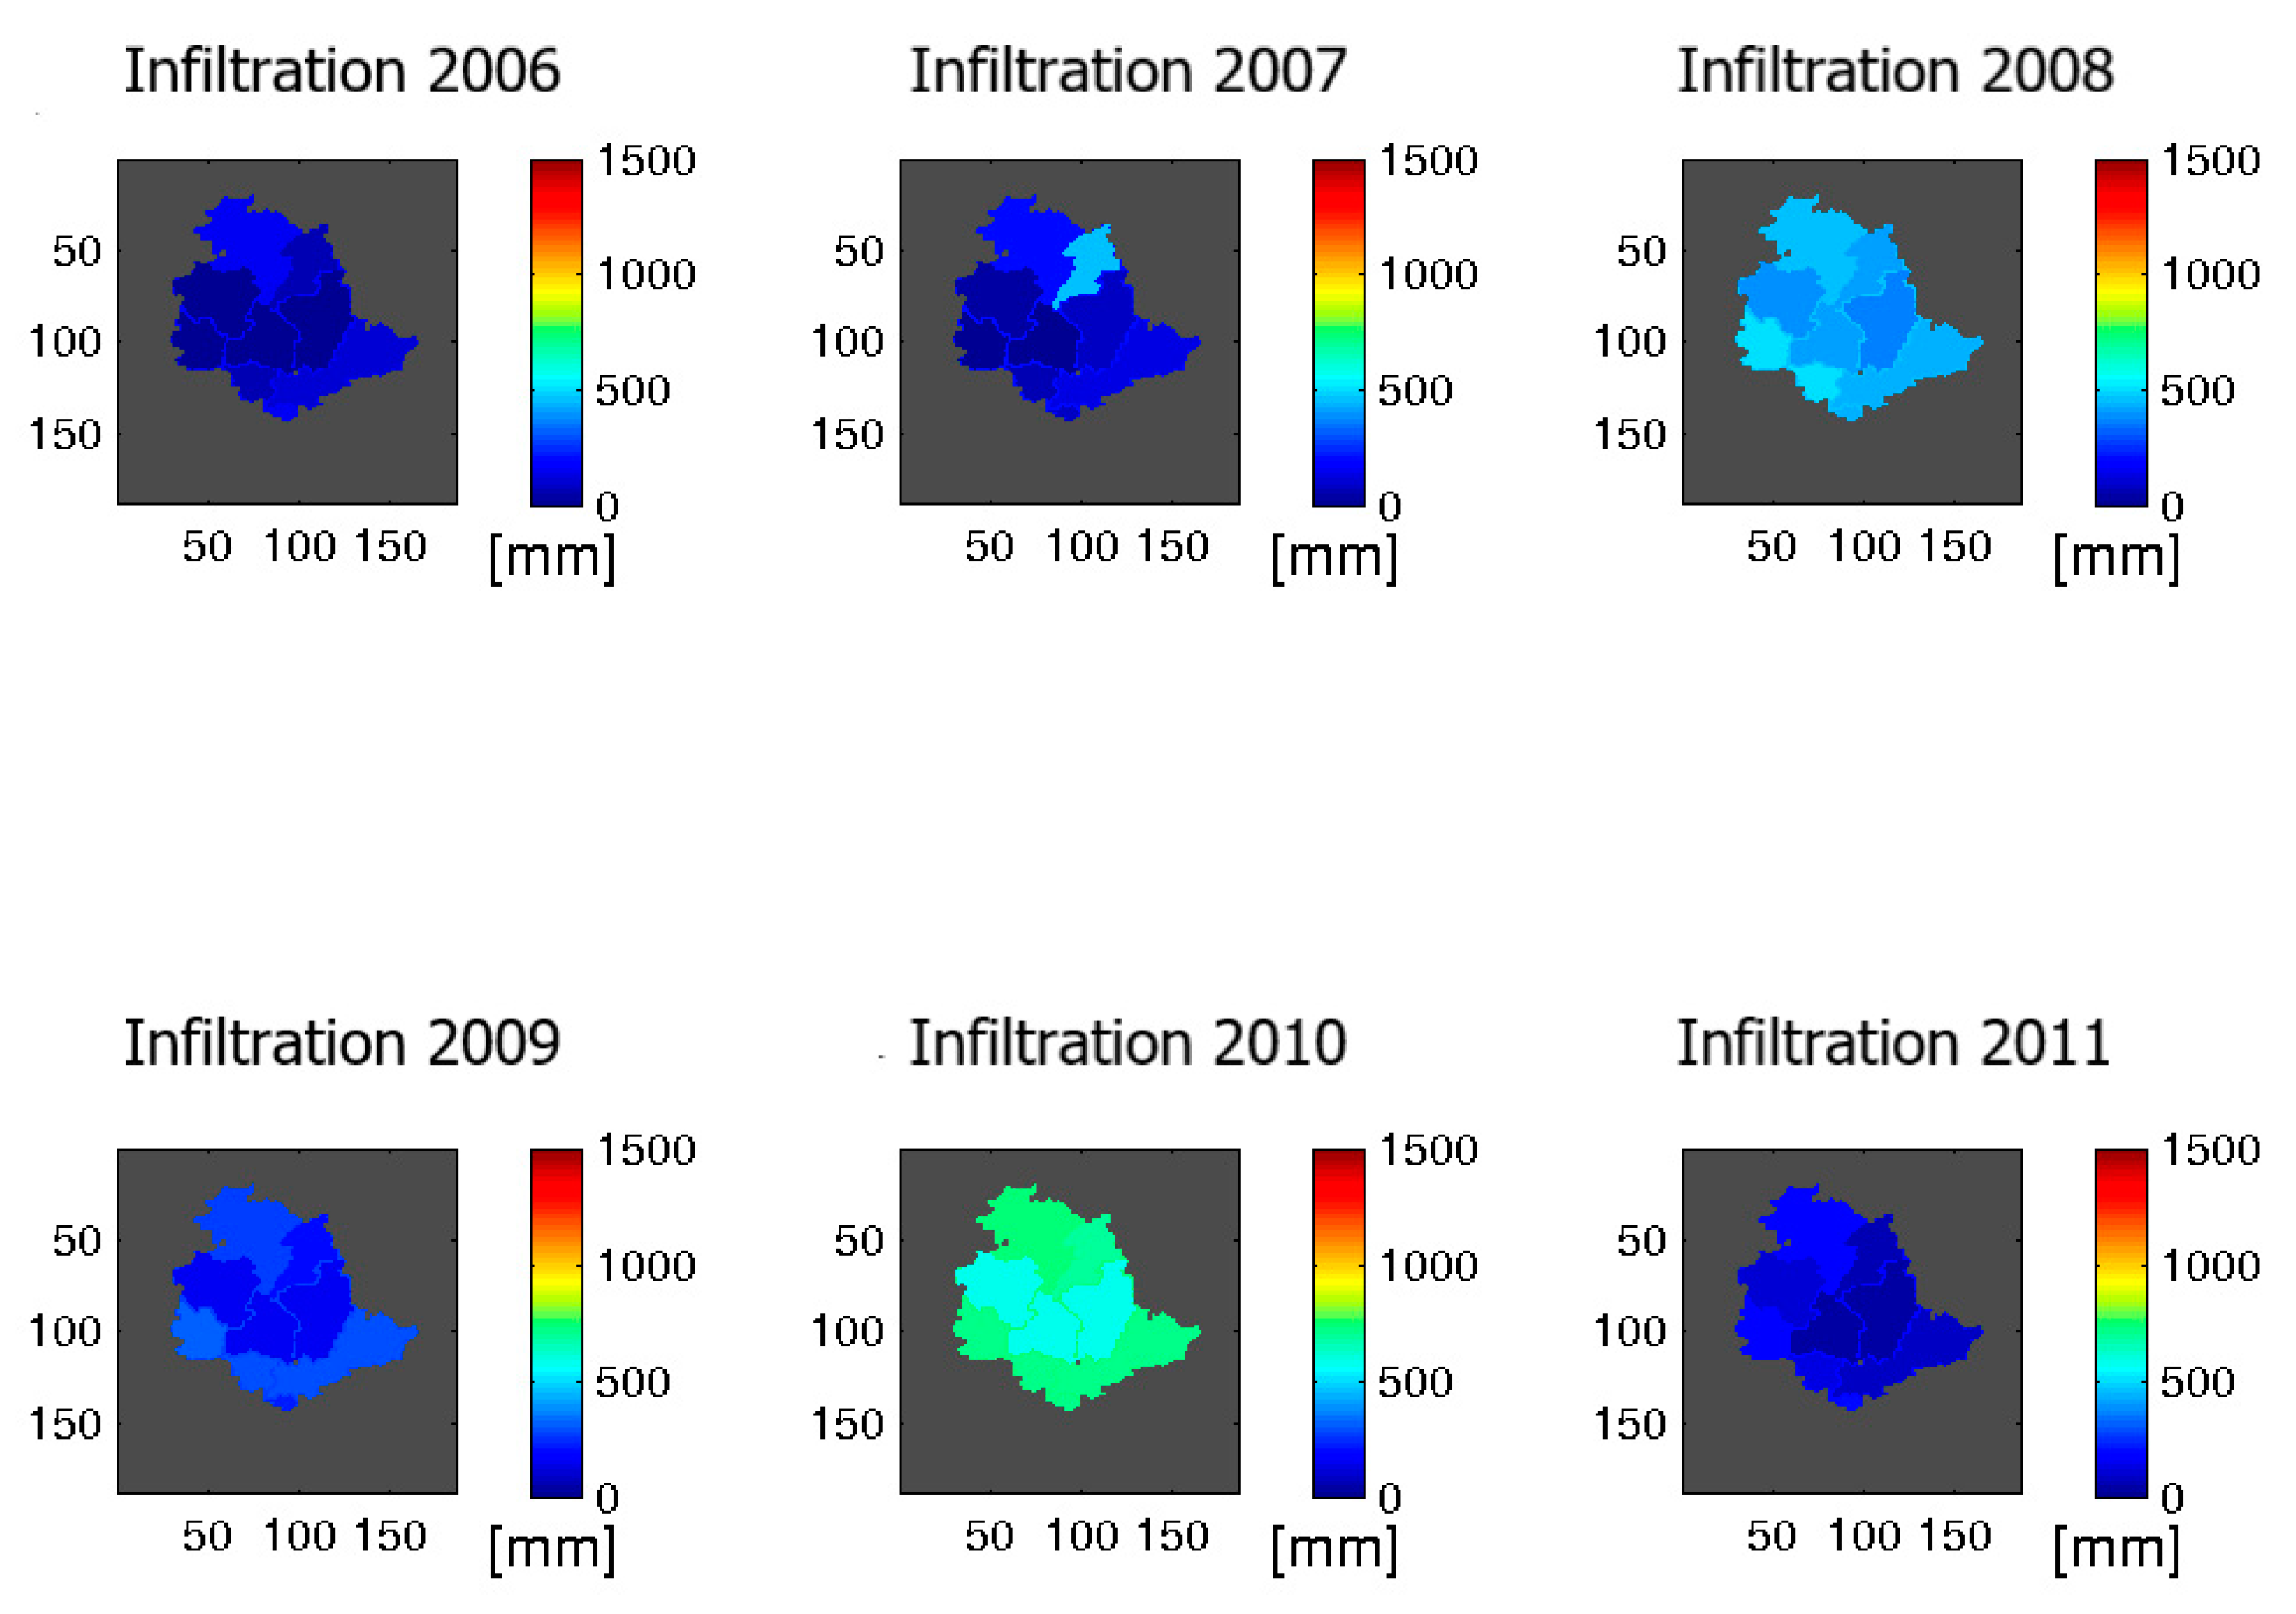
Figure 12 and
Figure 13 show the infiltration maps, aggregated at native scale and main sub-basin scale, respectively, for all of the years considered in this study. Evapotranspiration is affected by soil characteristic and atmospheric conditions. The final maps regarding infiltration are the result of all of the different natural processes described by the model, and are the inputs for the subsequent GIS processing aimed at evaluating nitrate concentration in groundwater.
4. Discussion
The purpose of this study was to estimate the potential and effective nitrogen loads from different sources and to assess the previous (and actual) contamination by nitrates in the Umbria region.
The main results are:
- (1)
The contribution of farms in nitrate contamination is in the order of swine > cattle > sheep and goats.
- (2)
The contribution of agriculture in nitrate contamination is in the order of arable land, olive, and grape.
- (3)
Fluctuations in nitrate values can be better observed at a municipal scale and the nitrate concentration trend can change rapidly and strongly depending on rainfall. This means that policies for good practices should be defined at a sub-basin scale.
A short discussion is reported here with reference to points 1–3.
In [
37], a detailed study on specialized pig fattening and arable farms in the federal state of North Rhine-Westphalia is presented. Results show that the extensive swine fattening farms, applying additional chemical fertilizer of 91.70 kg N/ha, and reaching an estimated nitrate loss of 33.40 kg/ha do not reach any nutrient application thresholds. Medium intensive swine fattening nitrate leaching is 46.57 kg/ha, while intensive swine fattening shows higher nitrate losses up to 81.73 kg/ha. By comparing these results with data presented in
Figure 7, swine farms in the Umbria region can be mainly classified as extensive or medium intensive, so their contribution to nitrate leaching could be estimated in the range 35–45 kg/ha.
In a recent study about nitrous oxide emissions from soil fertilized with swine manure in North Carolina [
38], the authors focused on the measured nitrogen concentration in response to rainfall. Treatments included 75–165 kg N/ha and showed that emissions declined to pre-fertilization values within a few days as soils drained. Our results, of
Table 10 and
Figure 9, where a rapid change in pollutant concentration at a municipal scale is observed, seem to be in agreement with this work.
In [
39], the authors investigate the effect of two nitrogen based dairy cattle slurry rates (170 and 250 kg N/ha), plus additional mineral nitrogen of 450 kg N/ha on two crops, with different soil quality parameters. The 8-year-long experimental study was carried out in the Mediterranean area (Tallada d’Emporda, Spain). The study included forage maize, ryegrass, grain maize, and rapeseed. Rapeseed responded well up to 200 kg N/ha. Even if rapeseed crop extensions in Umbria is about 500 ha, our data are only in partial agreement with this work, since higher loads were found in our work for almost all of the municipalities (
Figure 4).
In [
40], the effects of four fertilization strategies at 30, 60, 90, and 120 kg N/ha on maize crops conducted in lysimeters were analyzed. The authors showed that the nitrate leached over the proposed 4-year-long study was directly correlated to the total amount of nitrogen applied. Moreover, when precipitation was reduced, the nitrogen balance revealed that the transport pathways for 25% of N inputted to the system were unknown. They concluded that the correlation between nitrate concentrations and loads is highly variable, and recommended, at least, 3-year-long experiments to obtain reliable information on the effects of fertilization strategies on nitrate concentration. This result confirms our findings.
Field experiments in southern Sweden reported in [
41] show that the use of winter crops or undersown catch crop outside the main cropping season reduces nitrate losses by up to 75% in single years, and by nearly 50% over successive years. Results show a total nitrogen loss of 28, 62, 69 kg/ha respectively for unfertilized, fertilized, and overfertilized (with swine manure at 90–110 kg N/ha) no catch crops. Our results are in agreement with the spatial distribution of the estimated nitrogen leaching reported in this work for 331 fields, as a function of soil type, fertilization rate, crop type, and soil tillage.
In [
42], nitrogen potential loads are reported for evergreen fruit trees with special emphasis to temperate and Mediterranean climates. Apple trees need about 54 kg N/ha and peach trees need 81 kg N/ha. Since the authors assume 50% of nitrogen utilization by these fruit trees, the required nitrogen fertilization is 108 kg/ha and 162 kg/ ha, respectively. Our adopted value of 100 kg/ha is in agreement with this estimation.
Olive tree culture is one of the main crop species in Mediterranean countries, and it is the second largest crop in the Umbria region. Excess in inorganic nitrogen fertilization is a common problem and there is no real need to provide N fertilization to olive trees every year. In [
43], a six-month pot experiment with three soil amendments, used as organic fertilizers (cow manure, goat manure and their mixture), was conducted to study the fertilizer release. No significant differences were found in plant crops, but goat manure showed to be better in regards to crop nutrition values. In our study, we observed that the contribution of farms in the Umbria region is in the order of swine > cow > sheep and goat. The results obtained by [
43] could be useful for suggesting the application of sheep and goat manure to olive trees, by diverting swine manure to arable land.
In [
44], a trial was conducted from 2012 to 2015 in a 1 ha commercial table grape vineyard located in Puglia region, where nitrogen loads varied from 70 to 200 kg/ha, with a fraction applied in winter and more applications during the cultivation season. The overall nitrogen required by grape crops was estimated around 50–55 g/vine, which corresponds to 80 kg N/ha in a vineyard with 1500 vines and a yield of 40 t/ha. The value of 110 kg/ha used in our work for grape (
Table 4) is in agreement with the mean nitrogen load applied in a similar region, and is slightly greater than the optimal value found in [
44].
Two studies are finally analyzed to compare the results of our work with simulated data.
In [
45], total nitrogen leaching was modeled for different fertilization treatments in a selected area of eastern Spain with intensive agriculture. Four nitrogen fertilization rates (traditional, reduced by 20%, reduced by 50%, and up to 70%) were simulated at a regional scale. The temporal distribution of nitrate in soil, nitrogen leaching, crop evapotranspiration and rainfall were compared in order to identify the influence of the soil nitrogen and rainfall on nitrate leaching. Nitrogen loads used in [
45] were higher (up to 500 kg/ha) than those recommended by the Code of Good Agricultural practices of Valentia, Spain (200–250 kg/ha), and much higher than those reported in our paper (50–200 kg/ha). Anyway, the ratio between loads and calculated nitrate concentration found in [
45] are similar to those observed in our work, where nitrate data come from monitoring networks. This means that the recommended reduction of 50% in nitrogen fertilization proposed in [
45] could be applied also for arable lands in the Umbria region.
In [
46], a simulation model was proposed as a management tool to estimate the changes in leaching resulting from changes in cultivation practices in Finland. Data consisted of 400 farms, spatial data about soils, crops, and fertilization; GIS-software was used. The deterministic nitrogen leaching model was applied at regional scale. The authors concluded that a monitoring network of water quality was needed; however, due to the slow response of water quality to changes in fertilization practices and high fluctuations in annual nutrient losses caused by meteorological variation, monitoring networks could not detect changes occurring within short time periods. Our work contains data from a monitoring network, and these data were analyzed at different scales (
Figure 8 and
Figure 9). Our finding, i.e., that nitrate values over the threshold for both groundwater and surface water, can rapidly change their status due to meteorological variations, and are in strong agreement with the conclusion reported in [
46].
5. Conclusions
Organic fertilizers as manure or sewage are widely used in Umbria in compensation of chemical fertilizers. This application is often adopted to avoid their handling in apposite treatment plants. Anyway, chemical fertilizers are commonly preferred, since they are easily absorbed by crops and guarantee a fast growth of the plants. Good practice agricultural codes have been defined in the Umbria region [
47], but some difficulties arise in their applications, since the spatial scales of nitrate contamination does not always correspond to the authority managing action plans, focusing on the activities directly linked to the territory. Moreover, the temporal scale of the processes involving the different sources of nitrate is very long. In this work, we proposed a comprehensive methodology to assess the impact of all the possible sources of nitrogen at different scales.
With reference to years 2008–2010, the most contaminated aquifers were Valle Umbra and MV Tevere Sud; Chiascio was the most polluted sub-basin and Bettona the most contaminated municipality, where a maximum nitrate concentration in groundwater of 973 mg/L was measured in 2009. With reference to surface water, Nestore and Alto Tevere were the most contaminated sub-basins and Marsciano and Norcia (with a maximum nitrate concentration in surface water equal to 364 mg/L in 2008) the most polluted municipalities.
The highest groundwater contamination was found in municipalities located in the center-west zones of the region, where the highest zoo-technical load, due to swine farms, was applied. On the contrary, the highest agricultural load was found in the north of the region.
These results suggest that policies to modify the destination of organic fertilizers, also out of their production zones, could be defined. Moreover, since the highest fluctuations in nitrate values were observed at a municipal scale, and their concentration trend changes very rapidly with hydro-meteorological conditions, policies for good practices should be defined at the sub-basin scale.


