Article

Analyzing Performance in Wholesale Trade Romanian SMEs: Framing Circular Economy Business Scenarios

by
Codruța Cornelia Dura
1,*,
Ana Maria Mihaela Iordache
2,*,
Alexandru Ionescu
3,
Claudia Isac
1 and
Teodora Odett Breaz
4,5
1
Department of Economics, University of Petroșani, 332006 Petroșani, Romania
2
Department of Informatics, Statistics and Mathematics, Romanian—American University, 012101 Bucharest, Romania
3
Department of Trade, Economic Integration and Business Administration, Romanian—American University, 012101 Bucharest, Romania
4
Faculty of Economic Science, 1 Decembrie 1918 University, 510009 Alba Iulia, Romania
5
Faculty of Engineering, Lucian Blaga University of Sibiu, 550024 Sibiu, Romania
*
Authors to whom correspondence should be addressed.
Sustainability 2022, 14(9), 5567; https://doi.org/10.3390/su14095567
Submission received: 3 April 2022 / Revised: 29 April 2022 / Accepted: 3 May 2022 / Published: 5 May 2022
(This article belongs to the Collection Circular Economy and Sustainable Strategies)

Abstract

:
The study analyzes the performance levels achieved by Romanian wholesaler SMEs from Hunedoara County and to advance some practical courses of action designed to support local entrepreneurs in improving efficiency and in embracing circular economy (CE) practices. We employed cluster and discriminant analyses with a focus on providing an accurate classification of trade SMEs, according to their performance. Three distinct classifications of SMEs resulted in: (i) a class of enterprises displaying high levels of the rates of return, whose business owners exhibited an increased risk appetite and applied investment policies focusing on future development by means of incorporating digital instruments; (ii) a class of SMEs displaying average levels of rates of return, which manage to survive in situations of crisis through maintaining the position previously gained on the market; and (iii) a class of SMEs exhibiting a precarious financial position and employing defensive strategies, with managers who are reluctant to take risks in the innovation processes. Furthermore, we present a cloud computing solution which was tailored for one of the companies from our sample that appeared to be the most likely to carry out the transition from the average SME performance class to the higher class. The main advantages that are brought about by the IT solution in terms of environmental sustainability consist of: improvements in energy efficiency, the decrease in carbon footprints, the lowering of operational costs and the diminishing of the amount of e-waste.

1. Introduction

The SMEs sector is widely recognized as the backbone of the sustainable development of the entire economic system of the European region. Recent statistics released by the European Commission support this statement, showing that, in 2020, over 21 million SMEs were operating in the EU-27 area, accounting for 99.8% of all the enterprises active in the non-financial business sector. Moreover, 57% of the value added and 65% of the jobs were generated by small EU-27 businesses in 2020 [1]. The retail and wholesale branch represents a fast-growing and labor-intensive sector which provides 11% of the European Union’s total GDP. The field is also a significant generator of job opportunities: 33 million employees earn their living from serving the retail and wholesale domain. Likewise, the same field creates an additional few million jobs through the whole of the supply chain components from small domestic enterprises to multinationals [2]. Over 33% of European enterprises (i.e., approximately 6 million firms) operate in retail and wholesale domains, and no less than 99% of them are small businesses.
In Romania, SMEs account for 99.7% of the total proportion of active businesses and 66.1% of the total employment; 55.9% from the total added value generated by the Romanian economic system originates from the SME sector. The most prominent SMEs in Romania are active in the fields of wholesale and retail trade and manufacturing. These domains together cover nearly half of the value added generated by the entire Romanian SME sector, and exceed 50% of the total SMEs’ employment creation [3,4,5].
By implementing the sustainable supply chain management concept in the business strategies of wholesalers, we can highlight two major trends that can facilitate rapid growth rates: the mutation towards CE and digitalization. Wholesalers and retailers occupy an important place in disseminating CE practices due to their permanent contacts with suppliers and end consumers. Thus, CE-related practices pursuing the decrease in carbon footprint, the optimization of energy consumption in logistics, the employment of renewable energy alternatives, the increase in using waste management modern methods within distribution centers, etc., become increasingly common among the wholesalers. On the other hand, the unprecedented proliferation of digital tools encompassing the supply chain has forced wholesalers to reconfigure their business model in order to allow work to be undertaken across frontiers of time, space or functions, providing continuous services to their customers. Although the abovementioned trends were predetermined in the pre-pandemic era, the COVID-19 crisis has brought about the rapid acceleration of CE practices and digitization phenomena, which were expected to respond to the shortcomings which occurred in supply chain functioning [6].
Thus, the COVID-19 pandemic has brought about overwhelming constraints for SMEs from across the globe, while they were striving to cope with unpredictable burdens provoked by the health crisis. Governmental interventions addressing the COVID-19 outbreak predominantly took the shape of various restrictions such as compulsory social distancing, lockdown policies, quarantine rules, changes in work patterns and practices, temporarily shutdowns of business processes involving employees’ physical presence, etc. [7,8]. Such regulations were able to reverse the fast-growing trend exhibited in the pre-pandemic era by SMEs both from developed and emerging economies. Under the circumstances, these entities were forced to face a sudden crisis with miscellaneous effects regarding the narrowing of business opportunities, the worsening of their financial performance, the adjustability of the staff headcount to the variable scale of their business operations, supply chain interruptions, etc. [9,10].
Despite the high level of inconsistency of the business environment, the inherent stage of chaos and amateurism was overcome by the end of 2020, and the majority of managers moved towards the stage of strategic planning. In their attempt to develop new long-term reinforcing strategies, entrepreneurs became aware that beyond the numerous drawbacks of the pandemic, a few significant opportunities showed themselves as innovatory approaches that deserve to be brought to the forefront of scholars’ and practitioners’ debates in the years to come [11]. Prevalent digital technologies call into question the very roots of traditional business models that require large-scale transformations, such as: (a) the emergence of virtual products and services; (b) the foundation of innovative digital business; (c) the adjustments undergone by industrial structures; (c) the reconstruction of value-delivering patterns; (d) the redefining of the business scope in order to address the “not yet covered demands” of clients, etc. [12]. The literature bears witness to the process of business model reinvention with the incorporation of digital technologies in operations related to value creation and confinement [13].
Acknowledging both the substantial contribution of the wholesale trade sector to Europe’s economy and the opportunities brought about by the fast-paced digitalization trend and the circular economy goals, the focus of the present study encompasses a performance-based analysis of Romanian SMEs which operate in trade field, supported by a case study of a small company implementing a digital business solution in order to face the challenges of the pandemic and to shift towards circular economy practices. In our empirical research, we have focused on a sample of 51 enterprises from Hunedoara County—one of the most industrialized area prior to 1990—which is still undergoing a complex transformation from a highly specialized economic model based on mining activities, energy production and heavy industry to a flexible and modern economic structure which yields rapid growth development rates of trade, tourism and services.
Although in the literature there is a substantial body of research on Romanian companies’ transition to CE practices, they mostly emphasize the following issues: the peculiarities of CE activities; the implementation of waste management modern methods; the challenges and opportunities encountered by Romanian SMEs in embracing CE principles against the background of the EU framework; the substantiation of effective indicator systems in order to measure progress in the area; the fostering of economic growth through circularity principles; the investigation of costumers’ attitude towards green production; the innovative entrepreneurship/human resources development related to CE practices, etc. [14,15,16,17,18,19,20,21,22,23,24,25,26,27,28,29,30,31,32,33,34,35]. Nevertheless, the abovementioned studies do not essentially refer to performance analysis yielding a classification of business strategies following the pandemic shock, as a prerequisite for drawing up CE changeover strategies. The research gap we are trying to bridge responds to the need to establish a realistic diagnosis of the performance achieved by Romanian wholesale and retail trade SMEs in the aftermath of the pandemic crisis and to find effective solutions to accelerate transformational changes conveying the transition to a CE. Such approach applied to Romanian SMEs’ sector is meant to underpin the entire architecture of the sustainable national economic organism. Therefore, the main research questions (RQs) underlying the present study are as follows:
(RQ1): How do we classify SMEs in the trade sector of Hunedoara County while considering the performance levels for the activities carried out during the pandemic, reflected by their main financial indicators?
(RQ2): Can we draw up effective business scenarios in order to facilitate the transition of certain SMEs from a low/moderate performance class to a higher class?
The rest of the paper is organized as follows. Section 2 is dedicated to a systematic literature review on the CE concept in closed connection with digitalization trends, viewed as innovative ways of reshaping the entrepreneurial mindset of Romanian business owners from the SME trade sector. The significant contribution of wholesalers to the sustainability of the supply chain management by promoting CE practices is emphasized within this paragraph as well. Each step of our methodology is detailed in the content of Section 3. With the aim of providing an accurate classification of regional trade SMEs from Hunedoara County in relation to the level of their financial performance, we employed cluster and discriminant analysis statistic techniques, which were effectively put into practice using SAS Enterprise Guide software. Section 4 offers insights into our empirical results, providing descriptive statistics for the main parameters which were taken into account to describe the financial situation of SMEs selected in our sample and also illustrating a taxonomy of trade enterprises that allowed us to take a broader view regarding some future scenarios which we consider the most appropriate in order to significantly improve SMEs’ performance on the long run. Section 5 discusses managerial approaches used by different types of business owners to cope with the crisis and highlights a few significant levers which could be carried out in order to revolutionize the foundations of contemporary business practices in the Romanian trade SMEs’ sector. Section 6 presents a case study of a business scenario based on cloud computing, which can be adopted by a small company included in our research sample in order to improve its economic, environmental and social performance. Finally, Section 7 concludes our study by providing substantiated responses to our research questions, supported by our main findings. A few limitations that inevitably accompany our study together with some interesting future directions for further developments of our research are also presented in this final paragraph.

2. Literature Review

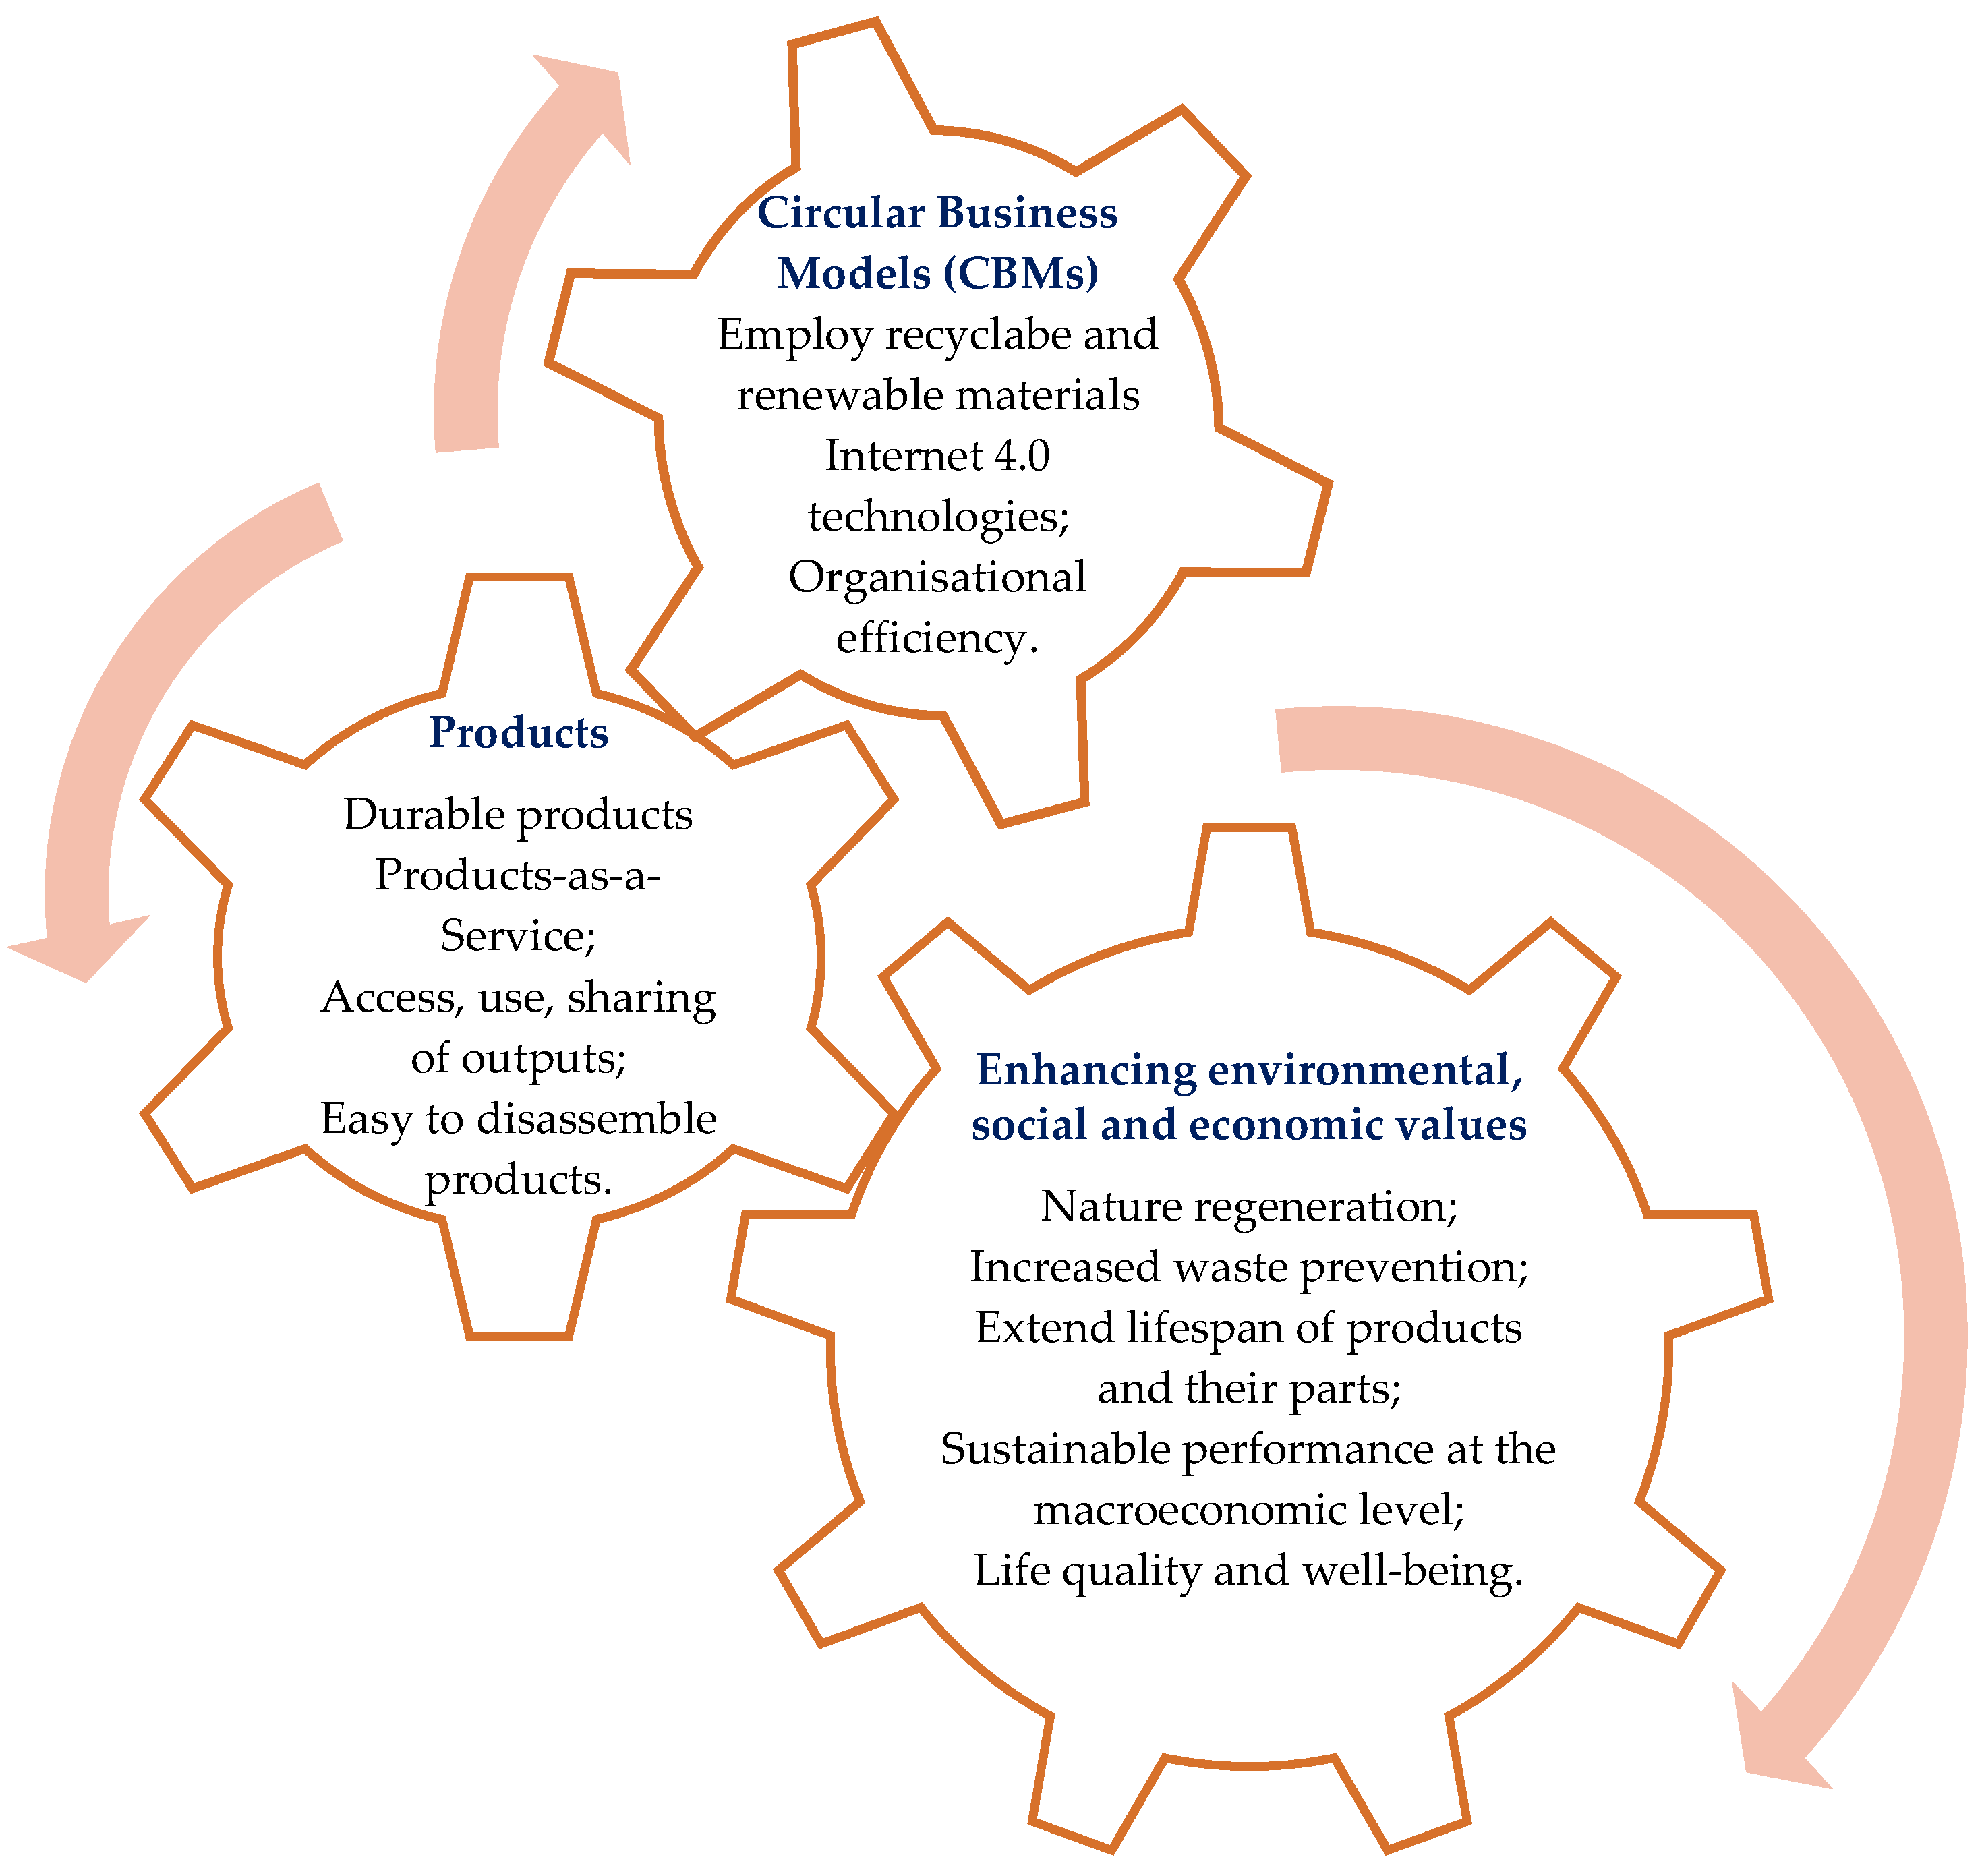
2.1. The Circular Economy and the Sustainable Supply Chain

The concept of a circular economy (CE) designates a comprehensive approach towards sustainable development, conceived with the aim of putting together and strengthening the community, businesses and the environment. Despite becoming a stereotypical term in the literature, from the late 1970s to the present day, various researchers have paid attention to different facets of CE while striving to reach a consensus on the most appropriate way of defining it. Debates on the issue are still running their course [36,37,38]; therefore, we focus on detailing some operational principles of CE which go hand-in-hand with sustainable business performance and with the process of unfolding the digital transformation in modern companies.
Thus, the CE is perceived as an unconventional alternative to the so-called “linear economy” based on extracting raw materials from the nature, producing something out of it and then disposing the entire output (i.e., the “take–make–waste” formula) [38,39,40]. The new system calls into requisition the principles of reusing, regenerating, recycling, reducing, etc., materials or products, which slowly tend to replace the traditional “end-of-life” approach while generating new value-creating alternatives for businesses of all sizes and spheres. Through its own functioning mechanism, the CE system enables permanent material flow, thus becoming a closed loop [41]. The linear economic system is transposed in a circular model by emphasizing the nexus established between resource usage and waste removal through innovative business solutions that involve material recycling, the use of renewable sources of energy, the employment of Internet 4.0 technologies, the switch from traditional products to new products-as-a-service, etc. From the standpoint of the CE, the process of value creation is placed within the framework of a larger and holistic perspective as compared with the traditional approach and it is focused on the need to ameliorate the environmental, social and economic performance both at micro- and macro-levels (Figure 1) [42,43].
Supply chain management represents a concept that reunites manufacturers, governmental institutions, suppliers, distributors, retailers, warehouses and other economic entities in such a manner that products can be offered and distributed in the appropriate amount, at the right place and at the right moment under the circumstances of reducing optimizing costs and satisfying consumers’ demands [44,45]. More recently coined, green supply management involves the “green” concept into the architecture of supply chain management from product manufacturing to raw material procurement, to warehousing, inventory management and distribution in the view of end-of-life management of the products and services [46].
The early stages of developing the CE concept revealed a significant body of research focused on issues such as: constructing the architecture of the new business models; describing circular business innovation models; identifying catalysts and barriers of adopting CE practices; comprehending the stakeholders’ perspective on CE development, exploring the reconfiguration of supply management strategies in order to comply with CE requirements, etc. [42,47,48,49].
The scientific literature on CE issues has evolved over the past few years with the help of empirical research initially undertaken in some specific fields that were closer to engineering sciences than to the business administration domain, such as industrial ecology, production economics, waste management, renewable energy efficiency, operation research, smart city development, etc. [22,23,27,28,33,34,48,50].
An interesting conceptual framework was constructed in the literature by Bressanelli et al. [51] based on their empirical investigations on the issue of assimilating the Internet of Things (IoT) and Big Data and Analytics to underpin the application of CE principles within companies’ supply chains. The researchers were able to establish three factors that are likely to bear testimony to the process of CE value creation: increased efficiency regarding resource usage, considerable lifespan extension for products and services, and closing the loop alternatives (repairing, recycling, remanufacturing options, etc.).
Thus, we must stress that SME wholesalers can bring a significant contribution to CE implementation due to their specific position along the distribution supply chain [52]. In their day-to-day work, wholesalers target CE-related goals such as: supporting the low-carbon economy; intensifying green purchasing activities; increasing the level of their efficiency in logistic activities; developing new packaging solutions with the lowest environmental impact; implementing efficient waste management practices; improving the energy efficiency of their buildings, etc. These processes imply intense collaboration between the wholesalers and their suppliers and customers (regardless of whether they are B2B customers or en-customers). To be more specific, these components of the supply chain must carry out common planning, organizing and controlling endeavors with the aim of the effective coordination of information, capital and knowledge while implementing CE principles [46]. At the center of this functioning mechanism, wholesalers play a crucial role in accelerating the process of embracing CE practices.
Although the manifestation of unprecedented technological transformations that prefigured the global spread of the roots of the digital economy has received a great deal of attention in the literature since the 1990s [53,54,55], the post-pandemic recovery will be focused on digitalization and CE practices, as major prerequisites of reshaping the traditional paradigm in economics [56].

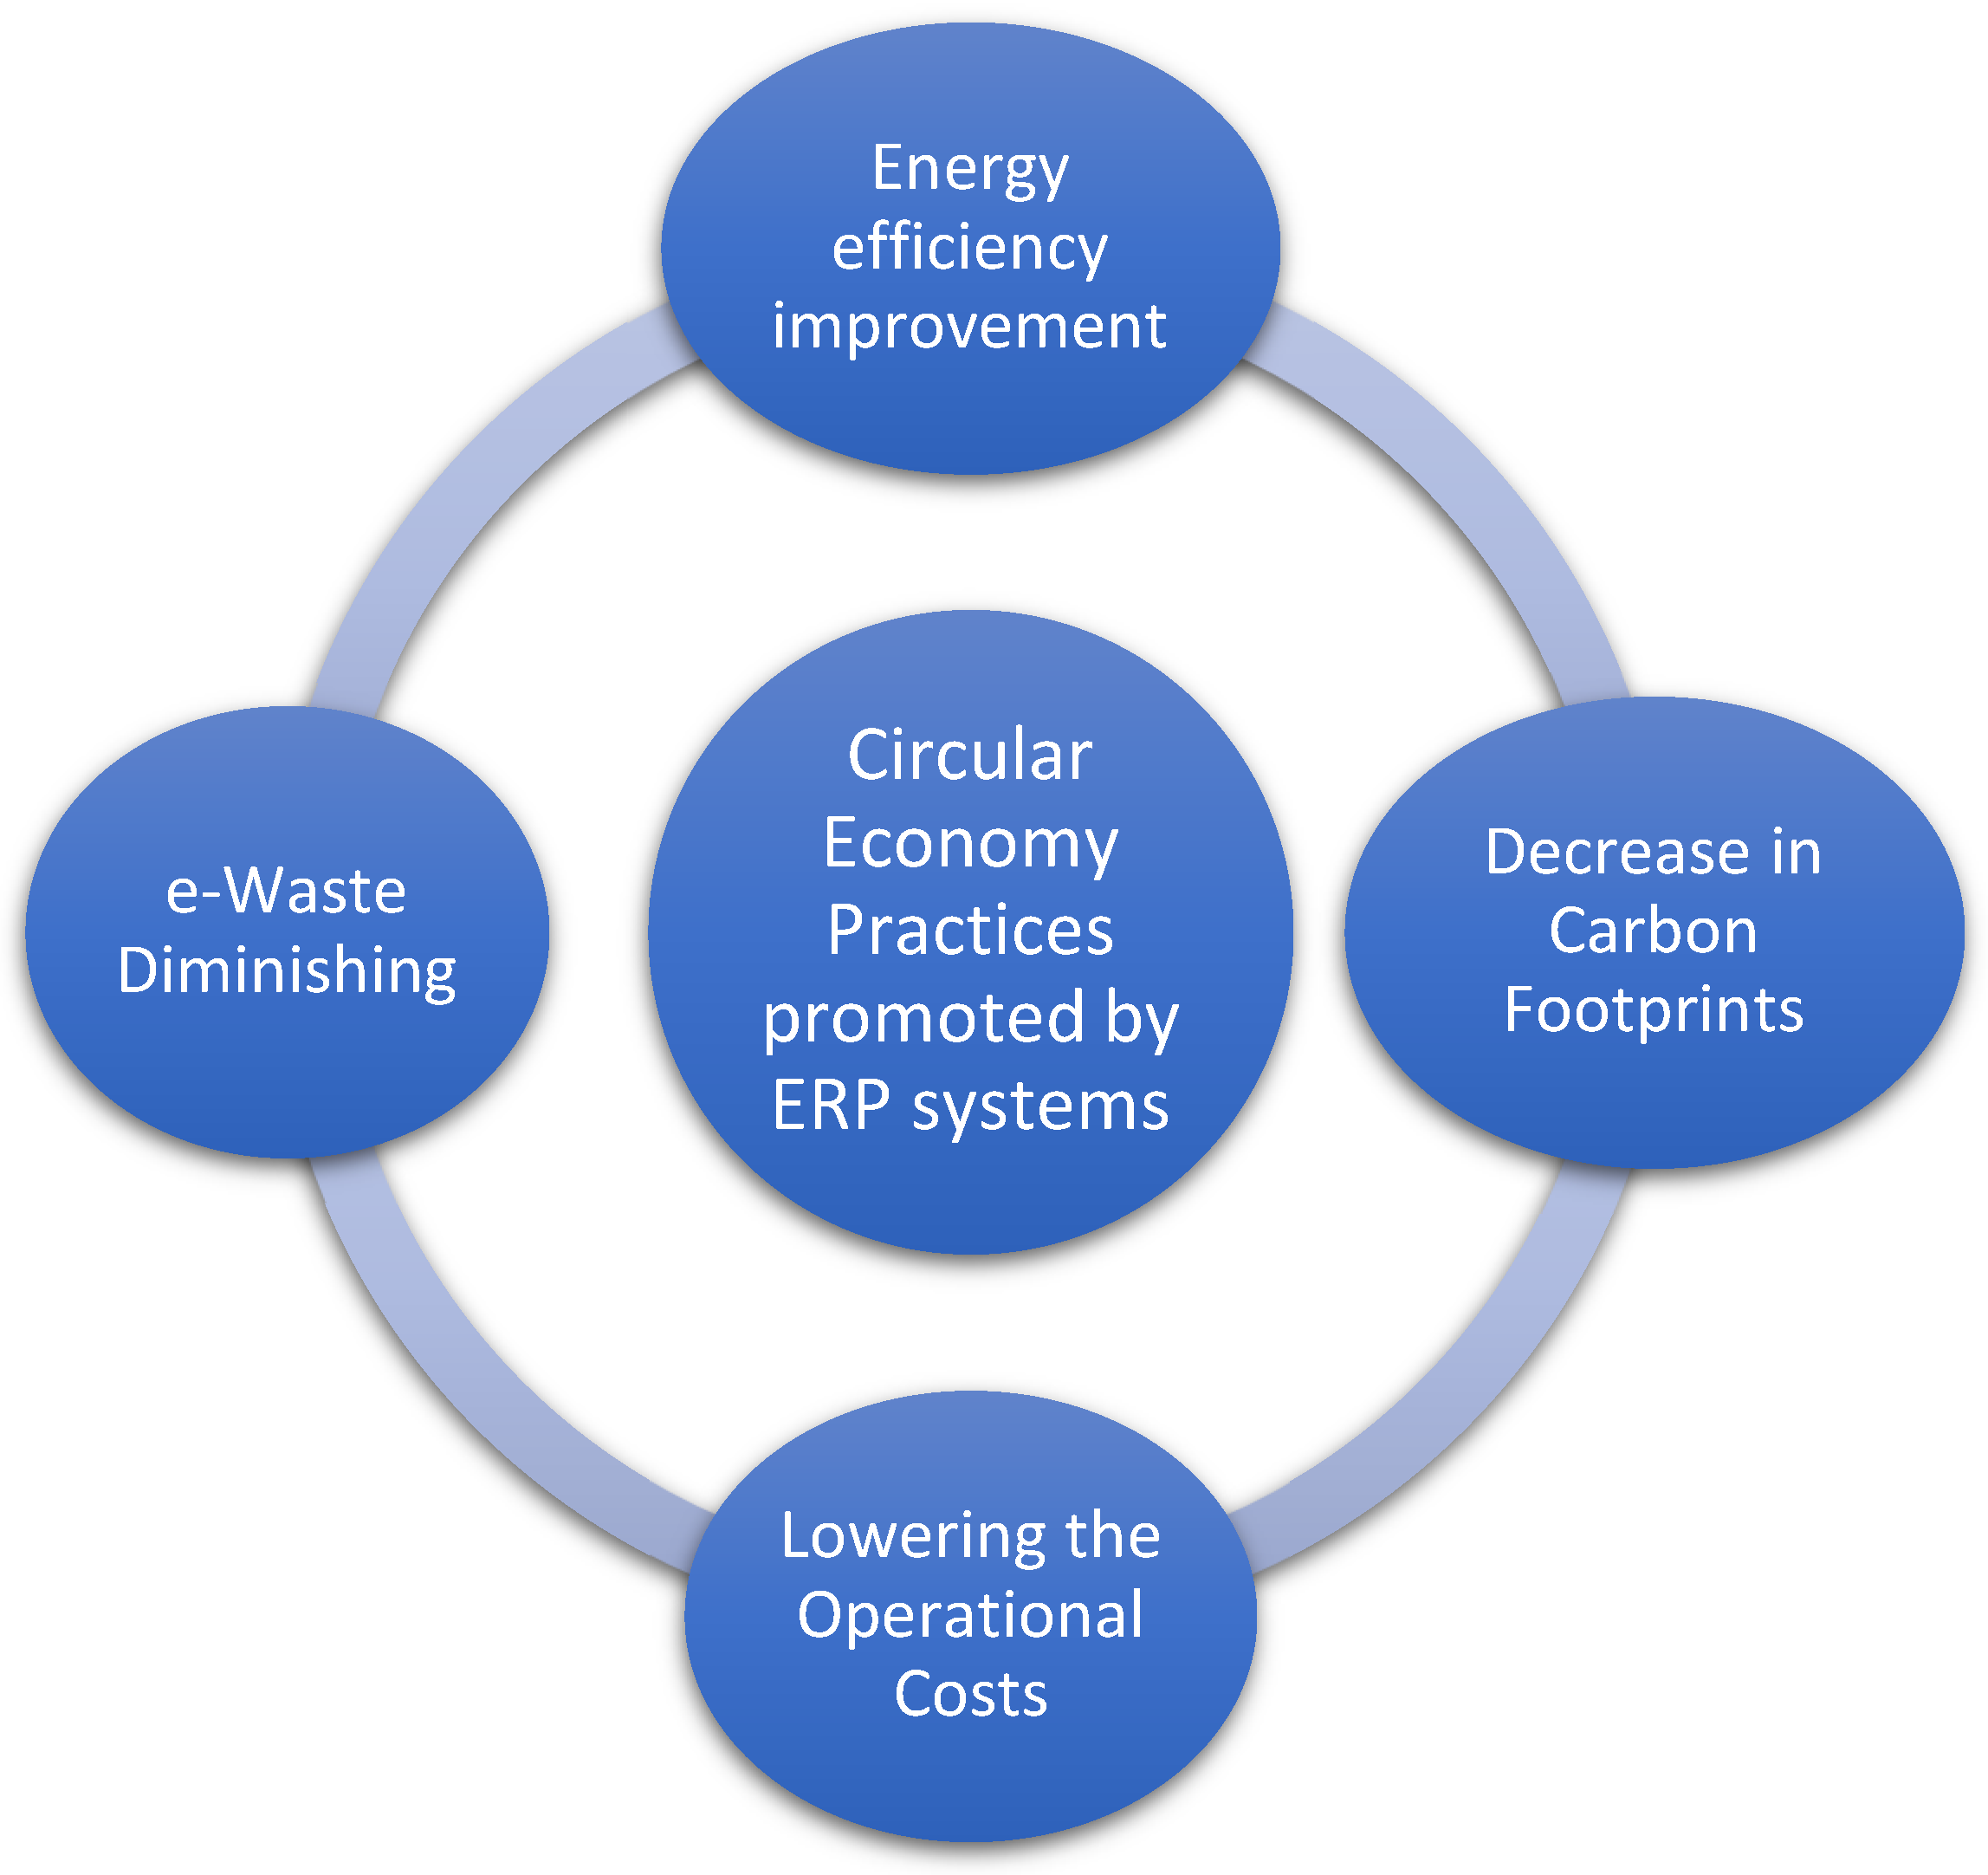
2.2. Digitalization Trends and the Circular Economy

Numerous studies in the literature have indicated digitalization to be a catalyst of CE implementation for manifold rationales [39,51,57,58,59,60,61]. Firstly, as shown in Figure 1, inside the boundaries of a CE business model, durable products could be accessed, rented or shared extensively in any place possible. In other words, the mutation towards product service systems (PSSs) is frequently mentioned in the literature as being one of the main alternatives that could pave the way towards the integrated implementation of CE and digitalization, the last one being viewed as a major impetus in the process [59,60]. PSSs can transmute attention from the classical manner of selling products to the selling of a set of values or advantages adjusted to costumers’ needs with the help of a mix of products and services that exert a lower impact upon the environment, as compared with the traditional approach.
Secondly, the employment of Internet 4.0 tools, such as Smart Services, e-Commerce, digitized green mutation strengthened by 5G technology, cloud computing, Big Data analysis, Internet of Things (IoT), virtual reality, etc., will transmute the very pillars of the traditional business model [62,63,64], revealing tremendous quantifiable benefits. Thus, the CE often conveys a higher-level capital and technology intensity associated with a diminished degree of workforce involvement in routine activities, resulting in a greater level of involvement in the circularity-based decision-making processes. Furthermore, the digital transformation is viewed as a pivotal enabler for CE business model adoption, because it shows a huge potential to enhance visibility and bring smartness into assets and products [65,66,67,68,69].
CE-orientated business practices are expected to strengthen the level of performance and to open new doors in exploiting market niches that manifest themselves more and more frequently. In the context of new business models focused on circularity principles, cloud computing denotes an IT service model that gives access to a common pool of customizable computing assets, such as databases, networks, servers, storage capabilities, applications, etc., which can be instantaneously provided to costumers on their request through the Internet, irrespective of their location or accessing devices [61,67,70]. The innovation behind the concept of cloud computing resides in the opportunity of delivering IT services as utilities, by the same token as other public utilities are provided (water, gas and energy, for instance) [45,71].
For instance, the employment of enterprise resource planning (ERP) systems can help companies strengthen integration both with suppliers and with consumers. Under the circumstances, the entrepreneur can achieve significant cost savings related to the acquisition of IT infrastructure, pre-and/or post-support operations, security issues, maintenance services, etc. Cloud technologies frequently show high levels of comprehensibility and their development represents a fairly easy process; therefore, they are extremely widespread among SMEs.
Figure 2 highlights the main impacts of cloud computing solutions on fostering circularity practices: the energy efficiency improvement, the decrease in carbon footprints, the facilitation of e-waste management practices and the lowering of operational costs [72].
From the energy efficiency standpoint, by substituting high-powered computers with low-power devices, one can optimize the level of energy consumption. To this end, the main solutions that can be put into practice can vary from simple methods, such as providing effective energy management for the servers that are used in the cloud (by activating/deactivating or putting them in the sleeping of hibernating mode), to more complex approaches, such as the employment of virtualization techniques in order to improve resource administration. Furthermore, the literature puts forward various approaches that can be taken into account on the long run, from the use of alternative energy sources in daily operations to the redesigning of the architecture of company’s buildings in such a manner that maximum energy efficiency with minimum environmental effects can be reached.
Another direction of promoting CE practices through cloud ERP is represented by decreases in carbon footprints [73,74,75]. There is a significant body of literature which addresses the issue of CO2 emissions as a proxy for measuring cloud computing contribution to sustainability. Frequently, the carbon footprint issue is approached form the point of view of its direct or indirect relationship with the optimization of energy consumption. The advantages brought about through cloud computing employment by enterprises from the SME sector, with respect to energy efficiency and decreasing carbon emissions, were also put forward by Williams et al. [76]. The authors established a mathematical model in order to assess the impact of the wide-range adoption of cloud computing solutions in 11 countries across the globe, with the highest degree of cloud penetration (over 80%). It turned out that approximately 4.5 million tons of CO2 emissions could be mitigated in the analyzed countries through a massive adoption of cloud computing solutions. Moreover, 60% of the total savings could be attributed to small businesses’ influence. In addition to the significant macro-level impact, the move towards green computing yields, in the long run and at the micro level, various indirect benefits, such as: augmented levels of operational efficiency, workforce reductions, accurate customized services, appropriate brand development, high purchase conversion rates, etc., which can give rise to significant improvements in performance indicators [77].
The substantial lowering of operational costs represents another important positive outcome of embracing cloud computing services by small businesses. The main drivers that entail important cost decreases refer to reduced investments in infrastructure and diminished energy-related expenses. However, reduced infrastructure positively impacts the environment as it produces less electronic waste (e-waste) yielded by small enterprises as frequent costumers of cloud computing services. In order to achieve the minimum level of operational costs, many authors proposed a few innovative technical solutions targeting the programming of servers’ workloads in relation with their running costs [78,79].
The term “e-waste” refers to electronic products that have reached the end of their life cycle; thus, they have become out-of-fashion, dispensable or unproductive. However, they can serve as raw materials for other industries, especially because various electronic components have a high susceptibility of turning into waste, as a consequence of the speed of technological progress [80]. E-waste diminishing by fostering both IT equipment recycling and the reuse of components stands as an essential prerequisite for a small business that embraces circularity principles.
Furthermore, by implementing advanced IT tools, wholesalers will find it more easy to collect, monitor and analyze products’ and services’ performance data. Thus, information regarding the availability of share-used products, which are distributed via digital platforms, can considerably improve waste management and support recycling or remanufacturing operations [57,59].
On the other hand, ERP will allow wholesalers to rapidly act in response to their costumers’ exigencies with respect to the sustainability of the supply chain. Thus, the distributor will utilize various tactics in order to meet consumers’ demands, such as designing new ways of adding value to their products or conceiving new ways of satisfying consumers’ requirements [81]. Moreover, IT tools have led to the emergence of a new generation of better-informed and wiser costumers who are willing to provide valuable feedback on their buying experiences by interacting with distributors and performing comparisons and balances on modern products and services [61,67,70]. Subsequently, push-driven marketing practices, which were focused on the spreading of various messages to consumers, became rather outdated, and marketers evolved to preponderant cooperative business structures which incorporate distributors as the very core ingredient of the new business model [45].
ERP solutions, as well as supply chain management, act together as efficient instruments which are able to determine significant improvements in company performance levels [82,83]. Tarigan et al. argue that, in this context, market performance and financial performance are the main dimensions that could be used in order to provide insights to the overall performance levels reached by a component of the supply chain [81]. Market performance assesses the company’s capacity to gain and consolidate a relatively steady market share through sales revenues, market share growth or the return on sales (ROS). The main proxies which were used in the literature in order to assess company’s financial performance make reference to revenues, the average profit, the profit growth or the profitability ratios—return on assets, return on equity, return on expenditures, etc. [81,84,85]. In the same vein, recent studies on the nexus between CE practices and financial performance emphasize manifold ways of improving profitability indicators both by minimizing cost levels (through increasing the level of efficiency in the use of resources) and by boosting revenues, due to gaining access to new market segments [86,87,88,89].
According to the country report Digital Economy and Society Index (DESI) 2021-Romania released by the European Commission, Romania ranks last among 27 EU member states in terms of digital adoption [90]. The Western region, which also includes Hunedoara County, follows the same pattern occurring at national level in terms of the degree of assimilation of digital business technologies and processes. Therefore, in accordance with the Territorial Just Transition Plan elaborated for Romania, digitalization—understood as a key enabler towards the sustainable development of CE—follows an alarmingly slow assimilation rhythm and is not capable of behaving, under such circumstances, as a real support for the regional and local economy [91].
Analysis of the digitalizing needs of the companies in the Western region, carried out by the Western Region Development Agency at the end of 2021, showed an index of companies’ digitalization levels of only 56.32 in the county of Hunedoara, as compared with the average regional calculated value—57.86. Taking into consideration that the values of the index range between 0 and 100, we have analyzed the situation of digitalization per sectors of activity at regional level; thus, the most digitalized fields were as follows: the financial field (69.73), followed by education (69.33) and information–communication (67.61). At the other end, the lowest digitalization rates were calculated for agriculture (37.74), real estate (43.69) and construction (44.68). Exhibiting an index of 59.83, wholesale and retail trade holds a median position in this ranking despite the amazing opportunities the health crisis made available for the entrepreneurs in this field in order to hugely migrate towards the online environment [92]. In addition, 27% of SMEs included in this study carried out at the level of the Western region obtained less than 10% of their turnover from online activities, whereas almost 30% did not receive any income from e-commerce.
SMEs seem to encounter greater challenges than large companies in terms of enhancing the sustainability of their operations through innovative business strategies. However, despite the cancellation of their business orders or contracts due to the pandemic, studies have shown that certain SMEs that incorporated digital tools were able to implement innovative strategies that enabled them to soar to growth rate levels twice as high as other small businesses that did not embrace new technologies [93].

3. Material and Methods

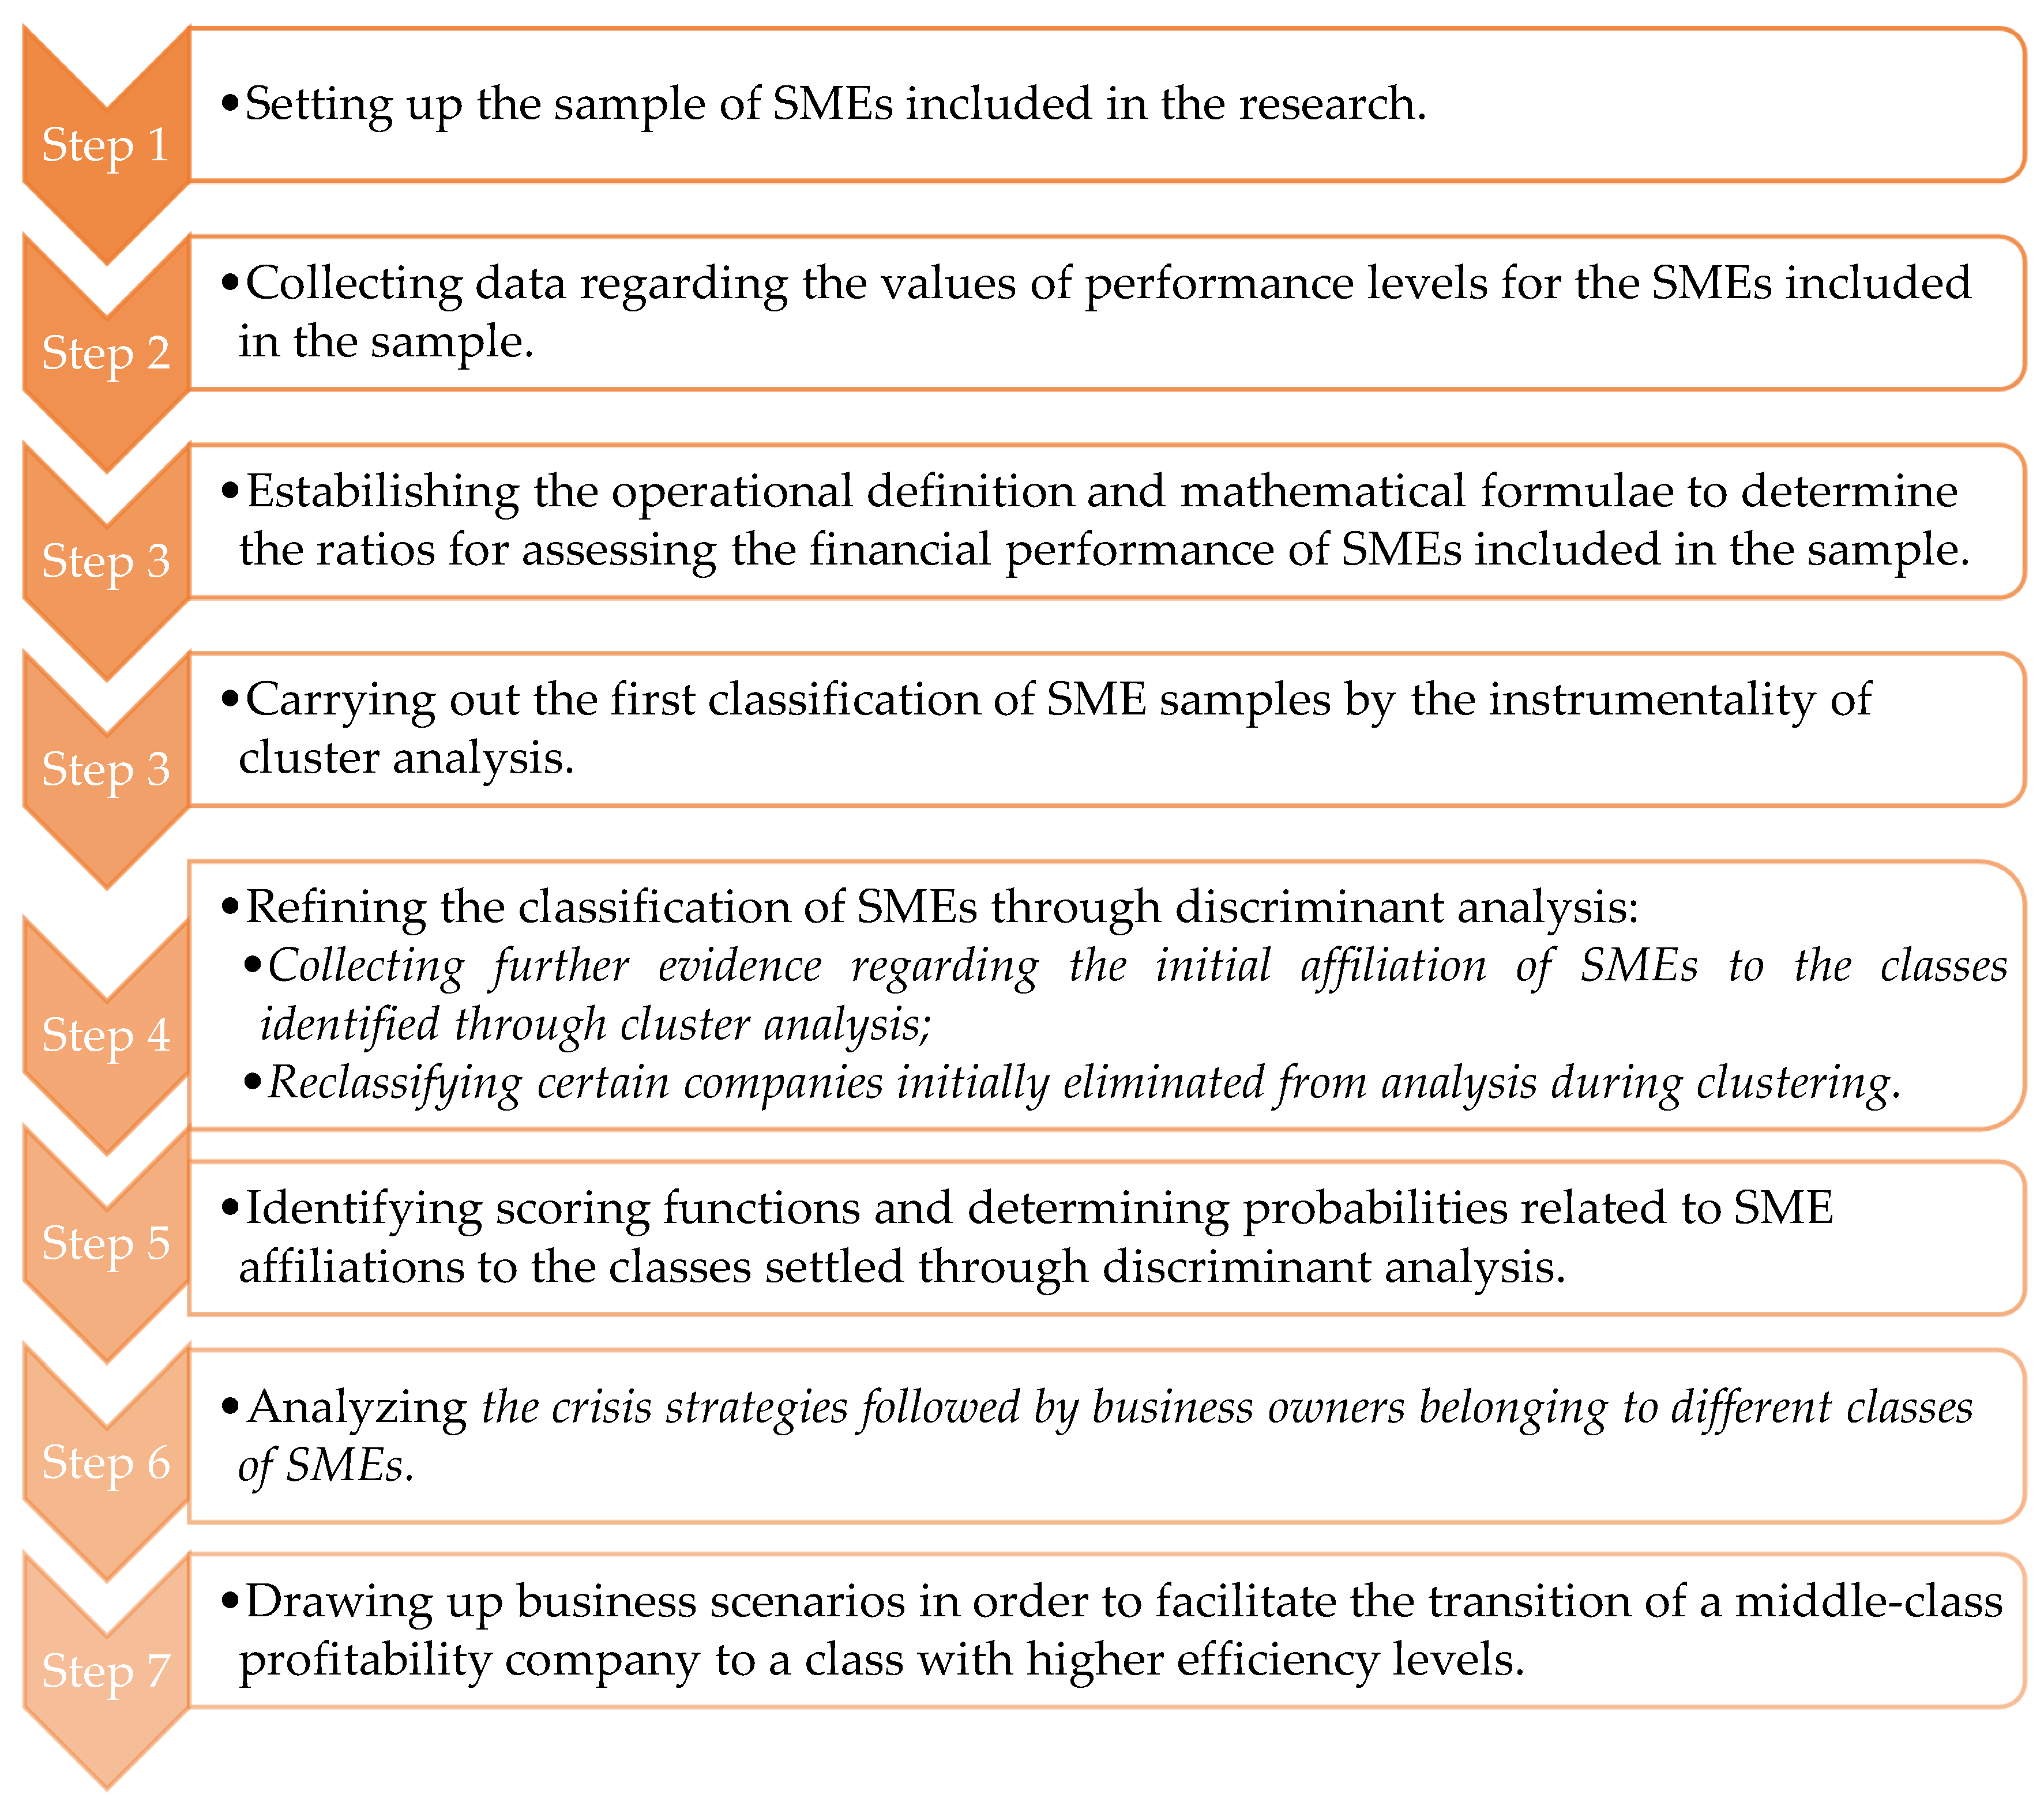
3.1. The Design of the Research

Considering the slow digitalization growth rates of SMEs in the county of Hunedoara, identified by statistical data and trends detailed in the previous paragraph, we focused our attention on those companies whose object of activity was wholesale trade of timber, building supplies and medical equipment. Through analyses of financial performance disclosed by the SMEs in this field, we aimed to conceive scenarios that might facilitate the transition of certain companies from a low efficiency class to another class, exhibiting higher values of performance indicators. The main stages of the methodology we conceived with a view of attaining the study objectives are systematized in Figure 3.
The set of indicators we considered in our analysis for the assessment of performance levels for the SMEs’ included in the sample is shown in Table 1.
We strongly believe that the outcome of this study is related to the possibility of designing a series of instruments closely connected to the increase in the uptake of digital solutions in businesses, set forth in order to improve the performance of companies in this field, under the circumstances of permanent challenges which have occurred, on multiple levels, in light of the pandemic crisis and of the need to increase the speed of adapting to the changes towards embracing the new business models. Our approach for classifying these companies in terms of their performance could also be very useful both from the point of view of improving business development strategies for local companies and from the point of view of investments that might be attracted from sources outside Hunedoara County.

3.2. The Sampling Procedure

To calculate the size of the sample of companies to be analyzed, we considered a 95% confidence level (with a corresponding z score of 1.96) and a precision level of ±5% [94]. In this field of activity, a total of 74 SMEs operate in the county; thus, the sample size was determined using the following formula [95]:
n = z 2 · p · 1 p e 2 1 + [ z 2 · p · 1 p e 2 · N ] = 1.96 2 · 0.5 1 0.5 0.05 2 1 + [ 1.96 2 · 0.5 1 0.5 0.05 2 · 74 ] = 62
where N is the population size, z is the value of the z score, e is the margin of errors, and p is the standard of deviation.
After collecting the data from the balance sheets of SMEs carrying out their activity in the county of Hunedoara in the field of wholesale trade of timber, building supplies and medical equipment, we identified 62 companies for which the data regarding their financial performance assessed based on the indicators in Table 1 were fully available. In order to select them from the general population, we employed the technique of generating random numbers in Microsoft Excel 2016 (Microsoft, Redmond, WA, USA), by means of the RANDBETWEEN function.
After eliminating the outliers (companies that displayed atypical values for most of the relevant indicators) from the initial database, we regrouped the input data for the companies included in the refined sample in the table displayed in Appendix A (Table A1), comprising 51 companies that represented the objects of analyses which are detailed in the subsequent paragraphs.

4. Results

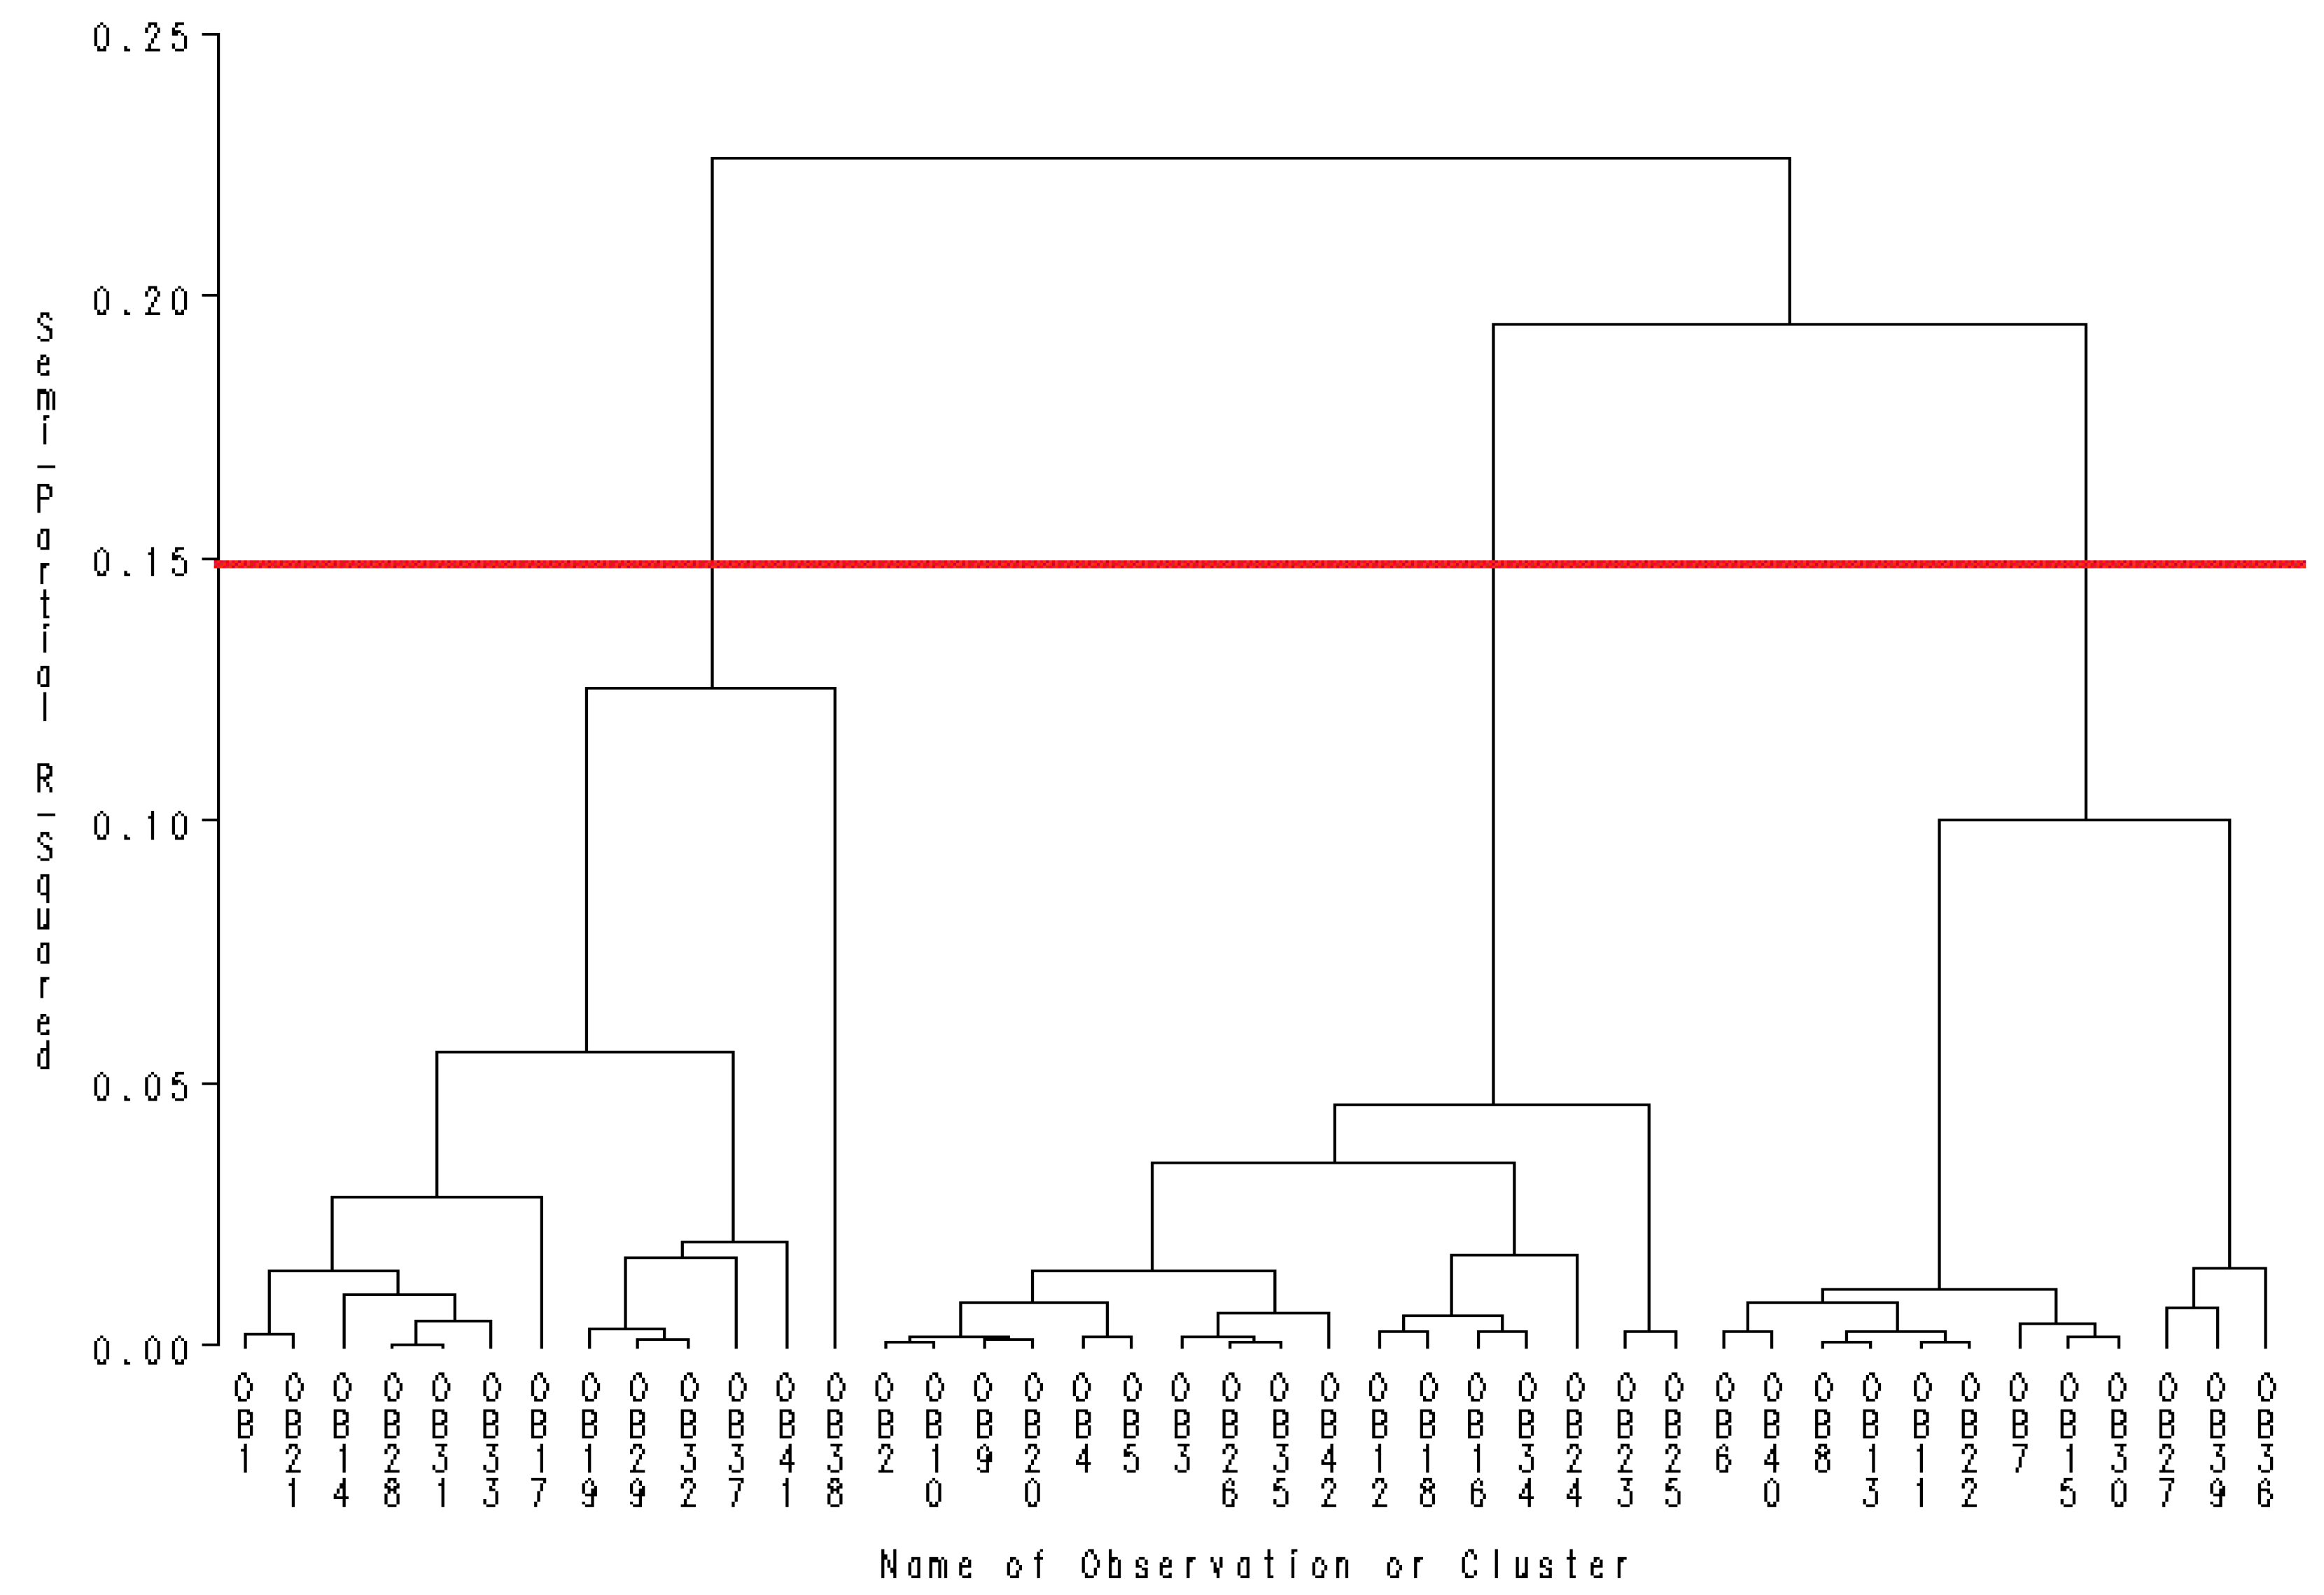
4.1. Cluster Analysis

Cluster analysis represents a well-established statistical technique frequently implemented in economic domains with a view to identifying the manner according to which various objects (individuals, companies, states, etc.) may be associated in several distinct groups that display similar characteristics [9,96]. This approach was used during the exploratory stage of our study, when we did not have clear identification clues (based on performance criteria) of the groups of SMEs that were active in the field of wholesale trade of timber, building supplies and medical equipment, in the region under analysis. In complex statistical studies, such as the work presented here, cluster analysis is not the only approach employed; this is only a statistical method more frequently used in the first stages of research with a view to providing an overall picture of the analyzed phenomenon.
In accordance, for reasons regarding the homogeneity of the classes of objects obtained by means of SAS Enterprise Guide software (version 8.3, 2020, Cary, NC, USA), we carried out cluster analysis on a sample of 42 enterprises. The companies that cover the difference from the total number of 51 SMEs constituting the data base in Appendix A (Table A1) (i.e., 9 additional companies), were associated with the class to which they display most similarities, after having applied discriminant analysis. This statistical technique was used to refine the outcomes of grouping the companies, resulting from the analysis presented in this paragraph. Therefore, from the total of 51 companies listed in Appendix A (Table A1), the 9 companies for which cluster analysis was not applied during this stage of the research are as follows: Senlong Limited SRL, Granstone Land SRL, Stone International Logistic SRL, Ali Distritech SRL, Geonat&Geotom SRL, Mimar Cons SRL, Efect Confort Mob SRL, Alin&Alicia Gardbet SRL, and Bujoreanu Forest SRL.
We used SAS Enterprise Guide software, which resorts to hierarchical classification algorithms to generate an initial group of SMEs belonging to the analyzed sector of activity. The cluster algorithm first generates relevant data regarding the distribution of the data series and abnormality detection. In accordance, several descriptive statistics indicators have been calculated: the mean, the standard deviation, skewness, kurtosis and bimodality (Table 2).
Skewness measures the distribution of values around means and, depending on the values of this indicator, the distribution chart may recline to the right (positive values) or to the left (negative values). In our case, the charts displaying the distribution of the values of indicators V1, V2, V3, V5, V6, V7 and V9 are positively reclined and exhibit a longer tail in the positive part of the x axis of the chart. In contrast, indicators V4 and V8 display their distribution mainly on the left side the x axis.
From analyzing the kurtosis column in Table 3, we obtained data about how flattened the chart of each data series was compared with the normal distribution. Knowing that the value of kurtosis indicator for a normal distribution is 3, we noticed that V2 (2.87) and V3 (2.16) were mesokurtic, i.e., they displayed distributions closer to the normal distribution. Indicators V1 (12.21) and V7 (6.58) displayed values of kurtosis indicators much higher than 3; thus, they exhibited a pointy, leptokurtic distribution. Indicators V4 (−0.96), V5 (0.48), V6 (1.98), V8 (1.22) and V9 (−0.96) displayed values much lower than the kurtosis value of a normal distribution; therefore, their distribution chart was flattened.
Table 3 presents the covariant matrix and gives clues regarding the value of the data brought by the indicators in Table 1, so that the possibility to dispense of certain indicators might also be analyzed. Although we noticed that most of the information was brought by the first eight indicators considered, we agreed that it was an advantage to preserve all nine indicators underlying the quantification of the financial performance of SMEs included in our sample in the subsequent analyses.
Table 3 displays information with respect to the eigenvalues of the covariance matrix, the amount of information added by each eigenvalue and the amount of cumulative information. From a statistical point of view, depending on the values of assumed errors, some indicators could have been removed from our analysis. For example, if the assumed error was a maximum of 5%, it would have been possible to keep only the first five indicators in our study. If the targeted error equaled zero, the first eight indicators could be considered relevant, because the total amount of information was 100% recovered. Nevertheless, from the economic standpoint, the self-financing rate of assets (denoted by V9), correlated with other indicators, provides valuable information on the level of performance achieved by a small company. Therefore, we decided to keep all indicators displayed in Table 1 in order to perform our future investigations.
The criterion chosen in order to carry out cluster analysis was the Ward method, which requires the minimization of the total variance within a cluster together with the maximization of the homogeneity degree of the clusters. Of all hierarchical algorithms that may be implemented in the context of cluster analysis, the Ward method is the most efficient one because, at a certain moment, it can merge two classes that display the minimal Ward distance among all possible combinations, a fact that might lead to attaining maximal intra-cluster homogeneity. In accordance, the resulting classification determines an increased homogeneity of the object within the class together with meeting the requirement, stating that the distinct groups of companies should be as different as possible from each other [97].
The dendrogram presented in Figure 4 shows the manner of aggregating the objects into classes, generated using SAS software.
The manner of choosing the number of classes very much depends on the assumed error. In accordance, where we intended to minimize error as much as possible, the cutoff of the dendrogram should be under the 0.05 threshold. Nonetheless, in such a case when several classes of companies with quite similar elements would be a result, this situation would not match the goal assumed by our study. In the case when assumed error would be higher and the cutoff of the chart was at 0.02, only two classes of companies would result, although the elements included in these classes are highly heterogeneous. In the case when we chose to cut the chart at 0.15, three classes of homogeneous companies were individualized and future adjustments of their composition were enabled in the next stage of our methodology through discriminant analysis.
The distribution of SMEs included in the sample in the three distinct classes based on their performance indicators in 2020 is shown in Appendix C (Table A3). In order to facilitate the comparative analysis of the results obtained through the two statistic techniques, the table in Appendix C (Table A3) also systematizes the results given by the discriminant analysis that are detailed in the content of the next paragraph.

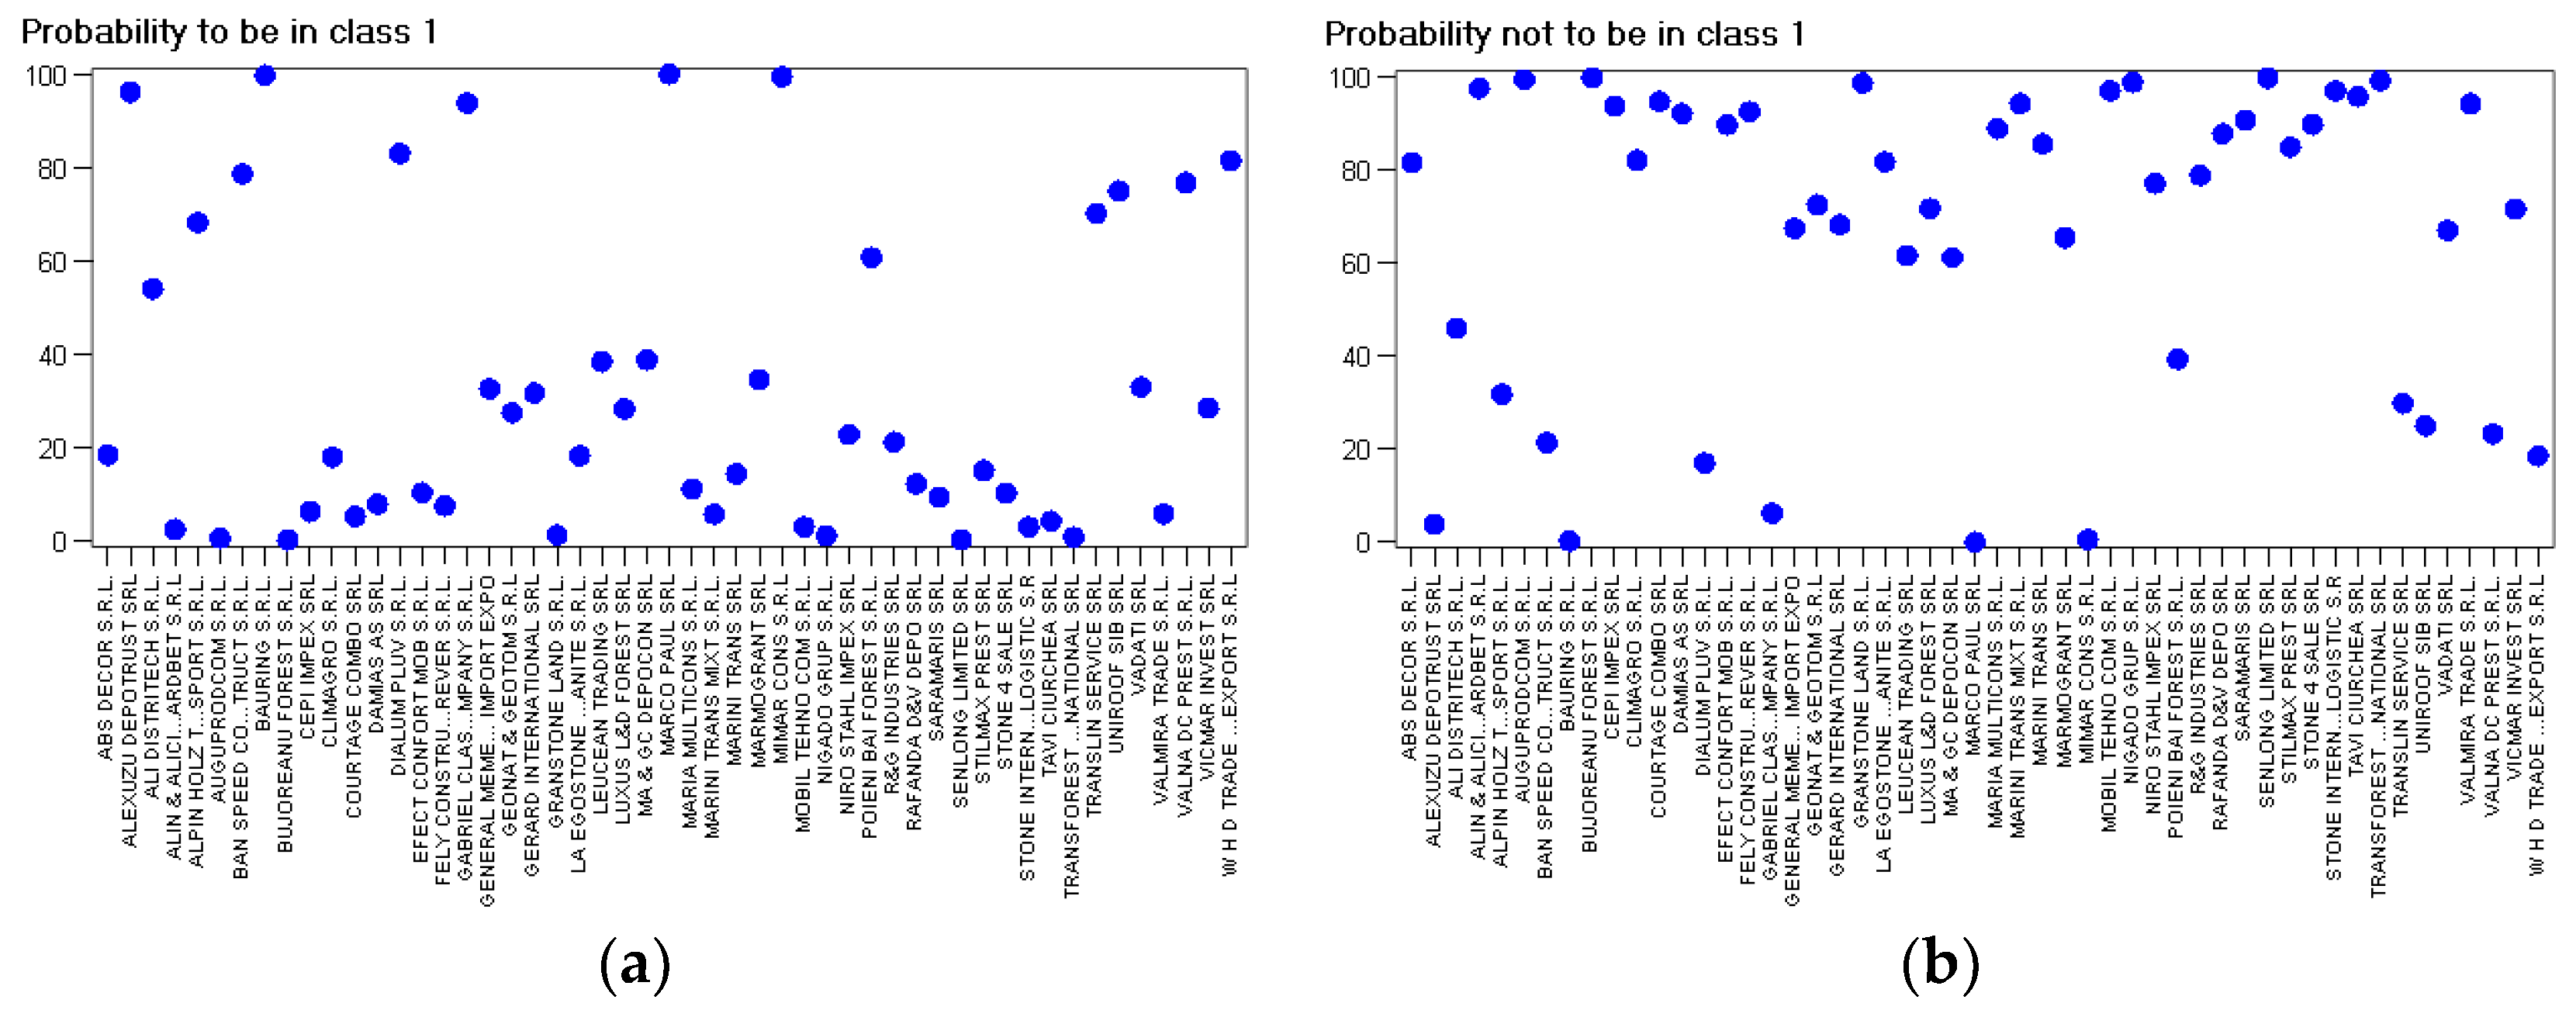
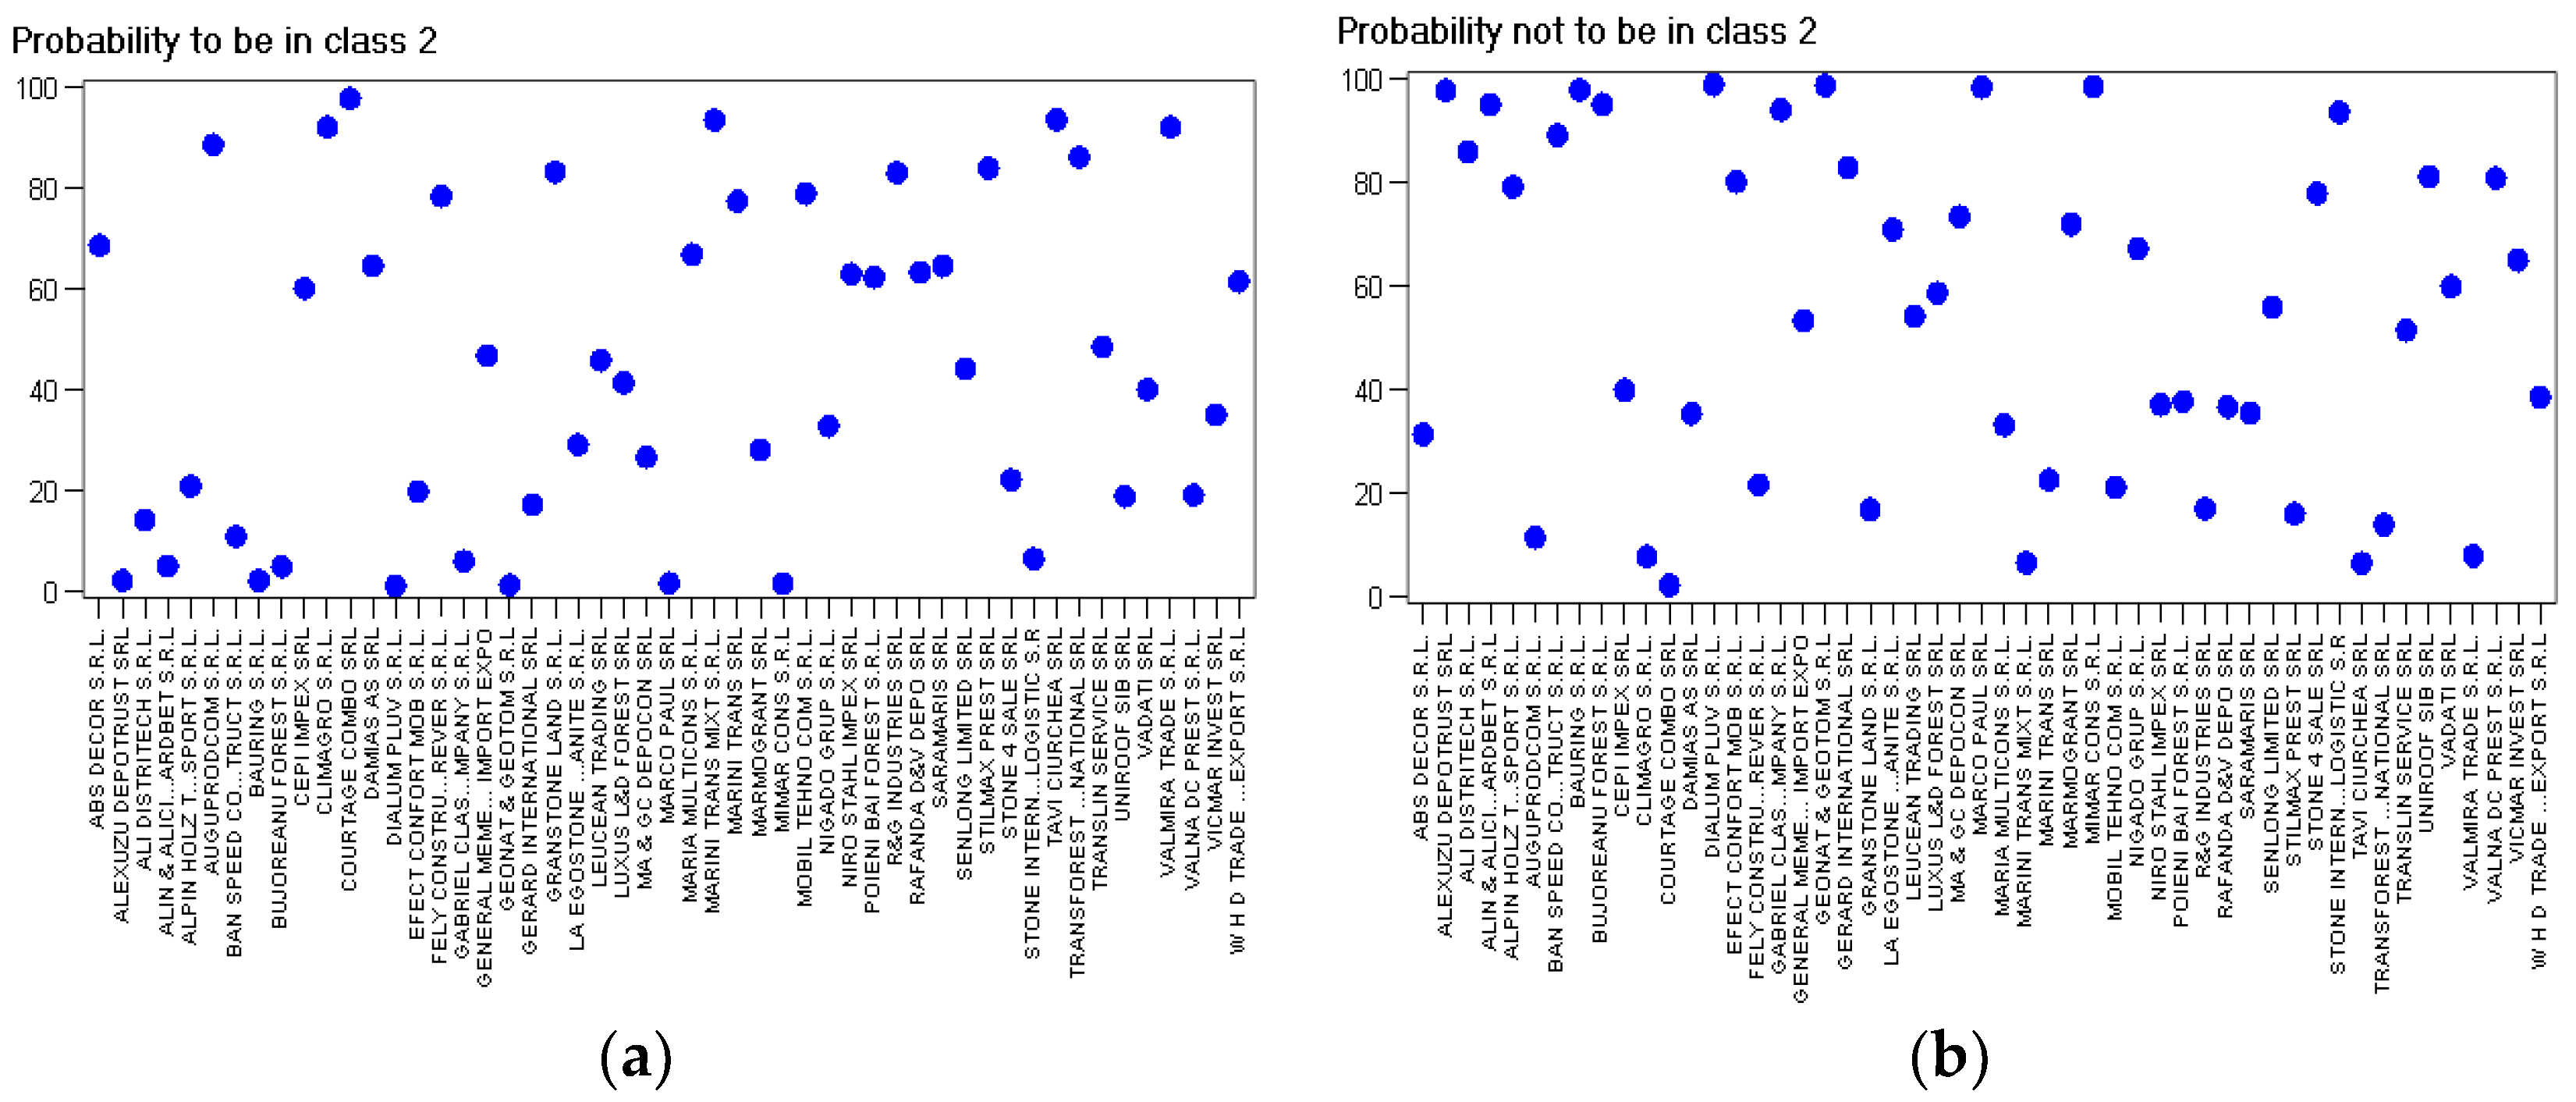
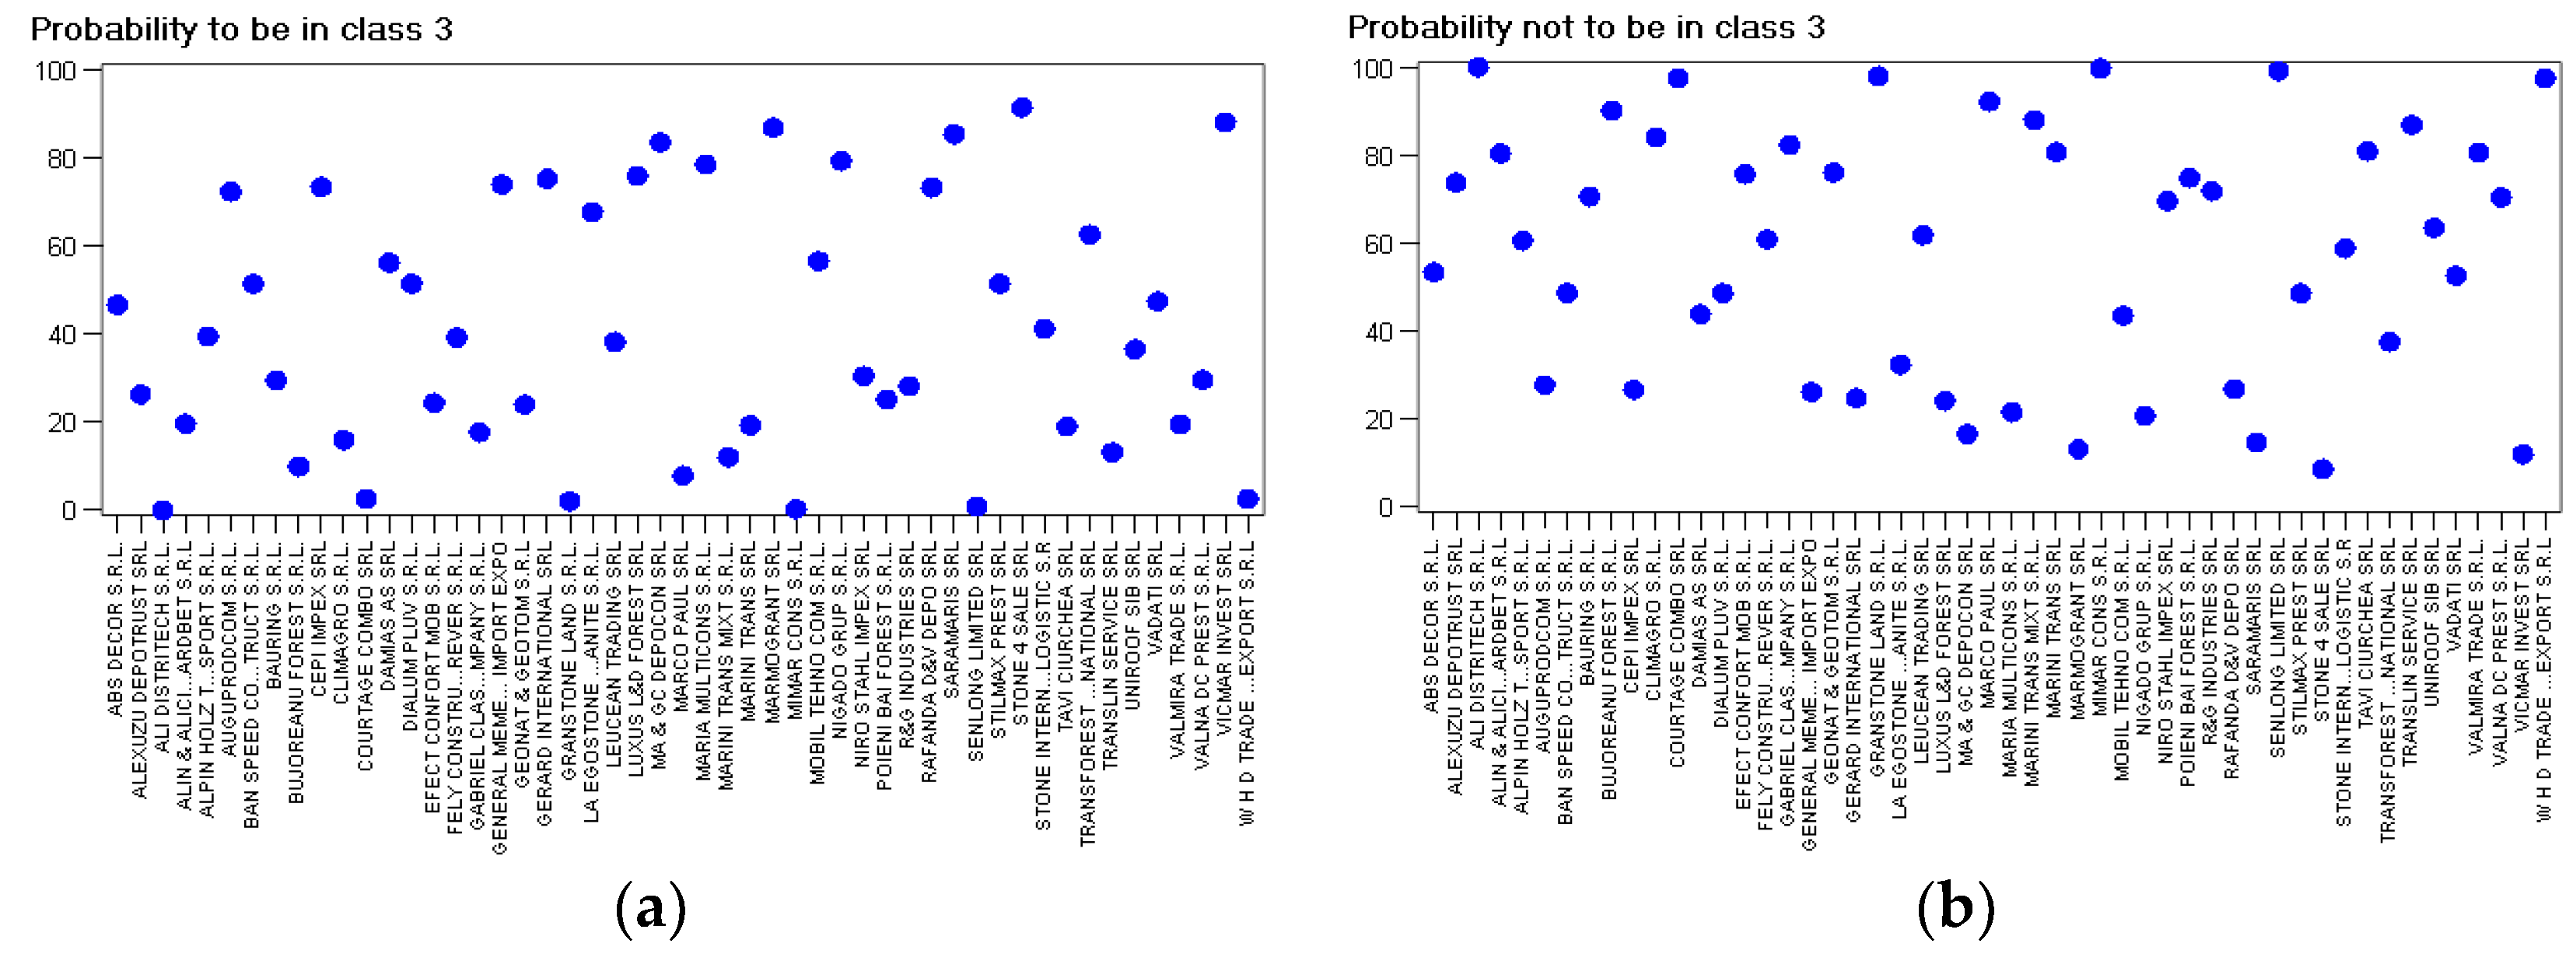
4.2. Discriminant Analysis

Discriminant analysis represents a statistic technique whose implementation leads to determining a mathematical function able to classify a series of objects based on discriminatory variables and affiliation probabilities [98]. Unlike cluster analysis, this method deals with a priori-defined groups, while the classification having resulted relies on identifying the similitude among the objects to be classified and the groups for which these objects display the most resemblance [99,100].
Implemented through SAS Enterprise Guide software, discriminant analysis implies the combining of MANOVA (multivariate analysis of variance) with multiple regression and factorial analysis with a view to determining the functions that enable the classification of a company in one class or another, in the context of minimizing classification errors [101]. The main steps followed by the implementation of the algorithm of discriminant analysis are as follows:
  • Calculating the MANOVA indicators based on a series of statistical data;
  • Calculating the coefficients of discrimination functions;
  • Calculating the affiliation probability of each object to a class and choosing the classes matching maximal probabilities;
  • Comparing the classification resulting through implementing discriminant analysis with the initial classification of the objects.
Through the tests applied on the data series (Wilk’s Lambda, Pillai’s Trace, Hottelling–Lawley Trace and Roy’s Greatest Root), MANOVA provides information regarding the acceptance or rejection of the null hypothesis, in accordance to which the considered independent variables do not exert any effect upon the dependent variable. In contrast, the alternative hypothesis asserts that independent variables significantly influence the dependent variable.
Table 4 details the results of the statistical tests from the MANOVA, by means of the statistical data in Appendix A (Table A1), regarding the performance of SMEs in the field of wholesale trade of timber, building supplies and medical equipment. Calculations were performed separately for each of the three classes defined a priori through cluster analysis. The analysis of the data in Table 4 requires the rejection of H0 (null hypothesis) and the acceptance of H1 (alternative hypothesis), which asserts that indicators V1–V9 influence the affiliation of an object to one or another class of companies.
One of the most important objectives of discriminatory analysis is the facilitation of designing a discriminatory space and a distribution rule of the objects in this space. Once settled, this rule might be also used in the future, without having to resume the algorithm.
Discriminatory space is the result of a graphic representation of discriminatory functions. A discriminatory function is a lineal combination of explanatory variables which, in our case, took the form of the indicators registered for each company. To determining discrimination functions for each class, they generally use formulae such as Equations (2) and (3):
Sk 1 i = j = 1 9 Vj i     Ck 1 j + ak 1 ,   i = 1 , 51 ¯ ,   k = 1 , 2 , 3
Sk 0 i = j = 1 9 Vj i     Ck 0 j + ak 0 ,   i = 1 , 51 ¯ ,   k = 1 , 2 , 3  
where Sk1i represents the probability that company i belongs to class k, Sk0i represents the probability that company i does not belong to class k, Vji represents the value of indicator Vj for company i, j = 1...9, Ck1j represents the coefficients of the function that calculates the affiliation probability of a company’s belonging to class k (k = 1,2,3), which resulted after employing SAS Enterprise Guide software, Ck0j represents the coefficients of the function that calculate the affiliation probability of a company’s belonging or not belonging to class k (k = 1, 2, 3), which resulted after employing the SAS Enterprise Guide Program, ak1 and ak0 are constants specific to the lineal functions that calculate discrimination scores, and i represents the order number assigned to each company included in the sample.
The implementation of discriminant analysis for the first class will have, as a result the determination of coefficients of discrimination functions (Figure 5); entering them into general Equations (2) and (3) results in Equations (4) and (5):
S 10 i = 2.38 10 2 V 1 i + 1.74 10 2 V 2 i 2.78 10 3 V 3 i + 9.59 10 5 V 4 i 1.59 10 2 V 5 i + 7.16 10 3 V 6 i 2.21 10 3 V 7 i + 1.34 V 8 i + 9.59 10 5 V 9 i 4.8 10 7 ,   i = 1 , 51 ¯
S 11 i = 6.39 10 2 V 1 i + 5.41 10 2 V 2 i + 3 10 3 V 3 i + 9.59 10 5 V 4 i 3.62 10 2 V 5 i + 8.14 10 3 V 6 i 2.76 10 2 V 7 i + 0.18 V 8 i + 9.59 10 5 V 9 i 4.8 10 7 ,   i = 1 , 51 ¯
The application of the same algorithm for enterprises from the second class will result in determining of the coefficients of discrimination functions (Figure 6); entering them into general Equations (2) and (3) results in Equations (6) and (7):
S 20 i = 1.7 10 2 V 1 i + 2.98 10 2 V 2 i 1.12 10 2 V 3 i + 9.35 10 5 V 4 i 5.03 10 2 V 5 i + 1.67 10 4 V 6 i + 2.37 10 2 V 7 i + 1.52 V 8 i + 9.35 10 5 V 9 i 4.67 10 7 ,   i = 1 , 51 ¯
S 21 i = 1.38 10 2 V 1 i + 2.42 10 3 V 2 i 1.87 10 3 V 3 i + 9.35 10 5 V 4 i + 10 3 V 5 i + 9.06 10 3 V 6 i 2.73 10 3 V 7 i + 0.12 V 8 i + 9.35 10 5 V 9 i 4.67 10 7   ,   i = 1 , 51 ¯
The application of the algorithm to the third class of enterprises will result in determining the coefficients of specific discrimination functions (Figure 7); entering them into general Equations (2) and (3) results in Equations (8) and (9):
S 30 i = 2.28 10 2 V 1 i + 1.31 10 2 V 2 i 7.91 10 4 V 3 i + 9.62 10 5 V 4 i + 6.69 10 3 V 5 i + 2.74 * 10 3 V 6 i 5.5 10 4 V 7 i + 0.12 V 8 i + 9.62 10 5 V 9 i 4.81 10 7 ,   i = 1 , 51 ¯
S 31 i = 4.12 10 3 V 1 i + 3.68 10 3 V 2 i 8.33 10 3 V 3 i + 9.62 10 5 V 4 i 3.42 10 2 V 5 i + 1.23 10 2 V 6 i + 8.88 10 3 V 7 i + 0.13 V 8 i + 9.62 10 5 V 9 i 4.81 10 7 ,   i = 1 , 51 ¯
The analysis of the charts that display the distribution of the affiliation probability to each class show that, compared with the results determined by cluster analysis, certain companies migrated from one class of companies to another. In accordance with this method, the affiliation probability to a certain class of a certain object (SME) has been determined as the maximum of the affiliation probability calculated for that company, for each class.
Thereby, the following companies migrated from the second class to the first class: R&G Industries SRL, for which a probability of 82.91% was determined, and Poieni Bai Forest SRL, with an associated probability of 62.29%. A single company migrated from the third class to the second class: Stilmax Prest SRL, with an affiliation probability of 83.84%. Finally, the following companies migrated from the second class to the third class: Vadati SRL (with a value of probability of 47.39%), Cepi Impex SRL (with a probability of 73.33%) and La Egostone Granite SRL (with a probability of 67.63%).
The affiliation probabilities of the analyzed objects to the classes of companies were close enough for certain companies, and 9 additional companies, which were not taken into account by cluster analysis, were subsequently introduced into this classification; therefore, we also used the data regarding substitution results and validation results in order to underpin the decision of including a company within one class or another (Appendix B, Table A2). Relying on the considerations shown in this paragraph, SME classifications of the analyzed sample through discriminant analysis are detailed by the last column of the table displayed in Appendix C (Table A3).
The analysis of the field of wholesale trade of timber, building supplies and medical equipment enabled us to extract a series of interesting evolution tendencies. Although the analyzed economic field was affected in Romania by a decrease in production as a result of the accelerated back-down of housing construction under the crisis, it seems that, on the market, a balance of the products sold was provided through the increase in home furnishings largely made by direct labor operations.
Despite this temporary steadiness, the retailers that owned digital infrastructure enabling online orders or that rapidly adapted to the requirements concerning the incorporation of e-commerce and digital technologies were the main winners [102]. Many SMEs took advantage of such circumstances and increased their ability to cope with adverse evolutions. Other managers wasted this opportunity; therefore, dealing with the challenges associated with the COVID-19 pandemic will continue to be difficult and connected both to structural vulnerabilities in the national economy and to significant disturbances induced by the disruption of functionality of supply chains and by the unfolding of the energy crisis.
Through the instrumentality of the statistical methods employed, we were able to identify three distinct categories of enterprises, according to their sales and financial levels of performance. Based on the peculiarities highlighted for each class of enterprises, the managerial strategies applied under the circumstances of profound crisis could be described in detail. The next section analyzes these strategies, together with the consequences that are the most likely to enable either the interruption of the businesses or their survival and sustainable development in the near future.

5. Discussion

The means of the values of performance indicators registered for each class of SMEs are shown in Table 5.
Before interpreting these set of values, we considered that the classification based on the performance of the companies in the field of wholesale trade of timber, building supplies and medical equipment in the county of Hunedoara relied on data available for the year 2020, when a major crisis was triggered by the COVID-19 pandemic [103]. Such circumstances determined real shockwaves, insecurity and uncertainty at various levels of society and the economy, disrupting micro- and macroeconomic evolutions [104,105]. Those circumstances put the entrepreneurial environment in an extremely difficult situation that tested not only the abilities and vision of local entrepreneurs, but also their organizational capacity, innovation and skill to gain access to the technological know-how required for conceiving efficient coping solutions.
The financial performance of SMEs in the analyzed field could be seen as an outcome of the strategic decisions of their management teams dealing with the management of available financial resources not only from the point of view of current liquid assets, but also from the standpoint of supporting the rapid shift towards investments in digitalization and new technologies [106].
The analysis of the results of the companies included in class 1 shows a significant advance determined by a group of indicators calculated in relation to gross and net profit, whose average values are much higher than those of class 2. For instance, ROE1—Return on Equity—is 4.89times higher when compared with the value of class 2, ROA—Return on Assets—is 6.57 times higher when compared with the value registered by the companies in class 2, ROS—Return on Sales—is 4.28 times higher, and GMR—Gross Profit Margin—is 8.17 times higher. The most representative indicator for this class is ROE1—Return on Equity—which displayed an average value of 102.64; this shows that companies with efficient corporate management teams have a significant efficiency per unit of invested capital and are fully capable of attracting new investors in the area [107]. Other factors that influenced the high levels of profitability of these companies regarded the favorable economic conditions before COVID-19, which strengthened capitalization and the improvements in liquidity corroborated rapid decisions of the managers regarding efficient management of the issues determined by the pandemic. Relying on the analyzed indicators, we consider that SMEs included in the first class adopted offensive marketing strategies and met their clients’ demands at a fast pace, through assimilating advanced digital instruments and modernizing distribution systems.
In accordance, the significant level of TLR—Total Liabilities Ratio—debts (10.58% higher than the mean of the second class and 105.36% higher than the mean of associated companies included in the third class) and the low values of ASFR—Assets Self-Financing Ratio—trade receivables (24.53% smaller than the mean of the second class) show that managers identified new opportunities on the market and made investments, given their high risk appetite. A strong example for this group of companies is S.C. Ali Distritech S.R.L in Deva, which displayed a total rate debt of 375.88 (which was 4.15 times higher than the mean of the class) and a self-financing rate of –275,88 (which is 15 times smaller than the mean of the class). The company, which invested massively in electronic commerce instruments, became an eMagMarketplace seller—an online sales channel with instant access to over 500,000 visitors. Such a business maneuver resulted in obtaining a value of ROA of 41.33 (14% higher than the mean value registered in the first class).
Class 2 includes average profitability companies, with profitability indicators that displayed significantly lower values than the ones in class 1 (ROS—Return on Sales—is 76.64% lower; GMR—Gross Profit Margin—is 67.01% lower, whereas ROE2—Return on Expenditures—is 87.76% lower). Although influenced by the amount of sales and the size of gross and net profit that registered oscillating monthly values during the year when the pandemic broke out, the rates were maintained as positive. Such dynamics bear witness to the implementation of prudent marketing strategies, based on maintaining the market status quo under the crisis circumstances.
The indicators regarding total assets showed a small difference as compared with class 1 or were even higher than it, because the assets were cumulated during the economic expansion period before the pandemic, and could still facilitate the accumulation of important capital reserves. For instance, ASFR—Assets Self-Financing Ratio—is 89.91% higher than the mean calculated for class 1, ARR—Accounts Receivables Ratio—is 32.51% higher than the amount of the mean of the companies in class 1, and TLR—Total Liabilities Ratio is 9.57% lower than the average amount of the companies in class 1.
Performance of SMEs included in Class 3 show the gaps displayed by the companies with a precarious financial condition. In the case of these SMEs, all profitability indicators exhibit generally low values as compared with the other two classes previously studied, as a result of implementing defensive strategies, without taking any risks or conceiving innovative solutions in order to survive on the market. The negative GMR (gross profit margin) of the companies in this class is determined both by the increase in expenditures and by an unfavorable dynamic of the turnover.
When considering these significant differences of the performance indicators among classes, we can conclude that the behavior of managers of SMEs from class 3 differed from those ones characteristic to business owners from the other two classes, showing reactivity and lack of vision while displaying a “failure avoiding” behavior. From a financial point of view, such a managerial approach determined the decrease in sales and profitability as well as the increase in debts; all these interconnected aspects determined other negative chain effects upon their own capitals and resulted in an overall increase in their business vulnerability [108]. Taking into account such interdependencies, some of these SMEs might turn to a hibernation period, in order to avoid an upsurge in their losses [109].
As far as the possibility of implementing instruments of circularity is concerned, with a view to fostering a companies’ financial recovery, the literature review showed that a series of research carried out in certain European Union states (such as Romania, Finland and Portugal) asserted the idea that European SMEs do not receive maximum benefit from favorable circumstances related to the possibility of implementing digital/cloud marketing solutions in order to make their business more profitable [110,111]. Nonetheless, less sophisticated IT tools have already started to be present in the current activity of small companies, positively impacting both their financial and non-financial performance. For instance, SMEs appear to deeply understand the importance of connecting their activity to social networks [112,113], whereas objectives related to cost minimization are pursued by their accounting and marketing departments as a priority [114].

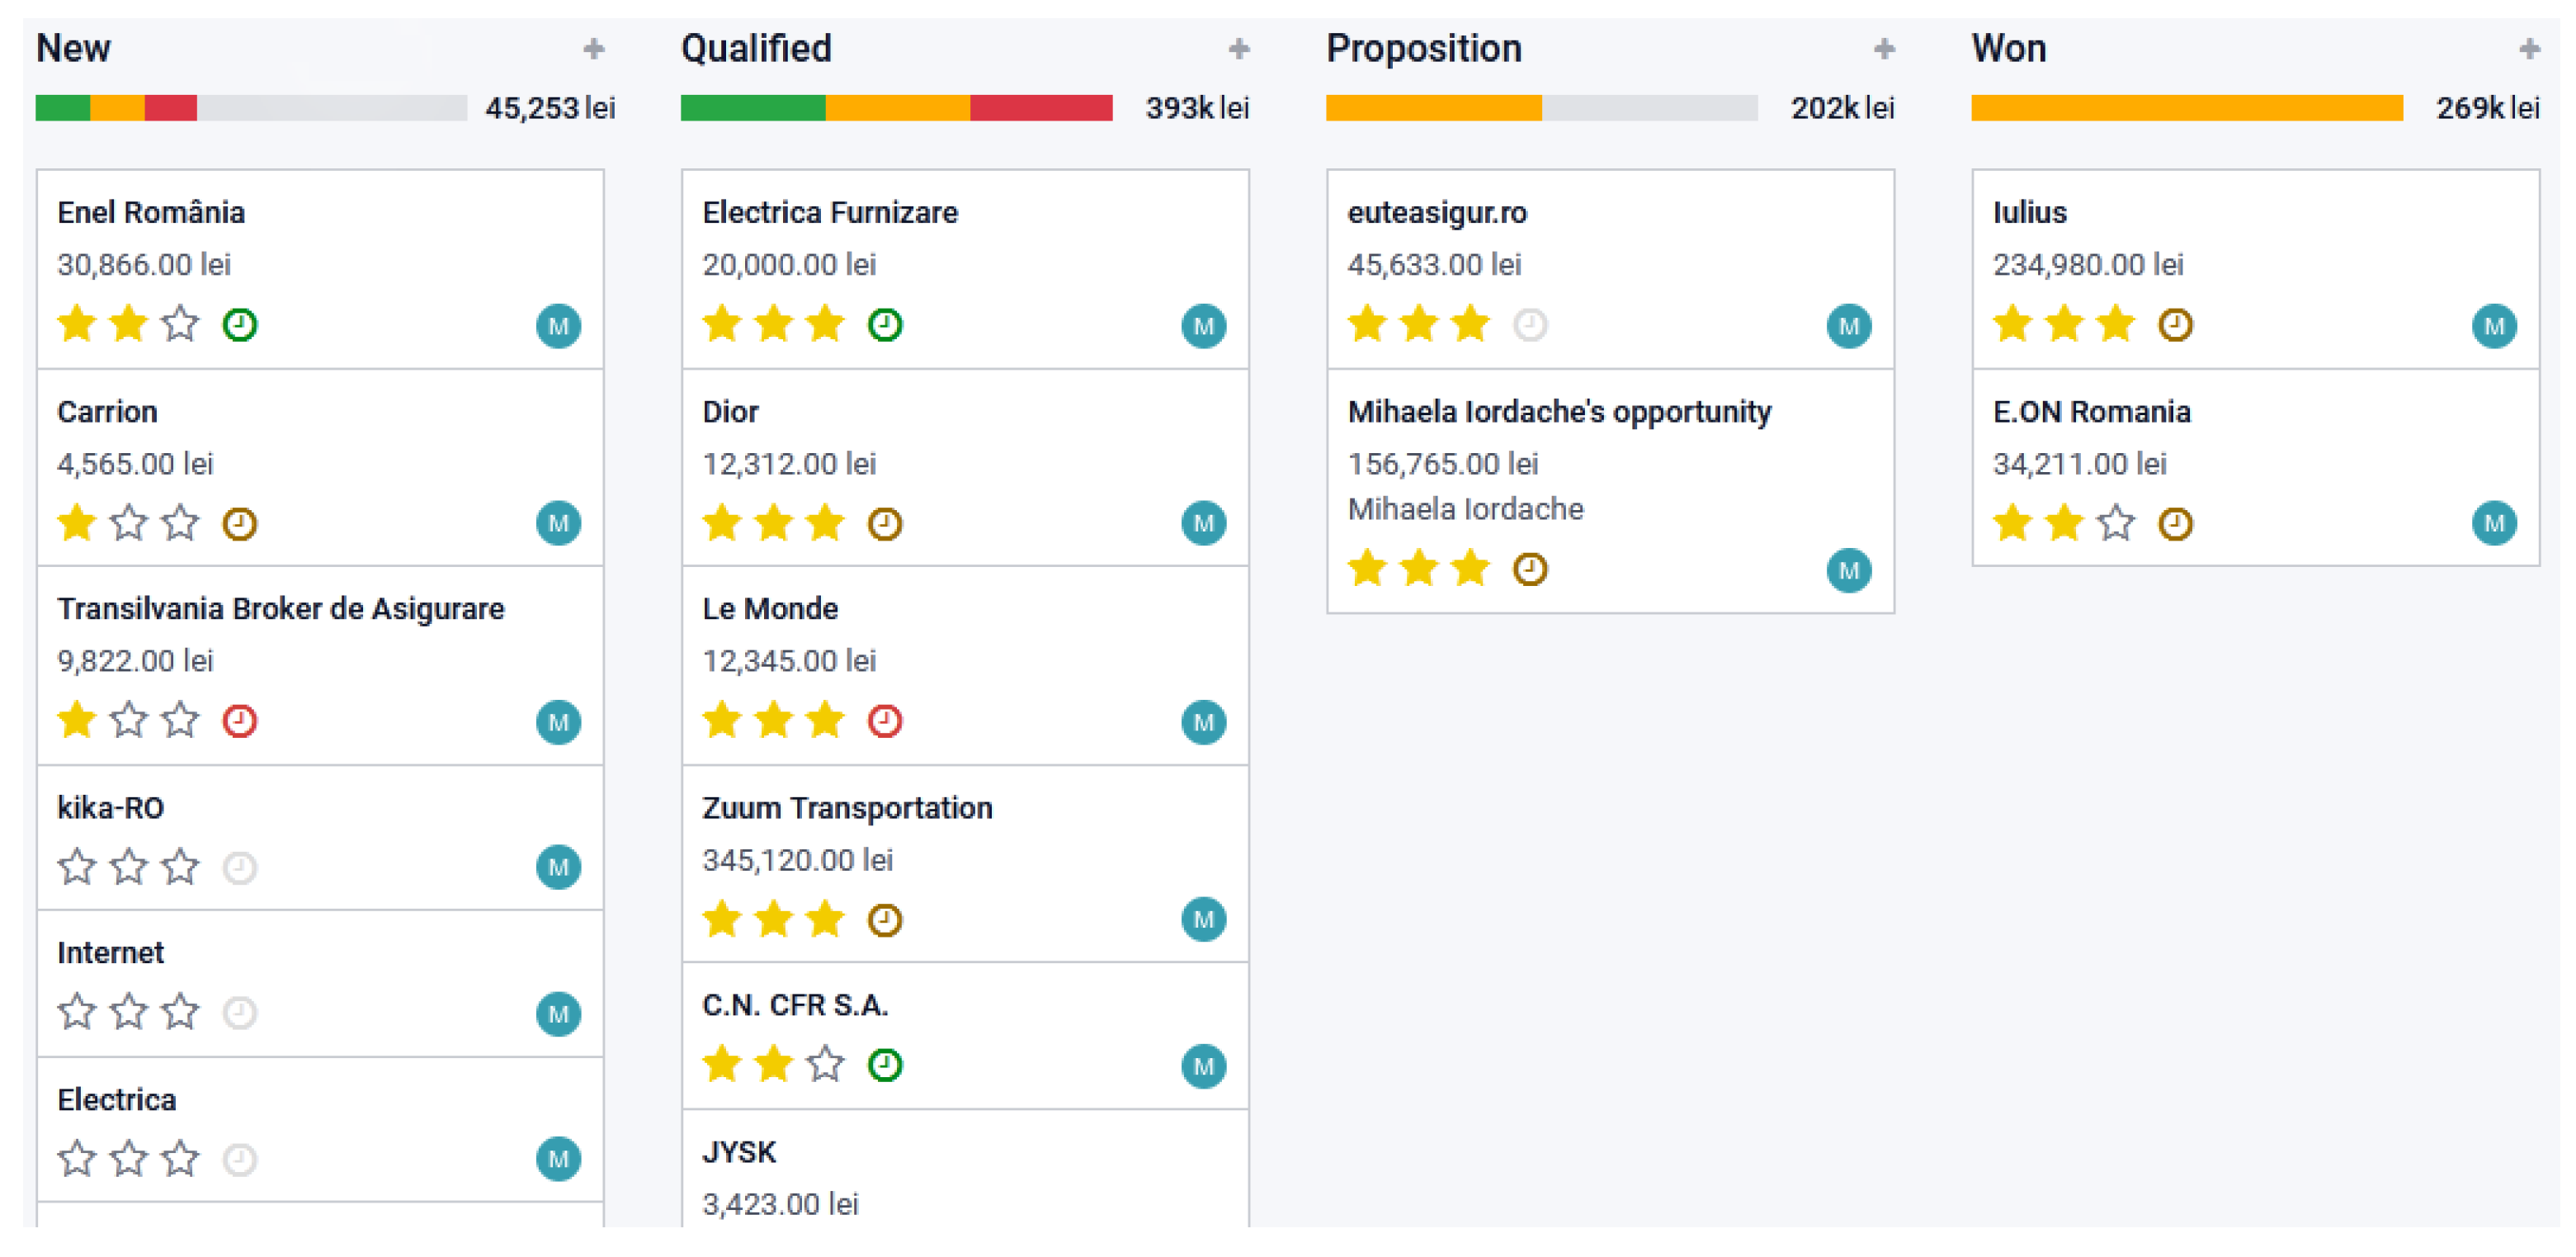
6. Drawing up a Business Scenario for a Small Company in Order to Improve Efficiency and to Support the Circular Economy Goals

In this paragraph, we further elaborate a business scenario where the implementation of digital economic instruments represents the major strategic alternative with a view to improving the CE and efficiency indicators for a particular SME from the analyzed sample.
From our research sample, we picked Marini Trans SRL, which was included, through the discriminant analysis, in class 2 of those companies displaying average levels of economic performance. An overview of the company’s performance in 2020, as compared with the average values of the indicators of registered by companies from class 1, is shown in Table 6.
The analysis of the data in Table 6 shows that, in order for Marini-Trans SRL to improve its activity and advance from performance class 2 to class 1, it should decrease its stocks, increase its incomes from sales and, implicitly, increase profit, while optimizing the consumption of available resources. To carry out this scenario, the option we considered regards the increase in the number of sale opportunities, which might be subsequently transformed into a greater number of new orders placed by reliable clients (see Table 7).
Marini-Trans SRL is company which only has 40 employees; therefore, we recommend the implementation of efficient software that perfectly fits both the company size and the additional constraints derived from the limited amount of financial resources available: ODOO (On-Demand Open Object) ERP [115,116]. Previously known as TinyERP or OpenERP, ODOO represents an enterprise resource planning system which is available as open-source software [117]. The system can serve different areas of concern within a small company, because it was conceived on the basis of a modular structure: human resources, sales, accounting, billing, inventory, manufacturing, project management, customer relationship management and e-commerce CMS, together with over 100 other components that could be implemented to assist numerous business processes throughout the organization. The modules support the consolidation of a green supply chain management by facilitating effective data communication and internal/external integration between departments and business partners.
According to the main objectives pursued by our business scenario, we selected the modules prefigured in Table 7 and detailed in Figure 8: CRM, Social Marketing, Marketing Automation, Email Marketing, SMS Marketing, Events, Surveys, Calendar and Discuss (Figure 8).
ODOO ERP, which designates a Software-as-a-Service (SaaS) cloud computing alternative, mainly focuses on improving relationships with customers while optimizing sales activities and operates in a very similar manner to a customer relationship management (CRM) program [118,119,120].
Thus, the CRM Module enables the efficient management of all the aspects that concern business relations with clients. Consequently, the system makes it possible both to import potential clients from the marketing campaigns carried out and to select existing client-companies from a database.
Sales opportunities bear four labels: new (when the chosen company does not know that it will be approached by the sales team in order to be shown the products), qualified (when there is already a communication channel between the chosen company and the sales team), proposition (when the sales team had already made an offer to the company) and won (when the company is interested in concluding a sale and purchase agreement). Each potential client is given a priority level (represented through the star sign in the screenshot below) and is allocated an amount estimated to be obtained based on its firm orders, as shown in Figure 9.
From the timer presented next to each client, future activities regarding the relationship with the client may be defined; these activities will be subsequently arranged by time through the Calendar module. In accordance, there are activities marked in red (meaning that they are past activities), activities marked in yellow (meaning that the activities are being carried out at present) and activities marked in green (which will be carried out in the future).
To more easily view future activities, it is possible to fully view subjacent activities as a list for each sales opportunity (Figure 10).
After a sales opportunity is won and a client is willing to conclude a sale and purchase agreement with Marini Trans SRL, the Sales module in Odoo is further used. A product offer is issued here, at least one negotiation round of the sale and purchase agreement will be organized and, finally, the agreement will be concluded and take effect. The order may be honored fully, partly, continuously or discontinuously, immediately or at a later date. After the invoice is issued, it is automatically recorded in the accounts through the Accounting module, and at the end of the financial year, the accounting records related to it are issued.
The Accounting module will transpose inputs consisting of economic data into outputs represented by financial reports which could be used in order to track revenues and expenditures yielding from different types of transactions. The Accounting module can be used by numerous employees inside the company who are involved in the decision-making mechanisms. Using Accounting Dashboards, one can gather valuable information such as accounts receivable for costumers, accounts payable for suppliers, moments when receivables and debts are due, the present cash position, etc. [119].
Social Marketing Module enables the use of social media channels that might be integrated within Odoo in order to promote the business, such as Facebook, Instagram, LinkedIn, Twitter and YouTube. The use of social networks in the field of marketing often implies the combining of several online/offline instruments with a view to increase interactions and the amount of traffic on small business sites. The handiest marketing strategy consists of tagging an article on a business subject on a blog and then sharing it through Facebook, Instagram or Twitter. Starting from this idea, ample promotion campaigns might be initiated, which also include the presentation of a series of videos regarding the business/product on TikTok or YouTube.
The SMS Marketing Module defines a standard SMS message and its distribution to all contacts, directly from the Odoo App. In order to carry out a marketing campaign through SMS, credit should be bought in advance, depending on the number of SMSs desired to be included in the campaign, and implicitly, on the campaign’s magnitude.
In cases where a business is promoted through e-mails, the Email Marketing Module offers a wide range of facilities. In accordance, an e-mail template might be defined and sent to a new or existing list of contacts. Odoo offers a series of indicators that regard e-mailing status; thus, an e-mail may be reported as sent, opened by the receiver, or cases when the client clicks the link in the e-mail or even gives an answer.
The Events Module enables the carrying out of events such as presentations, exhibitions, conferences, fairs, etc., which require the physical participation of clients. For each event, it is possible to determine a maximum number of participants who will come on-site. From the Communication section, Template e-mails may be defined and sent to the potential clients at various time intervals before the event (for instance, one hour before the event, 3 days before the event, etc.).
The Marketing Automation Module enables the integration of elements described in the SMS Marketing and Email Marketing modules and also brings the new element of directly defining vCards in the Python programming language. As a result, complex marketing campaigns may be designed and administered.
In order to substantiate the decisions concerning the carrying out of marketing campaigns and the initiation of negotiations, at the level of the sales team and top management, the CRM module enables the creation of several types of final reports based on which predictions regarding sales incomes may accurately be performed (Figure 11).
Some authors in the literature investigated the extent to which the organizational size matters in taking the implementation decisions. It turned out that small and mid-market companies exhibited a greater potential to fully exploit the opportunities brought about by Cloud ERP solutions, as compared with large companies [116,118]. Likewise, SMEs regularly have fewer requirements in terms of the sophistication degree of the supported business processes, the amount of data administered or the practicality of the software components. In other words, SMEs such as Marini-Trans SRL seem to be more prepared than a large corporation for moving their core operations to the cloud, by being able to exploit a wide range of advantages deriving from this strategy; concerns regarding security problems or internal resistance to change can be classified as minor to moderate in their case.
The benefits of adopting cloud computing to the circular economy are strongly interconnected. The improvement in energy efficiency yields smaller amounts of CO2 emissions, which further imply the substantial diminishing of costs. Moreover, less infrastructure and uncomplicated efficient electronic devices entail significant reductions in energy consumption while reducing the amount of e-waste. Summarizing the predictable positive effects occurring due to the interdependent implementation of the abovementioned CE practices, Table 8 displays a coherent system of indicators to assess the future sustainable performance of Marini Trans SRL [46,121].
In order to provide an overall image regarding the three dimensions of assessing performance which are closely linked to circularity principles (i.e., economic, environmental and social performance), Appendix D (Table A4) exhibits the comprehensive list of current and proposed variables used in order to measure the impact of the cloud computing solution upon the CE goals.
As mentioned, ODOO ERP software has an open-source facility, so that the users no longer depend on the service provider to make major changes to the program after having purchased it; thus, users can customize their options even in cases when they possess limited financial resources and minimal programming knowledge [117,119]. In addition, another important advantage of this program is represented by its modular structure; each of these modules is reusable and plays a well-established part in the system, the entrepreneur being able to purchase only the modules he needs at a certain moment. Moreover, ODOO ERP benefits can materialize as more efficient planning processes, high levels of promptitude in delivering orders, optimized inventories and precise adjustment between delivery rhythms and the manufacturers’ production flows, etc. [81].

7. Conclusions, Limitations and Future Research Directions

Based on our statistical analyses, we were able to establish an empirical performance-based classification of wholesalers from the SME sector in Hunedoara County, Romania, according to their response strategies to the unprecedented crisis generated by the outbreak of the COVID-19 pandemic at the beginning of 2020. The approach enabled us to further draw up a business scenario on ODOO ERP system’s adoption by a local small company from our sample in order to improve its operational efficiency, under the circumstances of promoting low-carbon and circular economy principles.
Summarizing the findings of our research, the answer to RQ1 is that we can clearly detect three clusters of Romanian commerce SMEs if we consider the activities carried out in order to cope with the challenges brought about by the health crisis. Thus, it is obvious that the companies distributed in class 1 adopted an investment policy that enabled the implementation of a series of survival and even development strategies during the pandemic, while aiming to communicate with their clients more closely through digital instruments; this aspect is shown by the values of their performance indicators and by the magnitude of activities being carried out online. On the other hand, the managers of companies in class 2 and class 3 displayed high risk aversion levels, together with a rather reactive attitude regarding the designing of efficient anti-crisis strategies. The extent to which their mentality will rapidly change towards a deep restructuring and reconfiguring of their business model, according to the digitalization trends and circularity principles, will decide upon the survival of these SMEs on the market in the years to come.
As for RQ2, the answer is positive, because we were able to draw up a simple scenario whose main focus was the providing of pre-conditions for the transition of a small company from our sample, during the next financial year, from the SMEs class with average performance to the class with the highest efficiency levels. This scenario targeted the appropriate implementation of a cloud-based IT solution, under the restrictions related to the imperative of maintaining very low operating costs. However, in addition to numerous positive effects on performance that have been mentioned in this paper, plenty of other indirect effects are expected to occur due to SMEs’ decision to move online, in terms of raising entrepreneurs’ awareness regarding the importance of mitigating the impact of economic activities, augmenting the level of their involvement in corporate social responsibility programs [122], the increase in investments in environmental education and training programs for employees, the significant improvements in the overall quality of environmental governance, etc. Despite fulfilling the purpose of giving substantiated answers to the initial research questions, the authors of the present paper are aware that their study is subject to a few limitations. First of all, the focus on commercial SMEs from Hunedoara County restricts the possibility of extrapolating the conclusions to the whole population of SMEs operating in Romania in the commercial domain.
Secondly, although the quantitative approach used in this research is appropriate, we believe it can be improved by employing a multiple case study design in order to provide in-depth descriptions of experiences and practices accompanying SME paths to CE adoption through digitalization. At the same time, more sophisticated quantitative approaches could be used in order to refine our quantitative approaches to classification. To this end, a perceptron multilayer neuronal network might be designed; in such cases, the input layer will include a number of neurons equal to the number of performance indicators taken into account and the number of neurons in the hidden layer will be experimentally determined, whereas the output of the network will include three or four neurons, each of them corresponding to a specific class of SMEs which will be individualized in relation to the peculiarities of business strategies implemented.
Thirdly, the present research only employed data available for the year 2020; considering that the effects of the shock determined by the health crisis continues to be present on various levels of the economic and social life and that the efficient management of SMEs requires radical solutions able to fundamentally change their traditional model of doing business, we believe that our research effort in this area should be continued in the years to come, by including a larger sample of commercial Romanian SMEs in our analyses.

Author Contributions

Conceptualization, C.C.D. and A.M.M.I.; methodology, C.C.D. and A.M.M.I.; software, A.M.M.I. and A.I.; validation, A.I.; formal analysis, A.I. and T.O.B.; investigation, C.I.; resources, A.M.M.I.; data curation, T.O.B.; writing—original draft preparation, C.C.D. and A.M.M.I.; writing—review and editing, C.C.D.; visualization, T.O.B.; supervision, C.C.D. and A.M.M.I.; project administration, C.C.D. and C.I. All authors have read and agreed to the published version of the manuscript.

Funding

This research received no external funding.

Institutional Review Board Statement

Not applicable.

Informed Consent Statement

Not applicable.

Data Availability Statement

The data presented in this research are available upon request from the corresponding authors.

Conflicts of Interest

The authors declare no conflict of interest.

Appendix A

Table A1. Values of performance indicators for SMEs included in the sample.
CompanyV1V2V3V4V5V6V7V8V9
R&G Industries SRL20.2228.127.4638.1752.228.688.1484.2361.83
Damias AS SRL2.617.310.6470.869.860.790.7567.2429.14
Marini Trans SRL4.0822.052.1584.0740.992.52.283.5715.93
Vadati SRL14.8836.724.966.1111.555.855.1273.9633.89
Abs Decor SRL16.4229.8212.1552.2221.4514.014.7664.1447.78
Stilmax Prest SRL13.0513.119.4614.4852.881110.6196.9785.52
Saramaris SRL13.7712.885.059.577.265.975.0659.6690.43
General Memento UM Import Export SRL14.6516.694.9424.3718.965.734.9296.3575.63
Cepi Impex SRL1.282.710.6658.610.150.760.6162.6541.39
Fely Construct Forever SRL11.313.890.3176.4620.163.820.3265.2123.54
Luxus L&D Forest SRL20.63255.0330.54.295.985.2871.7669.5
Climagro SRL29.776.150.7156.3558.727.870.7888.1143.65
MA&GC Depocon SRL14.2817.966.0529.061.816.786.4794.470.94
Translin Service SRL43.187.1312.9153.9439.1113.8714.7958.6146.06
Marmogrant SRL22.2323.0921.27.649.6222.1126.6392.5292.36
Marini Trans Mixt SRL10.5729.3511.7866.6561.7312.7213.2863.4433.35
Bauring SRL85.1115.979.1232.386.449.899.9594.2967.62
Valmira Trade SRL1.153.140.3770.4855.060.460.3785.7529.52
Valna DC Prest SRL8.2982.585.0791.627.16.075.482.038.38
Mobil Tehno Com SRL0.661.910.2569.619.880.290.2550.4530.39
Poieni Bai Forest SRL39.851.834.9235.3841.985.855.2280.1464.62
Rafanda D&V Depo SRL10.9912.543.2831.8513.454.213.470.7968.15
Transforest International SRL2.387.110.7866.541.4710.789.3715.8833.46
Courtage Combo SRL−0.122.82−0.16104.2789.63−0.16−0.1299.79−4.27
Augurprodcom SRL7.0811.378.8843.870.779.859.793.9956.13
Niro Stahl Impex SRL5.4818.884.1376.6633.715.134.3596.0423.34
Gerard International SRL69.2370.9942.194.750.3643.274.7424.8595.25
Uniroof SIB SRL23.6461.749.1865.2317.2710.1110.2191.5534.77
Gabriel Class Company SRL13.82106.067.3888.5120.938.367.9599.9811.49
Vicmar Invest SRL26.6926.4617.573.22.1318.319.471.5996.8
Alpin Holz Transport SRL19.1554.297.7967.816.038.548.5292.8832.2
Alexuzu Depotrust SRL13.23118.417.8990.094.38.898.6693.859.91
Ban Speed Construct SRL32.6860.1623.9550.9115.5726.5132.610049.09
Tavi Ciurchea SRL6.4112.3619.455.368.2722.5125.038444.7
Leucean Trading SRL10.5928.154.768.6226.465.634.8997.8131.38
Nigado Grup SRL18.5527.7749.7135.5717.9651.54102.4348.6664.43
WHD Trade General Export SRL25.2795.7111.4375.7379.2412.431310024.27
Marco Paul SRL143.38188.8435.7428.03037.722.5330.4671.97
Stone 4 Sale SRL35.2633.9240.2500.0541.8469.2153.35100
Maria Multicons SRL0.9610.0411.0213.4624.51.226.2286.7286.54
Dialum Pluv SRL13.1496.441.0986.72042.1762.7210013.28
La Egostone Granite SRL0.753.6713.0283.430.116.0215.4995.9716.57
Senlong Limited SRL−115.1958.96−74298.114.91−72.97−42.5836.85−198.11
Granstone Land SRL0.59−3.90.78232.581.840.090.8625.73−132.58
Stone International Logistic SRL−0.9517.13−385.93156.9824.98−37.6−26.8579.17−56.98
Ali Distritech SRL41.33−0.740.27375.884.535.5128.4398.56−275.88
Geonat&Geotom SRL97.2599.6669.363.785.7670.29233.4610096.3
Mimar Cons SRL−46.47255.22−123.67118.3681.91−122.67−55.5495.18−18.36
Efect Confort Mob SRL−32.486.9−5.95147.90−58.52−3.7598.81−47.9
Alin&Alicia Gardbet SRL0.1635.12625.1563.615.927.78282.1699.6336.39
Bujoreanu Forest SRL−4.87−7.01−444.0225.5388.92−413.88−31.410074.47

Appendix B

Table A2. Resubstitution results and cross-validation results.
Resubstitution ResultsValidation Results
CompanyClass 1 (%)Class 2 (%)Class 3 (%)Class 1 (%)Class 2 (%)Class 3 (%)
R&G Industries SRL21.2982.9128.1512.1486.630.05
Damias AS SRL8.0264.656.128.4962.9557.73
Marini Trans SRL14.4977.3219.2715.3976.3820.11
Vadati SRL33.0940.0847.393437.3748.18
Abs Decor SRL18.4968.646.5719.3267.747.68
Stilmax Prest SRL15.2683.8451.3617.2188.6440.48
Saramaris SRL9.4864.4785.2210.368.5884.07
General Memento UM Import Export SRL32.6546.7473.8435.850.1470.61
Cepi Impex SRL6.4160.0573.336.8656.3376.28
Fely Construct Forever SRL7.6778.3339.168.1377.5740.57
Luxus L&D Forest SRL28.4141.4275.830.2943.4674.46
Climagro SRL18.0292.0415.8921.2690.917.57
MA&GC Depocon SRL38.9326.7283.3744.2129.4780.55
Translin Service SRL70.1748.5413.1363.1553.1414.04
Marmogrant SRL34.728.1786.838.6830.6385.4
Marini Trans Mixt SRL5.8893.3412.016.593.4713
Bauring SRL99.712.3129.4399.721.9338.1
Valmira Trade SRL5.8891.9919.476.3891.2821.12
Valna DC Prest SRL76.7719.2529.673.9610.7531.37
Mobil Tehno Com SRL3.1578.7856.473.3177.1659.47
Poieni Bai Forest SRL60.7262.2925.1254.865.7826.62
Rafanda D&V Depo SRL12.3763.373.1413.1465.7571.91
Transforest International SRL0.9685.9962.430.8281.3773.17
Courtage Combo SRL5.497.632.566.3897.352.06
Augurprodcom SRL0.7888.4172.260.5782.5386.22
Niro Stahl Impex SRL22.9462.8530.4124.4160.3531.8
Gerard International SRL31.8117.2775.1543.8221.0857.27
Uniroof SIB SRL7518.9536.573.4619.7437.86
Gabriel Class Company SRL93.766.1317.6892.846.3519.2
Vicmar Invest SRL28.5335.088831.2537.6387.28
Alpin Holz Transport SRL68.2320.9739.465.6521.8640.89
Alexuzu Depotrust SRL96.12.3426.2295.222.1729.99
Ban Speed Construct SRL78.6211.0251.3475.7311.654.44
Tavi Ciurchea SRL4.3593.4119.044.7192.421.45
Leucean Trading SRL38.4845.8438.1740.6641.739.78
Nigado Grup SRL1.3132.8679.21.1641.4365.89
WHD Trade General Export SRL81.4861.412.5670.0372.742.27
Marco Paul SRL99.971.767.841000.439.64
Stone 4 Sale SRL10.4122.2391.2911.8824.9989.7
Maria Multicons SRL11.2666.7778.4112.2570.8676.18
Dialum Pluv SRL82.991.2651.3671.310.9662.36
La Egostone Granite SRL18.3929.1767.6320.8719.672.88
Senlong Limited SRL0.4444.160.920.0788.780.14
Granstone Land SRL1.45583.032.011.1995.441.43
Stone International Logistic SRL3.166.6141.173.257.480.49
Ali Distritech SRL54.0414.240.0499.9653.360
Geonat&Geotom SRL27.571.4523.9696.440.1180.49
Mimar Cons SRL99.41.670.251000.210
Efect Confort Mob SRL10.4319.9224.312.3823.1728.33
Alin&Alicia Gardbet SRL2.655.1519.611.092.7698.37
Bujoreanu Forest SRL0.335.069.8800.399.39

Appendix C

Table A3. Classification of commercial SMEs from Hunedoara County according to the cluster analysis and the discriminant analysis approaches.
CategoryCluster AnalysisDiscriminant Analysis
Class 1R&G Industries SRL, Translin Service SRL, Bauring SRL, Valna DC Prest SRL, Poieni Bai Forest SRL, Uniroof SIB SRL, Gabriel Class Company SRL, Alpin Holz Transport SRL, Alexuzu Depotrust SRL, Ban Speed Construct SRL, WHD Trade General Export SRL, Marco Paul SRL, Dialum Pluv SRLTranslin Service SRL, Bauring SRL, Valna DC Prest SRL, Uniroof SIB SRL, Gabriel Class Company SRL, Alpin Holz Transport SRL, Alexuzu Depotrust SRL, Ban Speed Construct SRL, WHD Trade General Export SRL, Marco Paul SRL, Dialum Pluv SRL, Ali Distritech SRL, Geonat&Geotom SRL, Mimar Cons SRL
Class 2Damias AS SRL, Marini Trans SRL, Vadati SRL, Abs Decor SRL, Cepi Impex SRL, Fely Construct Forever SRL, Climagro SRL, Marini Trans Mixt SRL, Valmira Trade SRL, Mobil Tehno Com SRL, Transforest International SRL, Courtage Combo SRL, Augurprodcom SRL, Niro Stahl Impex SRL, Tavi Ciurchea SRL, Leucean Trading SRL, La Egostone Granite SRLR&G Industries SRL, Damias AS SRL, Marini Trans SRL, Abs Decor SRL, Stilmax Prest SRL, Fely Construct Forever SRL, Climagro SRL, Marini Trans Mixt SRL, Valmira Trade SRL, Mobil Tehno Com SRL, Poieni Bai Forest SRL, Transforest International SRL, Courtage Combo SRL, Augurprodcom SRL, Niro Stahl Impex SRL, Tavi Ciurchea SRL, Leucean Trading SRL, Senlong Limited SRL, Granstone Land SRL
Class 3Stilmax Prest SRL, Saramaris SRL, General Memento UM Import Export SRL, Luxus L&D Forest SRL, MA&GC Depocon SRL, Marmogrant SRL, Rafanda D&V Depo SRL, Gerard International SRL, Vicmar Invest SRL, Nigado Grup SRL, Stone 4 Sale SRL, Maria Multicons SRLVadati SRL, Saramaris SRL, General Memento UM Import Export SRL, Cepi Impex SRL, Luxus L&D Forest SRL, MA&GC Depocon SRL, Marmogrant SRL, Rafanda D&V Depo SRL, Gerard International SRL, Vicmar Invest SRL, Nigado Grup SRL, Stone 4 Sale SRL, Maria Multicons SRL, La Egostone Granite SRL, Stone International Logistic SRL, Efect Confort Mob SRL, Alin&Alicia Gardbet SRL, Bujoreanu Forest SRL

Appendix D

Table A4. List of current and proposed variables used in order to measure the impact of the ODOO ERP solution on the CE goals.
Variable used in order to Assess Performance (2020)
No.CodeEconomic Performance Indicators
1V1ROA—Return on Assets
2V2ROE1—Return on Equity
3V3ROS—Return on Sales
4V4LEV—Total Liabilities Ratio
5V5ARR—Accounts Receivables Ratio
6V6GMR—Gross Profit Margin
7V7ROE2—Return on Expenditures
8V8CAR—Current Assets Ratio
9V9ASFR—Assets Self-Financing Ratio
Proposed Variables in order to measure the impact on CE goals
Environmental Performance Indicators (2022)
10V10REW—Reduction in e-waste
11V11RCF—Reduction in CO2 emissions
12V12REC—Reduction in energy consumption
Social Performance Indicators (2022)
13V13AEP—Improved awareness on environmental protection issues
14V14ICSR—Investments in corporate social responsibility programmes
15V15IETE—Investments in employee training and education

References

  1. European Comission. Annual Report on European SMEs. 2020/2021; Publications Office of the European Union: Luxembourg, 2021; Available online: https://ec.europa.eu/growth/smes/sme-strategy/sme-performance-review_ro (accessed on 22 April 2022).
  2. EuroCommerce for Retail&Wholesale. Wholesale at the Centre of Europe’s Economy. 2020. Available online: https://www.eurocommerce.eu/retail-and-wholesale-in-europe.aspx (accessed on 22 April 2022).
  3. European Comission. SME Country Fact Sheet. Romania. 2021. Available online: https://ec.europa.eu/growth/smes/sme-strategy/sme-performance-review_ro#sba-fact-sheets (accessed on 22 April 2022).
  4. European Comission. SME Country Fact Sheet. Romania. 2018. Available online: http://www.contragarantare.ro/webincident/fisiere/2019_raport_SBE_Factsheet_Romania_-_2018_IMM_CE_dra13u.pdf (accessed on 22 April 2022).
  5. Suciu Vodă, A.D.; Tudor, A.I.M.; Chițu, I.B.; Dovleac, L.; Brătucu, G. IoT Technolgies as Instruments for SMEs’ Innovation and Sustainable Growth. Sustainability 2021, 13, 6357. [Google Scholar] [CrossRef]
  6. Nandi, S.; Sarkis, J.; Aghaei Hervani, A.; Helms, M.M. Redesigning Supply Chains using Blockchain-Enabled Circular Economy and COVID-19 Experiences. Sustain. Prod. Consum. 2021, 27, 10–22. [Google Scholar] [CrossRef] [PubMed]
  7. Bahador, M.H.; Ibraim, S.S. Technology Innovations toward Sustainable Growth of Small and Medium Enterprise (SMEs): Aftermath COVID-19 Pandemic. Int. J. Acad. Res. Bus. Soc. Sci. 2021, 11, 1235–1241. [Google Scholar] [CrossRef]
  8. Obrad, C.; Circa, C. Determinants of Work Engagement among Teachers in the Context of Teleworking. Amfiteatru Econ. 2021, 23, 718–735. [Google Scholar] [CrossRef]
  9. Scutariu, A.L.; Șușu, S.; Huidumac-Petrescu, C.E.; Gogonea, R.M. A Cluster Analysis Concerning the Behavior of Enterprises with E-Commerce Activity in the Context of the COVID-19 Pandemic. J. Theor. Appl. Electron. Commer. Res. 2022, 17, 3. [Google Scholar] [CrossRef]
  10. Grondys, K.; Slusarczyk, O.; Iqbal Hussain, H.; Androniceanu, A. Risk Assessment of the SME Sector Operations during the COVID-19 Pandemic. Int. J. Environ. Res. Public Health 2021, 18, 4183. [Google Scholar] [CrossRef]
  11. Lichtenthaler, U. A Conceptual Framework for Innovation and New Business Opportunities in the Post-Pandemic Period. J. Creat. Bus. Innov. 2021, 7, 74–89. [Google Scholar]
  12. Warner, K.S.; Wäger, M. Building Dynamic Capabilities for Digital Transformation: An Ongoing Process of Strategic Renewal. Long Range Plan. 2019, 52, 326–349. [Google Scholar] [CrossRef]
  13. Wirtz, B.W.; Pistoia, A.; Ullrich, S.; Gottel, V. Business Models: Origin, Development and Future Research Perspectives. Long Range Plan. 2015, 49, 36–54. [Google Scholar] [CrossRef]
  14. Botezat, A.E.; Dodescu, A.O.; Văduva, S.; Fotea, S.L. An Exploration of Circular Economy Practices and Performance Amonga Romanian Producers. Sustainability 2018, 10, 3191. [Google Scholar] [CrossRef] [Green Version]
  15. Oncioiu, I.; Căpușneanu, S.; Türkeș, M.C.; Topor, D.I.; Constantin, D.M.O.; Marin-Pantelescu, A.; Ștefan Hint, M. The Sustainability of Romania SMEs and Their Involvement in the Circular Economy. Sustainability 2018, 10, 2761. [Google Scholar] [CrossRef] [Green Version]
  16. Busu, M.; Trica, C.L. Sustainability of Circular Economy Indicators and Their Impact on Economic Growth of the European Union. Sustainability 2019, 11, 5481. [Google Scholar] [CrossRef] [Green Version]
  17. Vermeșan, H.; Mangău, A.; Tiuc, A.-E. Perspectives of Circular Economy in Romanian Space. Sustainability 2020, 12, 6819. [Google Scholar] [CrossRef]
  18. Dobre-Baron, O.; Nițescu, A.; Niță, D.; Mitran, C. Romania’s Perspectives on the Transition to the Circular Economy in an EU Context. Sustainability 2022, 14, 5324. [Google Scholar] [CrossRef]
  19. Dragoi, M.C.; Popescu, M.F.; Andrei, J.V.; Mieila, M. Developments of the Circular Economy in Romania under the New Sustainability Paradigm. Econ. Comput. Econ. Cybern. Stud. Res. 2018, 52, 125–138. [Google Scholar] [CrossRef]
  20. Trica, C.L.; Banacu, C.S.; Busu, M. Environmental Factors and Sustainability of the Circular Economy Model at the European Union Level. Sustainability 2019, 11, 1114. [Google Scholar] [CrossRef] [Green Version]
  21. Vuță, M.; Enciu, A.; Cioacă, S.I. Assessment of the Circular Economy’s Impact in the EU Economic Growth. Amfiteatru Econ. 2018, 20, 248–261. [Google Scholar] [CrossRef]
  22. Modoi, O.C.; Mihai, F.C. E-Waste and End-of-Life Vehicles Management and Circular Economy Initiatives in Romania. Energies 2022, 15, 1120. [Google Scholar] [CrossRef]
  23. Ghinea, C.; Gavrilescu, M. Solid Waste Management for Circular Economy: Challenges and Opportunities in Romania—The Case Study of Iasi County. Green. Ind. Netw. Stud. 2019, 6, 25–60. [Google Scholar] [CrossRef]
  24. Mihai, F.C.; Minea, I. Sustainable Alternative Routes versus Linear Economy and Resources Degradation in Eastern Romania. Sustainability 2021, 13, 10574. [Google Scholar] [CrossRef]
  25. Strat, V.A.; Teodor, C.; Săseanu, A.S. The Characterization of the Romanian Circular Economy’s Potential, at County Level. Amfiteatru Econ. 2018, 20, 278–293. [Google Scholar] [CrossRef]
  26. Albastroiu Nastase, I.; Negrutiu, C.; Felea, M.; Acatrinei, C.; Cepoi, A.; Istrate, A. Toward a Circular Economy in the Toy Industry: The Business Model of a Romanian Company. Sustainability 2022, 14, 22. [Google Scholar] [CrossRef]
  27. Gruia, R.; Florescu, G.-I.; Gaceu, L.; Oprea, O.B.; Ţane, N. Reducing Environmental Risk by Applying a Polyvalent Model of Waste Management in the Restaurant Industry. Sustainability 2021, 13, 5852. [Google Scholar] [CrossRef]
  28. Berechet, M.; Mirel, I.; Staniloiu, C.; Fischer, K. Carbon Footprint of Waste Management in Romania in the Context of Circular Economy. Environ. Eng. Manag. J. 2019, 18, 1289–1295. [Google Scholar] [CrossRef]
  29. Pintilie, N. Measuring the progress towards circular economy in European Union countries. Bus. Excell. Manag. 2021, 11, 19–35. [Google Scholar] [CrossRef]
  30. Androniceanu, A.; Kinnunen, J.; Georgescu, I. Circular economy as a strategic option to promote sustainable economic growth and effective human development. J. Int. Stud. 2021, 14, 60–73. [Google Scholar] [CrossRef]
  31. Manea, D.I.; Istudor, N.; Dinu, V.; Paraschiv, D.M. Circular Economy and Innovative Entrepreneurship, Prerequisites for Social Progress. J. Bus. Econ. Manag. 2021, 22, 1342–1359. [Google Scholar] [CrossRef]
  32. Drăgoi, A.-E. Eu Legal Framework for Circular Economy-Goals and Challenges. Euroinfo 2020, 4, 65–76. Available online: https://ideas.repec.org/a/iem/eurinf/v4y2020i3p65-76.html (accessed on 12 April 2022).
  33. Rada, E.C.; Cioca, L.I.; Ionescu, G. Energy Recovery from Municipal Solid Waste in EU: Proposals to Assess the Management Performance under a Circular Economy Perspective. In Proceedings of the 8th International Conference on Manufacturing Science and Education—Trends in New Industrial Revolution, Sibiu, Romania, 7–9 June 2017. [Google Scholar] [CrossRef] [Green Version]
  34. Giurea, R.; Precazzini, I.; Ragazzi, M.; Achim, M.I.; Cioca, L.I.; Conti, F.; Torretta, V.; Rada, E.C. Good Practices and Actions for Sustainable Municipal Solid Waste Management in the Tourist Sector. Resources 2018, 7, 51. [Google Scholar] [CrossRef] [Green Version]
  35. Lakatos, E.S.; Nan, L.M.; Bacali, L.; Ciobanu, G.; Ciobanu, A.M.; Cioca, L.I. Customer Satisfaction towards green Products: Empirical insights from Romania. Sustainability 2021, 13, 982. [Google Scholar] [CrossRef]
  36. Ghosh, S.K. Introduction to Circular Economy and Summary Analysis of Chapters. In Circular Economy: Global Perspective; Ghosh, S.K., Ed.; Springer: Singapore, 2020; pp. 1–24. [Google Scholar]
  37. Cui, M. Key Concepts and Terminology. In An Introduction to Circular Economy; Liu, L., Ramakrishna, S., Eds.; Springer: Singapore, 2020; pp. 17–34. [Google Scholar]
  38. Weetman, C.A. Circular Economy Hanndbook. How to Built a More Resilient, Competitive and Sustainable Business, 2nd ed.; Kogan Page: London, UK; New York, NY, USA; New Delhi, India, 2021. [Google Scholar]
  39. Chauhan, C.; Parida, V.; Dhir, A. Linking Circular Economy and Digitalisation Technologies: A Systematic Literature Review of Past Achievements and Future Promises. Technol. Forecast. Soc. Change 2022, 177, 121508. [Google Scholar] [CrossRef]
  40. Velenturf, A.P.M.; Purnell, P. Principles for A Sustainable Circular Economy. Sustain. Prod. Consum. 2021, 27, 1437–1457. [Google Scholar] [CrossRef]
  41. Gonçalves, B.d.S.M.; Carvalho, F.L.d.; Fiorini, P.d.C. Circular Economy and Financial Aspects: A Systematic Review of the Literature. Sustainability 2022, 14, 3023. [Google Scholar] [CrossRef]
  42. Cantú, A.; Aguiñaga, E.; Scheel, C. Learning from Failure and Success: The Challenges for Circular Economy Implementation in SMEs in an Emerging Economy. Sustainability 2021, 13, 1529. [Google Scholar] [CrossRef]
  43. Grădinaru, G.I.; Maricuț, A.C. From the Rebound Effect to the Perspective of Circular Economy: A Structure Changes Analysis Among EU Countries. Econ. Comput. Econ. Cybern. Stud. Res. 2022, 56, 257–272. [Google Scholar] [CrossRef]
  44. Al-Shboul, M.A.R.; Barber, K.D.; Garza-Reyes, J.A.; Kumar, V.; Abdi, M.R. The effect of supply chain management practices on supply chain and manufacturing firms’ performance. J. Manuf. Technol. Manag. 2017, 28, 577–609. [Google Scholar] [CrossRef]
  45. Dobre-Baron, O.; Nițescu, A. Trade Marketing—An Innovative Concept in Logistic Cooperation Between Manufacturers and Traders. Qual. Access Success J. 2019, 20, 451–456. [Google Scholar]
  46. Kazancoglu, Y.; Kazancoglu, I.; Sagnak, M. A New Holistic Conceptual Framework for Green Supply Chain Management Performance Assessment Based on Circular Economy. J. Clean. Prod. 2018, 195, 1282–1299. [Google Scholar] [CrossRef]
  47. Su, D.; Wu, Y.; Chai, Z. Advanced integrated manufacture by application of sustainable technology through product lifecycle: A circular economy approach. In Proceedings of the 2019 ACM International Conference Proceedings Series, London, UK, 19–21 September 2019; Available online: https://dl.acm.org/doi/10.1145/3358331.3358360 (accessed on 24 April 2022).
  48. Trevisan, A.H.; Zacharias, I.S.; Qinglan, L.; Miying, Y.; Janaina, M. Circular Economy and Digital Technologies: A review of the Current Research Streams. In Proceedings of the International Conference on Engineering Design, Gothenburg, Sweden, 16–20 August 2021. [Google Scholar]
  49. Rizos, V.; Behrens, A.; Van der Gaast, W.; Hofman, E.; Ioannou, A.; Kafyeke, T.; Flamos, A.; Rinaldi, R.; Papadelis, S.; Hirschnitz-Garbers, M.; et al. Implementation of Circular Economy Business Models by Small and Medium-Sized Enterprises (SMEs): Barriers and Enablers. Sustainability 2016, 8, 1212. [Google Scholar] [CrossRef] [Green Version]
  50. Lahti, T.; Wincent, J.; Parida, V. A Definition and Theoretical Review of the Circular Economy, Value Creation and Sustainable Business Models: Where are We Now and Where Should Research move in the Future? Sustainability 2018, 10, 2799. [Google Scholar] [CrossRef] [Green Version]
  51. Bressanelli, G.; Arodegari, F.; Perona, M.; Saccani, N. Exploring How Usage-Focused Business Models Enable Circular Economy through Digital Technologies. Sustainability 2018, 10, 639. [Google Scholar] [CrossRef] [Green Version]
  52. Kot, S. Sustainable Supply Chain Management in Small and Medium Enterprises. Sustainability 2018, 10, 1143. [Google Scholar] [CrossRef] [Green Version]
  53. Dura, C.; Isac, C. Using Taguchi Methods to Improve Production Process Quality: A Case Study. Total Qual. Manag. Bus. Excell. 2009, 20, 1189–1212. [Google Scholar] [CrossRef]
  54. Isac, A.; Isac, C. STEP Analysis of the Development of the Romanian Information Society. In Proceedings of the 16th International Conference Globalization and Post-Globalization Perspective—IECS 2009, Sibiu, Romania, 7–8 May 2009; pp. 91–97. [Google Scholar]
  55. Li, K.; Kim, D.J.; Lang, K.R.; Kauffman, R.J.; Naldi, M. How Should We Understand the Digital Economy in Asia? Critical Assessment and Research Agenda. Electron. Commer. Res. Appl. 2020, 44, 101004. [Google Scholar] [CrossRef] [PubMed]
  56. Piroșcă, G.I.; Șerban-Oprescu, G.L.; Badea, L.; Stanef-Puică, M.R.; Valdebenito, C.R. Digitalization and Labor Market—A Perspective within the Framework of Pandemic Crisis. J. Theor. Appl. Electron. Commer. Res. 2021, 16, 2843–2857. [Google Scholar] [CrossRef]
  57. Agrawal, R.; Wankhede, V.A.; Kumar, A.; Upadhyay, A.; Garza-Reyes, J.A. Nexus of circular economy and sustainable performance in the era of digitalization. Int. J. Product. Perform. Manag. 2021, 71, 748–774. [Google Scholar] [CrossRef]
  58. Del Rio, P.; Kiefer, C.P.; Carrillo-Hermosilla, J.; Könöllä. The Circular Economy. Economic, Managerial and Policy Implications; Springer: Cham, Switzerland, 2021. [Google Scholar]
  59. Antikanien, M.; Usitalo, T.; Kivikyotö-Reponen, P. Digitalisation as an Enabler of Circular Economy. In Proceedings of the 10th CIRP Conference on Industrial-Product Service Systems, Linköping, Sweden, 29–31 May 2018. [Google Scholar]
  60. Pagoropoulos, A.; Pigosso, D.C.A.; MCAloone, T.C. The Emergent Role of Digital Technologies in the Circular Economy: A Review. Procedia CIRP 2017, 64, 19–24. [Google Scholar] [CrossRef] [Green Version]
  61. Paștiu, C.A.; Oncioiu, I.; Gârdan, D.A.; Maican, S.Ș.; Gârdan, I.P.; Muntean, A.C. The Perspective of E-Business Sustainability and Website Accessibility of Online Stores. Sustainability 2020, 12, 9780. [Google Scholar] [CrossRef]
  62. Ionescu, C.A.; Fülöp, M.T.; Topor, D.I.; Căpușneanu, S.; Breaz, T.O.; Stănescu, S.G.; Coman, M.D. The New Era of Business Digitization through the Implementation of 5G Technology in Romania. Sustainability 2021, 13, 13401. [Google Scholar] [CrossRef]
  63. Galleta, A.; Carnevale, L.; Celesti, A.; Fazio, M.; Villari, M. A Cloud-Based System for Improving Retention Marketing Loyalty Programs in Industry 4.0: A Study on Big Data Storage Implications. IEEE Access 2018, 6, 5485–5492. [Google Scholar] [CrossRef]
  64. Nițescu, A.; Dobre-Baron, O. Theoretical Delimitations Regarding the Management of Start-Up Business. Qual. Access Success J. 2017, 18, 354–357. [Google Scholar]
  65. Fogarassy, C.; Finger, D. Theoretical and practical approaches of circular economy for business models and technological solutions. Resources 2020, 9, 76. [Google Scholar] [CrossRef]
  66. Kotler, P.; Kartajaya, H.; Setiawan, I. Marketing 4.0: Moving from Traditional to Digital; John Wiley & Sons, Inc.: Hoboken, NJ, USA, 2016. [Google Scholar] [CrossRef]
  67. Dash, G.; Kiefer, K.; Paul, J. Marketing-to-Millennials: Marketing 4.0, Customer Satisfaction and Purchase Intention. J. Bus. Res. 2021, 122, 608–620. [Google Scholar] [CrossRef]
  68. Iuga, I.; Danciu, A.; Drigă, I. The Profile of the Foreign Investor in the Romanian Chemical Industry. Processes 2020, 8, 348. [Google Scholar] [CrossRef] [Green Version]
  69. Xu, L.D.; Xu, E.L.; Li, L. Industry 4.0: State of the Art and Future Trends. Int. J. Prod. Res. 2018, 56, 2941–2962. [Google Scholar] [CrossRef] [Green Version]
  70. Jara, A.J.; Parra, M.C.; Skarmeta, A.F. Marketing 4.0: A New Value Added to the Marketing through the Internet of Things. In Proceedings of the IEEE International Conference on Innovative Mobile and Internet Services in Ubiquitous Computing, Palermo, Italy, 4–6 July 2012. [Google Scholar] [CrossRef]
  71. Gilal, F.G.; Zhang, J.; Paul, J.; Gilal, N.G. The Role of Self Determination Theory in Marketing Science: An Integrative Review and Agenda for Research. Eur. Manag. J. 2019, 37, 29–44. [Google Scholar] [CrossRef]
  72. Radu, L.D. Green Cloud Computing: A Literature Survey. Symmetry 2017, 9, 295. [Google Scholar] [CrossRef] [Green Version]
  73. Penz, E.; Polsa, P. How do companies reduce their carbon footprint and how do they communicate these measures to stakeholders? J. Clean. Prod. 2018, 195, 1125–1138. [Google Scholar] [CrossRef]
  74. Cappiello, C.; Melià, P.; Plebani, P. Modeling CO2 Emissions to Reduce the Environmental Impact of Cloud Applications. In Lecture Notes in Business Information Processing. Proceedings of the International Conference on Advanced Information Systems Engineering, Ljubljana, Slovenia, 13–17 June 2016; Krogstie, J., Mouratidis, H., Su, J., Eds.; Springer: Cham, Switzerland, 2016; pp. 155–166. [Google Scholar]
  75. Roy, S.; Gupta, S. The Green Cloud Effective Framework: An Environment Friendly Approach Reducing CO2 Level. In Proceedings of the 1st International Conference on Non-Conventional Energy, Kalyani, India, 16–17 January 2014; IEEE: New York, NY, USA, 2014; pp. 233–236. [Google Scholar]
  76. Williams, D.R.; Thomond, P.; Mackenzie, I. The Greenhouse Gas Abatement Potential of Enterprise Cloud Computing. Environ. Model. Softw. 2014, 56, 6–12. [Google Scholar] [CrossRef]
  77. Costa, J.; Castro, R. SMEs Must Go OnLine—E-Commerce as an Escape Hatch for Resilience and Survivability. J. Theor. Appl. Electron. Commer. Res. 2021, 16, 3043–3062. [Google Scholar] [CrossRef]
  78. Aswal, M.S. A Comparative Study of Resource Allocation Strategies for a Green Cloud. In Proceedings of the International Conference on Next Generation Computing Technologies (NGCT), Dehradun, India, 14–16 October 2016; IEEE: New York, NY, USA, 2016; pp. 621–625. [Google Scholar]
  79. Reddy, S.P.; Chandan, H.K.S. Energy Aware Scheduling of Real-Time and Non Real-Time Tasks on Cloud Processors (Green Cloud Computing). In Proceedings of the International Conference on Information Communication and Embedded Systems, Chennai, India, 27–28 February 2015; IEEE: New York, NY, USA, 2015; pp. 1–5. [Google Scholar]
  80. Okewu, E.; Misra, S.; Maskeliunas, R.; Damaševičius, R.; Fernandez-Sanz, L. Optimizing Green Computing Awareness for Environmental Sustainability and Economic Security as a Sochastic Optimization Problem. Sustainability 2017, 9, 1857. [Google Scholar] [CrossRef] [Green Version]
  81. Tarigan, Z.J.H.; Siagian, H.; Jie, F. Impact of Enhanced Enterprise Resource Planning (ERP) on Firm Performance through Green Supply Chain Management. Sustainability 2021, 13, 4358. [Google Scholar] [CrossRef]
  82. Khann, U.; Asim, M.; Manzoor, S. Improving Supply Chain Management of a Distribution Firm Using ERP System. Eur. J. Bus. Manag. Res. 2020, 5. Available online: https://www.ejbmr.org/index.php/ejbmr/article/view/248/138 (accessed on 25 April 2022).
  83. DaSilva, C.; Trkman, P.; Desouza, K.; Lindič, J. Disruptive Technologies: A Business Model Perspective on Cloud Computing. Technol. Anal. Strateg. Manag. 2013, 25, 1161–1173. [Google Scholar] [CrossRef]
  84. Gupta, S.; Kumar, S.; Kumar Singh, S.; Foropon, S.; Chandra, C. Role of Cloud ERP on the Performance of an Organization. Contingent Resource-Based View Perspective. Int. J. Logist. Manag. 2018, 29, 659–675. [Google Scholar] [CrossRef]
  85. Lin, Y.; Yu-Wu, L. Exploring the Role of Dynamic Capabilities in Firm Performance under the Resource Based View Framework. J. Bus. Res. 2014, 67, 407–413. [Google Scholar] [CrossRef]
  86. Mocanu, C.; Militaru, E.; Zamfir, A.M.; Maer-Matei, M.M. Circular Economy and Financial Performances of European SMEs. In Circular Economy and Sustainability. Management and Policy; Stefanakis, A., Nikolaou, I., Eds.; Elsevier: Amsterdam, The Netherland, 2022; Volume 1, pp. 71–86. [Google Scholar]
  87. Aranda-Usón, A.; Portillo-Tarragona, P.; Marín-Vinuesa, L.; Scarpellini, S. Financial Resources for the Circular Economy: A Perspective from Businesses. Sustainability 2019, 11, 888. [Google Scholar] [CrossRef] [Green Version]
  88. Zamfir, A.M.; Mocanu, C.; Grigorescu, A. Circular Economy and Decision Models Among European SMEs. Sustainability 2017, 9, 1507. [Google Scholar] [CrossRef] [Green Version]
  89. Sassanelli, C.; Rosa, P.; Rocca, T.; Terzi, S. Circular Economy Performance Assessment Methods: A Systematic Literature Review. J. Clean. Prod. 2019, 229, 440–453. [Google Scholar] [CrossRef]
  90. Digital Economy and Society Index. 2021. Available online: https://digital-strategy.ec.europa.eu/en/policies/countries-digitisation-performance (accessed on 15 December 2021).
  91. 2021–2027 Territorial Plan for just Transition in Hunedoara County. Available online: https://www.cjhunedoara.ro (accessed on 17 December 2021).
  92. Analysis of Digitization Demands at the Level of Enterprises Originating from the West Region. Available online: https://adrvest.ro (accessed on 17 December 2021).
  93. Cașotă, F. Digitalization Has Reduced the Negative Impact of the COVID-19 pandemic on SMEs, Start-Up. 2020. Available online: https://start-up.ro/digitalizarea-a-micsorat-impactul-negativ-al-pandemiei-covid-19-asupra-imm-urilor/ (accessed on 22 April 2022).
  94. Obrad, C. Advanced Data Analysis in Social Sciences (Analiza Avansată a Datelor în Științele Sociale); ProUniversitaria: Bucharest, Romania, 2021. [Google Scholar]
  95. Ajay, S.S.; Micah, B.M. Sampling Techniques & Determination of Sample Size in Applied Statistic Research: An Overview. Int. J. Econ. Commer. Manag. 2014, II, 1–22. [Google Scholar]
  96. Tatu, C.I. Analiza Datelor de Marketing (Marketing Data Analysis); Economic Bucharest University Publishing House: Bucharest, Romania, 2018. [Google Scholar]
  97. Saraçli, S.; Doğan, N.; Doğan, İ. Comparison of hierarchical cluster analysis methods by cophenetic correlation. J. Inequal. Appl. 2013, 2013, 203. [Google Scholar] [CrossRef]
  98. Wen, J.; Fang, X.; Cui, J.; Fei, L.; Yan, K.; Chen, Y.; Xu, Y. Robust Sparse Linear Discriminant Analysis. IEEE Trans. Circuits Syst. Video Technol. 2019, 29, 390–403. [Google Scholar] [CrossRef]
  99. Kovacs, J.; Kovacs, S.; Magyar, N.; Tanos, P.; Hatvani, I.G.; Anda, A. Classification into homogenous groups using combined and discriminant analysis. Environ. Model. Softw. 2014, 57, 52–59. [Google Scholar] [CrossRef]
  100. Li, L.; Doroslovački, M.; Loew, M.H. Discriminant Analysis Deep Neural Networks. In Proceedings of the 53rd Annual Conference on Information Sciences and Systems (CISS), Baltimore, MD, USA, 20–22 March 2019; pp. 1–6. [Google Scholar] [CrossRef]
  101. Gabor, R. Analiza Și Inferența Statistică a Datelor de Marketing (Analysis and Statistical Inference of Marketing Data); C.H. Beck Publishing House: Bucharest, Romania, 2016; pp. 57–73. [Google Scholar]
  102. Dinu, P.; Dinu, L. Using Internet as a Solution for Sales in Pandemic Crisis: E-Commerce. In Proceedings of the 31st DAAAM International Symposium, Mostar, Bosnia and Herzegovina, 21–24 October 2020; Katalinic, B., Ed.; DAAAM International: Vienna, Austria, 2020. [Google Scholar] [CrossRef]
  103. Apurva, P.; Sharareh, K. Impact of COVID-19 on Field and Office Workforce in Construction Industry. Proj. Leadersh. Soc. 2021, 2, 1235–1241. [Google Scholar] [CrossRef]
  104. Cotula, L. Towards a Political Economy of the COVID-19 crisis: Reflections on an Agenda for Research and Action. World Development. 2021, 138, 105235. [Google Scholar] [CrossRef]
  105. Priyono, A.; Moin, A.; Aini Oktaviani Putri, V.N. Identifying Digital Transformation Paths in the Business Model of SMEs during the COVID-19 Pandemic. J. Open Innov. Technol. Mark. Complex. 2020, 6, 104. [Google Scholar] [CrossRef]
  106. Financial Stability Report. National Bank of Romania. June 2020, Year V, No. 9. Available online: https://www.bnr.ro/ (accessed on 5 January 2022).
  107. Khatibi, S.; Nour, A.-N.I. The Impact of Corporate Governance on Firm Performance During the COVID19 Pandemic: Evidence from Malaysia. J. Asian Financ. Econ. Bus. 2021, 8, 943–952. [Google Scholar] [CrossRef]
  108. Hussain, S.; Nguyen, V.C.; Nguyen, Q.M.; Nguyen, H.T.; Nguyen, T.T. Macroeconomic Factors, Working Capital Management and Firm Performance—A Static and Dynamic Panel Analysis. Humanit. Soc. Sci. Commun. 2021, 8, 123. [Google Scholar] [CrossRef]
  109. Didier, T.; Huneeus, F.; Larrain, M.; Schmukler, S. Financing Firms in Hibernation During the COVID-19 Pandemic. J. Financ. Stab. 2021, 53, 100837. [Google Scholar] [CrossRef]
  110. Taiminen, H.M.; Karjaluoto, H. The Usage of Digital Marketing Channels in SMEs. J. Small Bus. Enterp. Dev. 2015, 22, 633–651. [Google Scholar] [CrossRef]
  111. Mário, F. Networking as a Marketing Tool in Small Companies: A Random and Informal Approach. J. Bus. Strategy 2018, 39, 47–55. [Google Scholar]
  112. Dobre, C.; Milovan, A.M.; Duțu, C.; Preda, G.; Agapie, A. The Common Values of Social Media Marketing and Luxury Brands. The Millennials and Generation Z Perspective. J. Theor. Appl. Electron. Commer. Res. 2021, 16, 2532–2553. [Google Scholar] [CrossRef]
  113. Dumitriu, D.; Militaru, G.; Deselnicu, D.C.; Niculescu, A.; Popescu, M.A.M. A Perspective over Modern SMEs: Managing Brand Equity, Growth and Sustainability through Digital Marketing Tools and Techniques. Sustainability 2019, 11, 2111. [Google Scholar] [CrossRef] [Green Version]
  114. Franco, M.; Haase, H.; Pereira, A. Empirical Study about The Role of Social Networks in SME Performance. J. Syst. Inf. Technol. 2016, 18, 383–403. [Google Scholar] [CrossRef]
  115. Gómez-Llanez, C.Y.; Diaz-Leal, N.R.; Angarita-Sanguino, C.R. A Comparative Analysis of The ERP Tools, ODOO and Openbravo for Business Management. Aibi Rev. DeInvestig. Adm. E Ing. 2020, 8, 145–153. [Google Scholar] [CrossRef]
  116. Johansson, B.; Alajbegovic, A.; Alexopoulo, V.; Desalermos, A. Cloud ERP Adoption Opportunities and Concerns: The Role of Organizational Size. In Proceedings of the 2015 48th Hawaii International Conference on System Sciences, Kauai, HI, USA, 5–8 January 2015; Available online: https://lucris.lub.lu.se/ws/portalfiles/portal/1490283/7991296.pdf (accessed on 25 April 2022).
  117. Al-Saleem, S.M. A Comparative Analysis and Evaluation of Open Source ERP Systems. Int. J. Comput. Sci. Netw. Secur. 2017, 13, 24–28. [Google Scholar]
  118. Rosati, P.; Lynn, T. Measuring the Business Value of Infrastructure Migration to the Cloud. In Measuring the Business Value of Cloud Computing; Lynn, T., Mooney, J.G., Rosati, P., Fox, G., Eds.; Plagrave Studies in Business and Enabling Technologies: Cham, Switzerland, 2020; pp. 19–38. [Google Scholar]
  119. Wu, J.Y.; Chen, L.T. Odoo ERP Business Intelligence Tool for a Small Medium Enterprise: A Scenario Case Study. In Proceedings of the 11th International Conference on e-Education, e-Business, e-Management and e-Learning, Osaka, Japan, 10–12 January 2020. [Google Scholar] [CrossRef]
  120. Khan, S. Cloud Computing: Issues and Risks of Embracing the Cloud in a Business Environment. Int. J. Educ. Manag. Eng. 2019, 4, 44–56. [Google Scholar] [CrossRef]
  121. Çankaya, S.I.; Sezen, B. Effects of Green Supply Management Practices on Sustainability Performance. J. Manuf. Technol. Manag. 2019, 30, 98–121. [Google Scholar] [CrossRef]
  122. Dura, C.; Drigă, I. The Impact of Multinational Companies from Romania on Increasing the Level of Corporate Social Responsibility Awareness. Contemp. Econ. 2017, 11, 45–66. [Google Scholar] [CrossRef] [Green Version]
Figure 1. Increasing sustainable performance from the circular business models’standpoint.
Sustainability 14 05567 g001
Figure 2. The impact of cloud computing upon CE practices.
Sustainability 14 05567 g002
Figure 3. The research design.
Sustainability 14 05567 g003
Figure 4. Dendrogram resulting from the SAS Enterprise Guide.
Sustainability 14 05567 g004
Figure 5. Affiliation chart for the first class of companies from the analyzed sample. (a) The probability associated to a company to be integrated in class 1; (b) The probability associated to a company not to be integrated in class 1.
Sustainability 14 05567 g005
Figure 6. Affiliation chart for the second class of companies from the analyzed sample (a) The probability associated to a company to be integrated in class 2; (b) The probability associated to a company not to be integrated in class 2.
Sustainability 14 05567 g006
Figure 7. Affiliation chart for the third class of the companies from the analyzed sample. (a) The probability associated to a company to be integrated in class 3; (b) The probability associated to a company not to be integrated in class 3.
Sustainability 14 05567 g007
Figure 8. Modules selected from Cloud Odoo ERP for Marini Trans SRL to improve performance indicators.
Sustainability 14 05567 g008
Figure 9. Sales opportunities in ODOO ERP.
Sustainability 14 05567 g009
Figure 10. List of the opportunities and activities administered in Odoo CRM at a certain moment.
Sustainability 14 05567 g010
Figure 11. Examples of reports created by the CRM module. (a) Tabular Report; (b) Graphical Report.
Sustainability 14 05567 g011aSustainability 14 05567 g011b
Table 1. Assessment of input variables.
No.CodeProfitability RatiosFormula
1V1ROA—Return on AssetsGross profit/Total assets × 100
2V2ROE1—Return on EquityNet profit/Shareholders’ Equity × 100
3V3ROS—Return on SalesNet profit/Sales × 100
4V4LEV—Total Liabilities RatioTotal Debts/Total Assets × 100
5V5ARR—Accounts Receivables RatioTrade Receivables/Total Assets × 100
6V6GMR—Gross Profit MarginGross profit/Turnover × 100
7V7ROE2—Return on ExpendituresNet profit/Expenditures × 100
8V8CAR—Current Assets RatioInventory/Total Assets × 100
9V9ASFR—Assets Self-Financing RatioEquity/Total Assets × 100
Table 2. Descriptive statistics of the data series.
VariableMeanStandard DeviationSkewnessKurtosisBimodality
V120.628826.04533.154412.21750.7087
V239.645041.41361.64652.87570.6075
V311.770212.61821.69642.16050.7190
V451.882628.1063−0.2455−0.96780.4861
V522.938624.02961.16210.48610.6321
V612.756712.95521.64771.98470.7120
V715.269022.19502.58636.58720.7830
V875.562924.2410−1.26641.22430.5842
V948.117428.10630.2455−0.96780.4681
Table 3. The eigenvalues of the covariance matrix.
EigenvalueDifferenceProportionCumulative
12437.75594.920.40910.4091
21842.821187.950.30930.7184
3654.87130.180.10990.8284
4524.68139.220.08810.9164
5385.47286.660.06470.9811
698.8186.740.01660.9977
712.0710.440.00200.9997
81.631.630.0003100
90 0100
Table 4. MANOVA statistics.
StatisticsClass 1Class 2Class 3
Wilks’ Lambda0.54650.62100.6593
Pillai’s Trace0.45350.37890.3407
Hottelling–Lawley Trace0.82990.61020.5168
Roy’s Greatest Root0.82990.61020.5168
Hottelling–Lawley Trace0.82990.61020.5168
Table 5. Means of the values of the analyzed indicators in each group.
V1V2V3V4V5V6V7V8V9
Class 136.14102.648.0590.3826.089.5229.8490.689.62
Class 25.520.981.8881.7334.563.143.6567.418.27
Class 312.5620.70.7844.0112.89−15.1531.476.7155.99
Table 6. Mean values of indicators for each group.
V1V2V3V4V5V6V7V8V9
Class 136.14102.648.0590.3826.089.5229.8490.689.62
Marini Trans SRL4.0822.052.1584.0740.992.502.2083.5715.93
Table 7. Main modules selected from ODOO ERP according to the main objectives pursued by our business scenario.
O1O2O3
Targeted ObjectivesDecreasing inventoriesIncreasing salesOptimizing resources consumption
Selected
Modules
Costumer Relationship MarketingSocial Marketing
SMS Marketing
Email Marketing
Marketing automation
Accounting
Table 8. Main CE-related variables proposed for assessing the future performance of Marini Trans SRL in the aftermath of implementing the cloud computing solution.
DimensionVariables
Environmental
Performance
Reduction in e-waste
Reduction in CO2 emissions
Reduction in energy consumption
Economic PerformanceSales growth
Profitability ratios
Reduction in operational costs
Social PerformanceImproved awareness of environmental protection issues
Improvements in investments in corporate social responsibility programs
Improvements in investments in employee training and education
Improvements in participation in environmental projects
Publisher’s Note: MDPI stays neutral with regard to jurisdictional claims in published maps and institutional affiliations.

