1. Introduction
Transport has long been considered a concern for rural residents around the world, under the topic of rural transport [
1], rural mobility [
2], rural accessibility [
3], etc. Researchers have found that transport, especially public transport, strongly influences the economy and livability of a region. In the U.S., the American Public Transportation Association reported that transport services are seriously lacking in many rural areas, which is a key concern for rural residents’ well-being [
4]. In New Zealand, the Public Transport 2045 study was commissioned, finding that public transport services are important in any scenario, including rural transport, and will need to become more flexible, more frequent, and more responsive to travelers’ needs [
5]. In Cambodia, Lao’s Republic, and the Philippines, transport needs of rural people are associated with basic needs such as water, food, and firewood, social welfare aspects of rural life such as health and education, and with economic aspects of rural life such as agriculture, livestock, and home industries [
6]. This paper focuses on rural express logistics, which is one of the topics under rural transport, aiming at expanding express service coverage while considering plan feasibility.
Rural e-commerce turns out to be a new economic growth point in China. Rural online retail sales reached CNY 2.05 million in 2021, with an increase of 11.3% over the previous year, and is more than twice as much as that of 2016. The rapid growth of rural e-commerce is supported by an express network, which is promoted by the government as a kind of “new infrastructure”. According to the government plan, the rural express service network should reach all administrative villages by 2025, and it is suggested that logistic centers are built in every town.
Although rural e-commerce has made great progress in China, the last-mile delivery has become an obstacle and bottleneck of rural ecommerce and economic development. One of the key problems in enhancing last-mile express delivery service in rural areas is how to properly place logistics centers, which carry out logistics activities (e.g., transportation, forwarding, distribution of goods, etc.). Compared with urban areas, the rural areas have a relatively low population scattered in a wide area, which significantly increases last-mile logistics costs. Most rural areas, especially in West China such as Tibet, suffer from great challenges in operating rural logistic centers. Some rural logistic centers used to charge extra high fees for delivery but stopped doing so under the pressure of superior local departments. As a result, most end-to-end logistic enterprises stop at counties or towns, providing no service for villagers. These problems lead to a low service level of last-mile delivery, as well as reduction in rural e-commerce users’ enthusiasm.
In this study, we propose an integrated method for locating rural express logistic centers, aiming to form an express network with wide coverage, and assure that the centers make profits. Specifically, the Holt–Winters model is used for predicting logistic demand. The predicted demand is allocated to each town according to population, gross regional product, and some other indicators. A maximal converging model is applied to select the locations of logistics centers under different service radius and number of centers. Revenue evaluation is then conducted for the sited logistic centers to estimate their future operating conditions, based on predicted logistic demand. The proposed method is illustrated in the rural area of Lhasa (capital of Tibet) as an example, and policy recommendations are also given for the improvement of rural logistic services.
2. Literature Review
2.1. Rural Logistics
Existing research on rural logistics mostly stays at the qualitative level, putting forward general suggestions and introducing new logistic modes. Brovarone and Cotella proposed a multitiered policy system, recommending demand responsive services [
7]. Fu and Li proposed to guide rural residents to change their transaction patterns and consumption habits [
8]. Jin called for the integration of joint distribution resources [
9]. Wang and Chen emphasized the influence of resident factors on urban–rural distribution [
10]. Li suggested that run-resistant vehicles should be used to improve service [
11].
As for rural e-commerce logistics, Song suggested adopting the joint distribution mode, setting up rural e-commerce logistic centers [
12]. Jin proposed to adopt the “X + 1” rural e-commerce business model [
9]. Wang and Chen suggested the establishment of a rural logistics distribution alliance to build branches [
10]. Xie and Zhou introduced an agreement between Chongqing government and Cainiao to build rural logistics network and to achieve coverage goals [
13]. Joint distribution and crowdsourcing are recommended to improve service levels.
In recent years, researchers began to use the cost optimization model to study rural logistics and explore issues such as route design and distribution mode. Ren and Shi applied the milkrun model in urban–rural distribution route design [
14]. Jiang established an optimization model to pursue the lowest total system cost (including customer time penalty cost) for joint distribution center locating and vehicle routing [
15]. Liu designed three codistribution modes for distribution enterprises, recommending alliance operation mode, and gave a route calculation method for cargo mixed vehicles considering customer satisfaction [
16]. Xiahou constructed a multiobjective and multicenter vehicle routing optimization model [
17]. Wang and Zhou proposed an optimization strategy of multicenter joint distribution alliance based on vehicle sharing [
18].
2.2. Facility Location Problems
Proper placement of rural logistic facilities plays an important role in improving distribution efficiency and lowering cost, which in general falls into the facility location problem. The facility location problem is a widely discussed topic in transportation and logistics [
19,
20] and involves the selection of specific locations of [
21,
22,
23]: warehouses, distribution centers, transportation hubs, passenger and cargo terminals, etc.
The location problem is one of the classical problems in operational research and has been extensively studied in the literature [
24]. Study of the location problem began in 1909, when Alfred Weber described a 1-median problem (the famous Weber problem) in Euclidean space in order to decide how to locate a single warehouse [
25]. So far, three basic types of location problems have been put forward, including the P-median problem (PMP), P-center problem (PCP), and covering problem (CP).
- (1)
PMP is a “MinSum” problem, which aims to select P facilities from a given set to serve all demand points while minimizing the total weighted distance from demand points to their nearest facilities [
26]. PMP is proven to be a NP-hard problem [
27]. Both heuristic and optimal algorithms are provided [
28]. PMP is still a research hotspot, with various extensions studied by modern researchers, including capacitated PMP [
29], simplified PMP [
30], and uncertain PMP [
31].
- (2)
PCP is a “MinMax” problem, which aims to select P facilities from a given set to serve all demand points while minimizing the maximal distance from any demand point to its nearest facility [
26]. PCP is proven a NP-hard problem as well, with heuristic and optimal algorithms provided [
32].
- (3)
CP, including set covering problem (SCP) and maximal covering problem (MCP), introduces the constraint of service radius, which means a facility cannot serve a demand point beyond a given distance. First raised by Toregas, SCP is a “Min” problem, aiming to serve all demand points with as few facilities as possible [
33]. MCP is a “Max” problem, aiming to serve as many demand points as possible with a given number of facilities, and was first proposed by Church and ReVelle [
34]. The problem is further discussed by Daskin, Hogan, Berman, Krass, and many other researchers [
35,
36,
37].
In recent years, the maximal covering problem (MCP) and maximal covering model (MCM) have been widely applied in describing and solving location problems. Yu proposed the capacitated reliable fixed-charge location problem and provided solving algorithms [
24]. Tian used the flow capture location model to solve the charging pile point layout problem, which is essentially a flow-based maximal covering problem [
38]. Li, Sylvia, and Xue also took advantage of MCM [
11,
39,
40].
- (4)
In addition to the above methods, a number of other locating methods have emerged in recent studies, considering facility capacity, road capacity, dynamic decision process, competitive situation, and many other factors. Kulakova described a locating model based on geographic coordinates [
41]. Muravev used the Dematel–Marica method and applied the multicriteria decision model to locate China Railway Express International Logistics Centers [
42]. Stienen developed a single deterministic optimization model for locating disaster relief warehouses [
43]. Rabe combined the system dynamics simulation model with the multicycle capacity-limited facility locating problem to locate automated parcel lockers [
44].
2.3. Literature Summary
In general, existing studies on rural logistics are mostly conducted qualitatively. Most studies focus on policy suggestions on the development of rural e-commerce, while geographic, economic, and population data are not exploited enough. Although some issues such as route design and rural e-commerce are getting attention, there are still very few studies on site selection of rural logistic centers. Much uncertainty still exists about balancing the coverage rates with the operational cost when evaluating the optimal locations for logistic centers in remote rural areas with low population density. Quantitative methods are urgently needed for solving the logistic center locating problem, especially in areas at the early stages of building a rural logistic network.
Among the abovementioned facility location models, MCM fits our problem best, for the service radius and facility numbers are restricted in rural express planning, and we aim to serve as many villages as possible according to the government request.
3. Study Area and Data
A rural area of Lhasa is chosen as the study area. As one of the least developed and sparsely populated regions in China, Lhasa started constructing a rural express network relatively slow. In 2021, most of the villages only had access to basic post services, while local government and commercial express brands were planning to expand the express service network. That made Lhasa a suitable case for this study.
As the political, religious, and economic heart of the Tibetan world, Lhasa serves as the capital of the Tibet Autonomous Region in China. It is located in the Tibetan high plateau in West China, with the dominant peaks surrounding Lhasa ranging between 4400 m and 5300 m above sea level. Lhasa has a population of over 400,000. At present, several express delivery companies have set up distribution centers in downtown Lhasa, but the logistics service system is generally not deep into villages in rural areas. Basic statistics of Lhasa including populational, economical, and geographical data used in this study were obtained from governmental reports [
45].
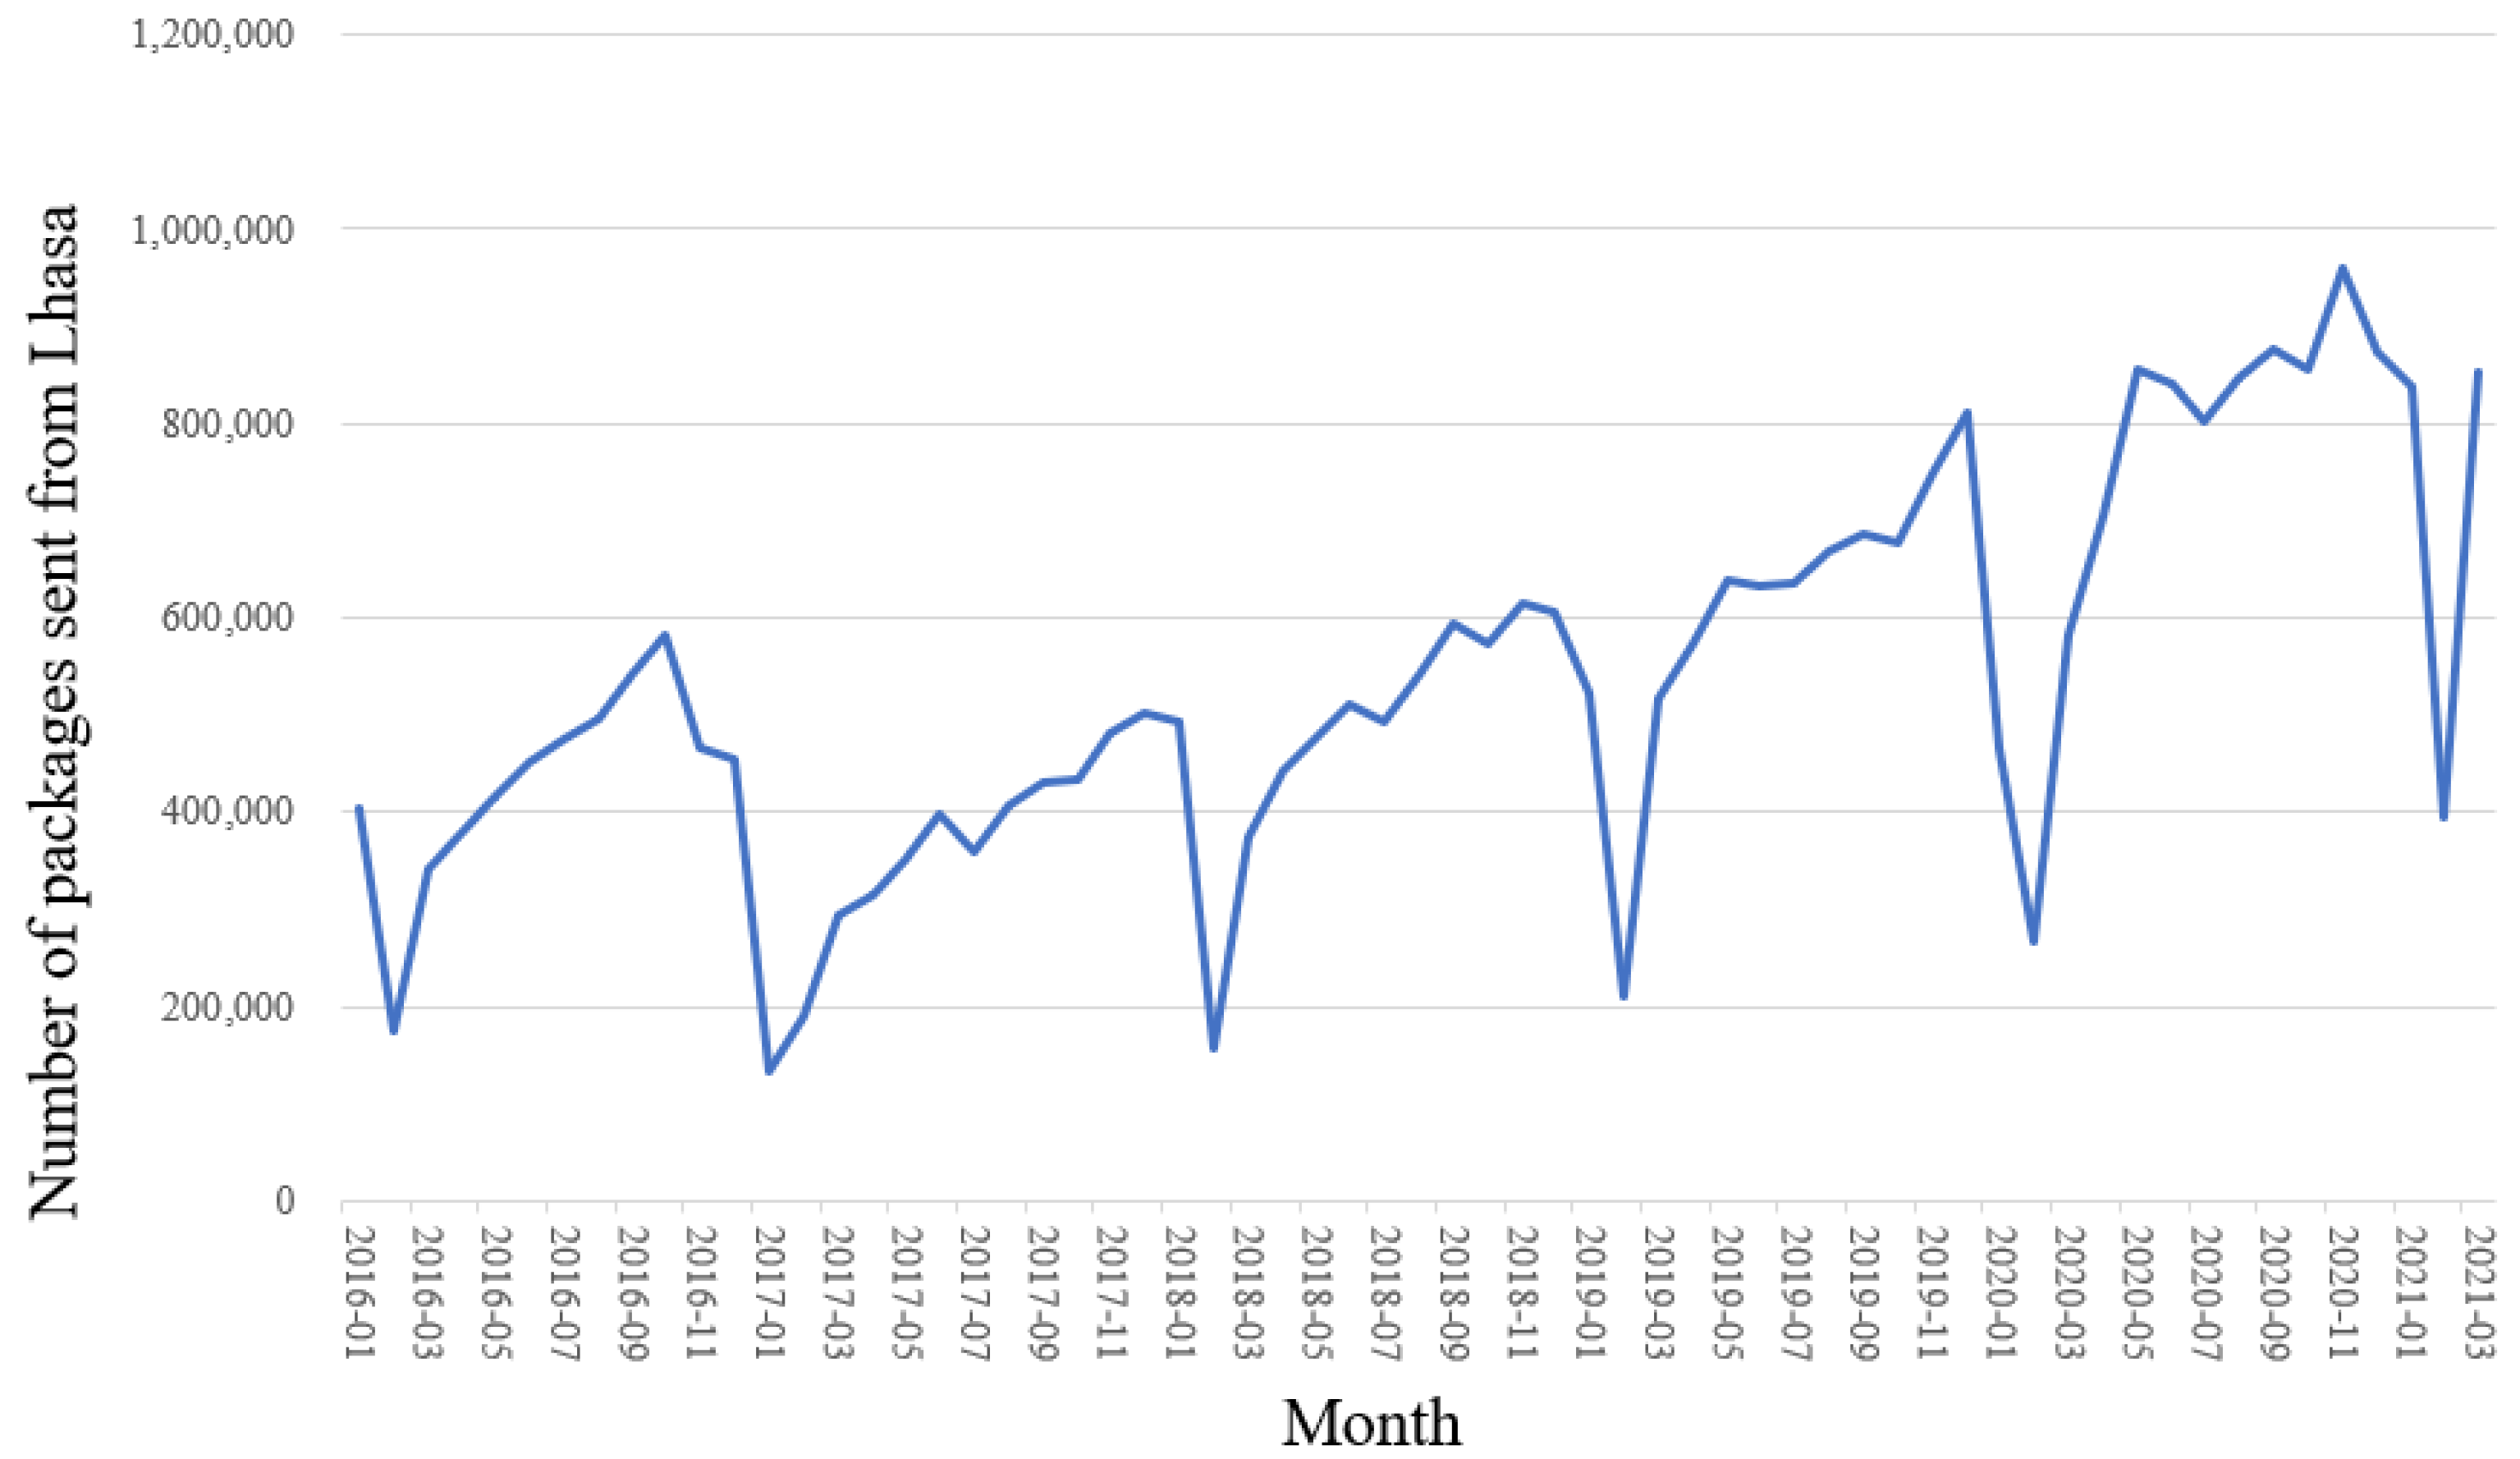
The monthly number of packages sent out from Lhasa, including both urban and rural areas, was queried from the Lasa Municipal Postal Administration [
46] since January 2016, as shown in
Figure 1. During the 63 months, the minimum value was 132,900 packages in February 2016, and the maximum value was 959,800 packages in November 2020. Additionally, the average value was 534,500 packages. It can be seen that the number of sent packages has an obvious seasonal variation pattern, with a trough around February and a peak around November. Overall, the number of packages sent out from Lhasa is growing year by year. In 2020, the number was over 8 million packages.
4. Methods
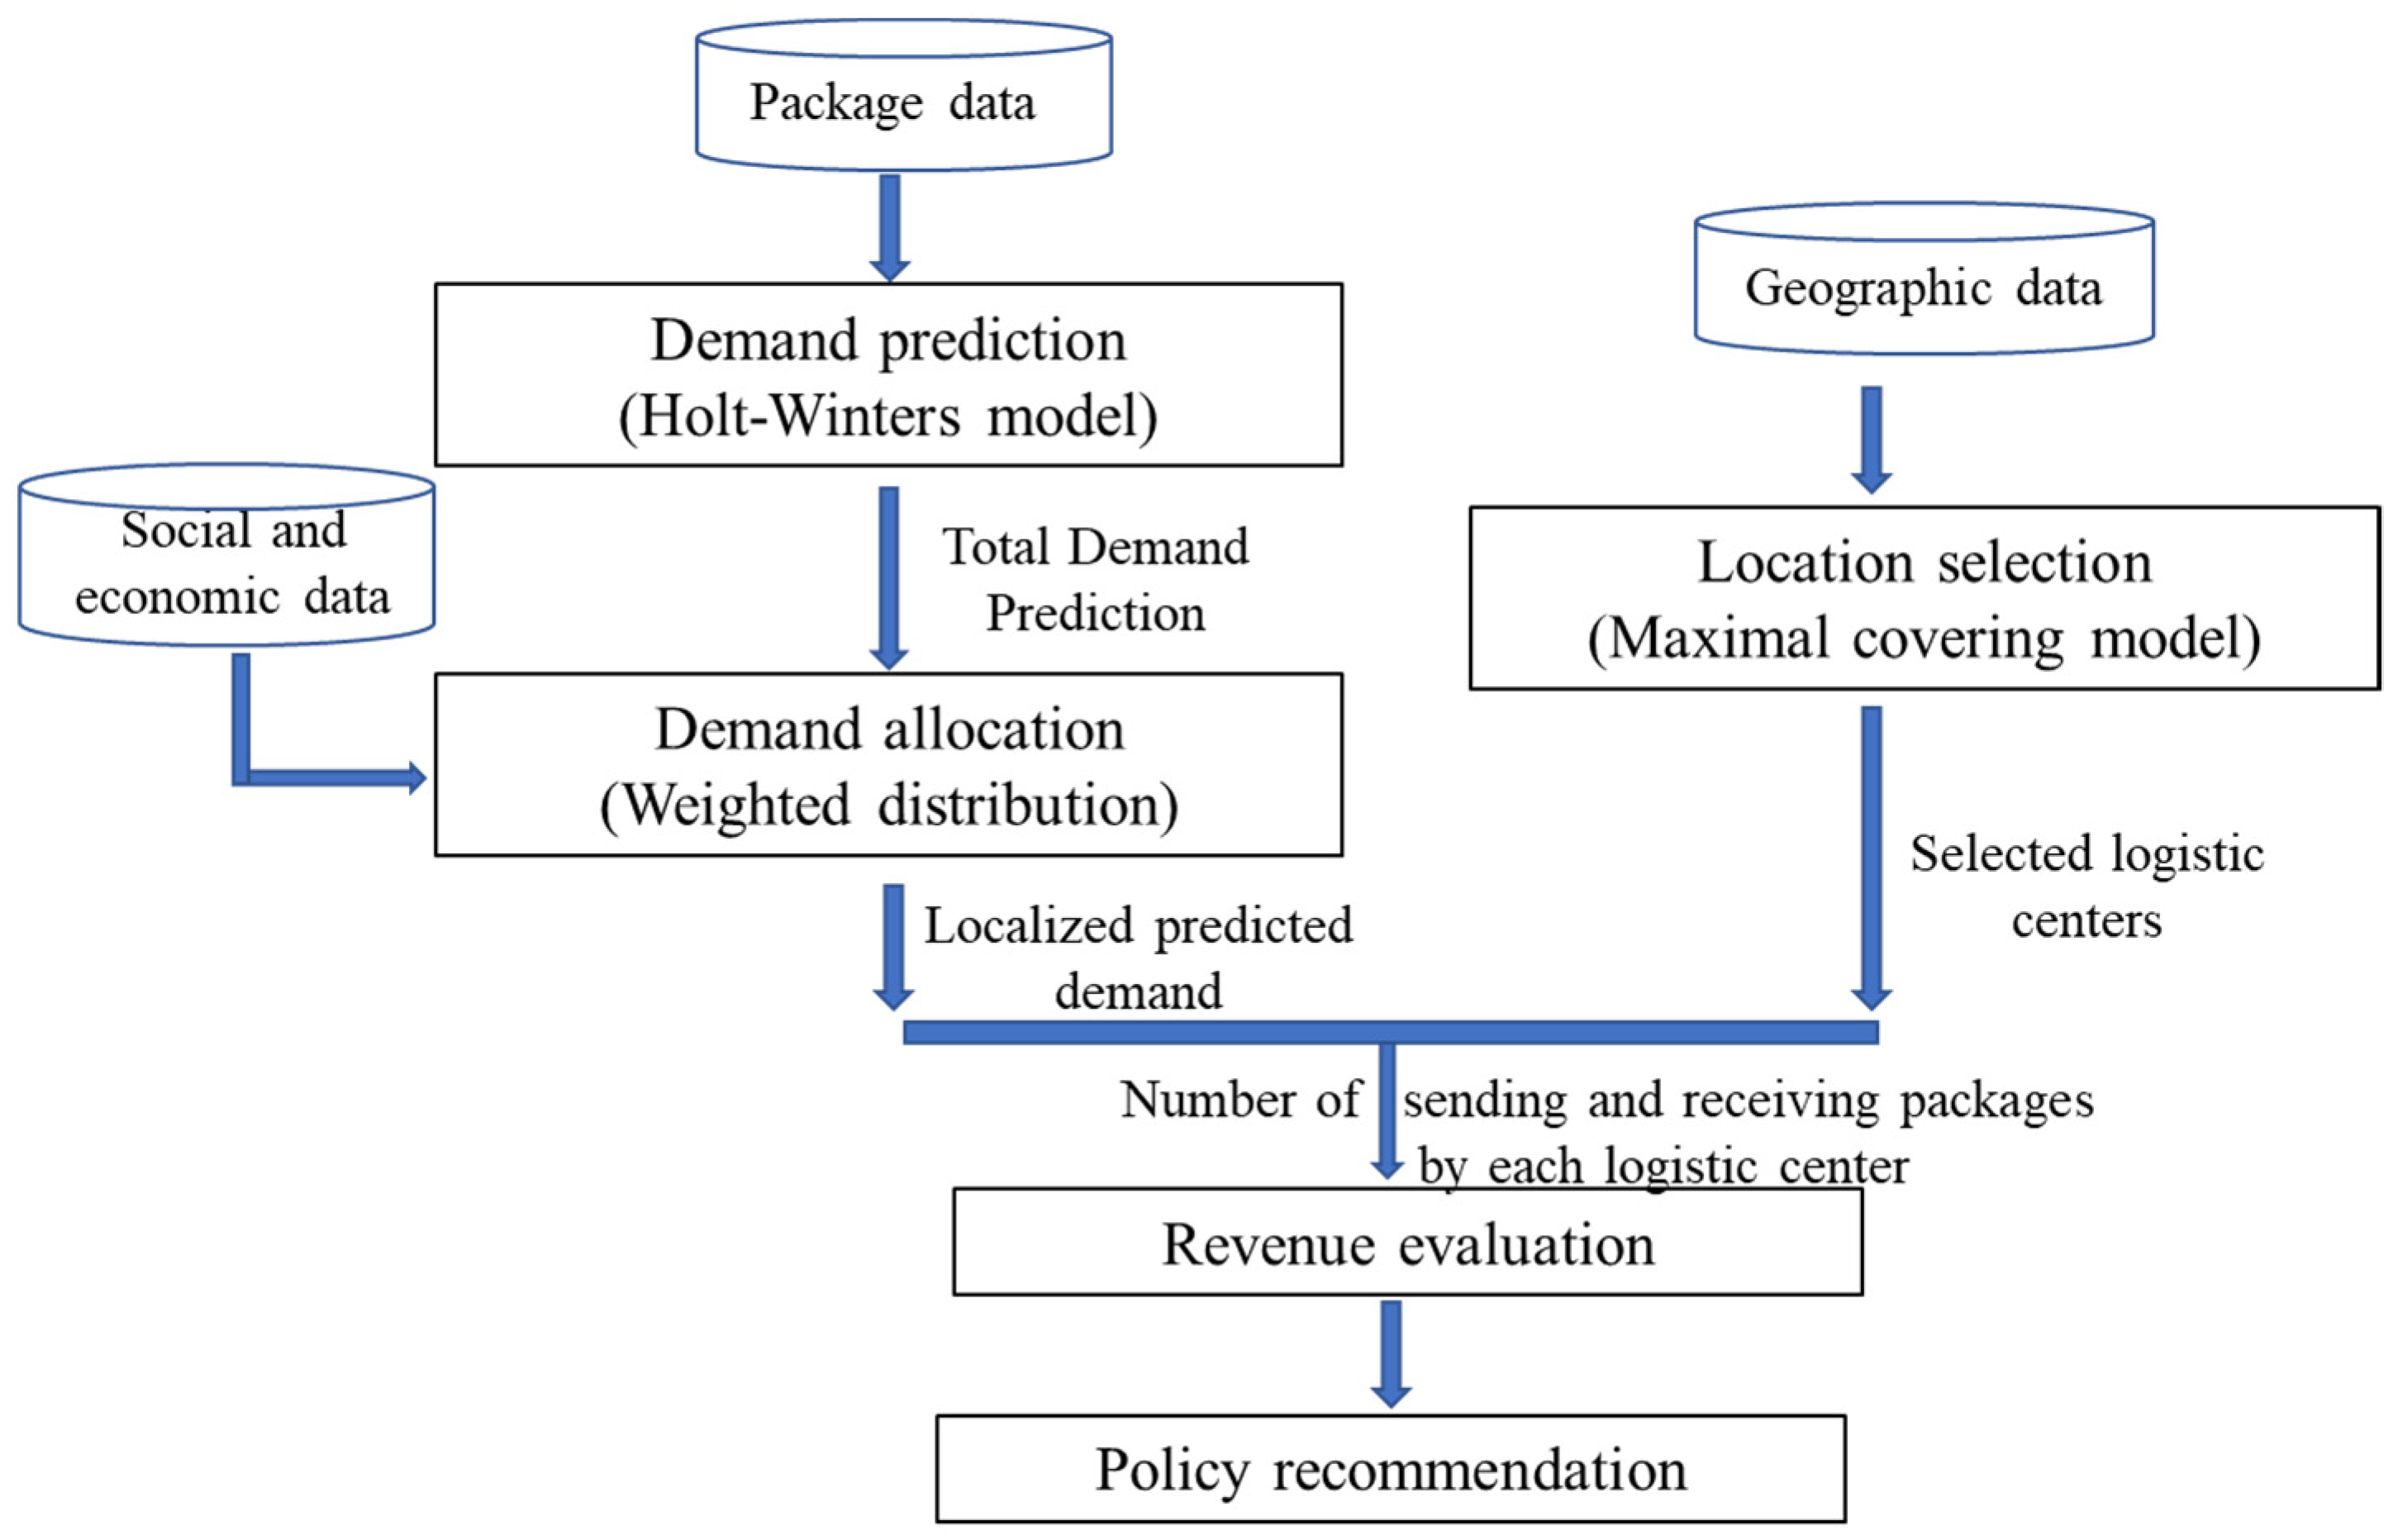
In this section, a procedure is introduced for locating logistics centers in rural areas in Lhasa.
Figure 2 shows the major stages. We first predict logistic demand for Lhasa based on the Holt–Winters model. The predicted demand is then assigned to each town in Lhasa based on several factors including population, number of industrial enterprises, etc. Meanwhile, we apply the maximal covering model to locate logistic centers in rural areas in Lhasa and conduct sensitivity analysis under different service radius and number of logistic centers. Finally, with the predicted demand and selected logistic centers, revenue evaluation is conducted to check if the selected centers can balance their future incomes and expenses. The procedure takes into consideration both demand coverage rate and logistic centers’ potential profitability.
4.1. Demand Prediction
In the demand prediction stage, future express logistic demand is predicted based on historical data. Unfortunately, we do not have detailed historical data on the number of sending and receiving packages for each town. Besides, the variation of the predicted demands could be very high for a spatial unit as small as a town. Therefore, we predict the total logistic demand for Lhasa, and then assign it to each town based on several factors including population, number of industrial enterprises, etc. The demand allocation is explained in detail in the following section.
Since the logistic demand exhibits seasonality, we apply the Holt–Winters model method to capture seasonal effect on logistic demand, which is recommended by Koehler [
47]. The Holt–Winters seasonal method comprises the forecast equation and three smoothing equations—one for the level
, one for the trend
, and one for the seasonal component
, with corresponding smoothing parameters
. We use
to denote the frequency of the seasonality, i.e., the unit of seasonal changes in a year. For example, for monthly data
. Let
denotes the predicted demand at time step
, where
is the current time step.
There are two variations to this method that differ in the nature of the seasonal component. The additive method is preferred when the seasonal variations are roughly constant through the series, while the multiplicative method is preferred when the seasonal variations are changing proportional to the level of the series. The two model variations are formulated as follows:
Holt–Winters additive model:
Holt–Winters multiplicative model:
where
is the integer part of
, which ensures that the estimates of the seasonal indices used for forecasting come from the final year of the sample.
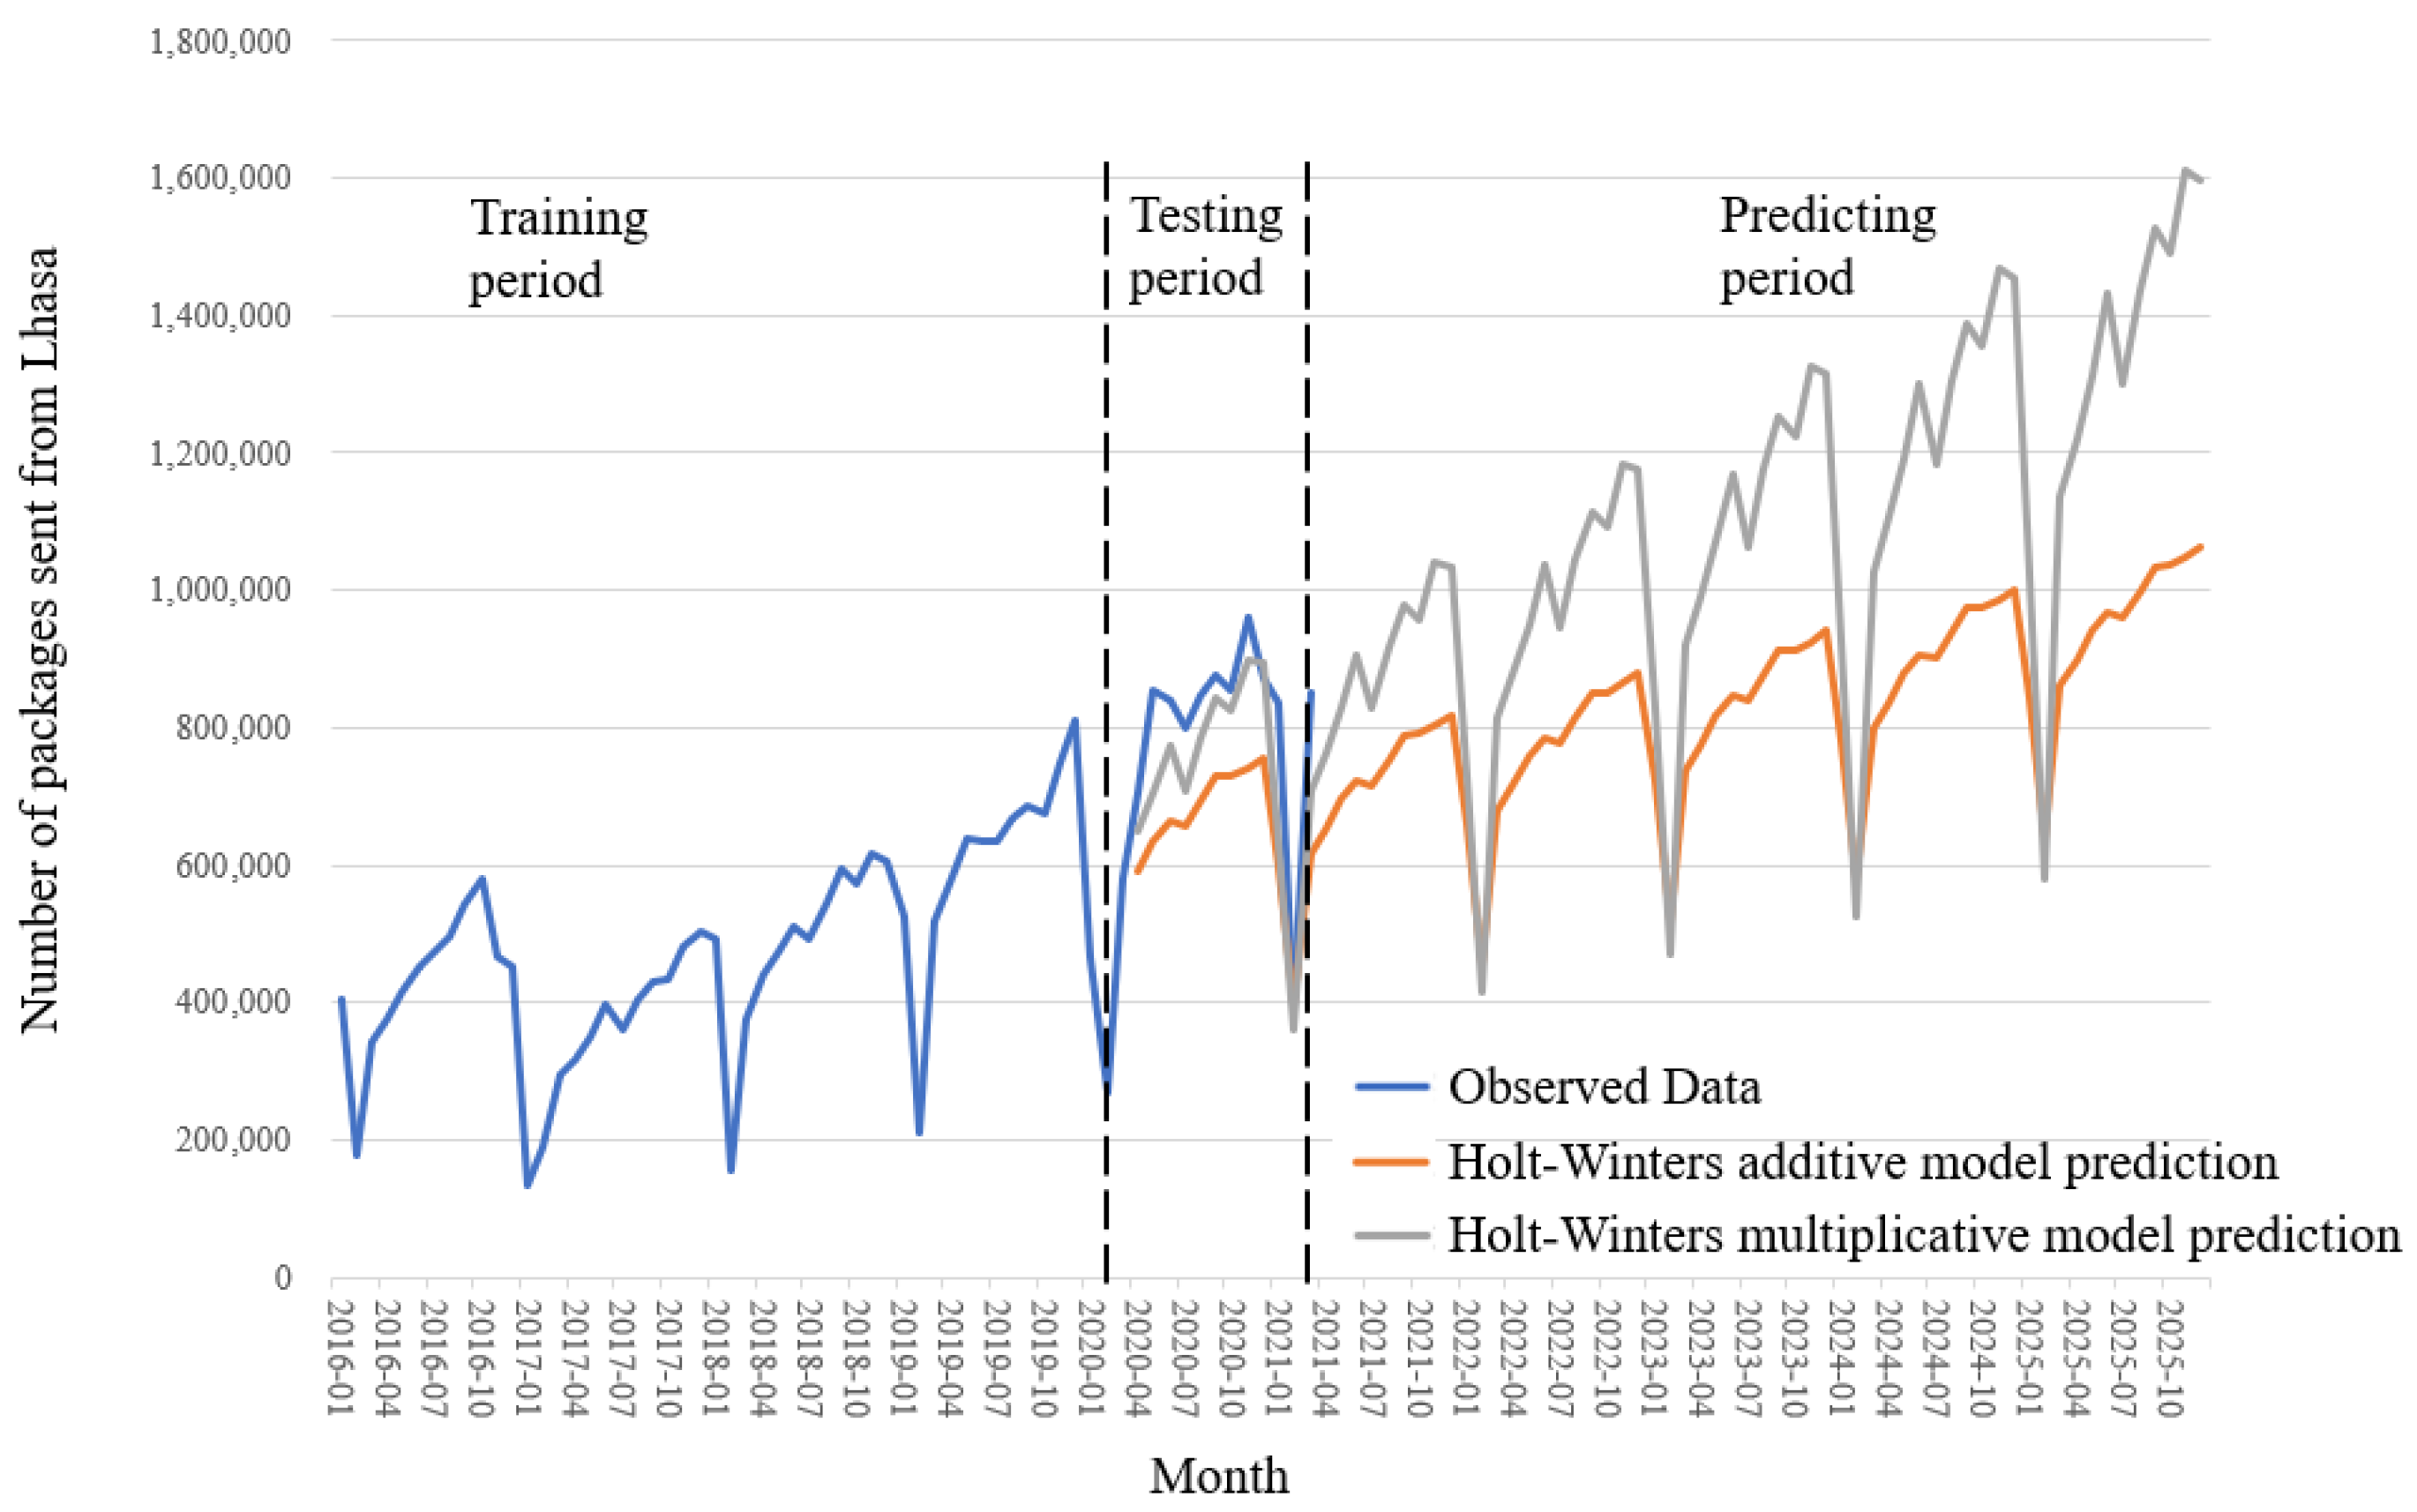
We then apply the Holt–Winters method with both additive and multiplicative seasonality to forecast quarterly logistic demand. The smoothing parameters and initial estimates for the components were estimated by minimizing root mean square error (RMSE). For the Holt–Winters additive method: , , . For the Holt–Winters multiplicative method: , , .
We define 3 time periods for prediction. The training period (January 2016–March 2020) accounts for 80% of the data set, while the testing period (April 2020–March 2021) accounts for 20%, which is a common ratio for models without hyperparameters [
48]. The predicting period (April 2021–December 2025) fits the time period of Lhasa’s 14th Five-Year Plan.
The applications of both methods (with additive and multiplicative seasonality) are presented in
Table 1, respectively.
Figure 3 shows the data from 2016 and the forecasts for 2021–2025 based on Holt–Winters method. Because both methods have exactly the same number of parameters to estimate, we can compare the training R-square and RMSE from both models. In this case, the method with multiplicative seasonality fits the data best. This was to be expected, as the time plot shows that the seasonal variation in the data increases as the level of the series increases. Therefore, we use the Holt–Winters multiplicative method to forecast the future logistic demand. For instance, the predicted logistic demand of Lhasa in 2025 is 16 million packages, with the trough of 0.6 million packages in Feb and the peak of 1.6 million packages in November.
The above-forecasted logistic demand only contains packages sent out from Lhasa to other regions, while the data on the packages sent to Lhasa is not directly available. According to local government reports [
45], Lhasa has a very unbalanced ratio of outcoming and incoming cargos, which is approximately 1:9. This is because Lhasa is located on a plateau with a shortage of various goods and materials. We then calculated the total prediction of packages sent to Lhasa based on the ratio. Overall, the logistic demand of Lhasa in 2025 will be 144 million packages, with 16 million to be sent out from Lhasa and 128 million to be received.
4.2. Demand Allocation
With the yearly total predicted logistic demand of Lhasa in
Section 2.1, we conduct demand allocation, assigning the total demand to each town based on several factors including population, number of industrial enterprises, and number of shops and markets. Specifically, demand allocation contains two steps, i.e., from Lhasa to each county and then from each county towns.
- (1)
Demand allocation from Lhasa to each county. Specifically, allocation of sending packages is based on gross regional product, as manufacturers and commercial enterprises are main express package senders. Allocation of receiving packages is based on population, as local residents constitute the main express parcel recipient. In Lhasa, Chengguan district has a relatively high proportion of urban residents, and is assigned 1.25 times the population weights of other counties [
45]. Allocation results in this stage are shown in
Table 2.
- (2)
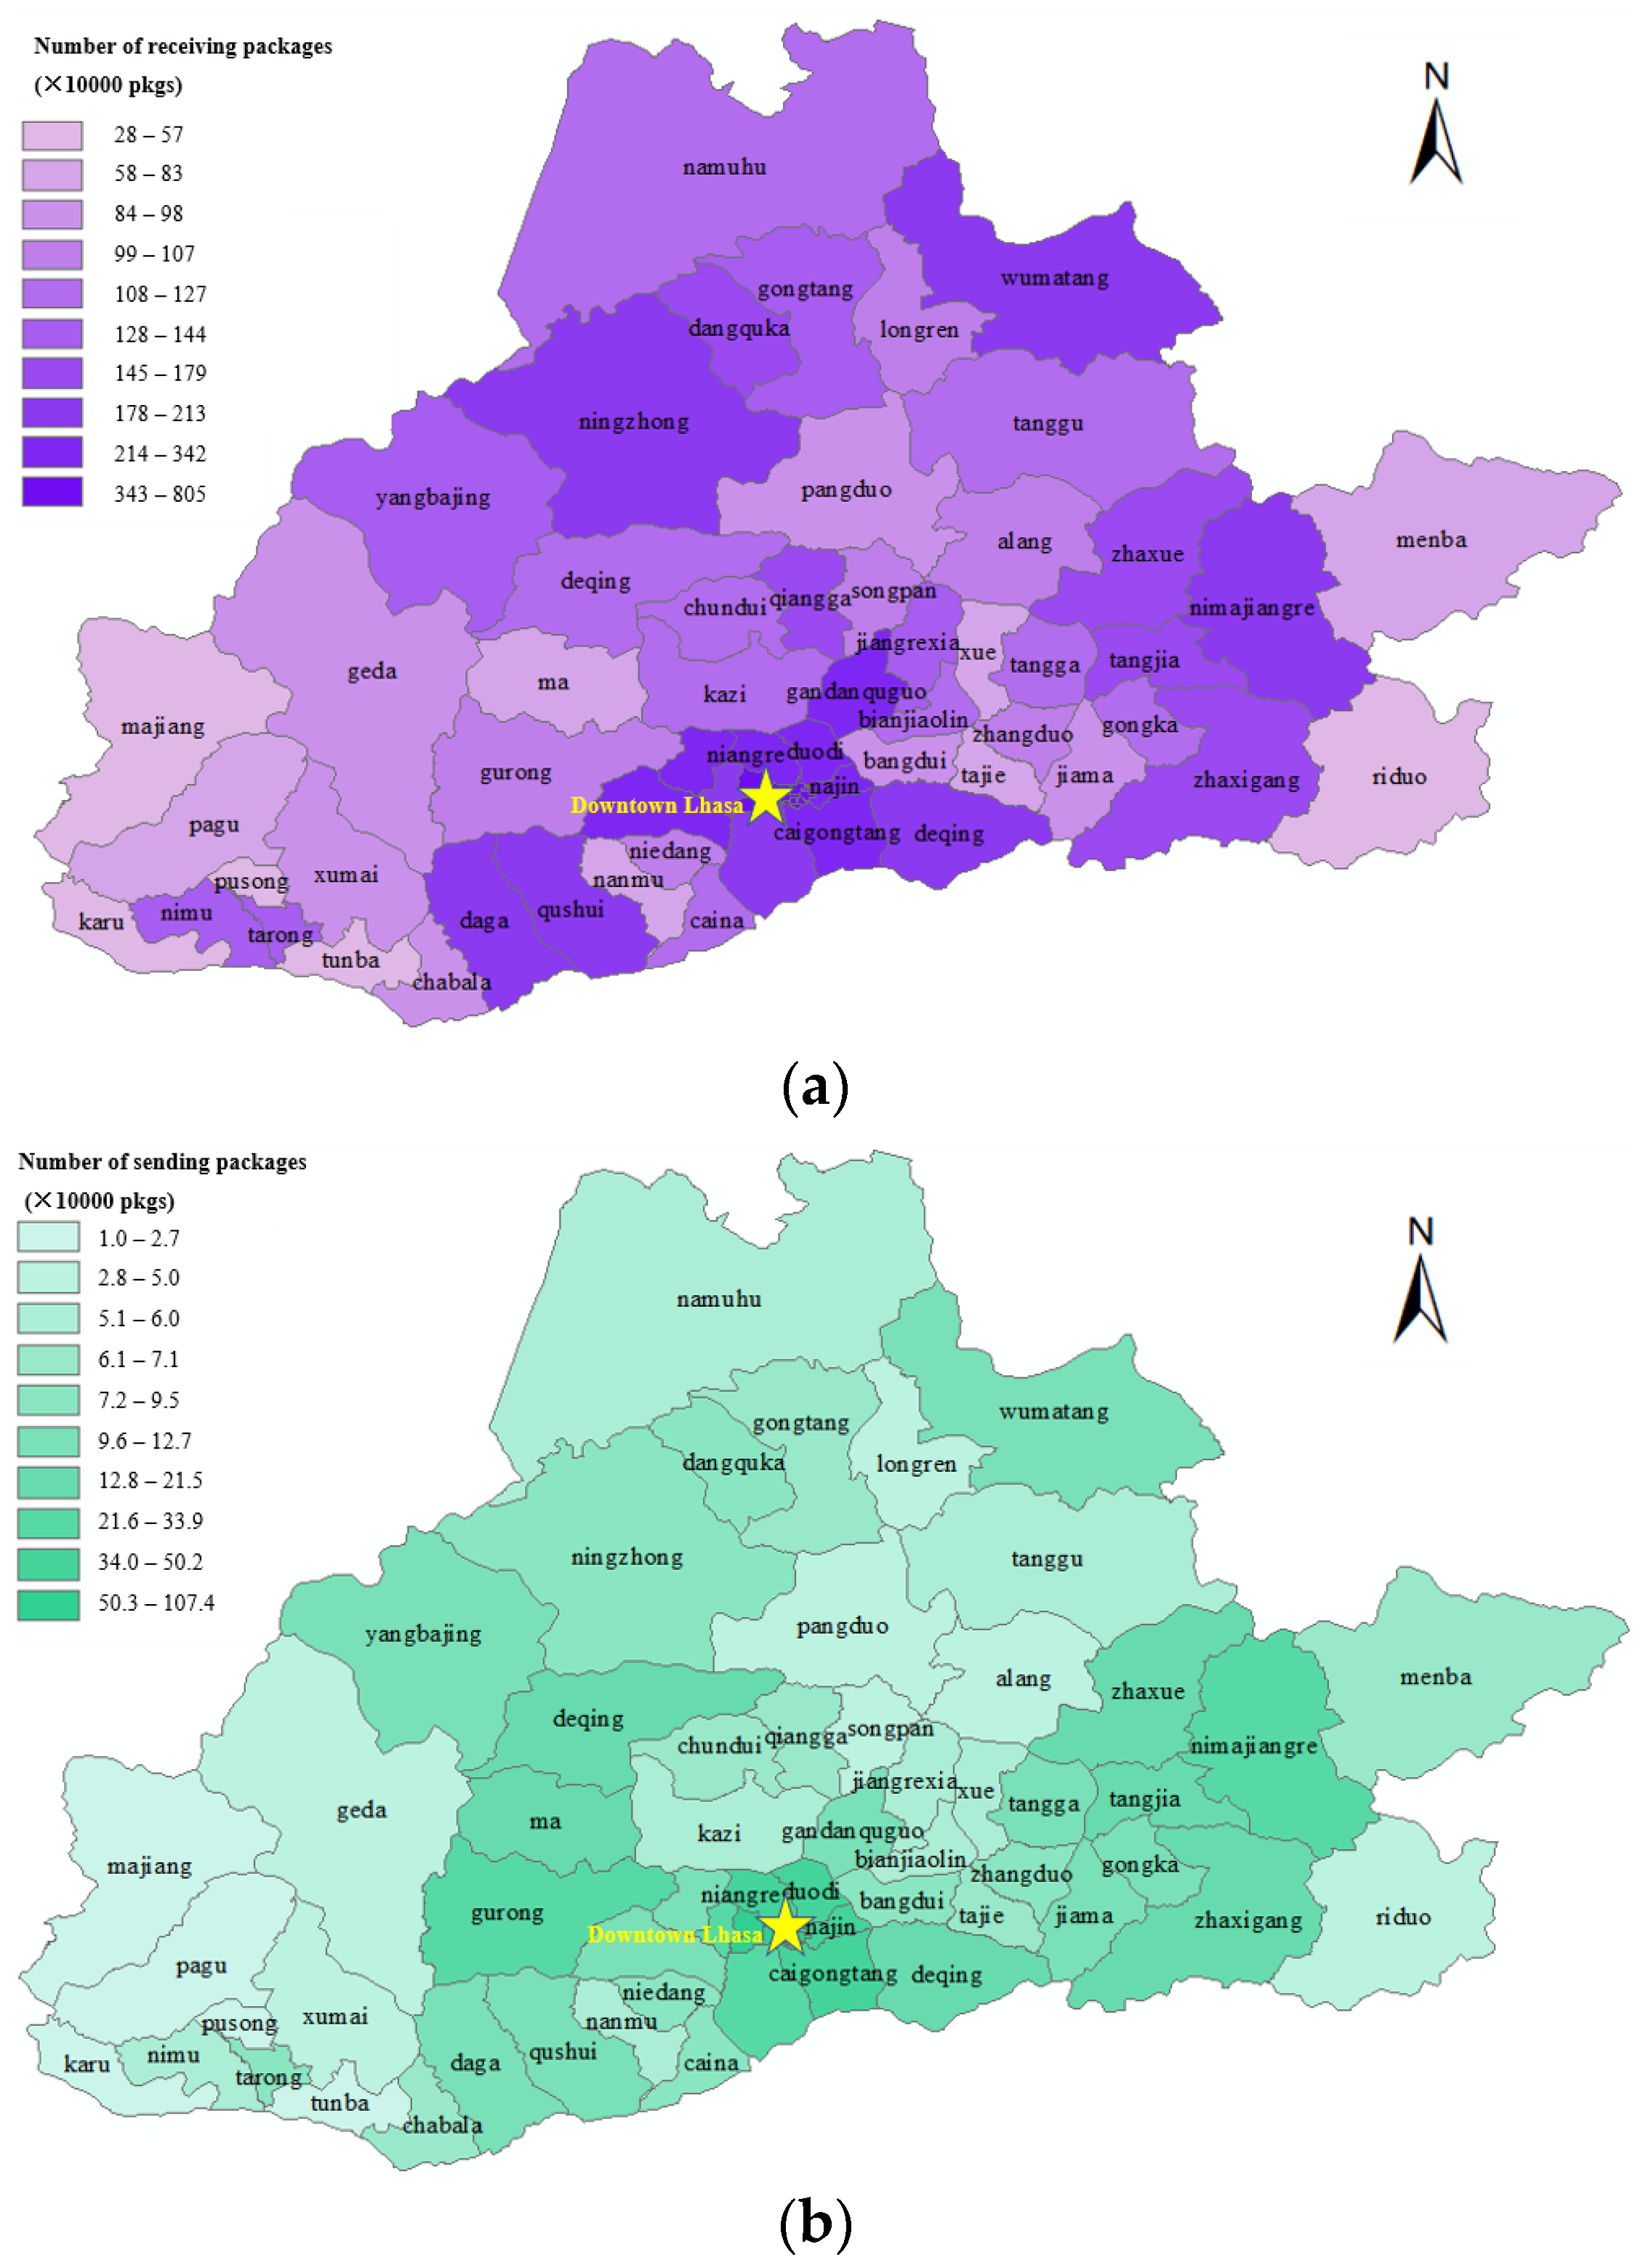
Demand allocation from counties to towns. In this step, demand allocation for both sending and receiving packages are based on population, number of industrial enterprises, and number of supermarkets in each town. Specifically, each industrial enterprise or supermarket is roughly considered to have 100 times the logistic demand of a resident. An industrial enterprise above designated size is considered to have 500 times that. These proportions are decided after consulting local logistic practitioners. Take Qushui county as an example. Allocation results are shown in
Table 3, while allocation results of all 64 towns in Lhasa are visualized in
Figure 4.
After the two steps of demand allocation,
Figure 4 further visualizes the allocation results in each town in Lhasa. As can be seen from the figure, towns near downtown Lhasa, e.g., Niangre, Najin, and Caigongtang, generally have more logistic demand. Additoinally, towns along the traffic artery, e.g., Qushi, Daga and Ningzhong, also have more logistic demand. These results also give us more confidence that our demand prediction and demand allocation procedure are reasonable.
4.3. Maximal Covering Model for Locating Logistic Centers
4.3.1. Maximal Covering Model
In this section, we apply the maximal covering model for locating logistic centers in the rural areas in Lhasa. Each village is considered as a demand point. For facility points, in addition to villages, counties and towns are also included in the candidate locations of the logistic center, in sight of the fact that counties and towns are usually transport hubs. The following notations are used to formulate the model:
Parameters:
Importance of demand point to target function
Distance from demand point to logistic center
Service radius, i.e., maximum service distance accepted by demand point
Number of logistic centers to be located.
Sets:
Set of demand points.
Set of candidate logistic centers.
Set of logistic centers that can cover demand point , .
The maximal covering model is formulated as follows:
The objective function (9) maximizes the demand that is covered. Constraint (10) states that if demand point is covered, at least one of the candidate logistic centers that can cover demand point is selected. Constraint Formula (11) states at most logitic centers are to be located. In general, this constraint is binding.
Overall, there are 331 administrative villages in the rural area of Lhasa, i.e., |I| = |J| = 331. In order to intuitively reflect the target of village coverage rate, this study sets all as 1. That is, represents the covered number of villages. is approximated as the distance between center and , which is calculated in ArcGIS 10.2.
We then apply the maximal covering model under different service radius (in unit of meters) and number of logistic centers. The results are listed in
Table 4.
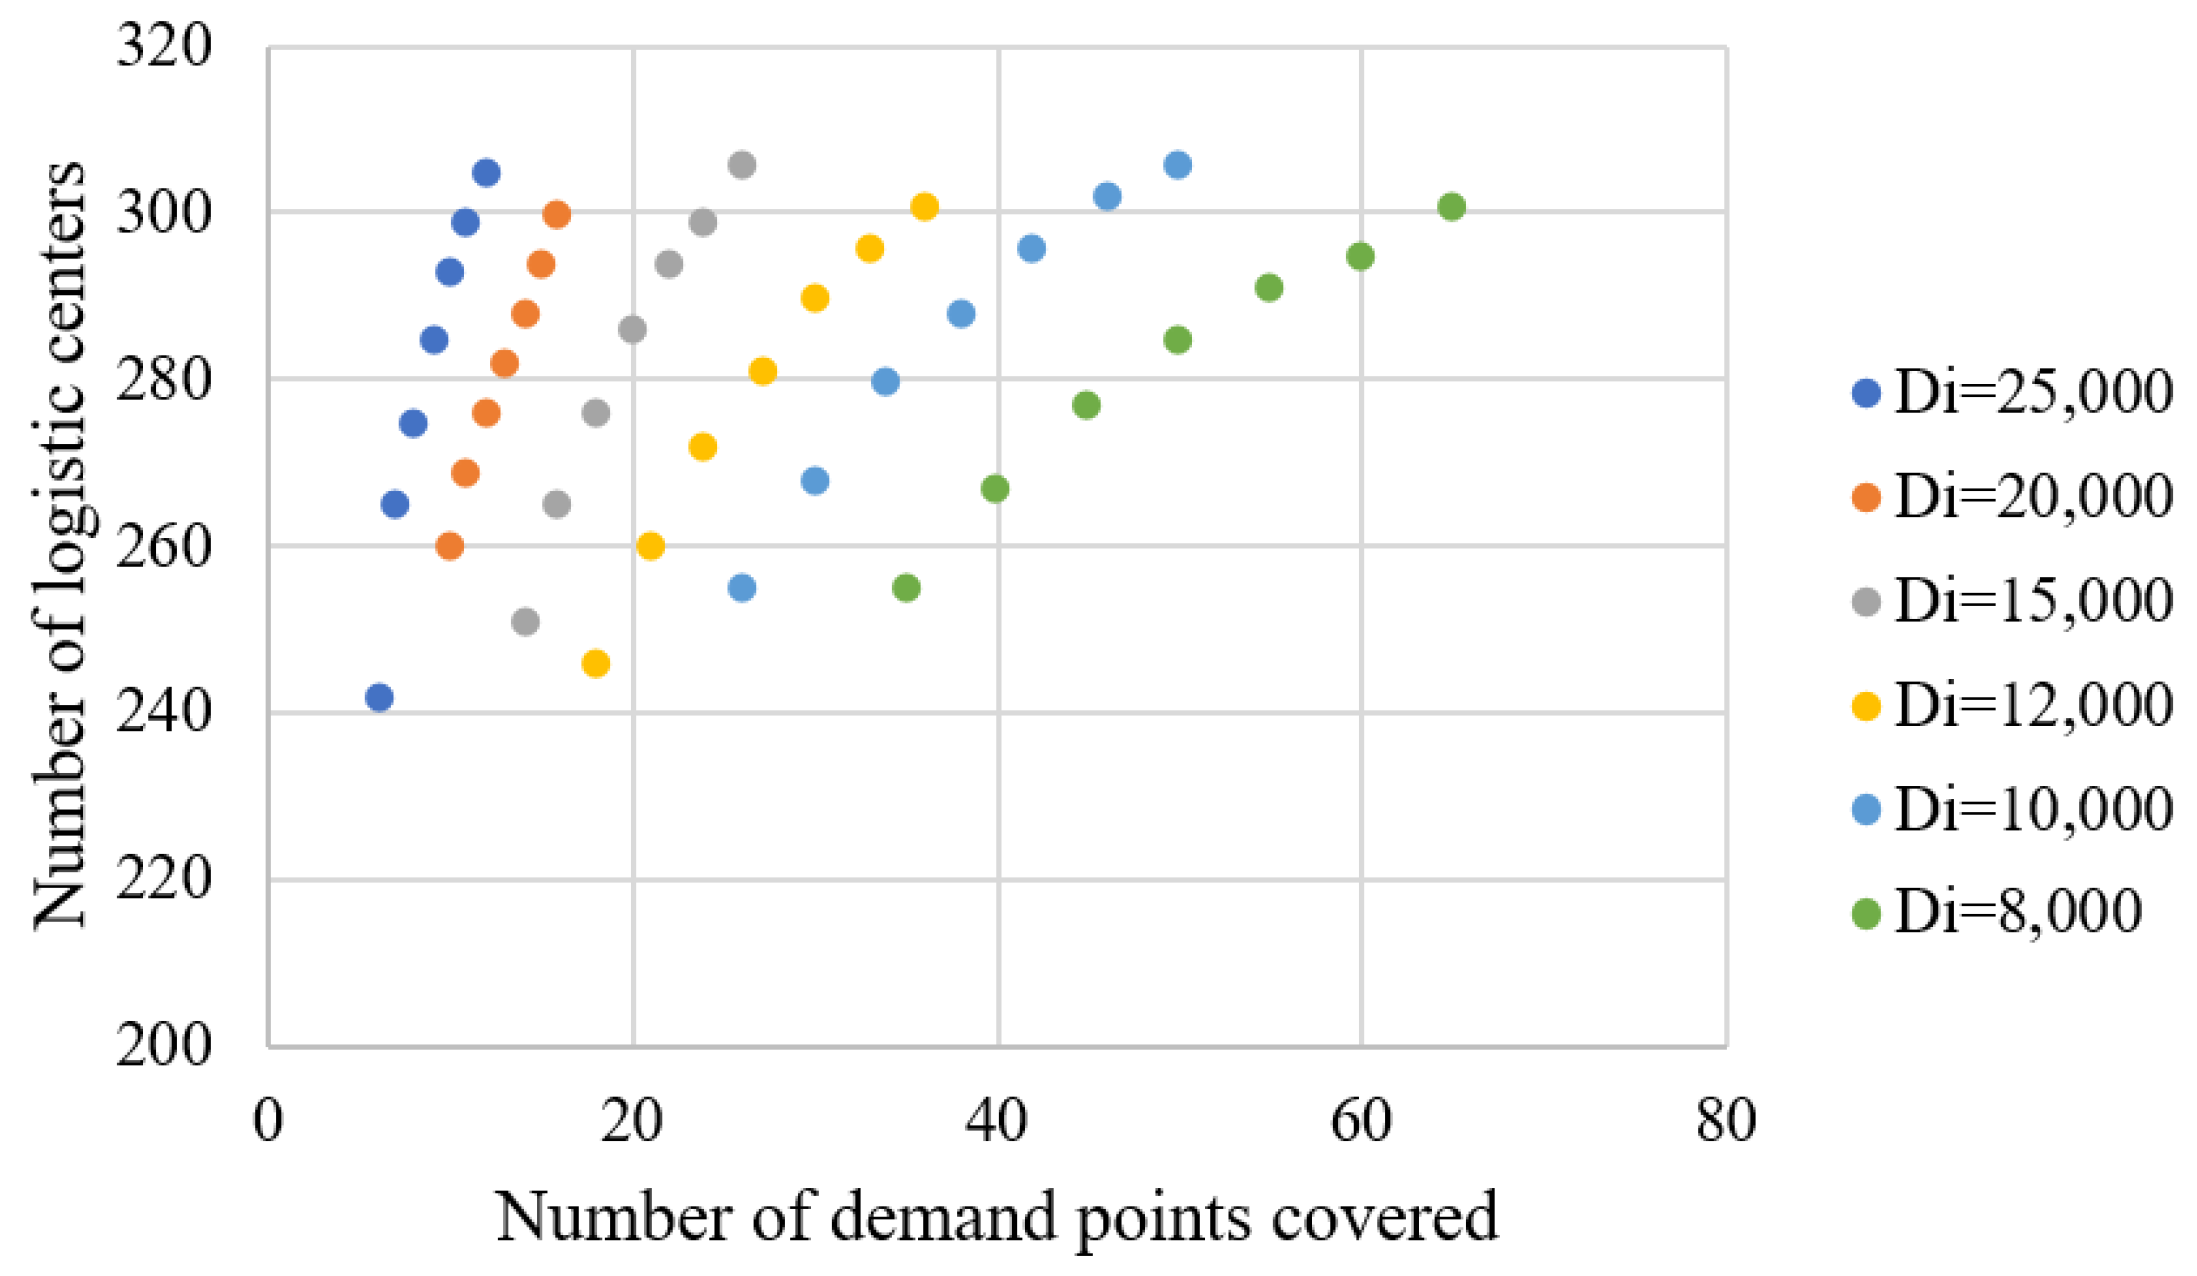
Figure 5 further visualizes the results. In general, the larger the service radius, the more villages can be covered by the same number of logistic centers. Next, we give more details on this.
4.3.2. Marginal Efficiency Analysis on Service Radius and Number of Logistic Centers
We define marginal efficiency as the number of new demand points, i.e., villages, that can be served by establishing a new logistic center. For example, if the service radius is set as 8000 m, 60 logistic centers can cover 295 demand points, while 61 logistic centers can cover 297 demand points, which means the marginal efficiency is 2. Note that although the maximal covering model allows a demand point to be served by more than one logistic center, we assume that a demand point is served by the nearest logistic center only using the Near tool in ArcGIS 10.2.
Table 5 shows how the marginal efficiency changes under different service radius and number of logistic centers. For the service radius of 25,000 m and 20,000 m, when the coverage rate reaches 90% (over 298 villages), the marginal efficiency is greater than 6, which is theoretically a highly efficient option. However, it leads to long distribution distances, poor timeliness, low service level, and complex distribution route organization, if there are too few logistic centers. For the service radius of 8000 m, the marginal efficiency is less than 3 when the coverage rate is lower than 80%, which is too low to be selected in this study. For the service radius of 15,000 m, 12,000 m, and 10,000 m, the fewest logistic centers are needed with a service radius of 15,000 m when marginal efficiency is 3. Therefore, we choose 15,000 m as the service radius. Accordingly, the number of located logistic centers is 22, covering 294 villages, i.e., 88.8% among demand points.
We then calculate the number of sending and receiving packages by each logistic center. Specifically, 22 neighborhood areas ranged 15,000 m are created for the 22 logistic centers using the neighborhood function in ArcGIS. Logistics demands for towns (
Figure 4) are turned into density data (e.g., receiving 6986 packages/km
2 in Caina town). The number of sending and receiving packages in the neighborhood area of each logistic center is then calculated accordingly.
Table 6 shows the number of demand points covered by each logistic center, as well as the number of sending and receiving packages by each logistic center. Overall, 22 logistic centers are selected, among which 1 is located in a county, 3 in towns, and the remainder in villages.
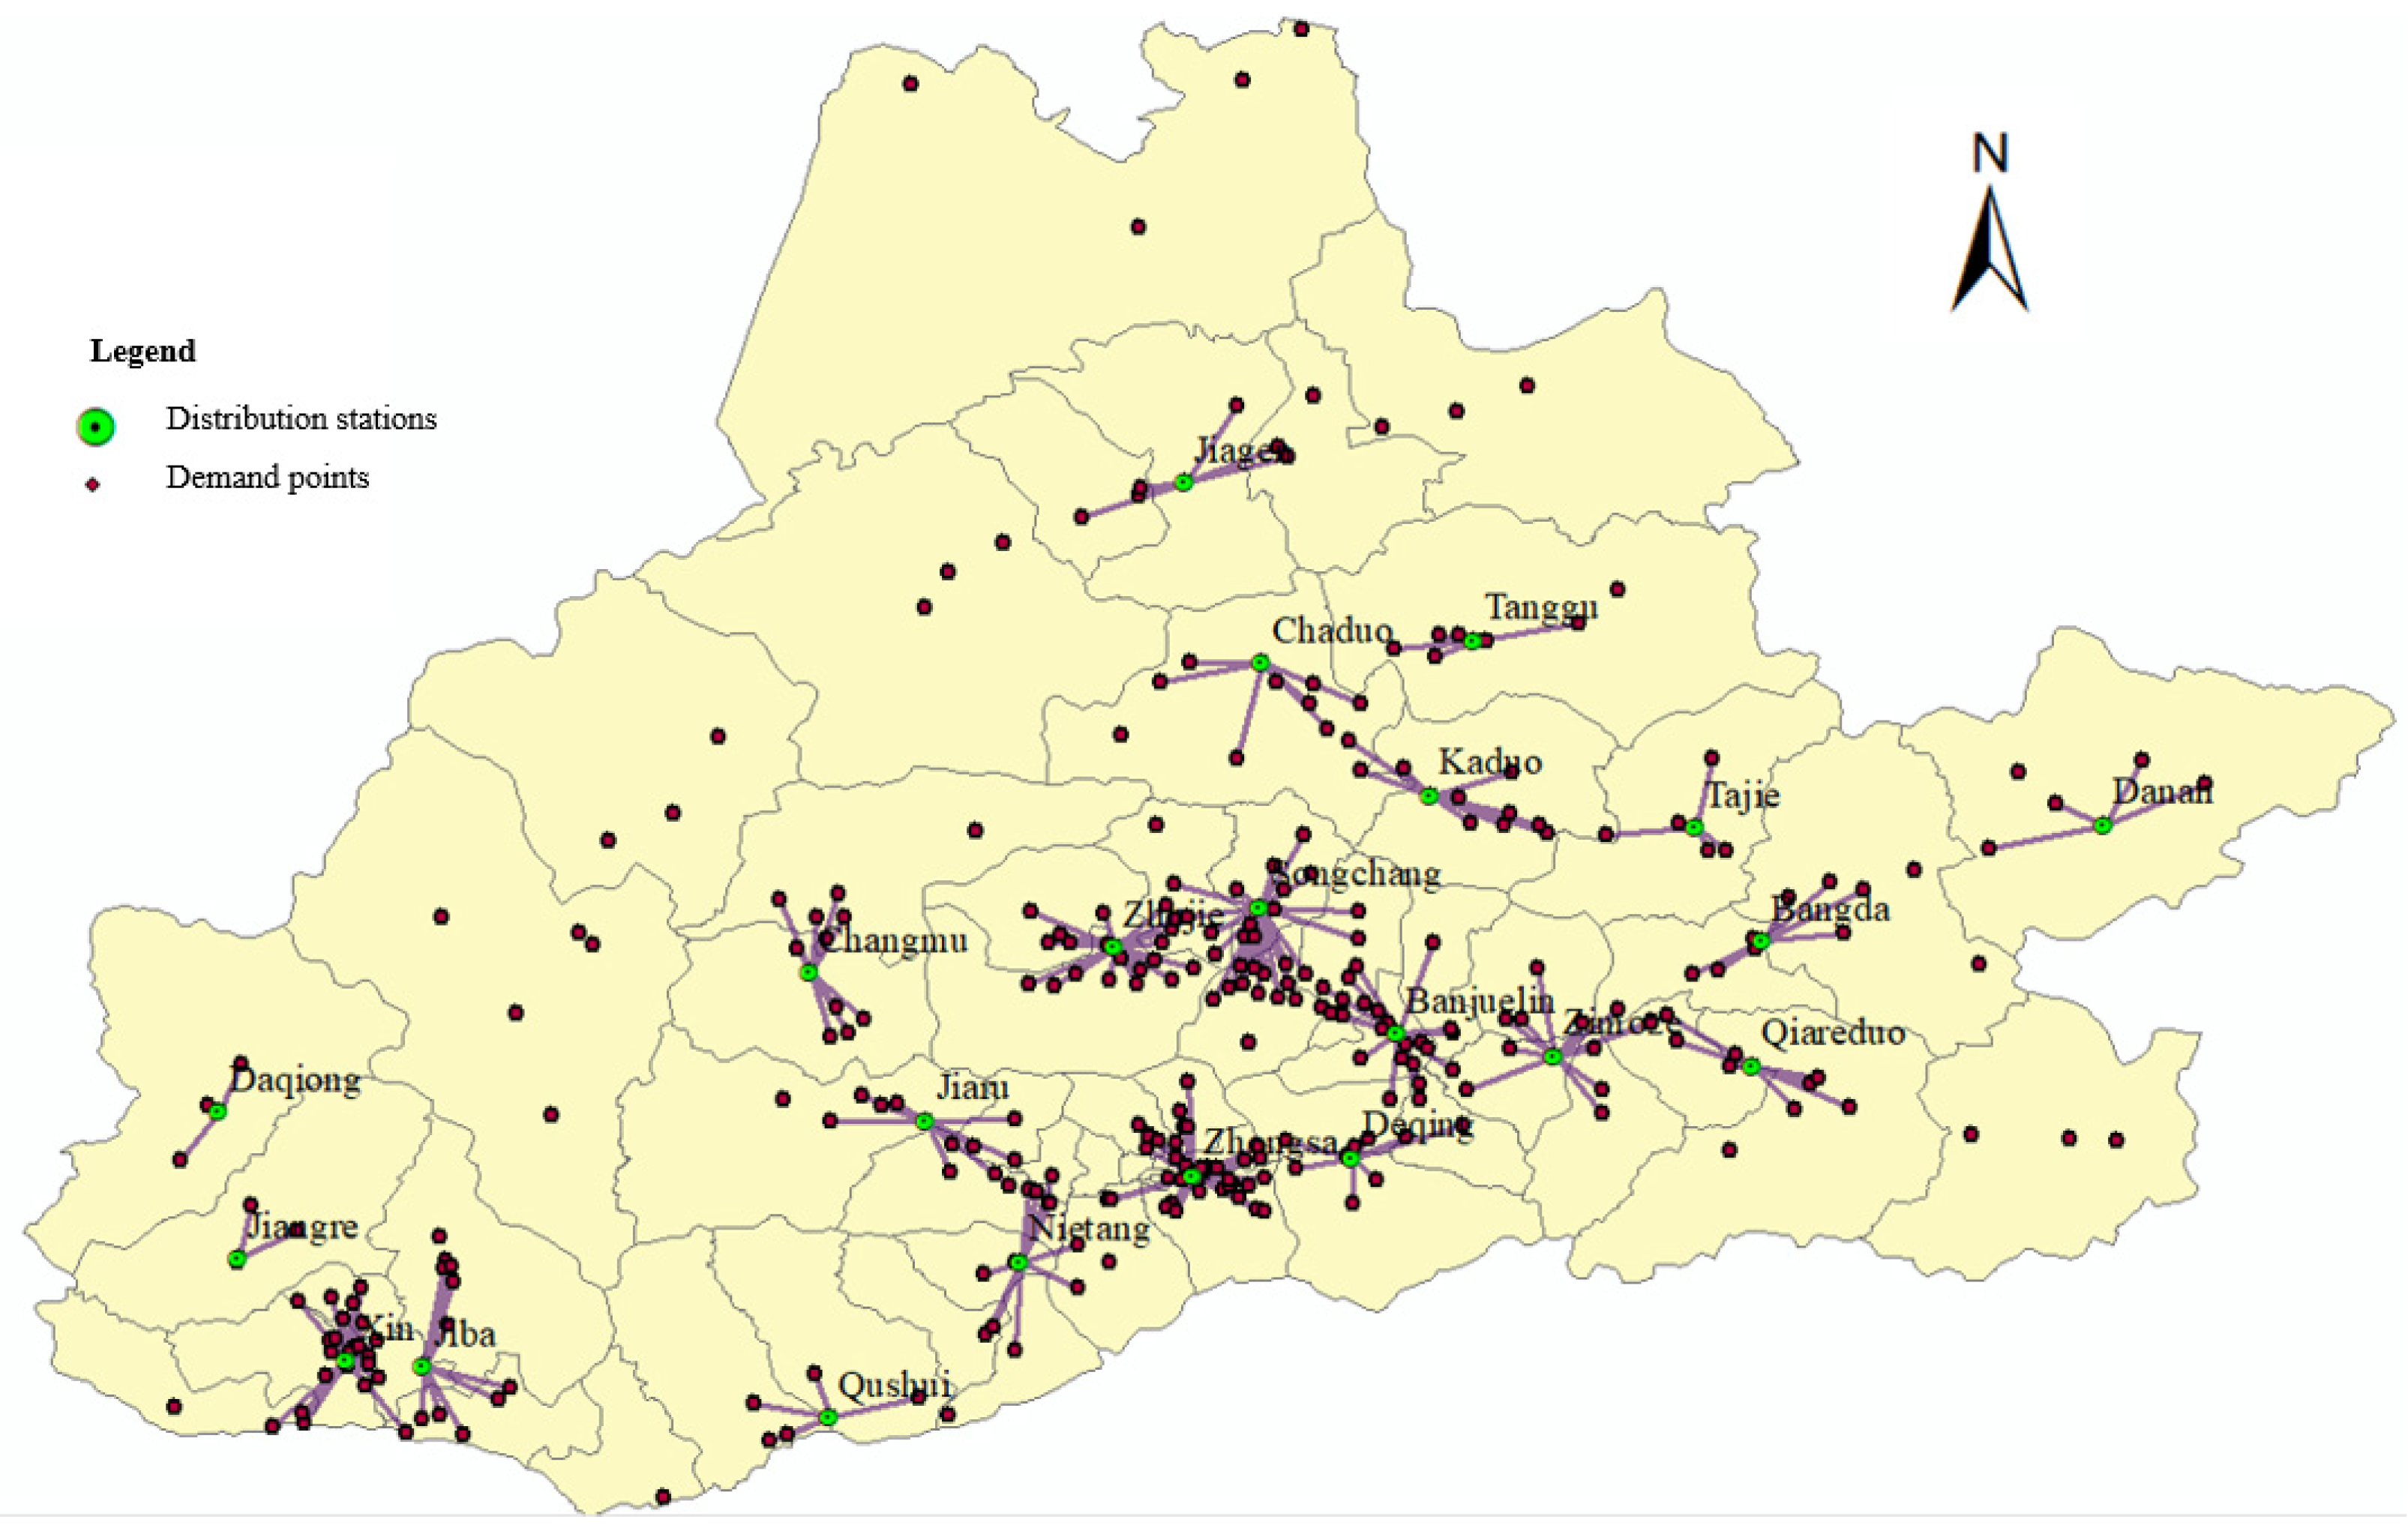
Figure 6 further plots the spatial distribution of the selected logistic centers and the covered demand points by each center. As can be seen, the center located in Zhongsa covers most demand points, while the center located in Daqiong only covered 4 demand points since it is located far away from other villages.
4.4. Revenue Evaluation on the Selected Logistic Centers
All 22 selected logistic centers are to be newly constructed, except Qushui center. Started in 2018, Qushui center can make a profit when extra charging is allowed, and the center relies on government subsidies to stay afloat now. Since the operation conditions for the newly selected logistic centers remain unclear, we next evaluate the future operating conditions for newly established logistic centers in terms of profitability.
Profitability for a logistic center is determined by income and cost, where income includes regular income and extra income, and cost includes one-time initial investment cost and operating cost.
- (1)
Regular income
Regular income is determined by sending and receiving packages. Within the service radius of 15,000 m, the number of sending and receiving packages is calculated for each center. The regular income for a logistic center is calculated as:
where
(unit: CNY) denote the service fee of delivering or sending a package.
and
denote the predicted number of receiving and sending packages of the logistic center, respectively.
- (2)
Extra income
Extra income is charged for long-distance delivery packages, which means a postman has to travel a long way between the logistic center and the consignee. Compared with sending packages (around CNY 4 per package), regular income from receiving packages (around CNY 1.5 per package) is relatively low, so that it is not enough to cover the long-distance delivery costs. In sight of this, charging extra was a common choice for rural logistic centers to take, and rural residents in remote areas were willing to pay for the convenience.
Previously, however, charging extra was forbidden by the government for lack of standardization. Many of the centers have suffered from deficits since then, some relying on government subsidies to stay afloat, some narrowing service range, and others stopping operating. Recently, logistic centers were authorized to charge extra for long-distance delivery packages. A package should be charged only once, with all kinds of fees included. The extra income for a logistic center is calculated as:
where
stands for regions with different distances from center,
(unit: CNY) denotes extra charge for a long-distance delivery package in region
,
denotes the number of long-distance delivery packages in region
.
Take Qushui logistic center as an example, the parameters for incomes are set as:
- (3)
One-time initial investment cost
One-time initial investment cost usually occurs when establishing a new center. The one-time cost for a rural logistic center usually includes decoration, equipment cost, vehicle cost, etc.
- (4)
Operating cost
Operating cost is calculated for each year based on salaries for employees, gasoline, etc. Due to high turnover rate, personnel training cost is also included in operating cost.
Take the logistic center in Qushui County as an example.
Table 7 gives the detailed items of one-time cost and operating cost, as well as Qushui center’s specific values for the items.
Table 8 shows the revenue evaluation results for all 22 logistic centers, based on the predicted number of sending and receiving packages in 2025. Among which, 12 logistic centers are expected to make profits by 2025. Their yearly profit is significantly higher than cost and are therefore believed to cover the initial investments in a few years. Six centers marked yellow can roughly balance their income and expenses, but they still face difficulty covering the initial investment. The remaining 4 logistic centers, marked red, suffer from obvious deficits and may need government support.
5. Discussion
5.1. Adopting Joint Distribution Mode
As can be seen from the above analysis, only 12 of the 22 selected centers could make profits by 2025. The initial investment cost is too high for a single logistic enterprise to bear. Since most villages have a small population and are scattered in a vast area, it is difficult for a single logistic enterprise to achieve economy of scale. To improve logistics efficiency, the joint distribution mode can be adopted to form a scale economy effect by sharing logistic resources. Packages from different express companies can be delivered to county-level distribution centers and distributed to destination villages. Although joint distribution can reduce unit distribution cost, benefit distribution and responsibility division between the express brands can be hard to handle. Only by effectively coordinating responsibilities and interests of various companies can joint distribution be well implemented.
5.2. Making Full Use of Local Transportation Resources
Salaries account for up to 70% of monthly operating costs, which is a high percentage. Based on a government report, the local average salary is about CNY 4000 per month. In a rural logistic center, a long-distance deliveryman handles no more than 2000 packages every month, barely feeding himself. A deliveryman who drives an electric tricycle for short-distance delivery can deliver about 4000 packages every month, making a slight surplus, which is the main source of the center’s regular income. Local logistics transportation resources, such as passenger buses and motorcycles in rural areas, could be made full use to reduce daily operating cost. The operating routes of passenger buses generally cover a wider range. Motorcycles are commonly used to provide transportation services to local rural residents, and motorcyclists are very familiar with the local environment, so they can effectively deliver goods for the last mile.
5.3. Pricing Strategies for Long-Distance Logistic Service and Government Supervision
Village coverage rate is the main index for rural logistics according to the Chinese government. The above model sets a target coverage rate of 88%, which is achievable if extra charges are allowed for long-distance delivery. For example, under the condition that extra charges are allowed for long-distance distribution, Qushui center could make a monthly profit of about CNY 27,000, and the one-time cost of the initial investment can be paid after 16 months of operation under the current 30% annual growth rate. If extra charges are not allowed, the center will not achieve break-even point and will lose up to CNY 25,000 per month, making it difficult to continue operating.
Therefore, a step-pricing strategy could be charged based on delivery distance. Previously, extra charging for long-distance delivery used to be banned by local government. Some rural logistic centers rely on government subsidies to continue providing long-distance delivery service, while others stop providing long-distance logistic service in rural areas. A better choice for the government is to direct the express enterprises to optimize the pricing strategy, so as to encourage rural logistic centers to carry on the business.
5.4. Model Comparison
The proposed MCM is further compared with two other models, i.e., p-median model and set covering model, as shown in
Table 9 and
Figure 7.
Results from the p-median model suggest that 46 logistic centers are needed, among which 8 centers serve only 1 village. It requires considerable financial support to set up all the 46 logistic centers. For the set covering model with unlimited service distance, Qushui center can serve more than 20 villages in the southwest of Lhasa. However, the service range is much longer for the established logistic centers. Meanwhile, the number or the capacity of the delivery vehicle should also be improved to handle all packages for the 20 villages. The proposed MCM covers 89% of the villages in Lhasa, subject to two characteristic constraints, i.e., the number of facilities (22 centers) and service radius (15,000 m). We notice that most of the uncovered villages are located in the northwest of Lhasa, and are distributed along Highway 109. It is acceptable that these villages are served by regular freight buses, rather than establishing a logistic center bound to face deficits. Therefore, although the coverage rate of the MCM is the lowest in all three models, it is a more feasible and applicable model considering the reality of Lhasa.
6. Conclusions
In this study, a practical method is proposed to locate logistic centers in rural areas and thus expand rural express network. The Holt–Winters multiplicative model was used for predicting logistic demand. The predicted demand is allocated to towns according to population, gross regional product, and some other indicators. The maximal covering model is applied for siting logistic centers under different service radii and number of logistic centers. In the case study, numerical analysis suggests that 22 rural express logistic centers need to be established in rural areas of Lhasa, covering 88.8% of all 331 administrative villages according to marginal efficiency analysis. Finally, revenue evaluation is conducted for the centers to estimate their future operating conditions based on predicted logistic demand. Results indicate that 12 of the 22 logistic centers could make profits by 2025, and 6 of them can roughly balance their income and expenses. The remaining four logistic centers may suffer from deficits and need government subsidies. Finally, recommendations are given for the construction of rural express network.
There are several limitations of this study: (1) The study focuses on express delivery alone. In addition to express packages, other cargo categories in rural areas such as agricultural products and medicine also need logistic services. (2) The Holt–Winters model only uses historical logistic demand for prediction, which is considered autoregressive.
For future study, we suggest: (1) Attention should be paid to multiple delivery demands, including agricultural products, medicine, consumer goods, and energy supplies when designing rural logistic service systems. (2) Factors such as gross domestic product and resident income can be included in demand prediction, aiming to achieve better results through multifactor prediction.
Author Contributions
Conceptualization, H.M.; Investigation, Q.Z.; Methodology, Q.Z.; Supervision, H.M.; Writing—original draft, Q.Z.; Writing—review & editing, H.M. All authors have read and agreed to the published version of the manuscript.
Funding
This research and the APC was funded by the Natural Science Foundation of Jiangsu Province in China (BK20210250) and the National Natural Science Foundation of China (71901059).
Institutional Review Board Statement
Not applicable.
Informed Consent Statement
Not applicable.
Data Availability Statement
Not applicable.
Acknowledgments
We would like to acknowledge local government of Lhasa who provided data, as well as Shuang Deng who inspired us in conceptualization.
Conflicts of Interest
The authors declare no conflict of interest.
References
- George, B.; Henry, G.; John, R. Rural Transport: Improving Its Contribution to Growth and Poverty Reduction in Sub-Saharan Africa; Sub-Saharan Africa Transport Policy Program (SSATP) Working Paper no. 93; World Bank: Washington, DC, USA, 2012; Available online: https://openknowledge.worldbank.org/handle/10986/17807 (accessed on 1 May 2022).
- Paul, S.; Simon, E.; John, H.; Anna, T. Improving Rural Mobility: Options for Developing Motorized and Nonmotorized Transport in Rural Areas; World Bank Technical Paper No. 525; World Bank: Washington, DC, USA, 2002; Available online: https://openknowledge.worldbank.org/handle/10986/15230 (accessed on 1 May 2022).
- Peter, R.; Shyam, K.C.; Cordula, R. Rural Access Index: A Key Development Indicator; Transport Paper Series; No. TP-10; World Bank: Washington, DC, USA, 2006; Available online: https://openknowledge.worldbank.org/handle/10986/17414 (accessed on 1 May 2022).
- American Public Transportation Association. Rural Communities Expanding Horizons: The Benefits of Public Transportation; American Public Transportation Association: Washington, DC, USA, 2012. [Google Scholar]
- Enoch, M.P.; Cross, R.; Potter, N.; Davidson, C.; Taylor, S.; Brown, R.; Huang, H.; Parsons, J.; Tucker, S.; Wynne, E.; et al. Future local passenger transport system scenarios and implications for policy and practice. Transp. Policy 2020, 90, 52–67. [Google Scholar] [CrossRef]
- Donnges, C. Rural Transport and Local Government Units: How to Improve Rural Transport for the Rural Poor; Transport and Communications Bulletin for Asia and the Pacific, No.71; Economic and Social Commission for Asia and the Pacific: Bangkok, Thailand, 2001. [Google Scholar]
- Vitale Brovarone, E.; Cotella, G. Improving rural accessibility: A multilayer approach. Sustainability 2022, 12, 2876. [Google Scholar] [CrossRef] [Green Version]
- Fu, H.; Li, H. Research on the Optimization of Rural Logistics Development in Henan Province. Int. J. Soc. Sci. Educ. Res. 2020, 3, 181–185. [Google Scholar]
- Jin, E.T. Research on Innovation of Agricultural Products Circulation System under Digital Rural Strategy; Nanchang University: Nanchang, China, 2020. [Google Scholar]
- Wang, M.; Chen, X. Analysis of influencing factors of urban and rural logistics distribution in Hainan province based on AHP. China Tequ Econ. 2020, 11, 81–86. [Google Scholar]
- Li, X.; Ramshani, M.; Huang, Y. Cooperative maximal covering models for humanitarian relief chain management. Comput. Ind. Eng. 2018, 119, 301–308. [Google Scholar] [CrossRef]
- Song, G.; Zhao, Z.; Tian, C.; Yi, Y.; Song, T. Research on Joint Distribution of Rural Logistics. In IOP Conference Series: Materials Science and Engineering; IOP Publishing: Bristol, UK, 2019; Volume 631, p. 052003. [Google Scholar] [CrossRef]
- Xie, L.; Zhou, L. Regional differentiation of service quality of rural E-commerce logistics terminal distribution: A case study of four districts and counties in Chongqing. Logist. Technol. 2020, 39, 73–77. [Google Scholar]
- Ren, X.; Shi, X. Research on Milk Run Model of Rural Logistics Based on “Internet +”; International Informatization and Engineering Associations: Qinhuangdao, China, 2019. [Google Scholar]
- Jiang, L.J. Research on LRP Optimization of Urban and Rural Joint Distribution Network Based on Two-Way Logistics; Beijing Jiaotong University: Beijing, China, 2019. [Google Scholar]
- Liu, Y.H. Study on the Join Distribution Mode Design and Vehicle Route Planning of Urban Trade Logistics; Chongqing Technology and Business University: Chongqing, China, 2020. [Google Scholar]
- Xiahou, J. Study on Site Selection and Distribution Optimization of Joint Distribution Network at the End of E-Commerce Logistics; Beijing Jiaotong University: Beijing, China, 2020. [Google Scholar]
- Wang, Y.; Zhou, X. Optimization of multi-center joint distribution alliance based on vehicle sharing. Comput. Integr. Manuf. Syst. 2021, 27, 1820–1832. [Google Scholar]
- Chen, X. Study on Location Selection of Urban Distribution Center Using Multi-Level Inventory Management; Changsha University of Science and Technology: Changsha, China, 2007. [Google Scholar]
- Özcan, O.; Reeves, K.A. The Impact of Sustainability-Focused Strategies on Sourcing Decisions. In Green Finance and Sustainability: Environmentally-Aware Business Models and Technologies 2011; IGI Global: Hershey, PA, USA, 2011; pp. 358–386. [Google Scholar] [CrossRef]
- Berman, O.; Drezner, Z. The multiple server location problem. J. Oper. Res. Soc. 2007, 58, 91–99. [Google Scholar] [CrossRef]
- Church, R.L.; Murray, A.T. Business Site Selection, location Analysis and GIS; John Wiley & Sons Incorporated: Hoboken, NJ, USA, 2009. [Google Scholar]
- Farahani, R.Z.; Hekmatfar, M. (Eds.) Facility Location: Concepts, Models, Algorithms and Case Studies; Springer Science & Business Media: Berlin/Heidelberg, Germany, 2009. [Google Scholar]
- Yu, R. The Capacitated Reliable Fixed-Charge Location Problem: Model and Algorithm. Dissertations Thesis, Lehigh University, Bethlehem, PA, USA, 2015. [Google Scholar]
- Weber, A. Theory of the Location of Industries; University of Chicago Press: Chicago, IL, USA, 1957. [Google Scholar]
- Hakimi, S.L. P-median theorems for competitive location. Ann. Oper. Res. 1986, 6, 75–98. [Google Scholar] [CrossRef]
- Garey, M.R.; Johnson, D.S. Computers and Intractability: A Guide to NP-Completeness; W. H. Freeman: New York, NY, USA, 1979. [Google Scholar]
- Rosing, K.E.; Hillsman, E.L.; Rosing-Vogelaar, H. A note comparing optimal and heuristic solutions to the p-median problem. Geogr. Anal. 2010, 11, 86–89. [Google Scholar] [CrossRef]
- Lorena, L.A.N.; Senne, E.L.F. Local search heuristics for capacitated p-median problems. Netw. Spat. Econ. 2003, 3, 407–441. [Google Scholar] [CrossRef]
- Church, R.L. Cobra: A new formulation of the classic p-median location problem. Ann. Oper. Res. 2003, 122, 103–120. [Google Scholar] [CrossRef]
- Berman, O.; Drezner, Z. The p-median problem under uncertainty. Eur. J. Oper. Res. 2008, 189, 19–30. [Google Scholar] [CrossRef]
- Levin, Y.; Ben-Israel, A. A Heuristic Method for Multifacility Location Problems. Comput. Oper. Res. 2004, 31, 257–272. [Google Scholar] [CrossRef] [Green Version]
- Toregas, C.; Revelle, C.; Bergman, L. The location of emergency services. Oper. Res. 1971, 19, 93–95. [Google Scholar] [CrossRef]
- Church, R.L.; Revelle, C. The Maximal Covering Location Problem. Pap. Reg. Sci. Assoc. 1974, 32, 101–118. [Google Scholar] [CrossRef]
- Daskin, M.S. A maximum expected covering location model: Formulation, properties and heuristic solution. Transp. Sci. 1983, 17, 48–70. [Google Scholar] [CrossRef] [Green Version]
- ReVelle, C.; Hogan, K. The maximum availability location problem. Transp. Sci. 1989, 23, 192–200. [Google Scholar] [CrossRef]
- Berman, O.; Krass, D. The generalized maximal covering location problem. Comput. Oper. Res. 2002, 29, 563–581. [Google Scholar] [CrossRef]
- Tian, S.; Hua, G.; Cheng, T.C.E. Optimal Deployment of Charging Piles for Electric Vehicles Under the Indirect Network Effects. Asia-Pac. J. Oper. Res. 2019, 36, 1950007. [Google Scholar] [CrossRef]
- He, S.; Kuo, Y.H.; Wu, D. Incorporating institutional and spatial factors in the selection of the optimal locations of public electric vehicle charging facilities: A case study of Beijing, China. Transp. Res. Part C 2016, 67, 131–148. [Google Scholar] [CrossRef]
- Xue, Y.; Wen, Z.; Ji, X.; Bressers, H.T.A.; Zhang, C. Location optimization of urban mining facilities with maximal covering model in GIS: A case of China. J. Ind. Ecol. 2017, 21, 913–923. [Google Scholar] [CrossRef]
- Kulakova, I.M.; Lebedeva, O.A.; Poltavskaya, J.O. Solving the problem of determining the optimal location of the logistics center, taking into account cost minimization. In IOP Conference Series: Materials Science and Engineering; IOP Publishing: Bristol, UK, 2020; Volume 971, p. 052009. [Google Scholar]
- Muravev, D.; Hu, H.; Zhou, H.; Pamucar, D. Location optimization of CR express international logistics centers. Symmetry 2020, 12, 143. [Google Scholar] [CrossRef] [Green Version]
- Stienen, V.F.; Wagenaar, J.C.; den Hertog, D.; Fleuren, H.A. Optimal depot locations for humanitarian logistics service providers using robust optimization. Omega 2021, 104, 102494. [Google Scholar] [CrossRef]
- Rabe, M.; Gonzalez-Feliu, J.; Chicaiza-Vaca, J.; Tordecilla, R.D. Simulation-Optimization Approach for Multi-Period Facility Location Problems with Forecasted and Random Demands in a Last-Mile Logistics Application. Algorithms 2021, 14, 41. [Google Scholar] [CrossRef]
- Lasa Bureau of Statistics. Lhasa Statistical Yearbook 2016–2020. Available online: www.lasa.gov.cn (accessed on 3 May 2022).
- Lasa Municipal Postal Administration. Monthly Operation Report on Postal Industry in Lhasa (2016–2020). Available online: Xz.spb.gov.cn/xzyzglj/c104416/indexshi.shtml (accessed on 3 May 2022).
- Koehler, A.B.; Snyder, R.D.; Ord, J.K. Forecasting models and prediction intervals for the multiplicative Holt–Winters method. Int. J. Forecast. 2001, 17, 269–286. [Google Scholar] [CrossRef] [Green Version]
- Ripley, B.D. Pattern Recognition and Neural Networks; Cambridge University Press: Cambridge, UK, 2009. [Google Scholar]
Figure 1.
Number of packages sent from Lhasa between January 2016 and March 2021.
Figure 1.
Number of packages sent from Lhasa between January 2016 and March 2021.
Figure 2.
Flowchart illustrating how logistics centers are located in rural areas.
Figure 2.
Flowchart illustrating how logistics centers are located in rural areas.
Figure 3.
Forecasting logistic demand with the Holt–Winters method. (The Holt–Winters multiplicative model fits real data well in the testing period and provides a relatively high prediction in the future).
Figure 3.
Forecasting logistic demand with the Holt–Winters method. (The Holt–Winters multiplicative model fits real data well in the testing period and provides a relatively high prediction in the future).
Figure 4.
(a). Allocated number of receiving packages in each town. (b). Allocated number of sending packages in each town. (As shown in the figure, towns around downtown Lhasa are predicted to have relatively high demand for sending and receiving express packages in 2025. The demand varies greatly between different towns).
Figure 5.
Number of covered villages under different service radius and center numbers. (Due to cost considerations, total number of logistic centers is limited, as well as the service radius. We have to choose a feasible plan that can cover as many villages as possible with limited cost).
Figure 5.
Number of covered villages under different service radius and center numbers. (Due to cost considerations, total number of logistic centers is limited, as well as the service radius. We have to choose a feasible plan that can cover as many villages as possible with limited cost).
Figure 6.
Spatial distribution of the selected logistic centers and covered demand points. (This figure shows how the 22 logistic centers cover 294 villages in Lhasa).
Figure 6.
Spatial distribution of the selected logistic centers and covered demand points. (This figure shows how the 22 logistic centers cover 294 villages in Lhasa).
Figure 7.
Results of maximal covering model, p-median model, and set covering model. (This figure shows 3 locating plans produced from 3 models. Although the maximal covering model cannot cover all villages, it is still considered the most feasible plan.).
Figure 7.
Results of maximal covering model, p-median model, and set covering model. (This figure shows 3 locating plans produced from 3 models. Although the maximal covering model cannot cover all villages, it is still considered the most feasible plan.).
Table 1.
Overview of the Holt–Winters model testing results. (The Multiplicative model performed better with lower RMSE).
Table 1.
Overview of the Holt–Winters model testing results. (The Multiplicative model performed better with lower RMSE).
| Holt–Winters Method | Adjusted R2 of Training Data | RMSE of Training Data | RMSE of Testing Data |
|---|
| Additive | 0.786 | 6.13 | 17.056 |
| Multiplicative | 0.851 | 4.91 | 9.66 |
Table 2.
Logistic demand allocation from city to counties. (Total prediction of Lhasa is allocated to its subregions based on economy and population).
Table 2.
Logistic demand allocation from city to counties. (Total prediction of Lhasa is allocated to its subregions based on economy and population).
| County | Gross Regional Product
(million CNY) | Population | Sending Packages (thousand pkgs) | Receiving Packages (thousand pkgs) |
|---|
| Duilong | 7410 | 63,626 | 1979 | 11,663 |
| Dazi | 2112 | 35,430 | 564 | 6495 |
| Linzhou | 2292 | 73,128 | 612 | 13,405 |
| Dangxiong | 2281 | 62,344 | 609 | 11,428 |
| Nimu | 1029 | 35,125 | 275 | 6439 |
| Qushui | 1932 | 41,999 | 516 | 7699 |
| Mozhu | 3955 | 56,689 | 1056 | 10,391 |
| Chengguan | 31,287 | 186,060 | 10,388 | 76,480 |
| Total | 52,297 | 554,400 | 16,000 | 144,000 |
Table 3.
Demand allocation from county to towns in Qushui county. (Prediction of a subregion in Lhasa is further allocated to towns based on economy and population. This table shows the secondary allocation results in 1 of 8 counties).
Table 3.
Demand allocation from county to towns in Qushui county. (Prediction of a subregion in Lhasa is further allocated to towns based on economy and population. This table shows the secondary allocation results in 1 of 8 counties).
| Town | Population | Number of Industrial
Enterprises | Number of
Supermarkets | Sending Packages (thousand pkgs) | Receiving Packages (thousand pkgs) |
|---|
| Nanmu | 3438 | 1 | 6 | 57.9 | 714.6 |
| Daga | 8767 | - | 3 | 113.2 | 1822.4 |
| Chabala | 4666 | - | 6 | 65.8 | 969.9 |
| Qushui | 9354 | - | - | 116.8 | 1944.4 |
| Niedang | 5138 | - | 10 | 76.6 | 1068.0 |
| Caina | 5674 | - | 12 | 85.8 | 1179.4 |
| Total | 37,037 | 1 | 37 | 516.1 | 7698.7 |
Table 4.
Number of covered villages under different service radius and center numbers.
Table 4.
Number of covered villages under different service radius and center numbers.
Service Radius
(Meter) | No. of Logistic Centers | No. of Covered
Demand Points | Service Radius
(Meter) | No. of Logistic Centers | No. of Covered Demand Points |
|---|
| 25,000 | 12 | 305 | 12,000 | 36 | 301 |
| 11 | 299 | 33 | 296 |
| 10 | 293 | 30 | 290 |
| 9 | 285 | 27 | 281 |
| 8 | 275 | 24 | 272 |
| 7 | 265 | 21 | 260 |
| 6 | 242 | 18 | 246 |
| 20,000 | 16 | 300 | 10,000 | 50 | 306 |
| 15 | 294 | 46 | 302 |
| 14 | 288 | 42 | 296 |
| 13 | 282 | 38 | 288 |
| 12 | 276 | 34 | 280 |
| 11 | 269 | 30 | 268 |
| 10 | 260 | 26 | 255 |
| 15,000 | 26 | 306 | 8000 | 65 | 301 |
| 24 | 299 | 60 | 295 |
| 22 | 294 | 55 | 291 |
| 20 | 286 | 50 | 285 |
| 18 | 276 | 45 | 277 |
| 16 | 265 | 30 | 268 |
| 14 | 251 | 26 | 255 |
Table 5.
Marginal efficiency under different service radii.
Table 5.
Marginal efficiency under different service radii.
Service Radius
(Meter) | No. of Logistic Centers | No. of Covered Demand Points | Marginal
Efficiency |
|---|
| 25,000 | 12 | 305 | 6 |
| 20,000 | 16 | 300 | 6 |
| 15,000 | 22 | 294 | 3 |
| 12,000 | 27 | 281 | 3 |
| 10,000 | 26 | 255 | 3 |
| 8000 | 35 | 255 | 2.4 |
Table 6.
Selected logistic centers.
Table 6.
Selected logistic centers.
Location of Logistic
Center | Number of Covered
Demand Points | Receiving Packages
(×10,000 pkgs) | Sending Packages
(×10,000 pkgs) |
|---|
| Qushui | 7 | 76.39 | 8.49 |
| Deqing | 10 | 92.53 | 10.28 |
| Banjuelin | 25 | 53.57 | 5.95 |
| Tanggu | 7 | 73.27 | 8.14 |
| Daqiong | 4 | 35.98 | 4.00 |
| Changmu | 11 | 59.90 | 6.66 |
| Chaduo | 9 | 59.48 | 6.61 |
| Jiagen | 8 | 79.41 | 8.82 |
| Xin | 25 | 52.61 | 5.85 |
| Jiba | 11 | 15.80 | 1.76 |
| Jiangre | 4 | 24.51 | 2.72 |
| Jiaru | 12 | 94.79 | 10.53 |
| Zhongsa | 44 | 153.82 | 17.09 |
| Zhujie | 21 | 83.59 | 9.29 |
| Songchan | 29 | 50.19 | 5.58 |
| Zimoze | 13 | 50.11 | 5.57 |
| Kaduo | 11 | 45.33 | 5.04 |
| Tajie | 6 | 100.90 | 11.21 |
| Danan | 5 | 49.41 | 5.49 |
| Qiareduo | 9 | 86.48 | 9.61 |
| Bangda | 9 | 39.23 | 4.36 |
| Nietang | 14 | 62.66 | 6.96 |
| Total | 294 | 1439.96 | 160.01 |
Table 7.
Cost components for revenue evaluation. (This figure shows how costs and incomes are calculated for each logistic center.).
Table 7.
Cost components for revenue evaluation. (This figure shows how costs and incomes are calculated for each logistic center.).
| Item | Equation | Parameters | Values |
|---|
| One-Time Initial Investment Cost |
| Decoration | | : decoration cost per unit area
: logistic center area |
|
| Equipment purchase | | : equipment cost per unit area
: constant equipment cost |
|
| Vehicle purchase | | : number of packages with short delivery distance per day
: tricycle delivery efficiency (packages/tricycle·day)
: tricycle price
: number of packages with long delivery distance per day
: microvan delivery efficiency (packages/tricycle·day)
: microvan price |
|
| Franchise fee | | : franchise fee for one express brand
: number of brands |
|
| Operating cost |
| Land rent | | : land rent per unit area |
|
| Personnel salary | | : courier delivery ability (packages/tricycle·day)
: courier salary
: operator needed per unit area
: operator salary |
|
| Personnel training | | : personnel replace ratio within a fixed time period
: training cost for one personnel |
|
| Gasoline expenses | | : (energy consumption of a tricycle) multiplies (unit price of energy)
: average number of miles traveled per tricycle in a period of time
and for microvans |
|
| Other expenses | | : shared penalty cost
(=penalty possibility × amount)
: shared compensation cost
(=compensation possibility × amount)
: daily water and electricity fee |
|
Table 8.
Revenue evaluation of the centers.
Table 8.
Revenue evaluation of the centers.
Center
Location | Yearly
Income
(CNY) | Area
(m2) | Staff | Vehicle | Yearly Cost
(CNY) | Yearly Profit
(CNY) |
|---|
| Qushui | 1,485,372 | 191 | 19 | 11 | 1,320,267 | 165,105 |
| Deqing | 1,799,166 | 231 | 22 | 13 | 1,534,960 | 264,206 |
| Tanggu | 1,424,604 | 183 | 18 | 11 | 1,278,691 | 145,913 |
| Changmu | 1,164,814 | 150 | 16 | 9 | 1,100,947 | 63,867 |
| Chaduo | 1,156,596 | 149 | 16 | 9 | 1,095,324 | 61,272 |
| Jiagen | 1,544,163 | 199 | 19 | 11 | 1,360,491 | 183,672 |
| Jiaru | 1,843,202 | 237 | 22 | 13 | 1,565,089 | 278,113 |
| Zhongsa | 2,991,001 | 385 | 32 | 19 | 2,350,394 | 640,607 |
| Zhujie | 1,625,430 | 209 | 20 | 12 | 1,416,093 | 209,337 |
| Tajie | 1,962,006 | 252 | 23 | 14 | 1,646,372 | 315,634 |
| Qiareduo | 1,681,648 | 216 | 20 | 12 | 1,454,556 | 227,092 |
| Nietang | 1,218,314 | 157 | 16 | 10 | 1,137,550 | 80,763 |
| Banjuelin | 1,041,721 | 134 | 15 | 9 | 1,016,729 | 24,993 |
| Songchan | 976,012 | 125 | 14 | 8 | 971,771 | 4240 |
| Zimoze | 974,426 | 125 | 14 | 8 | 970,687 | 3740 |
| Kaduo | 881,383 | 113 | 13 | 8 | 907,028 | −25,645 |
| Danan | 960,839 | 124 | 14 | 8 | 961,390 | −551 |
| Daqiong | 699,605 | 90 | 11 | 7 | 782,658 | −83,053 |
| Jiba | 307,167 | 39 | 8 | 5 | 514,159 | −206,992 |
| Jiangre | 476,614 | 61 | 9 | 6 | 630,091 | −153,478 |
| Bangda | 762,864 | 98 | 12 | 7 | 825,939 | −63,075 |
Table 9.
Results of Maximal Covering Model, P-median Model, and Set Covering Model.
Table 9.
Results of Maximal Covering Model, P-median Model, and Set Covering Model.
| Model | Number of Logistic Centers | Service Radius
(Meter) | Coverage Rate |
|---|
| P-median | 46 | 15,000 | 100% |
| Set Covering | 22 | unlimited | 100% |
Maximal Covering
(this study) | 22 | 15,000 | 89% |
| Publisher’s Note: MDPI stays neutral with regard to jurisdictional claims in published maps and institutional affiliations. |
© 2022 by the authors. Licensee MDPI, Basel, Switzerland. This article is an open access article distributed under the terms and conditions of the Creative Commons Attribution (CC BY) license (https://creativecommons.org/licenses/by/4.0/).


