
CO2 Emission Reduction Potential of Road Transport to Achieve Carbon Neutrality in China


Abstract
:1. Introduction
- First, taking into account private road transport, the total CO2 emissions of China’s road transport can be calculated and predicted more comprehensively and accurately.
- Second, future policy scenarios with emerging technologies and markets that are aimed at significantly enhancing the CO2 emission reduction potential of road transport are introduced.
- Third, the contribution of key factors that influence road transport CO2 in different scenarios are decomposed to support policy design and decision-making.
2. Literature Review
2.1. Calculation of Road Transport CO2 Emissions
2.2. Influencing Factors of Road Transport CO2 Emissions
2.3. Emission Reduction Potential of Low-Carbon Transport Policy
3. Methods
3.1. Research Framework
3.2. Road Transport CO2 Emission Calculation
3.3. Low Emissions Analysis Platform (LEAP)
3.4. Log-Mean Divisia Index (LMDI) Method
4. Scenario Setting
4.1. Business-as-Usual (BAU) Scenario
4.2. Clean Electricity (CE) Scenario
4.3. Fuel Economy Improvement (FEI) Scenario
4.4. Shared Autonomous Vehicles (SAV) Scenario
4.5. CO2 Emission Trading (CET) Scenario
4.6. Comprehensive (CS) Scenario
5. Results and Discussions
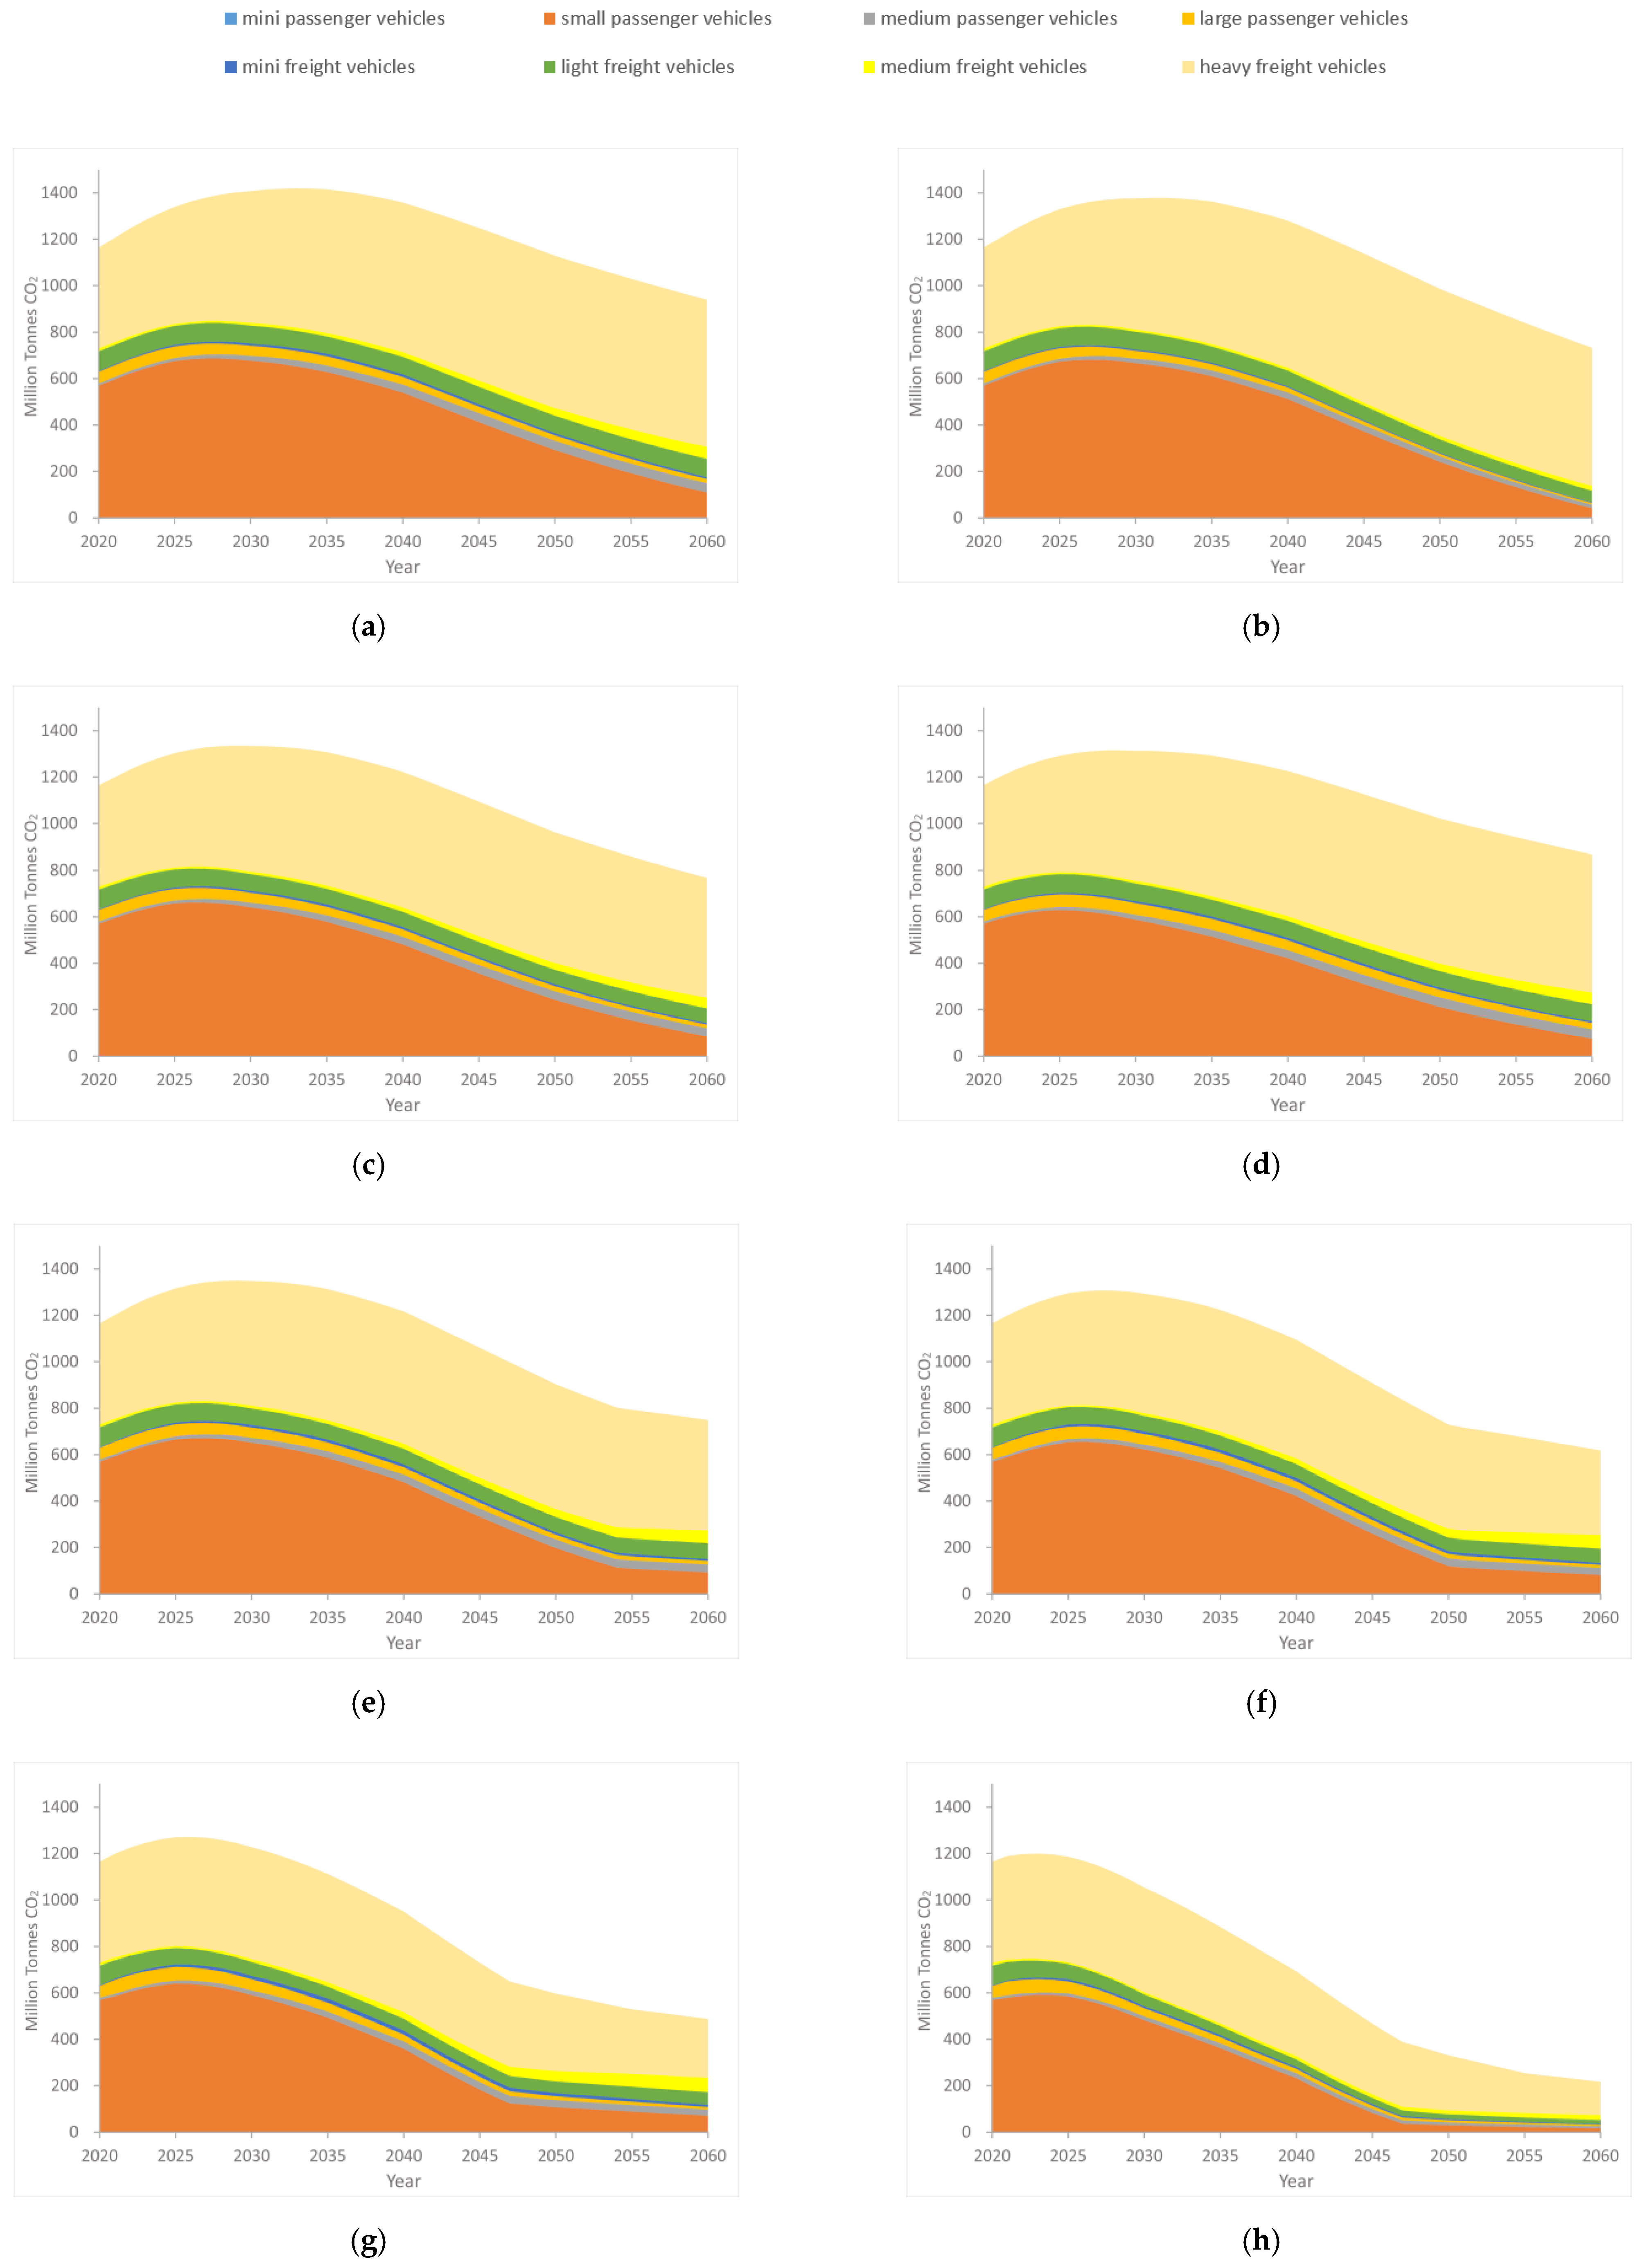
5.1. CO2 Emissions of Subsectors of Road Transport in Different Scenarios
5.2. CO2 Emission Reduction Potential of Road Transport in Different Scenarios
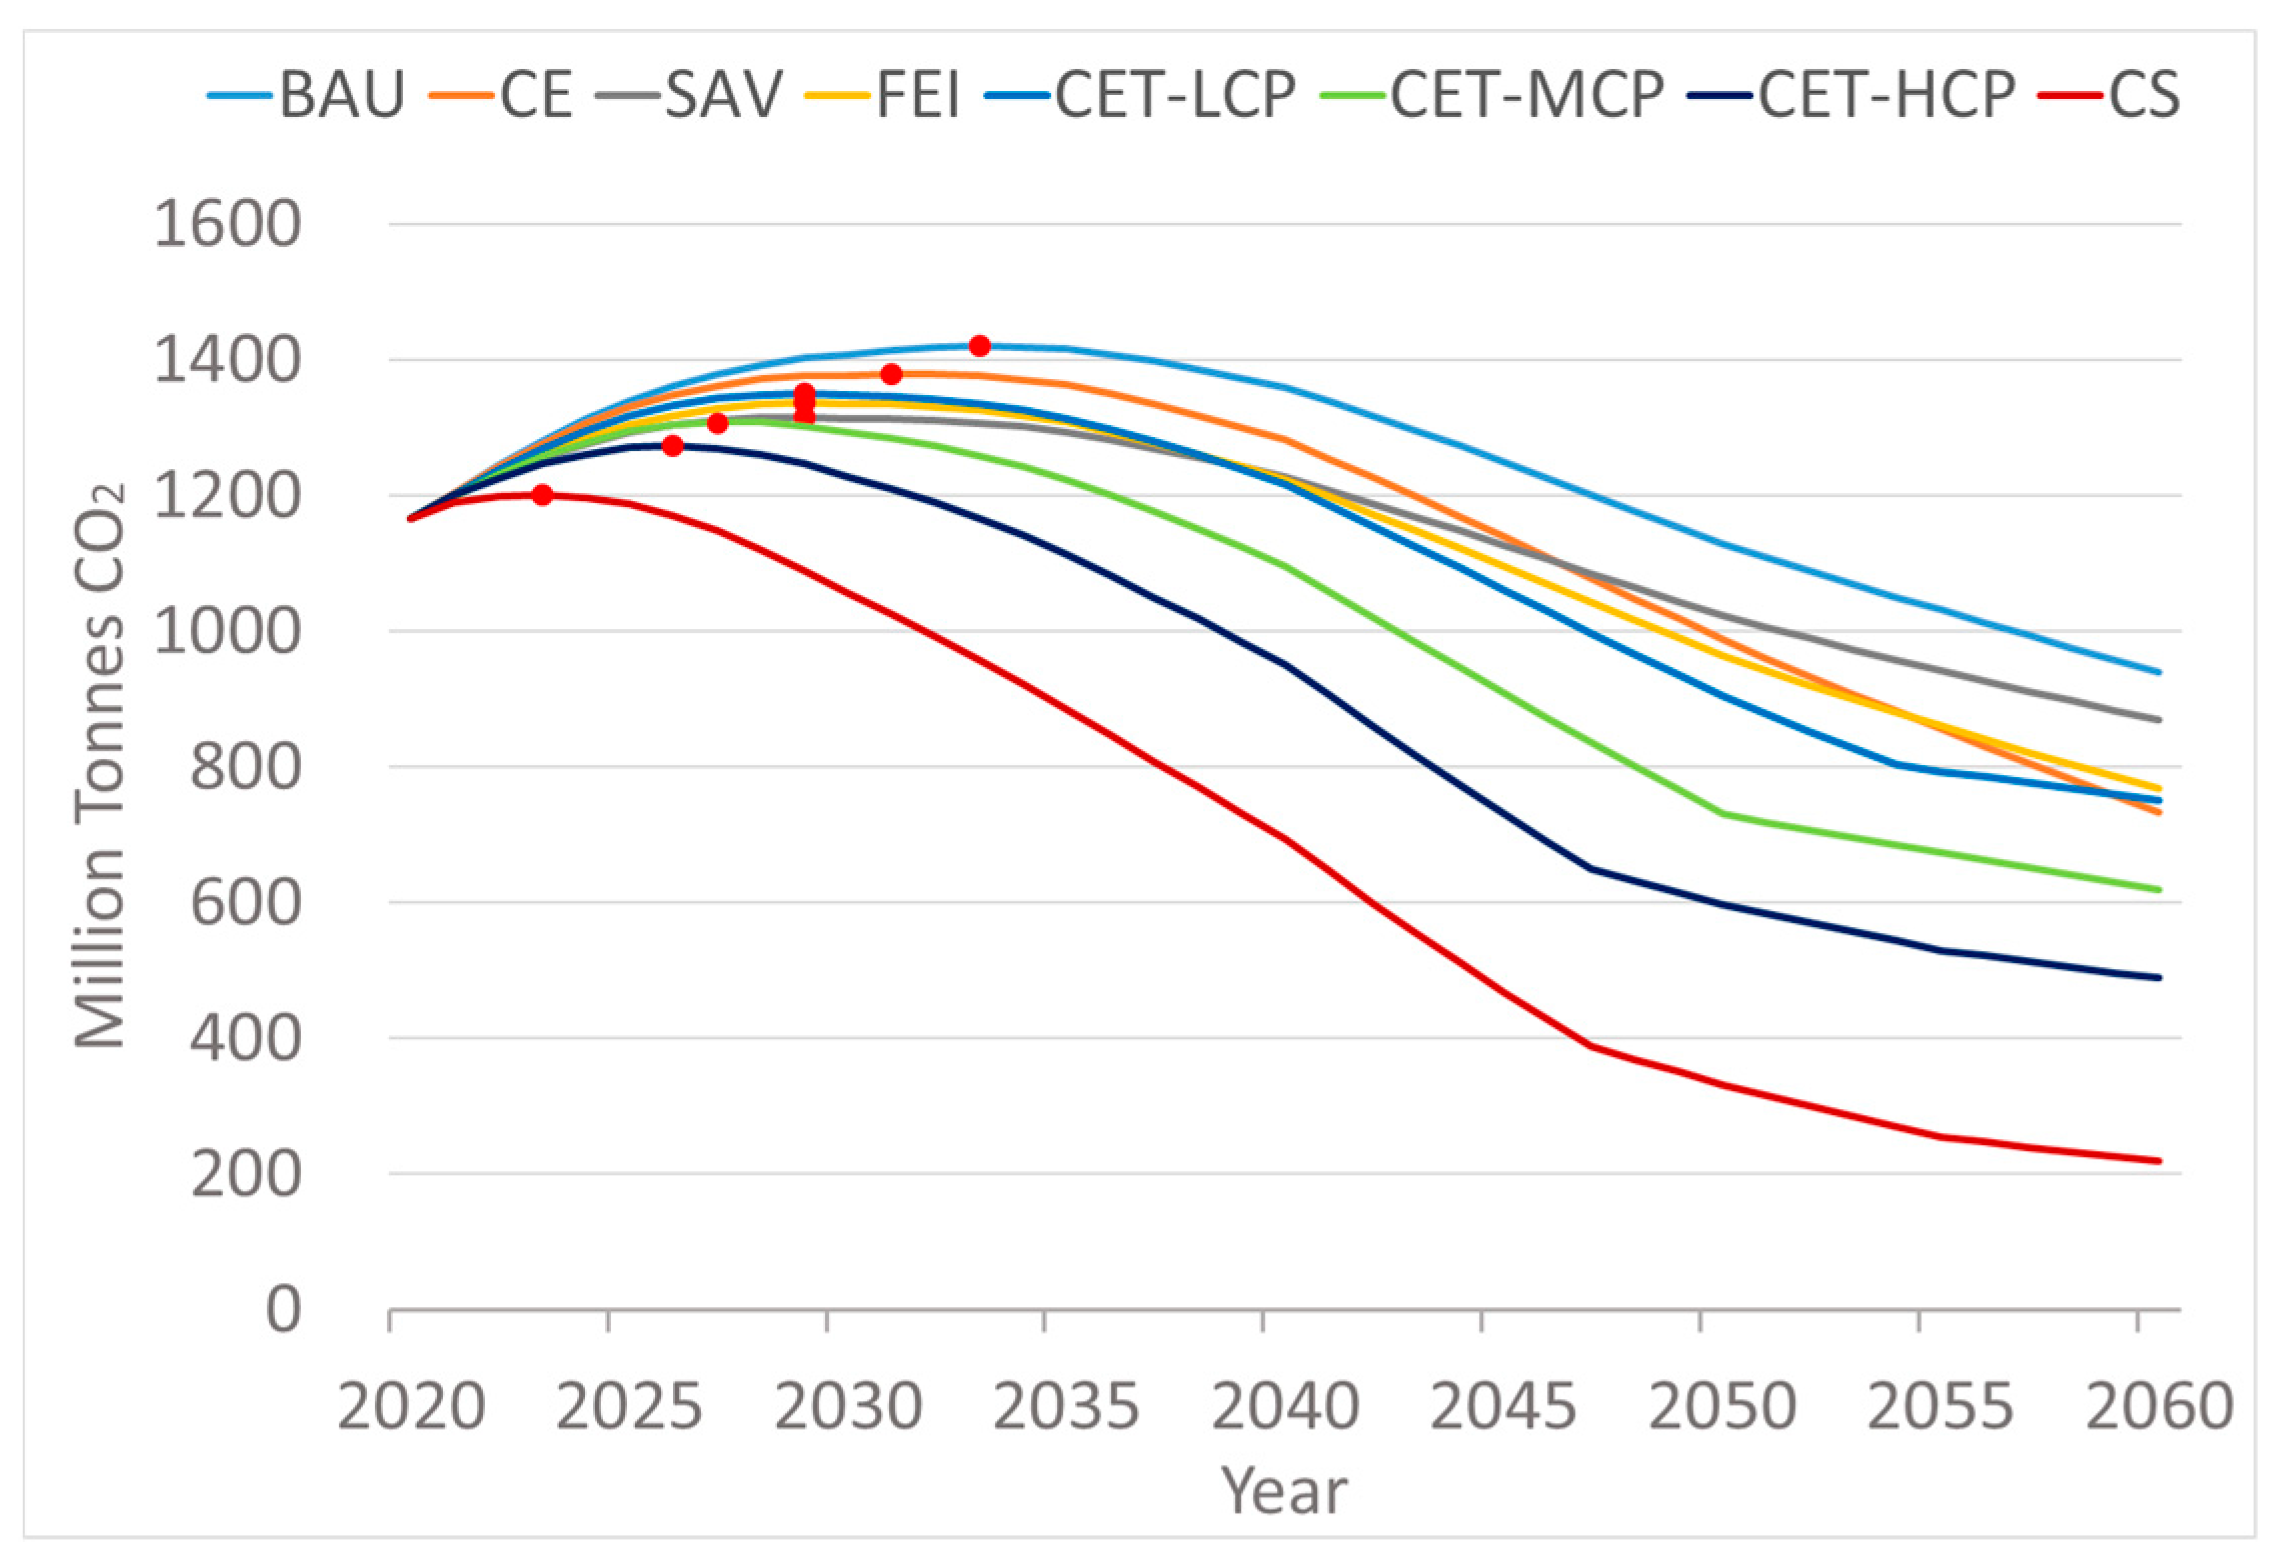
5.2.1. Total CO2 Emissions of Road Transport in Different Scenarios
5.2.2. Comparison with Previous Studies
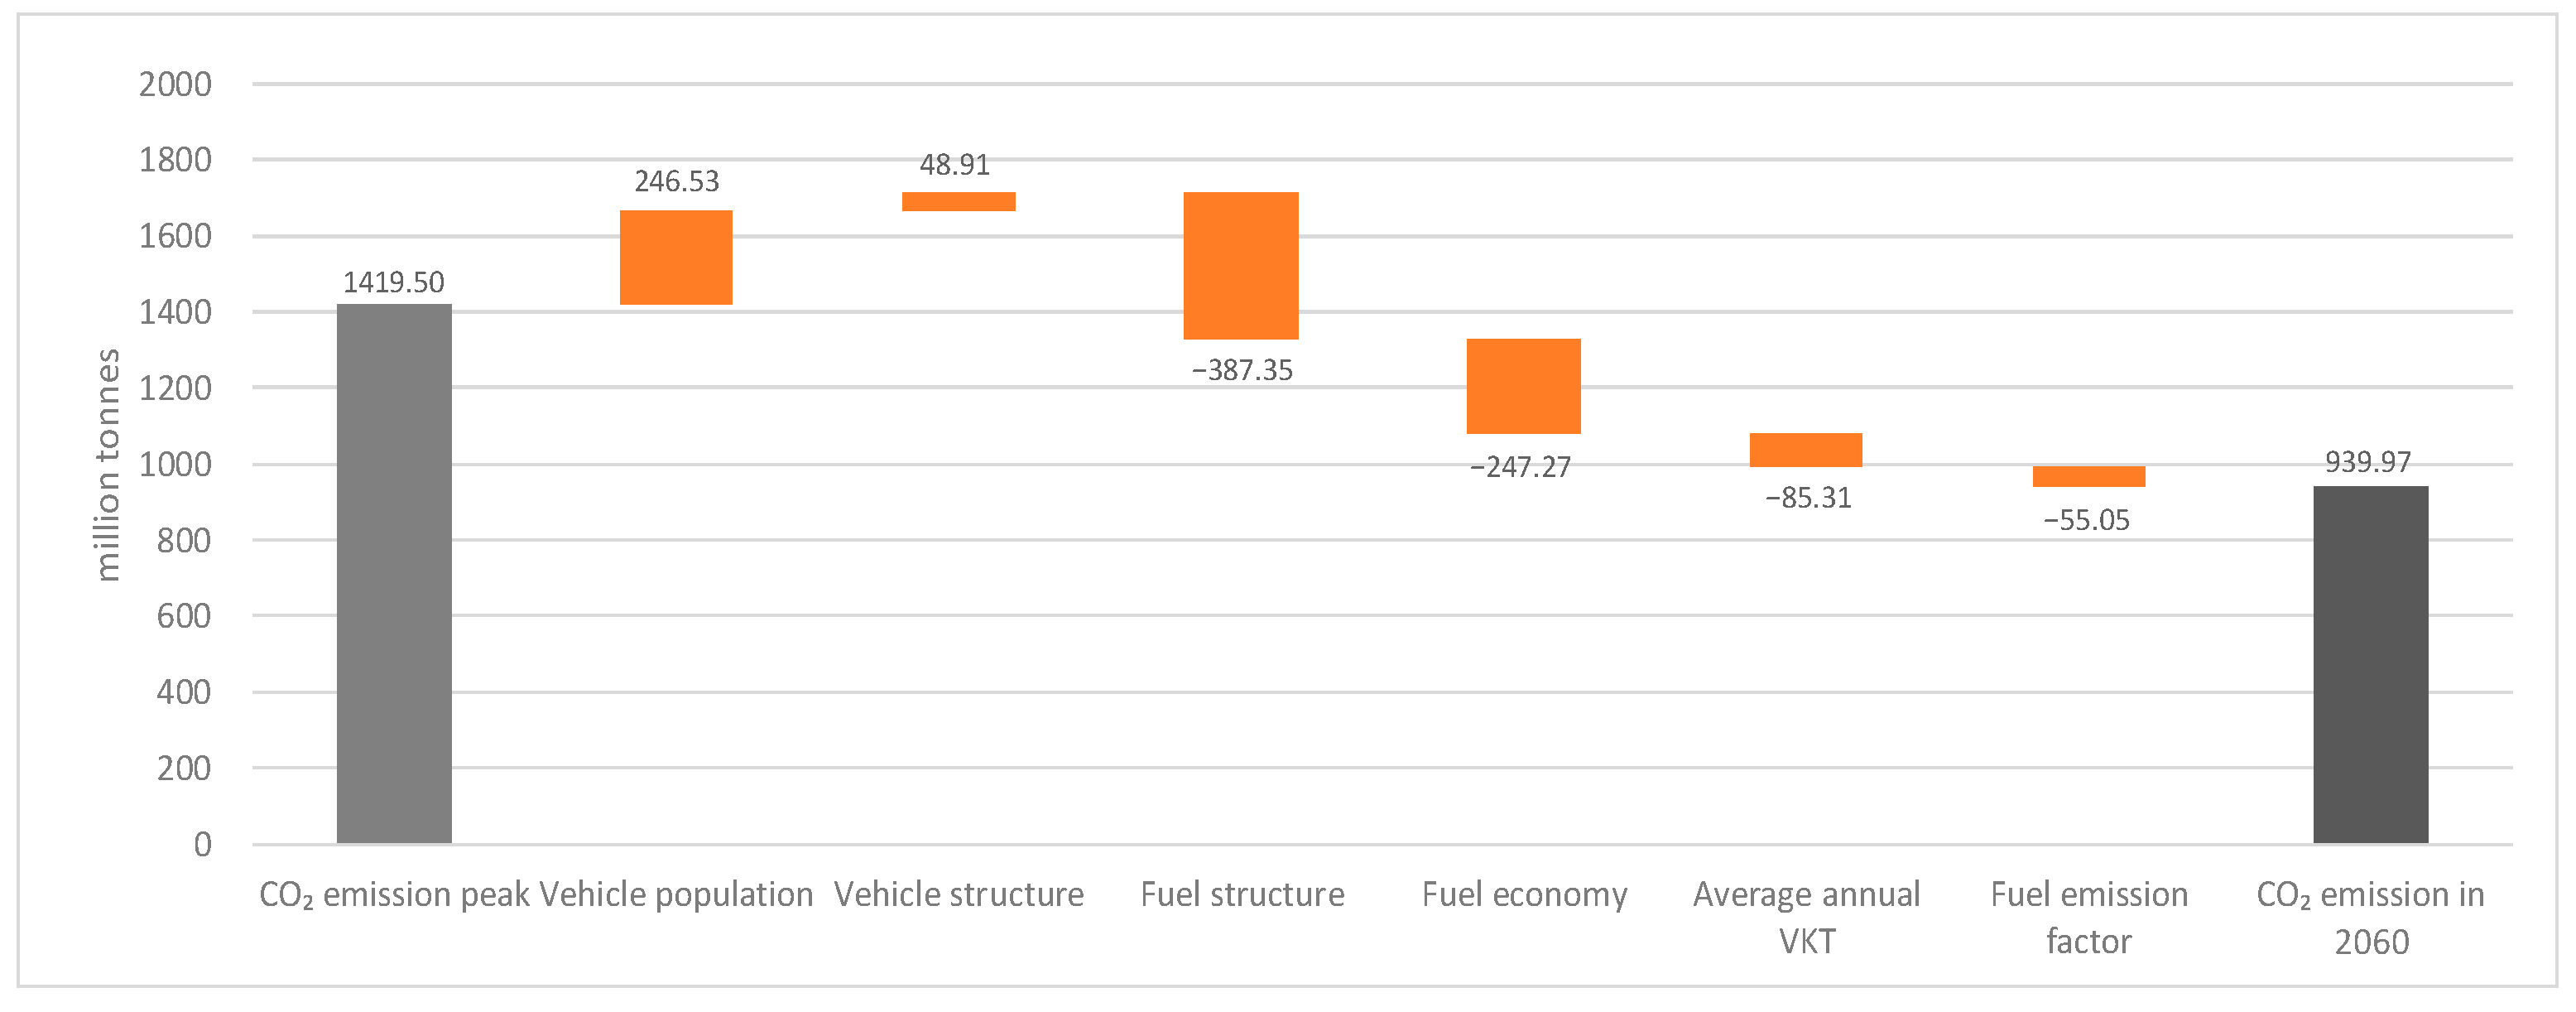
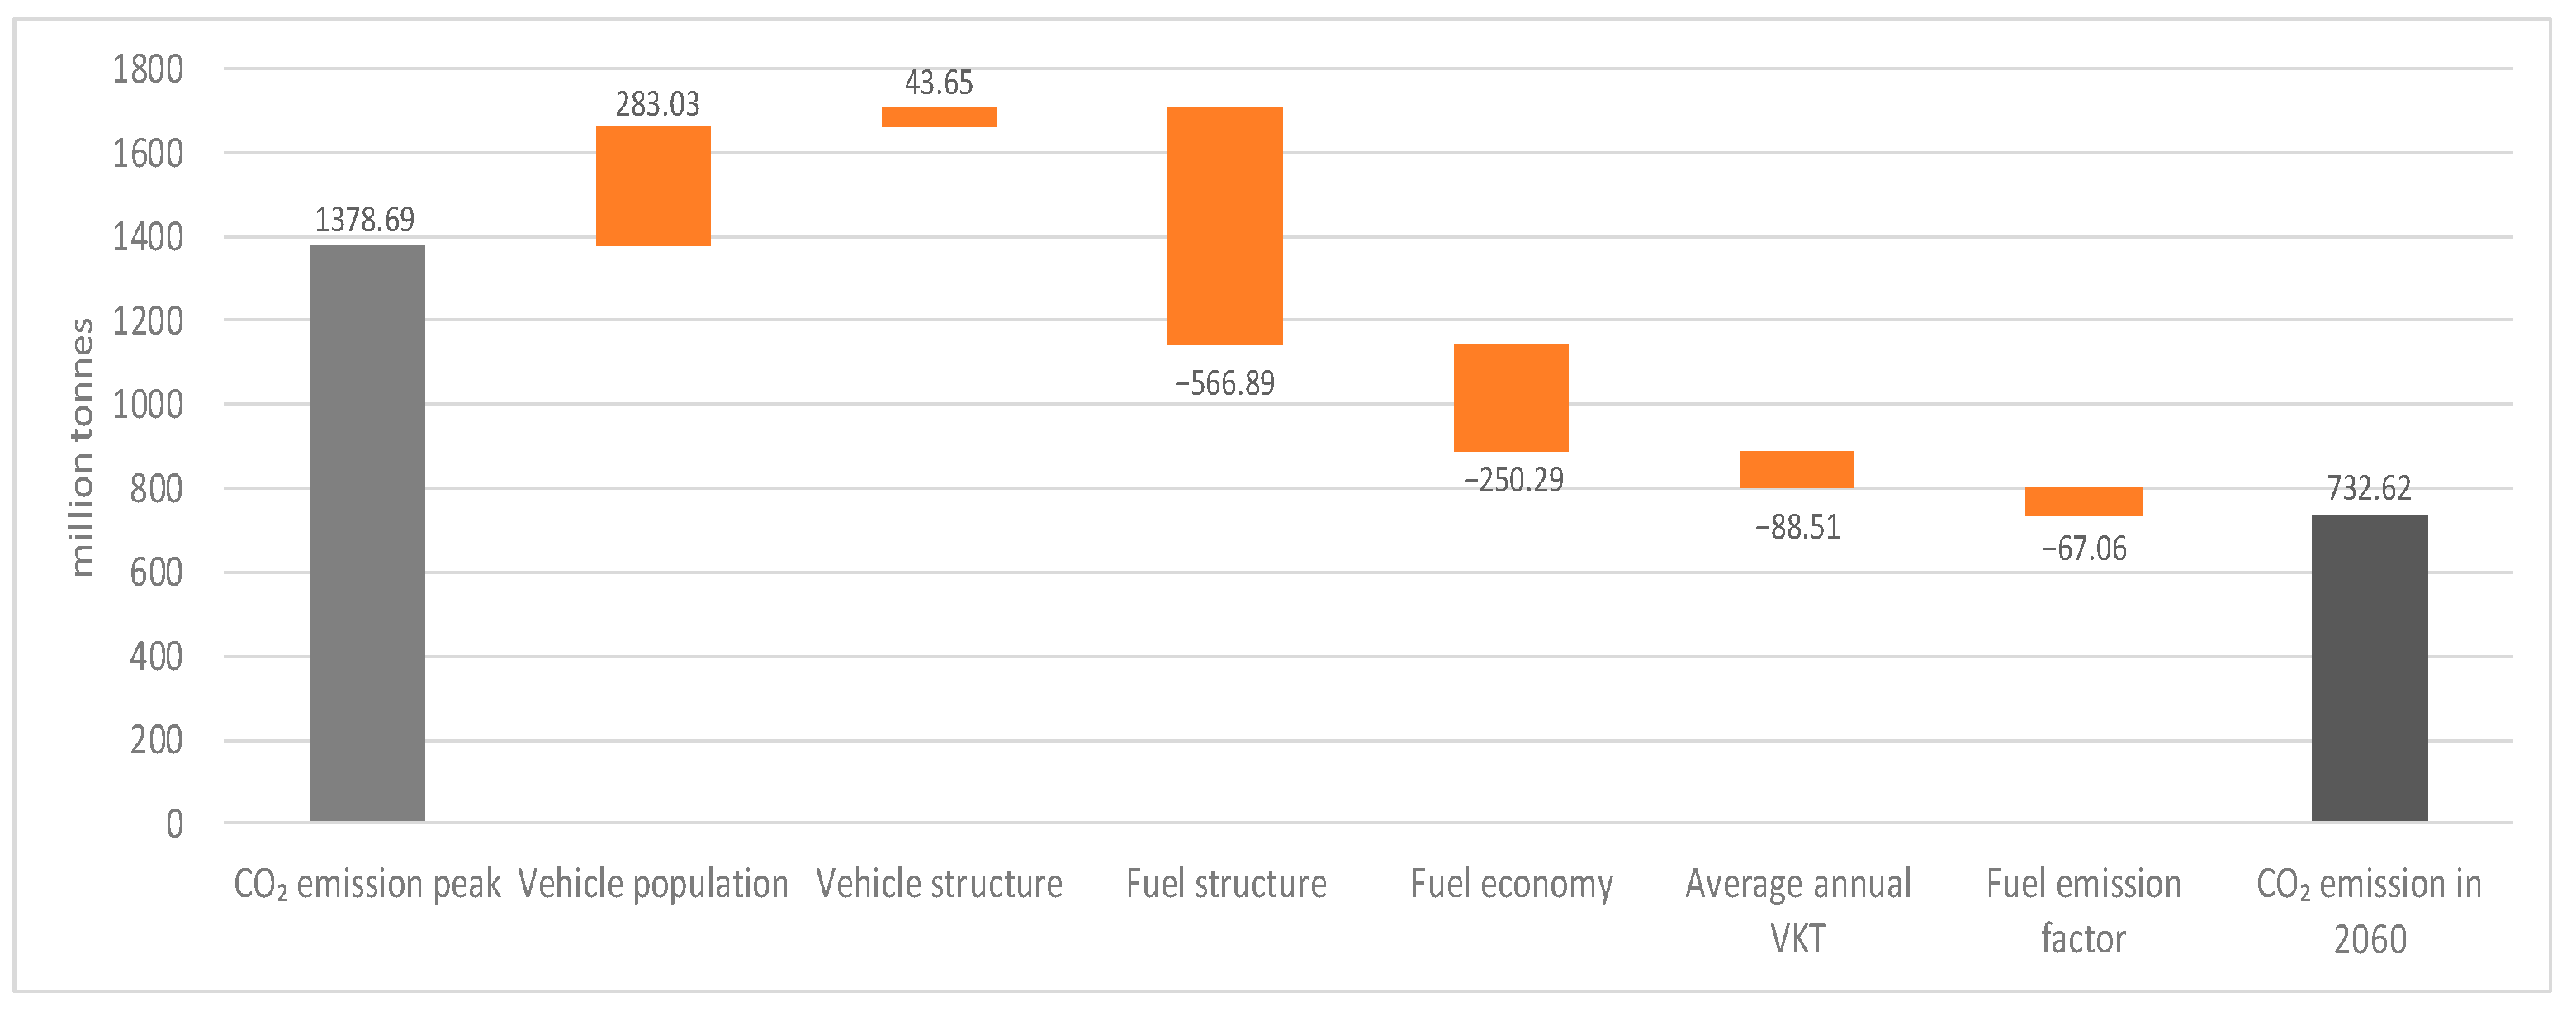
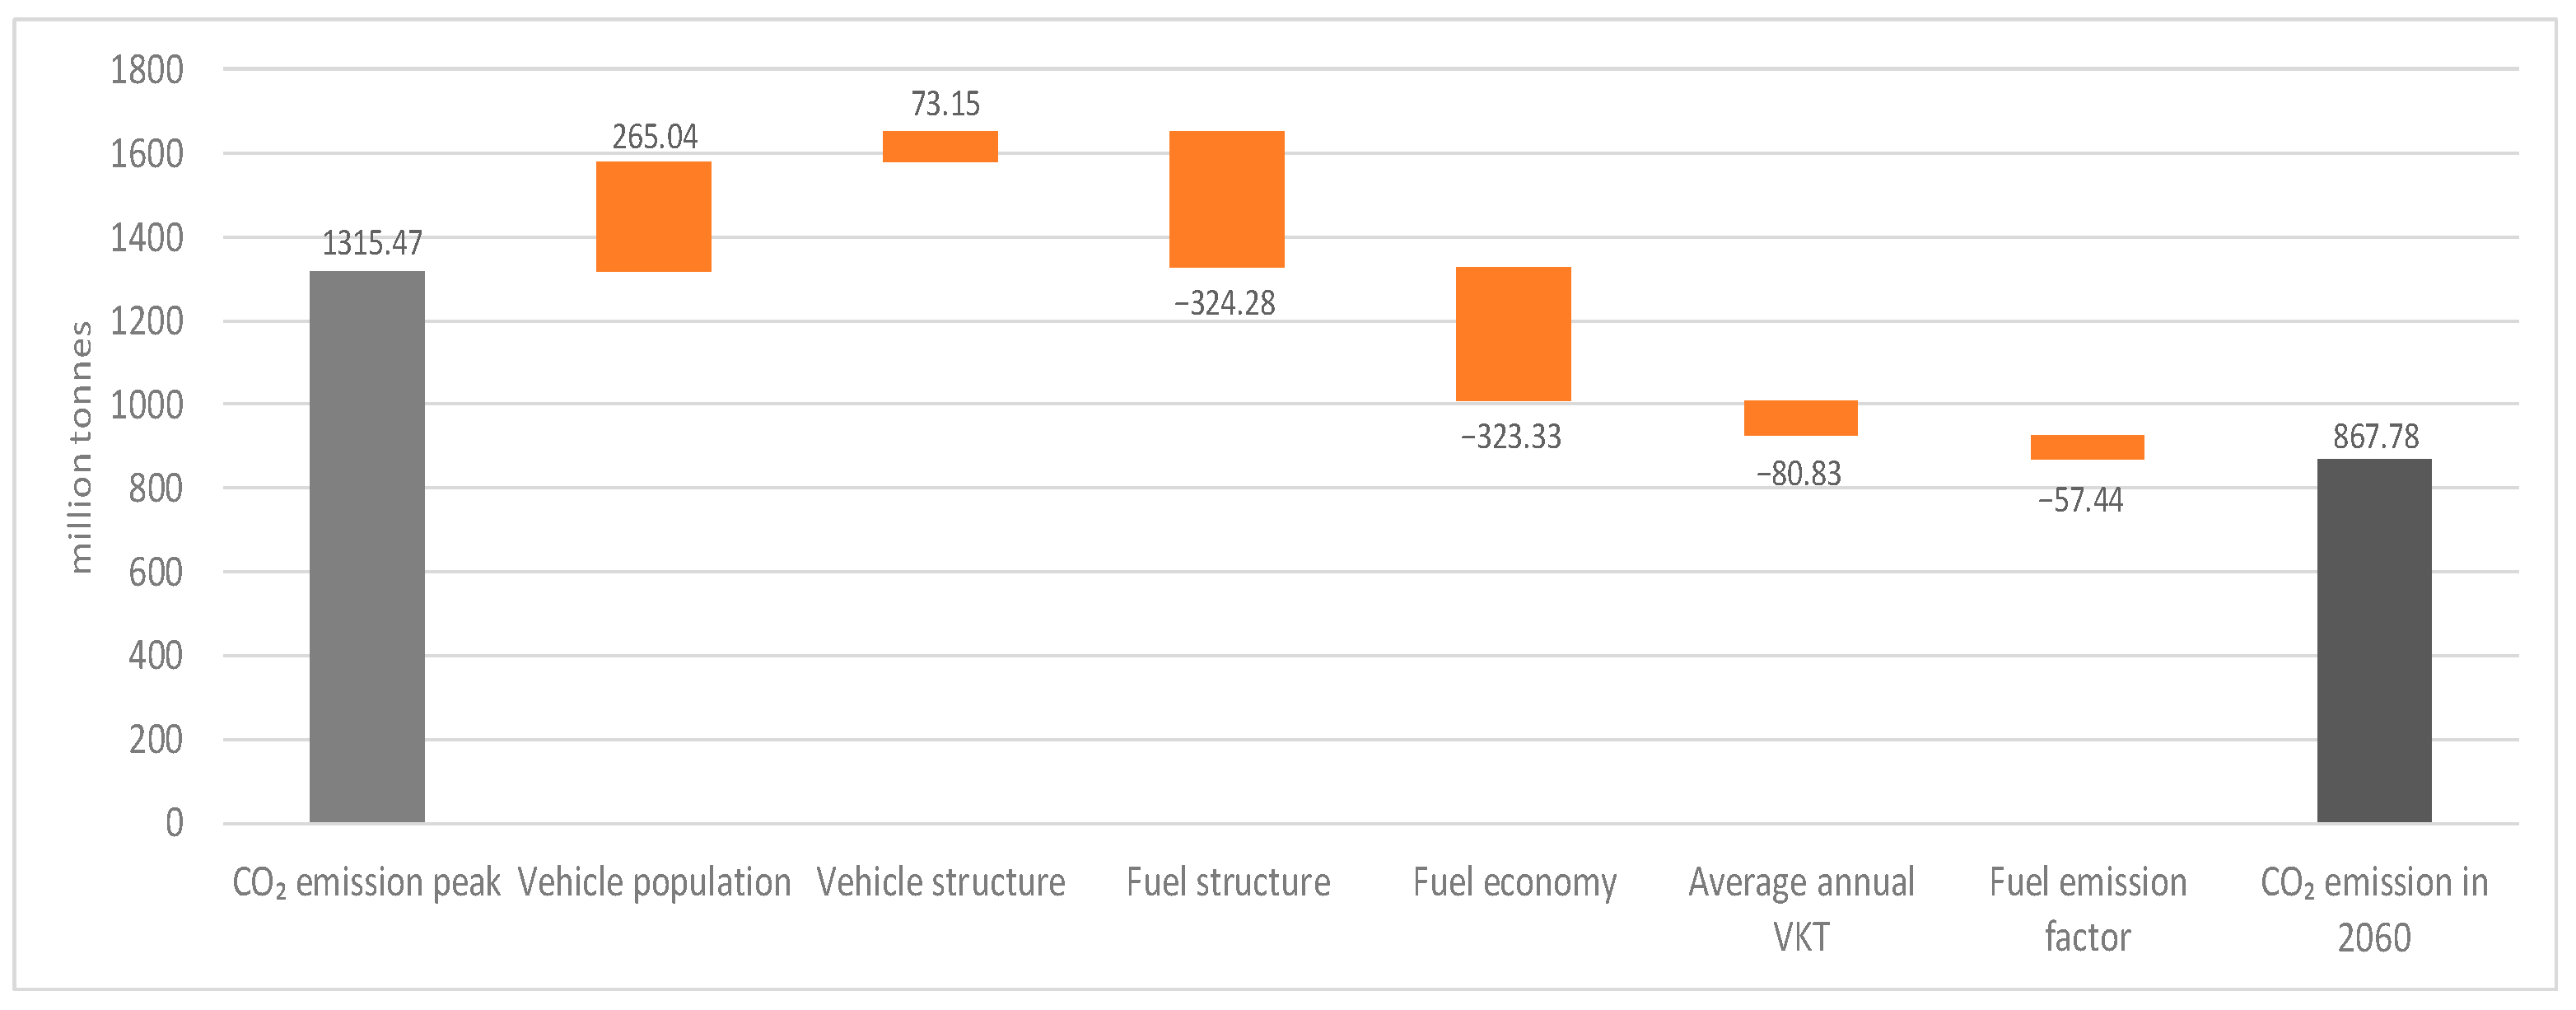
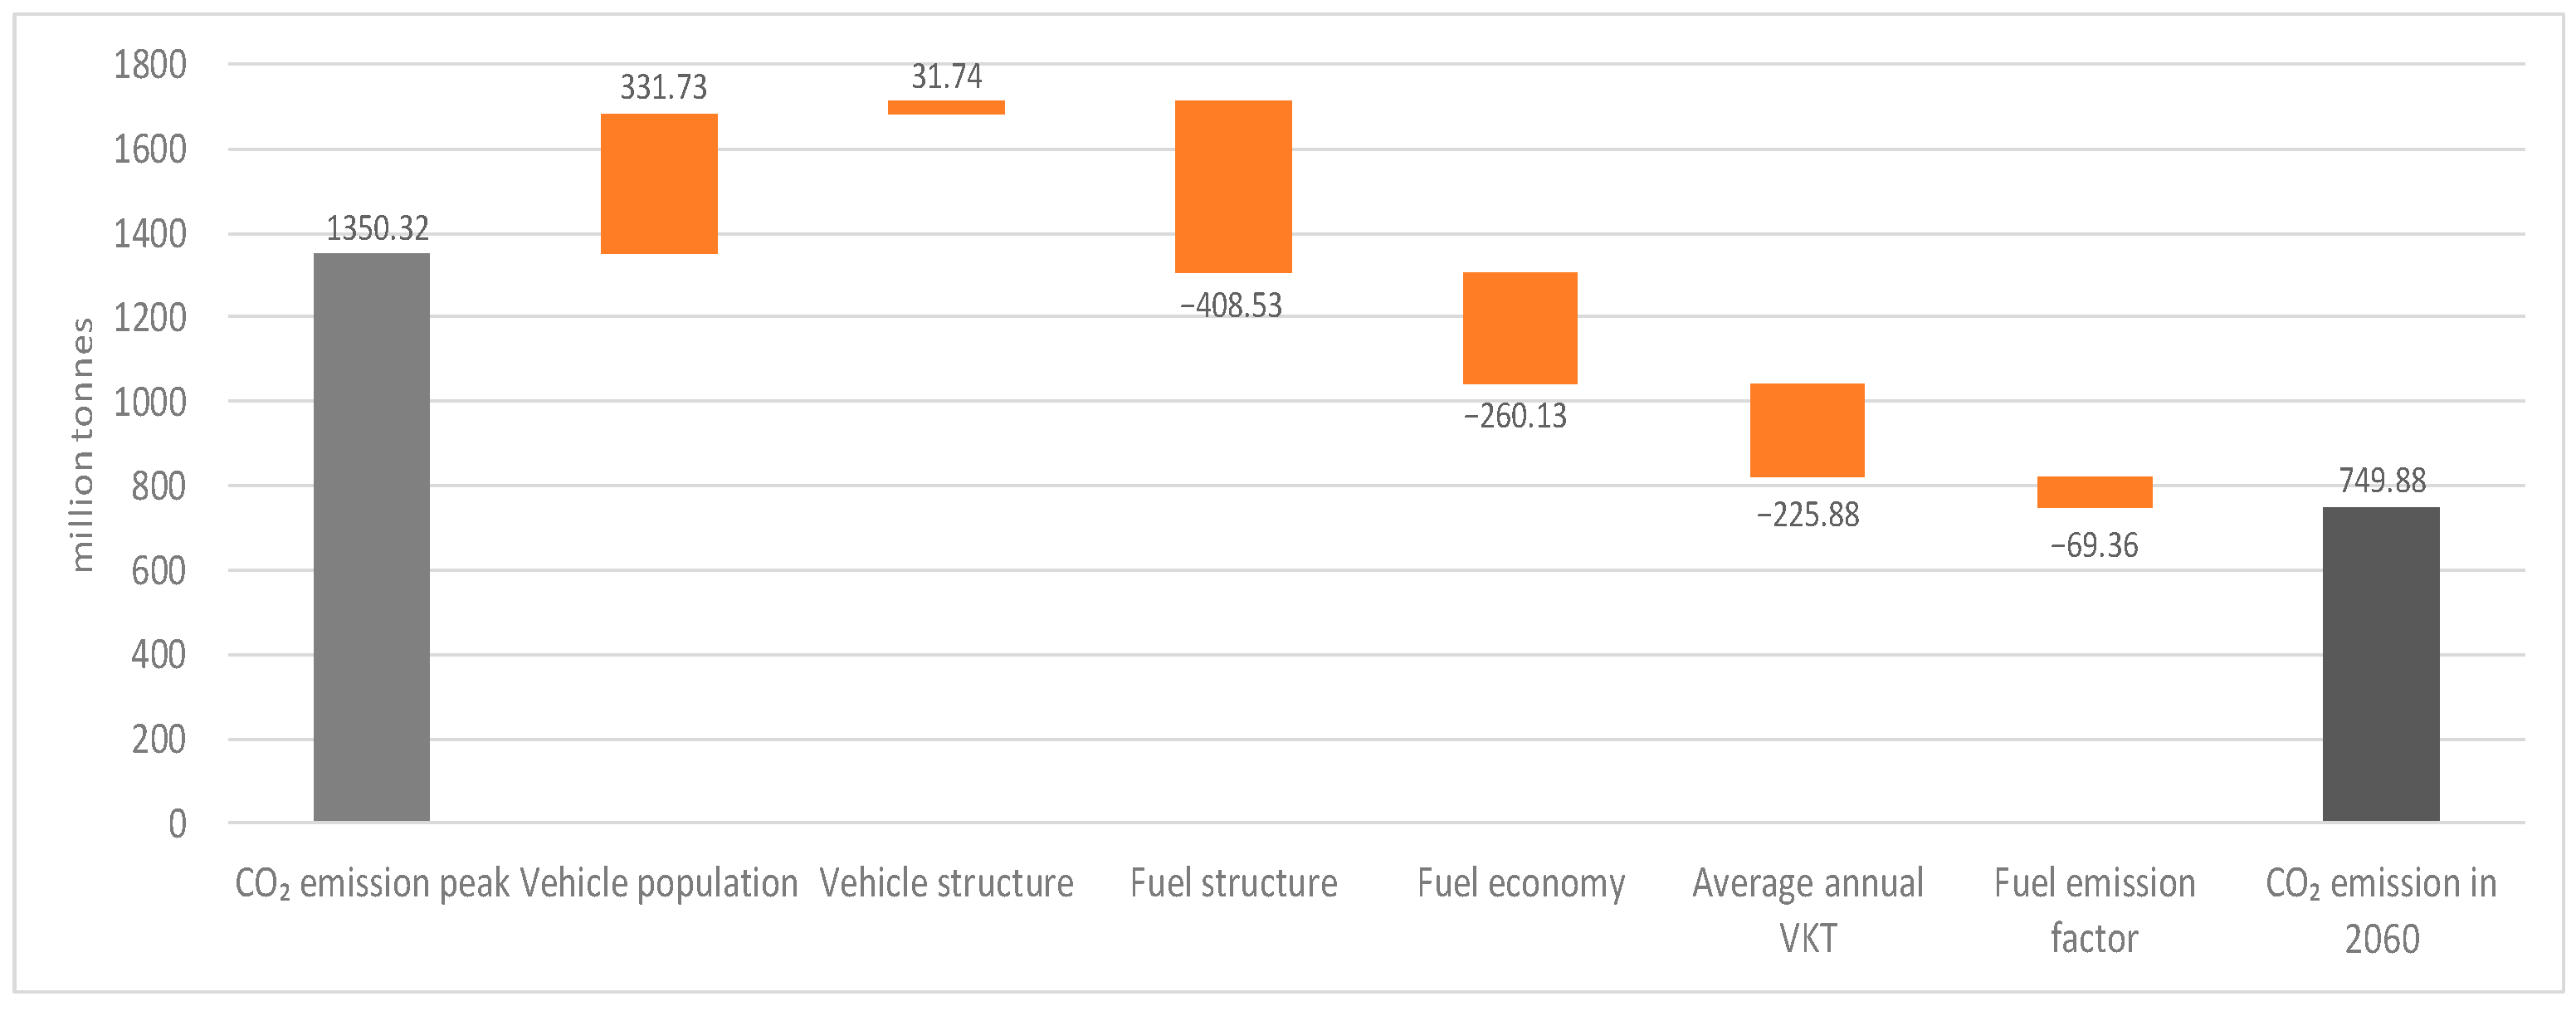
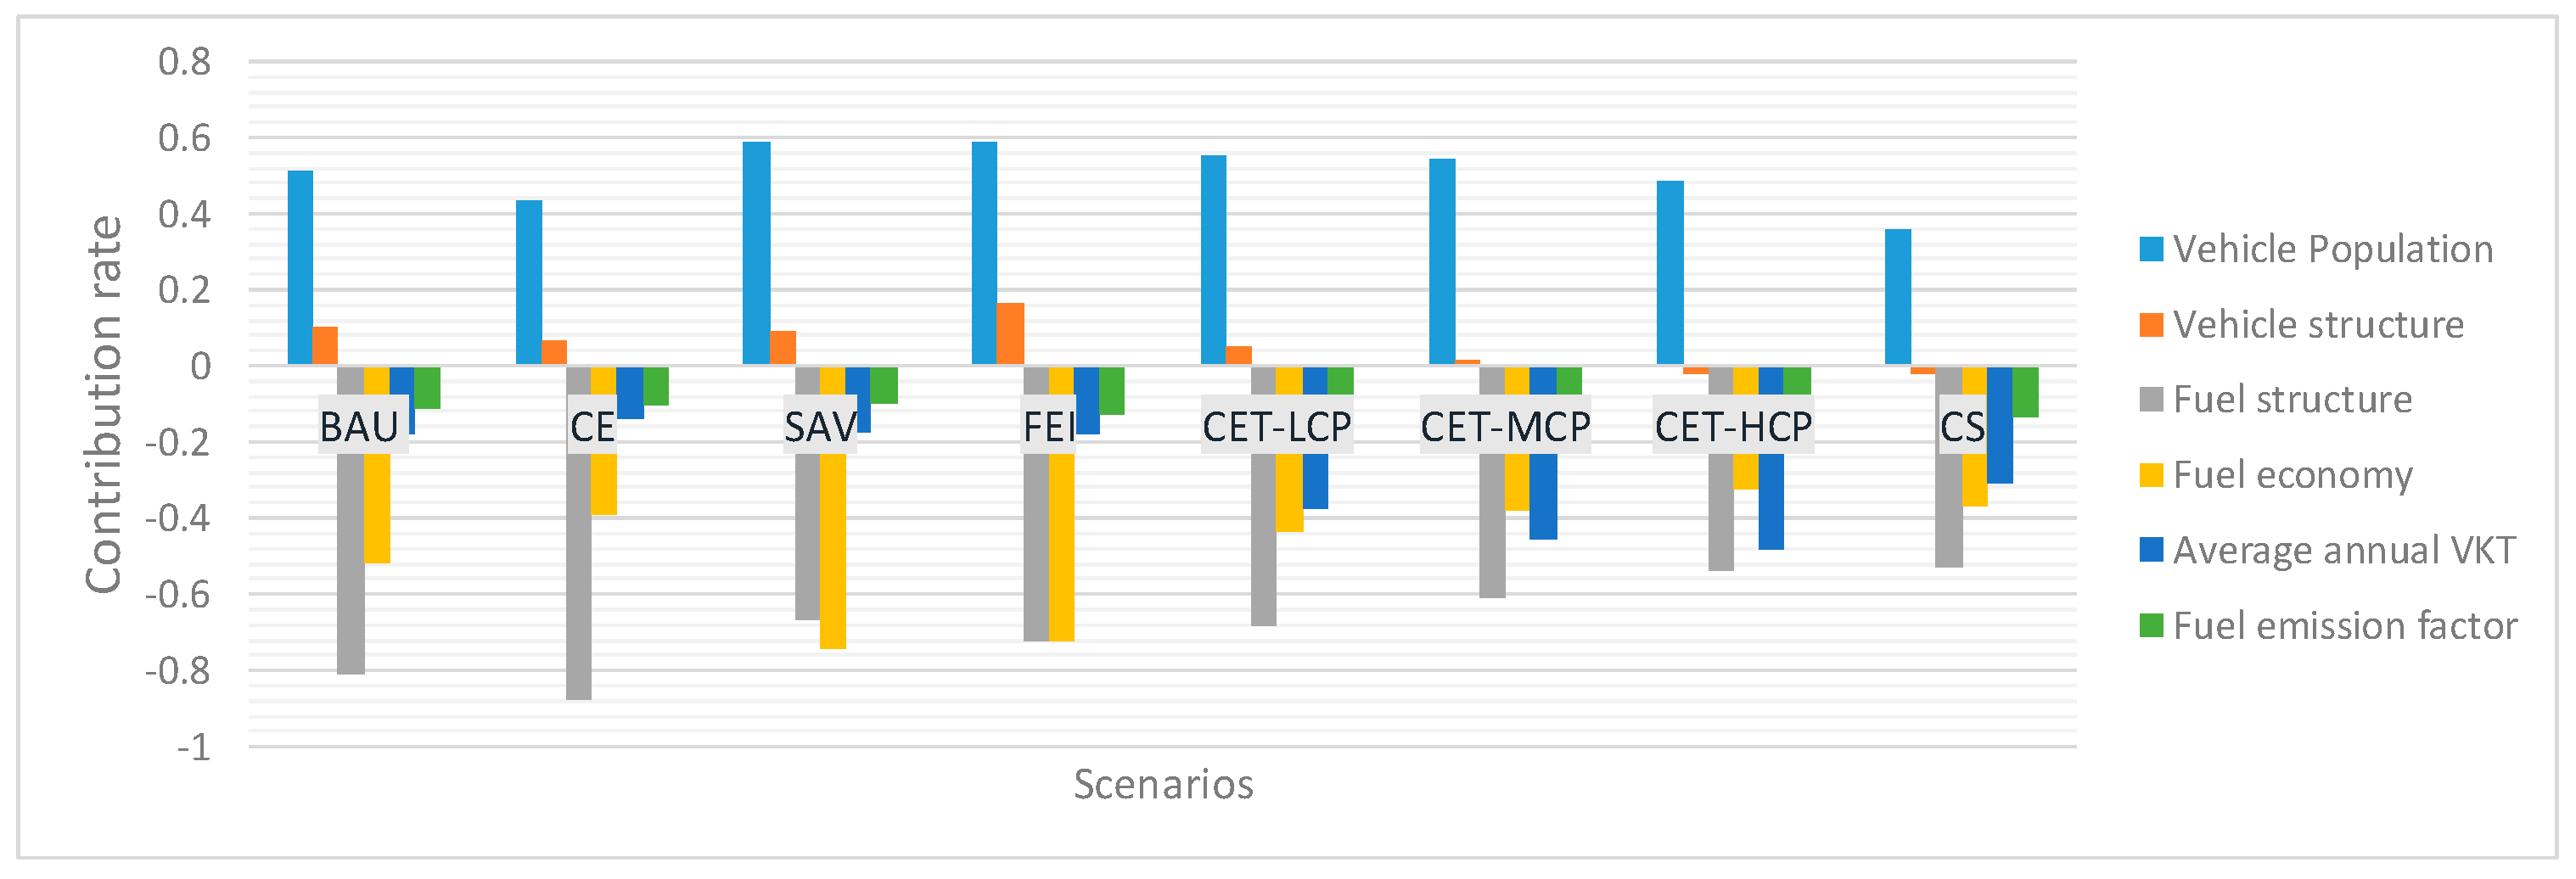
5.3. Factor Contribution to Road Transport CO2 Emission Reduction
6. Conclusions and Policy Implications
- (1)
- Due to the widespread adoption of electric vehicles for passenger transport, they have a greater potential to reduce CO2 emissions than freight transport in the field of road transport, especially for small passenger vehicles.
- (2)
- The total CO2 emissions of road transport will peak at 1419.5 million tonnes in 2033 for the BAU scenario. In contrast, the peaks of road transport CO2 emissions for the CE, SAV, FEI, CET-LCP, CET-MCP, CET-HCP, and CS scenarios are decreasing and occur progressively earlier, as early as 2023.
- (3)
- Compared with the BAU scenario, the cumulative CO2 emission reductions of road transport from 2020–2060 for the other seven scenarios can be up to 22,501.22 million tonnes. The CO2 emission reduction potential of the seven scenarios can be ranked as follows: CS > CET-HCP > CET-MCP > FEI > CET-LCP > SAV > CE. This finding indicates that CO2 emission trading may be more effective than other policies, with a combination of policies the best.
- (4)
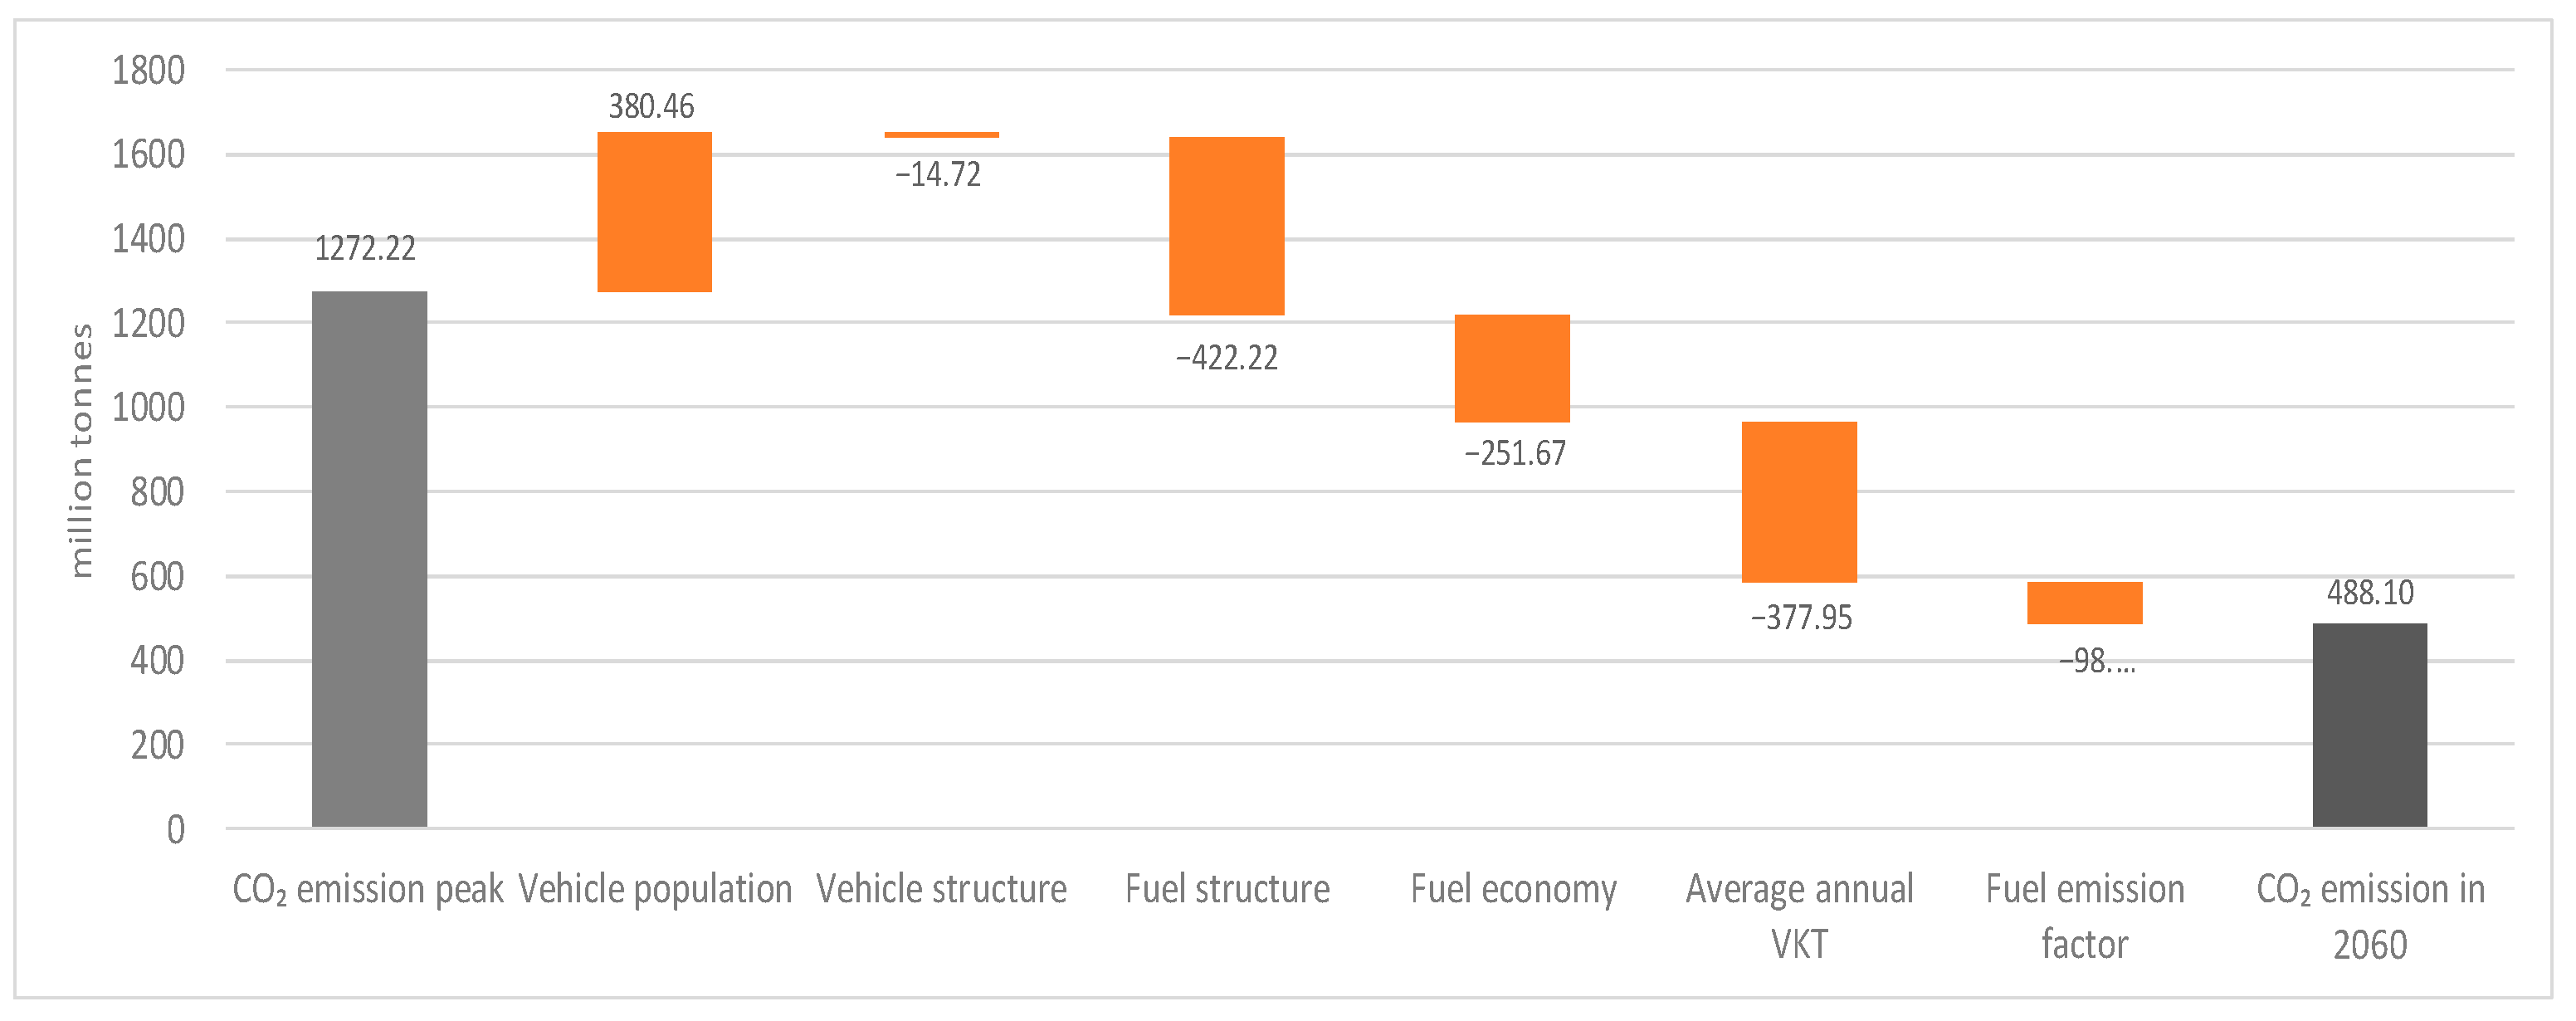
- Based on the decomposition of factors that contribute to the CO2 emission reduction of road transport from the peak year to 2060 for each scenario, it is concluded that fuel structure and fuel economy contribute most to the emission reduction, whereas the increase in vehicle population restrains the CO2 emission reduction.
- (1)
- The power industry needs to vigorously increase the proportion of clean energy in power generation, including photovoltaic, hydroelectric, wind, and nuclear powers, to further reduce CO2 emissions of electric vehicles.
- (2)
- The government should formulate relevant policies to encourage vehicle manufacturers to improve the fuel economy of both traditional internal combustion engine vehicles and new energy vehicles to reduce the energy consumption and CO2 emissions of road transportation.
- (3)
- Since private vehicles account for a large proportion of passenger transport in China, the government could implement downstream emission trading for road transport to encourage more consumers to purchase new energy vehicles.
- (4)
- To ensure the achievement of the targets of peak CO2 emissions and carbon neutrality in China, a comprehensive policy package should be designed considering all the contributing factors to the emission reduction of road transport.
Author Contributions
Funding
Data Availability Statement
Conflicts of Interest
Abbreviations
| C | total CO2 emissions of road transport |
| CP | total CO2 emissions of road passenger transport |
| CT | total CO2 emissions of road freight transport |
| NP | passenger vehicle population |
| Si | proportion of passenger vehicles of type i |
| Mi | average annual VKT of type i vehicles |
| Qik | proportion of fuels of type k for vehicles of type i |
| Fik | fuel economy of vehicles of type i with fuel type k |
| Ek | CO2 emission factor of fuel of type k |
| NT | freight vehicle population |
| Sj | proportion of freight vehicles of type j |
| Mj | average annual VKT of trucks of type j |
| Qjh | proportion of fuels of type h for freight vehicles of type j |
| Fjh | fuel economy of trucks of type j with fuel type h |
| Eh | CO2 emission factor of fuel of type h |
| ΔC | total contribution of each factor to road transport CO2 emissions |
| ΔCN | contribution of vehicle population to road transport CO2 emissions |
| ΔCS | contribution of vehicle structure to road transport CO2 emissions |
| ΔCQ | contribution of fuel structure to road transport CO2 emissions |
| ΔCF | contribution of fuel economy to road transport CO2 emissions |
| ΔCM | contribution of average annual VKT to road transport CO2 emissions |
| ΔCE | contribution of fuel CO2 emission factors to road transport CO2 emissions |
| i | type of passenger vehicles |
| j | type of freight vehicles |
| k | type of fuel used by passenger vehicles |
| h | type of fuel used by freight vehicles |
| BAU | business-as-usual scenario |
| CE | clean electricity scenario |
| FEI | fuel economy improvement scenario |
| SAV | shared autonomous vehicles Scenario |
| CET-LCP | CO2 emissions trading scenario with low carbon prices |
| CET-MCP | CO2 emissions trading scenario with mid carbon prices |
| CET-HCP | CO2 emissions trading scenario with high carbon prices |
| CS | comprehensive scenario |
References
- European Automobile Manufacturers Association (ACEA). Paving the Way to Carbon-Neutral Transport: 10-Point Plan to Help Implement the European Green Deal; ACEA: Brussels, Belgium, 2020. [Google Scholar]
- Li, W.; Bao, L.; Wang, L.; Li, Y.; Mai, X. Comparative evaluation of global low-carbon urban transport. Technol. Forecast. Soc. Chang. 2019, 143, 14–26. [Google Scholar] [CrossRef]
- Li, W.; Bao, L.; Li, Y.; Si, H.; Li, Y.M. Assessing the transition to low-carbon urban transport: A global comparison. Resour. Conserv. Recycl. 2022, 180, 106179. [Google Scholar] [CrossRef]
- Paustian, K.; Ravindranath, N.H.; Amstel, A.V. 2006 IPCC Guidelines for National Greenhouse Gas Inventories; International Panel on Climate Change: Geneva, Switzerland, 2006. [Google Scholar]
- Vuuren, D.; Hoogwijk, M.; Barker, T.; Riahi, K.; Boeters, S.; Chateau, J.; Scrieciu, S.; Vliet, J.; Masui, T.; Blok, K.; et al. Comparison of top-down and bottom-up estimates of sectoral and regional greenhouse gas emission reduction potentials. Energy Policy 2009, 37, 5125–5139. [Google Scholar] [CrossRef]
- Li, Y.; Bao, L.; Li, W.; Deng, H. Inventory and policy reduction potential of greenhouse gas and pollutant emissions of road transportation industry in China. Sustainability 2016, 8, 1218. [Google Scholar] [CrossRef] [Green Version]
- Shan, Y.; Guan, D.; Liu, J.; Mi, Z.; Liu, Z.; Liu, J.; Schroeder, H.; Cai, B.; Chen, Y.; Shao, S.; et al. Methodology and applications of city level CO2 emission accounts in China. J. Clean. Prod. 2017, 161, 1215–1225. [Google Scholar] [CrossRef] [Green Version]
- Brand, C.; Tran, M.; Anable, J. The UK transport carbon model: An integrated life cycle approach to explore low carbon futures. Energy Policy 2012, 41, 107–124. [Google Scholar] [CrossRef] [Green Version]
- Zhang, L.; Long, R.; Chen, H.; Geng, J. A review of China’s road traffic carbon emissions. J. Clean. Prod. 2019, 207, 569–581. [Google Scholar] [CrossRef]
- Liu, M.; Zhang, X.; Zhang, M.; Feng, Y.; Liu, Y.; Wen, J.; Liu, L. Influencing factors of carbon emissions in transportation industry based on CD function and LMDI decomposition model: China as an example. Environ. Impact Assess. Rev. 2021, 90, 106623. [Google Scholar] [CrossRef]
- Quan, C.; Cheng, X.; Yu, S.; Ye, X. Analysis on the influencing factors of carbon emission in China’s logistics industry based on LMDI method. Sci. Total Environ. 2020, 734, 138473. [Google Scholar] [CrossRef]
- Brand, C.; Anable, J.; Tran, M. Accelerating the transformation to a low carbon passenger transport system: The role of car purchase taxes, feebates, road taxes and scrappage incentives in the UK. Transp. Res. Part A Policy Pract. 2013, 49, 132–148. [Google Scholar] [CrossRef]
- Dineen, D.; Ryan, L.; Gallachóir, B.Ó. Vehicle tax policies and new passenger car CO2 performance in EU member states. Clim. Policy 2018, 18, 396–412. [Google Scholar] [CrossRef]
- Nayum, A.; Klöckner, C.A.; Prugsamatz, S. Influences of car type class and carbon dioxide emission levels on purchases of new cars: A retrospective analysis of car purchases in Norway. Transp. Res. Part A Policy Pract. 2013, 48, 96–108. [Google Scholar] [CrossRef]
- Patil, G.R. Emission-based static traffic assignment models. Environ. Model. Assess. 2016, 21, 629–642. [Google Scholar] [CrossRef]
- Roman, R.D.; Ritchie, S.G. Accounting for population exposure to vehicle-generated pollutants and environmental equity in the toll design problem. Int. J. Sustain. Transp. 2017, 11, 406–421. [Google Scholar] [CrossRef]
- Yan, S.; Eskeland, G.S. Greening the vehicle fleet: Norway’s CO2-Differentiated registration tax. J. Environ. Econ. Manag. 2018, 91, 247–262. [Google Scholar] [CrossRef]
- Hörcher, D.; Borger, B.D.; Seifu, W.; Graham, D.J. Public transport provision under agglomeration economies. Reg. Sci. Urban Econ. 2020, 81, 103503. [Google Scholar] [CrossRef]
- Timilsina, G.R.; Dulal, H.B. Fiscal Policy Instruments for Reducing Congestion and Atmospheric Emissions in the Transport Sector: A Review; World Bank Policy Research Working Paper No. 4652; World Bank: Washington, DC, USA, 2010; Available online: https://ssrn.com/abstract=1149604 (accessed on 30 April 2022).
- Chen, S.; Zheng, X.; Yin, H.; Liu, Y. Did Chinese cities that implemented driving restrictions see reductions in PM10? Transp. Res. Part D Transp. Environ. 2020, 79, 102208. [Google Scholar] [CrossRef]
- Burniaux, J.M.; Chateau, J. Mitigation Potential of Removing Fossil Fuel Subsidies: A General Equilibrium Assessment; OECD Economics Department Working Papers; OECD: Paris, France, 2011. [Google Scholar]
- Jia, S.; Mao, B.; Liu, S.; Sun, Q. Calculation and analysis of transportation energy consumption level in China. J. Transp. Syst. Eng. Inf. Technol. 2010, 10, 22–27. [Google Scholar] [CrossRef]
- Li, Y.; Bao, L.; Bao, J. Evaluating Emission Mitigation Potential of Shanghai Transportation Policies Using LEAP. In Proceedings of the 93rd Transportation Research Board, Washington, DC, USA, 12–16 January 2014. [Google Scholar]
- Liu, H.; Wang, Y.; Chen, X.; Han, S. Vehicle emission and near-road air quality modeling in Shanghai, China, based on taxi GPS data and MOVES revised emission inventory. Transp. Res. Rec. 2013, 2340, 38–48. [Google Scholar] [CrossRef]
- Feng, X.; Zhao, M.; Wang, M.; Du, X.; Tian, C.; Gao, J. Simulation research on co-controlling pollutants and greenhouse gases emission in China’s transportation sector. Clim. Change Res. 2021, 17, 279–288. [Google Scholar]
- Pang, K.; Zhang, Q.; Ma, C.; Zhu, L.; Chen, H.; Kong, X.; Pan, F.; Yang, H. Forecasting of Emission Co-reduction of Greenhouse Gases and Pollutants for the Road Transport Sector in Lanzhou Based on the LEAP Model. Environ. Sci. 2021. (In Chinese) [Google Scholar] [CrossRef]
- Duan, L.; Hu, W.; Deng, D.; Fang, W.; Xiong, M.; Lu, P.; Li, Z.; Zhai, C. Impacts of reducing air pollutants and CO2 emissions in urban road transport through 2035 in Chongqing, China. Environ. Sci. Ecotechnol. 2021, 8, 100125. [Google Scholar] [CrossRef]
- Chi, L. The Prediction of Beijing Passenger Transport Energy Demand and Pollutants Emission in Future Based on LEAP Mode. Ph.D. Thesis, Beijing Jiaotong University, Beijing, China, 2014. (In Chinese). [Google Scholar]
- Hu, X.L.; Jiang, K.J. CO2 emission reduction strategies analysis: AIM/energy-emission model. Energy China 1998, 11, 17–22. [Google Scholar]
- Zhang, C.X. Research on the Development of Electric Vehicle Impact on Energy and Environment in Guangzhou Based on LEAP. Master’s Thesis, North China Electric Power University, Beijing, China, 2013. (In Chinese). [Google Scholar]
- Zhang, M.; Miu, H. Research on the Change of Motorized Passenger Transport Energy Consumption in Selected Chinese Cities Based on LMDI Method. Acta Sci. Nat. Univ. Pekin. 2010, 46, 483–486. [Google Scholar] [CrossRef]
- International Energy Agency (IEA). The Future of Trucks: Implications for Energy and the Environment; IEA: Paris, France, 2017. [Google Scholar]
- Pierpaolo, C.; Marine, G.; Jacopo, T. Global EV Outlook 2019—Scaling Up the Transition to Electric Mobility; IEA: Paris, France, 2019. [Google Scholar]
- International Energy Agency (IEA). Global Energy and CO2 Status Report 2018: The Latest Trends in Energy and Emissions in 2018; IEA: Paris, France, 2019. [Google Scholar]
- Li, R.; He, Q.; Li, S. Analyses of Automobile Ownership Development Trend in China. Urban Transp. China 2013, 11, 69–75. [Google Scholar] [CrossRef]
- China International Capital Corporation Limited. Passenger Car Ownership is Expected to Rise and then Fall to 530 Million in 2060. Available online: http://stock.jrj.com.cn/2020/12/04081131405001.shtml (accessed on 29 January 2022).
- An, F.; Kang, L.; Qin, Z.; Mao, S.; Wang, W.; Dror, M.B. Study on the phasing-out timetable of China’s traditional ICE-vehicles. Int. Pet. Econ. 2019, 27, 1–8. [Google Scholar]
- Updated Timetable for Phasing Out China’s Traditional Ice Vehicles and Its Environmental Benefits Assessment. Available online: http://www.nrdc.cn/Public/uploads/2020-06-30/5efac9b5b0832.pdf (accessed on 29 January 2022).
- Ministry of Industry and Information Technology of the People’s Republic of China. Fuel Consumption Limits for Passenger Cars GB19578-2021; Ministry of Industry and Information Technology: Beijing, China, 2021. [Google Scholar]
- Toward “Net Zero” Emissions in the Road Transport Sector in China. Available online: https://wri.org.cn/research/toward-net-zero-emissions-road-transport-sector-china (accessed on 29 January 2022).
- Jia, S.; Song, Y.; Yang, Z. Process of Peak carbon emissions of trucks during operating activities based on growth curve function. J. Transp. Syst. Eng. Inf. Technol. 2021, 21, 310. [Google Scholar] [CrossRef]
- Li, W.; Pu, Z.; Li, Y.; Ban, X. Characterization of ridesplitting based on observed data: A case study of Chengdu, China. Transp. Res. Part C Emerg. Technol. 2019, 100, 330–353. [Google Scholar] [CrossRef]
- Li, W.; Pu, Z.; Li, Y.; Tu, M. How does ridesplitting reduce emissions from ridesourcing? A spatiotemporal analysis in Chengdu, China. Transp. Res. Part D Transp. Environ. 2021, 96, 102885. [Google Scholar] [CrossRef]
- Li, W.; Chen, S.; Dong, J.; Wu, J. Exploring the spatial variations of transfer distances between dockless bike-sharing systems and metros. J. Transp. Geogr. 2021, 92, 103032. [Google Scholar] [CrossRef]
- Li, W.; Wang, L.; Li, Y.; Liu, B. A Blockchain-based emissions trading system for the road transport sector: Policy design and evaluation. Clim. Policy 2021, 21, 337–352. [Google Scholar] [CrossRef]
- Song, L.; Cao, Z.; Dai, M. Material metabolism and carbon emission reduction strategies of passenger cars in China’s mainland. Resour. Sci. 2021, 43, 501–512. [Google Scholar] [CrossRef]
- Peng, T.; Ou, X.; Yuan, Z.; Yan, X.; Zhang, X. Development and application of China provincial road transport energy demand and GHG emissions analysis model. Appl. Energy 2018, 222, 313–328. [Google Scholar] [CrossRef]
- Gambhir, A.; Tse, L.; Tong, D.; Martinez-Botas, R. Reducing China’s road transport sector CO2 emissions to 2050: Technologies, costs and decomposition analysis. Appl. Energy 2015, 157, 905–917. [Google Scholar] [CrossRef] [Green Version]
- Yan, X.; Crookes, R.J. Reduction potentials of energy demand and GHG emissions in China’s road transport sector. Energy Policy 2019, 37, 658–668. [Google Scholar] [CrossRef]


| Influencing Factors of CO2 Emission | Vehicle Type | Fuel Type | 2020 | 2030 | 2040 | 2050 | 2060 |
|---|---|---|---|---|---|---|---|
| Passenger vehicle population (ten thousand) | All | All | 24,166.2 | 38,958.2 | 45,927.4 | 48,574.4 | 49,510.0 |
| Vehicle structure | Mini | All | 0.65% | 0.10% | 0.01% | 0.00% | 0.00% |
| Small | All | 98.40% | 99.13% | 99.22% | 99.23% | 99.23% | |
| Medium | All | 0.28% | 0.38% | 0.52% | 0.58% | 0.62% | |
| Large | All | 0.67% | 0.38% | 0.26% | 0.19% | 0.15% | |
| Fuel structure | Mini, Small, and Medium | Gasoline | 98% | 86% | 68% | 34% | 0% |
| Electricity | 1.6% | 12.74% | 30.72% | 64.68% | 100% | ||
| Hybrid | 0.4% | 1.26% | 1.28% | 1.32% | 0% | ||
| Large | Gasoline | 75% | 50% | 30% | 15% | 0% | |
| Electricity | 25% | 50% | 70% | 85% | 100% | ||
| Fuel economy | Mini | Gasoline (L/100 km) | 5.20 | 4.03 | 3.84 | 3.67 | 3.53 |
| Electricity (kWh/100 km) | 8.70 | 6.73 | 6.40 | 6.13 | 5.89 | ||
| Hybrid (L/100 km) | 2.81 | 2.18 | 2.07 | 1.98 | 1.91 | ||
| Small | Gasoline (L/100 km) | 8.30 | 7.50 | 6.75 | 6.00 | 5.30 | |
| Electricity (kWh/100 km) | 13.00 | 10.00 | 9.00 | 8.20 | 7.80 | ||
| Hybrid (L/100 km) | 4.22 | 3.36 | 2.75 | 2.60 | 2.58 | ||
| Medium | Gasoline (L/100 km) | 17.10 | 15.20 | 14.80 | 14.60 | 14.50 | |
| Electricity (kWh/100 km) | 120.00 | 116.00 | 110.00 | 100.00 | 92.00 | ||
| Hybrid (L/100 km) | 9.24 | 8.22 | 8.00 | 7.89 | 7.84 | ||
| Large | Gasoline (L/100 km) | 21.80 | 19.40 | 18.90 | 18.50 | 18.20 | |
| Electricity (kWh/100 km) | 144.00 | 140.00 | 135.0 | 128.00 | 122.00 | ||
| Average annual VKT (km) | Mini | All | 10,000 | 8917 | 7917 | 7000 | 6500 |
| Small | All | 12,000 | 10,700 | 9500 | 8500 | 7500 | |
| Medium | All | 35,000 | 35,750 | 36,500 | 37,250 | 38,000 | |
| Large | All | 48,300 | 48,900 | 49,200 | 49,500 | 49,800 | |
| Fuel emission factor | All | Gasoline (kg/L) | 2.42 | 2.42 | 2.42 | 2.42 | 2.42 |
| All | Electricity (kg/kWh) | 0.71 | 0.52 | 0.46 | 0.4 | 0.38 |
| Influencing Factors of CO2 Emission | Vehicle Type | Fuel Type | 2020 | 2030 | 2040 | 2050 | 2060 |
|---|---|---|---|---|---|---|---|
| Freight vehicle population (ten thousand) | All | All | 3042.6 | 3861.4 | 4453.5 | 4793.3 | 4957.4 |
| Vehicle structure | Mini | Diesel | 0.00% | 0.00% | 0.00% | 0.00% | 0.00% |
| Light | 40.20% | 37.68% | 33.75% | 29.12% | 24.50% | ||
| Medium | 5.70% | 3.00% | 1.70% | 1.10% | 0.50% | ||
| Heavy | 54.10% | 59.33% | 64.55% | 69.78% | 75.00% | ||
| Mini | Gasoline | 5.50% | 4.00% | 2.40% | 1.20% | 0.00% | |
| Light | 94.50% | 96.00% | 97.60% | 98.80% | 100.00% | ||
| Medium | 0.00% | 0.00% | 0.00% | 0.00% | 0.00% | ||
| Heavy | 0.00% | 0.00% | 0.00% | 0.00% | 0.00% | ||
| Mini | Electricity | 99.50% | 83.38% | 67.25% | 51.13% | 35.00% | |
| Light | 0.50% | 7.88% | 15.25% | 22.63% | 30.00% | ||
| Medium | 0.00% | 5.00% | 10.00% | 15.00% | 20.00% | ||
| Heavy | 0.00% | 3.75% | 7.50% | 11.25% | 15.00% | ||
| Mini | Natural gas | 0.10% | 0.00% | 0.00% | 0.00% | 0.00% | |
| Light | 3.80% | 2.50% | 1.60% | 0.80% | 0.00% | ||
| Medium | 0.40% | 0.00% | 0.00% | 0.00% | 0.00% | ||
| Heavy | 95.70% | 97.50% | 98.40% | 99.20% | 100.00% | ||
| Fuel structure | All | Diesel | 69.60% | 60.00% | 51.00% | 43.00% | 35.00% |
| All | Gasoline | 27.90% | 19.30% | 14.00% | 12.00% | 10.00% | |
| All | Electricity | 0.70% | 13.40% | 24.00% | 32.00% | 40.00% | |
| All | Natural gas | 1.80% | 7.30% | 11.00% | 13.00% | 15.00% | |
| Fuel Economy | Mini | Diesel (L/100 km) | 6.80 | 6.10 | 5.80 | 5.60 | 5.50 |
| Gasoline (L/100 km) | 9.60 | 8.60 | 7.40 | 5.80 | 4.20 | ||
| Natural gas (m3/100 km) | 8.40 | 7.50 | 6.68 | 5.84 | 5.00 | ||
| Electricity (kWh/100 km) | 18.50 | 17.40 | 16.00 | 15.20 | 14.70 | ||
| Light | Diesel (L/100 km) | 8.70 | 7.80 | 7.40 | 7.10 | 7.00 | |
| Gasoline (L/100 km) | 11.00 | 9.90 | 8.84 | 7.72 | 6.60 | ||
| Natural gas (m3/100 km) | 11.20 | 10.10 | 8.94 | 7.82 | 6.70 | ||
| Electricity (kWh/100 km) | 125.00 | 119.00 | 113.00 | 106.00 | 102.00 | ||
| Medium | Diesel (L/100 km) | 15.50 | 14.70 | 14.00 | 13.40 | 12.90 | |
| Natural gas (m3/100 km) | 17.50 | 15.70 | 14.02 | 12.26 | 10.50 | ||
| Electricity (kWh/100 km) | 132.00 | 128.00 | 123.00 | 114.00 | 111.00 | ||
| Heavy | Diesel (L/100 km) | 32.60 | 30.80 | 29.30 | 28.00 | 27.00 | |
| Natural gas (m3/100 km) | 30.80 | 27.80 | 24.66 | 21.58 | 18.50 | ||
| Electricity (kWh/100 km) | 150.00 | 146.00 | 140.00 | 132.00 | 129.00 | ||
| Average annual VMT (km) | Mini | All | 20,000 | 20,000 | 20,000 | 20,000 | 20,000 |
| Light | All | 20,000 | 20,000 | 20,000 | 20,000 | 20,000 | |
| Medium | All | 24,000 | 25,627 | 27,498 | 29,288 | 31,000 | |
| Heavy | All | 40,000 | 40,500 | 41,143 | 41,786 | 42,500 | |
| Fuel emission factor | All | Diesel (kg/L) | 2.8 | 2.8 | 2.8 | 2.8 | 2.8 |
| All | Gasoline (kg/L) | 2.42 | 2.42 | 2.42 | 2.42 | 2.42 | |
| All | Natural gas (kg/m3) | 2.62 | 2.62 | 2.62 | 2.62 | 2.62 | |
| All | Electricity (kg/kWh) | 0.71 | 0.52 | 0.46 | 0.4 | 0.38 |
| Influencing Factors of CO2 Emission | 2020 | 2030 | 2040 | 2050 | 2060 |
|---|---|---|---|---|---|
| CO2 emission factor of electricity (kg/kWh) | 0.71 | 0.32 | 0.23 | 0.16 | 0.14 |
| Influencing Factors of CO2 Emission | Vehicle Type | Fuel Type | 2020 | 2030 | 2040 | 2050 | 2060 | |
|---|---|---|---|---|---|---|---|---|
| Fuel economy | Passenger vehicle | Mini | Gasoline (L/100 km) | 5.20 | 3.54 | 3.28 | 3.07 | 2.89 |
| Electricity (kWh/100 km) | 8.70 | 5.90 | 5.48 | 5.12 | 4.83 | |||
| Hybrid (L/100 km) | 2.81 | 1.91 | 1.77 | 1.66 | 1.56 | |||
| Small | Gasoline (L/100 km) | 8.30 | 7.13 | 6.08 | 5.09 | 4.23 | ||
| Electricity (kWh/100 km) | 13.00 | 8.75 | 7.47 | 6.49 | 6.02 | |||
| Hybrid (L/100 km) | 4.22 | 2.99 | 2.21 | 2.03 | 2.01 | |||
| Medium | Gasoline (L/100 km) | 17.10 | 14.32 | 13.76 | 13.48 | 13.34 | ||
| Electricity (kWh/100 km) | 120.00 | 114.05 | 105.30 | 91.24 | 80.49 | |||
| Hybrid (L/100 km) | 9.24 | 7.74 | 7.44 | 7.29 | 7.21 | |||
| Large | Gasoline (L/100 km) | 21.80 | 18.29 | 17.59 | 17.03 | 16.62 | ||
| Electricity (kWh/100 km) | 144.00 | 138.04 | 130.70 | 120.66 | 112.26 | |||
| Freight vehicle | Mini | Diesel (L/100 km) | 6.80 | 5.59 | 5.10 | 4.79 | 4.64 | |
| Gasoline (L/100 km) | 9.60 | 7.87 | 6.00 | 3.85 | 2.14 | |||
| Natural gas (m3/ 100 km) | 8.40 | 6.84 | 5.55 | 4.35 | 3.28 | |||
| Electricity (kWh/100 km) | 18.50 | 16.56 | 14.23 | 12.98 | 12.22 | |||
| Light | Diesel (L/100 km) | 8.70 | 7.14 | 6.49 | 6.03 | 5.88 | ||
| Gasoline (L/100 km) | 11.00 | 9.09 | 7.41 | 5.80 | 4.36 | |||
| Natural gas (m3/100 km) | 11.20 | 9.29 | 7.45 | 5.84 | 4.42 | |||
| Electricity (kWh/100 km) | 125.00 | 114.39 | 104.20 | 92.84 | 86.62 | |||
| Medium | Diesel (L/100 km) | 15.50 | 14.09 | 12.90 | 11.92 | 11.13 | ||
| Natural gas (m3/100 km) | 17.50 | 14.37 | 11.72 | 9.19 | 6.94 | |||
| Electricity (kWh/100 km) | 132.00 | 124.88 | 116.33 | 101.32 | 96.57 | |||
| Heavy | Diesel (L/100 km) | 32.60 | 29.43 | 26.89 | 24.78 | 23.21 | ||
| Natural gas (m3/100 km) | 30.80 | 25.59 | 20.60 | 16.18 | 12.24 | |||
| Electricity (kWh/100 km) | 150.00 | 142.87 | 132.46 | 119.12 | 114.28 | |||
| Influencing Factors of CO2 Emission | Vehicle Type | Fuel Type | 2020 | 2030 | 2040 | 2050 | 2060 | |
|---|---|---|---|---|---|---|---|---|
| Passenger vehicle population (ten thousand) | All | All | 24,166.2 | 34,848.5 | 38,095.5 | 38,854.2 | 38,991.0 | |
| Vehicle structure | Passenger vehicle | Mini | All | 0.65% | 0.30% | 0.13% | 0.06% | 0.03% |
| Small | All | 98.40% | 98.77% | 98.81% | 98.81% | 98.81% | ||
| Medium | All | 0.28% | 0.43% | 0.65% | 0.77% | 0.84% | ||
| Large | All | 0.67% | 0.50% | 0.41% | 0.35% | 0.32% | ||
| Fuel economy | Passenger vehicle | Mini | Gasoline (L/100 km) | 5.20 | 3.78 | 3.55 | 3.36 | 3.19 |
| Electricity (kWh/100 km) | 8.70 | 6.31 | 5.92 | 5.61 | 5.33 | |||
| Hybrid (L/100 km) | 2.81 | 2.04 | 1.92 | 1.82 | 1.73 | |||
| Small | Gasoline (L/100 km) | 8.30 | 7.31 | 6.41 | 5.53 | 4.73 | ||
| Electricity (kWh/100 km) | 13.00 | 9.35 | 8.20 | 7.30 | 6.85 | |||
| Hybrid (L/100 km) | 4.22 | 3.17 | 2.46 | 2.30 | 2.28 | |||
| Medium | Gasoline (L/100 km) | 17.10 | 14.76 | 14.27 | 14.03 | 13.91 | ||
| Electricity (kWh/100 km) | 120.00 | 115.02 | 107.63 | 95.52 | 86.06 | |||
| Hybrid (L/100 km) | 9.24 | 7.98 | 7.71 | 7.58 | 7.52 | |||
| Large | Gasoline (L/100 km) | 21.80 | 18.84 | 18.23 | 17.75 | 17.39 | ||
| Electricity (kWh/100 km) | 144.00 | 139.02 | 132.83 | 124.28 | 117.03 | |||
| Freight vehicle | Mini | Diesel (L/100 km) | 6.80 | 5.94 | 5.57 | 5.33 | 5.21 | |
| Gasoline (L/100 km) | 9.60 | 8.36 | 6.93 | 5.11 | 3.40 | |||
| Natural gas (m3/100 km) | 8.40 | 7.29 | 6.31 | 5.33 | 4.39 | |||
| Electricity (kWh/100 km) | 18.50 | 17.13 | 15.43 | 14.47 | 13.88 | |||
| Light | Diesel (L/100 km) | 8.70 | 7.59 | 7.10 | 6.75 | 6.63 | ||
| Gasoline (L/100 km) | 11.00 | 9.64 | 8.37 | 7.06 | 5.80 | |||
| Natural gas (m3/100 km) | 11.20 | 9.84 | 8.45 | 7.14 | 5.89 | |||
| Electricity (kWh/100 km) | 125.00 | 117.54 | 110.18 | 101.70 | 96.93 | |||
| Medium | Diesel (L/100 km) | 15.50 | 14.51 | 13.65 | 12.92 | 12.32 | ||
| Natural gas (m3/100 km) | 17.50 | 15.28 | 13.26 | 11.21 | 9.23 | |||
| Electricity (kWh/100 km) | 132.00 | 127.02 | 120.84 | 109.88 | 106.28 | |||
| Heavy | Diesel (L/100 km) | 32.6 | 30.36 | 28.53 | 26.95 | 25.75 | ||
| Natural gas (m3/100 km) | 30.8 | 27.09 | 23.32 | 19.73 | 16.27 | |||
| Electricity (kWh/100 km) | 150.00 | 145.02 | 137.60 | 127.84 | 124.21 | |||
| Influencing Factors of CO2 Emission | Vehicle Type | Fuel Type | 2020 | 2030 | 2040 | 2050 | 2060 | |
|---|---|---|---|---|---|---|---|---|
| Fuel structure | Passenger vehicle | Small and medium | Gasoline | 98.00% | 82.50% | 60.00% | 17.50% | 0.00% |
| Electricity | 1.60% | 15.93% | 38.40% | 80.85% | 100.00% | |||
| Hybrid | 0.40% | 1.58% | 1.60% | 1.65% | 0.00% | |||
| Large | Gasoline | 75.00% | 37.50% | 12.50% | 0.00% | 0.00% | ||
| Electricity | 25.00% | 62.50% | 87.50% | 100.00% | 100.00% | |||
| Freight vehicle | Diesel | 69.60% | 56.08% | 44.13% | 34.20% | 24.31% | ||
| Gasoline | 27.90% | 18.04% | 12.12% | 9.55% | 6.94% | |||
| Natural gas | 1.80% | 9.13% | 13.75% | 16.25% | 18.75% | |||
| Electricity | 0.70% | 16.75% | 30.00% | 40.00% | 50.00% | |||
| Average annual VMT (km) | Passenger vehicle | Mini | All | 10,000 | 8881 | 7763 | 6644 | 5525 |
| Small | All | 12,000 | 10,594 | 9188 | 7781 | 6375 | ||
| Medium | All | 35,000 | 34,325 | 33,650 | 32,975 | 32,300 | ||
| Large | All | 48,300 | 46,808 | 45,315 | 43,823 | 42,330 | ||
| Freight vehicle | Mini | All | 20,000 | 19,250 | 18,500 | 17,750 | 17,000 | |
| Light | All | 20,000 | 19,250 | 18,500 | 17,750 | 17,000 | ||
| Medium | All | 24,000 | 24,588 | 25,175 | 25,763 | 26,350 | ||
| Heavy | All | 40,000 | 39,031 | 38,063 | 37,094 | 36,125 | ||
| Influencing Factors of CO2 Emission | Vehicle Type | Fuel Type | 2020 | 2030 | 2040 | 2050 | 2060 | |
|---|---|---|---|---|---|---|---|---|
| Fuel structure | Passenger vehicle | Small and medium | Gasoline | 98.00% | 79.00% | 52.00% | 1.00% | 0.00% |
| Electricity | 1.60% | 19.11% | 46.08% | 97.02% | 100.00% | |||
| Hybrid | 0.40% | 1.89% | 1.92% | 1.98% | 0.00% | |||
| Large | Gasoline | 75.00% | 25.00% | 0.00% | 0.00% | 0.00% | ||
| Electricity | 25.00% | 75.00% | 100.00% | 100.00% | 100.00% | |||
| Freight vehicle | Diesel | 69.60% | 52.17% | 37.27% | 25.41% | 13.61% | ||
| Gasoline | 27.90% | 16.78% | 10.23% | 7.09% | 3.89% | |||
| Natural gas | 1.80% | 10.95% | 16.50% | 19.50% | 22.50% | |||
| Electricity | 0.70% | 20.10% | 36.00% | 48.00% | 60.00% | |||
| Average annual VMT (km) | Passenger vehicle | Mini | All | 10,000 | 8719 | 7438 | 6156 | 4875 |
| Small | All | 12,000 | 10,406 | 8813 | 7219 | 5625 | ||
| Medium | All | 35,000 | 33,375 | 31,750 | 30,125 | 28,500 | ||
| Large | All | 48,300 | 45,563 | 42,825 | 40,088 | 37,350 | ||
| Freight vehicle | Mini | All | 20,000 | 18,750 | 17,500 | 16,250 | 15,000 | |
| Light | All | 20,000 | 18,750 | 17,500 | 16,250 | 15,000 | ||
| Medium | All | 24,000 | 23,813 | 23,625 | 23,438 | 23,250 | ||
| Heavy | All | 40,000 | 37,969 | 35,938 | 33,906 | 31,875 | ||
| Influencing Factors of CO2 Emission | Vehicle Type | Fuel Type | 2020 | 2030 | 2040 | 2050 | 2060 | |
|---|---|---|---|---|---|---|---|---|
| Fuel structure | Passenger vehicle | Small and medium | Gasoline | 98.00% | 74.80% | 42.40% | 0.00% | 0.00% |
| Electricity | 1.60% | 22.93% | 55.30% | 98% | 100.00% | |||
| Hybrid | 0.40% | 2.27% | 2.30% | 2.00% | 0.00% | |||
| Large | Gasoline | 75.00% | 0.00% | 0.00% | 0.00% | 0.00% | ||
| Electricity | 25.00% | 100.00% | 100.00% | 100.00% | 100.00% | |||
| Freight vehicle | Diesel | 69.60% | 44.34% | 23.54% | 7.82% | 0.00% | ||
| Gasoline | 27.90% | 14.26% | 6.46% | 2.18% | 0.00% | |||
| Natural gas | 1.80% | 14.60% | 22.00% | 26.00% | 27.27% | |||
| Electricity | 0.70% | 26.80% | 48.00% | 64.00% | 72.73% | |||
| Average annual VMT (km) | Passenger vehicle | Mini | All | 10,000 | 8556 | 7113 | 5669 | 4225 |
| Small | All | 12,000 | 10,219 | 8438 | 6656 | 4875 | ||
| Medium | All | 35,000 | 32,425 | 29,850 | 27,275 | 24,700 | ||
| Large | All | 48,300 | 44,318 | 40,335 | 36,353 | 32,370 | ||
| Freight vehicle | Mini | All | 20,000 | 18,250 | 16,500 | 14,750 | 13,000 | |
| Light | All | 20,000 | 18,250 | 16,500 | 14,750 | 13,000 | ||
| Medium | All | 24,000 | 23,038 | 22,075 | 21,113 | 20,150 | ||
| Heavy | All | 40,000 | 36,906 | 33,813 | 30,719 | 27,625 | ||
| Influencing Factors of CO2 Emission | Vehicle Type | Fuel Type | 2020 | 2030 | 2040 | 2050 | 2060 |
|---|---|---|---|---|---|---|---|
| Passenger vehicles population (ten thousand) | All | All | 3042.6 | 5133.3 | 6864.9 | 7512.9 | 8731.0 |
| Vehicle structure | Passenger vehicle | Mini | All | 0.65% | 0.30% | 0.13% | 0.06% |
| Small | All | 98.40% | 98.77% | 98.81% | 98.81% | ||
| Medium | All | 0.28% | 0.43% | 0.65% | 0.77% | ||
| Large | All | 0.67% | 0.50% | 0.41% | 0.35% | ||
| Vehicle structure | Mini | All | 0.65% | 0.04% | 0.00% | 0.00% | 0.00% |
| Small | All | 98.40% | 98.77% | 98.81% | 98.81% | 98.81% | |
| Medium | All | 0.28% | 0.69% | 0.78% | 0.83% | 0.86% | |
| Large | All | 0.67% | 0.51% | 0.42% | 0.36% | 0.32% | |
| Fuel structure | Small and medium | Gasoline | 98.00% | 74.80% | 42.40% | 0.00% | 0.00% |
| Electricity | 1.60% | 22.93% | 55.30% | 98% | 100.00% | ||
| Hybrid | 0.40% | 2.27% | 2.30% | 2.00% | 0.00% | ||
| Large | Gasoline | 75.00% | 0.00% | 0.00% | 0.00% | 0.00% | |
| Electricity | 25.00% | 100.00% | 100.00% | 100.00% | 100.00% | ||
| Fuel economy | Mini | Gasoline (L/100 km) | 5.20 | 3.54 | 3.28 | 3.07 | 2.89 |
| Electricity (kWh/100 km) | 8.70 | 5.90 | 5.48 | 5.12 | 4.83 | ||
| Hybrid (L/100 km) | 2.81 | 1.91 | 1.77 | 1.66 | 1.56 | ||
| Small | Gasoline (L/100 km) | 8.30 | 7.13 | 6.08 | 5.09 | 4.23 | |
| Electricity (kWh/100 km) | 13.00 | 8.75 | 7.47 | 6.49 | 6.02 | ||
| Hybrid (L/100 km) | 4.22 | 2.99 | 2.21 | 2.03 | 2.01 | ||
| Medium | Gasoline (L/100 km) | 17.10 | 14.32 | 13.76 | 13.48 | 13.34 | |
| Electricity (kWh/100 km) | 120.00 | 114.05 | 105.30 | 91.24 | 80.49 | ||
| Hybrid (L/100 km) | 9.24 | 7.74 | 7.44 | 7.29 | 7.21 | ||
| Large | Gasoline (L/100 km) | 21.80 | 18.29 | 17.59 | 17.03 | 16.62 | |
| Electricity (kWh/100 km) | 144.00 | 138.04 | 130.70 | 120.66 | 112.26 | ||
| Average annual VMT (km) | Mini | All | 10,000 | 8556 | 7113 | 5669 | 4225 |
| Small | All | 12,000 | 10,219 | 8438 | 6656 | 4875 | |
| Medium | All | 35,000 | 32,425 | 29,850 | 27,275 | 24,700 | |
| Large | All | 48,300 | 44,318 | 40,335 | 36,353 | 32,370 | |
| Fuel emission factor | All | Electricity (kg/kWh) | 0.71 | 0.32 | 0.23 | 0.16 | 0.14 |
| Influencing Factors of CO2 Emission | Vehicle Type | Fuel Type | 2020 | 2030 | 2040 | 2050 | 2060 |
|---|---|---|---|---|---|---|---|
| Fuel structure | All | Diesel | 69.60% | 44.34% | 23.54% | 7.82% | 0.00% |
| All | Gasoline | 27.90% | 14.26% | 6.46% | 2.18% | 0.00% | |
| All | Natural gas | 1.80% | 14.60% | 22.00% | 26.00% | 27.27% | |
| All | Electricity | 0.70% | 26.80% | 48.00% | 64.00% | 72.73% | |
| Fuel economy | Mini | Diesel (L/100 km) | 6.80 | 5.59 | 5.10 | 4.79 | 4.64 |
| Gasoline (L/100 km) | 9.60 | 7.87 | 6.00 | 3.85 | 2.14 | ||
| Natural gas (m3/100 km) | 8.40 | 6.84 | 5.55 | 4.35 | 3.28 | ||
| Electricity (kWh/100 km) | 18.50 | 16.56 | 14.23 | 12.98 | 12.22 | ||
| Light | Diesel (L/100 km) | 8.70 | 7.14 | 6.49 | 6.03 | 5.88 | |
| Gasoline (L/100 km) | 11.00 | 9.09 | 7.41 | 5.80 | 4.36 | ||
| Natural gas (m3/100 km) | 11.20 | 9.29 | 7.45 | 5.84 | 4.42 | ||
| Electricity (kWh/100 km) | 125.00 | 114.39 | 104.20 | 92.84 | 86.62 | ||
| Medium | Diesel (L/100 km) | 15.50 | 14.09 | 12.90 | 11.92 | 11.13 | |
| Natural gas (m3/100 km) | 17.50 | 14.37 | 11.72 | 9.19 | 6.94 | ||
| Electricity (kWh/100 km) | 132.00 | 124.88 | 116.33 | 101.32 | 96.57 | ||
| Heavy | Diesel (L/100 km) | 32.60 | 29.43 | 26.89 | 24.78 | 23.21 | |
| Natural gas (m3/100 km) | 30.80 | 25.59 | 20.60 | 16.18 | 12.24 | ||
| Electricity (kWh/100 km) | 150.00 | 142.87 | 132.46 | 119.12 | 114.28 | ||
| Average annual VMT (km) | Mini | All | 20,000 | 18,250 | 16,500 | 14,750 | 13,000 |
| Light | All | 20,000 | 18,250 | 16,500 | 14,750 | 13,000 | |
| Medium | All | 24,000 | 23,038 | 22,075 | 21,113 | 20,150 | |
| Heavy | All | 40,000 | 36,906 | 33,813 | 30,719 | 27,625 | |
| CO2 emission factor | All | Electricity (kg/kWh) | 0.71 | 0.32 | 0.23 | 0.16 | 0.14 |
| Scenarios | Peak Year of CO2 Emission | CO2 Emission Peak (Million Tonnes) | Cumulative CO2 Emission (Million Tonnes) | Cumulative CO2 Emission Reductions Compared with the BAU Scenario (Million Tonnes) | CO2 Emission Reduction Rate from Carbon Peak Year to 2060 |
|---|---|---|---|---|---|
| BAU | 2033 | 1419.50 | 51,073.75 | - | 34% |
| CE | 2031 | 1378.69 | 47,460.70 | 3613.05 | 47% |
| SAV | 2029 | 1315.47 | 47,274.21 | 3799.54 | 34% |
| FEI | 2029 | 1335.51 | 46,320.29 | 4753.46 | 43% |
| CET-LCP | 2029 | 1350.32 | 45,587.65 | 5486.10 | 44% |
| CET-MCP | 2027 | 1307.91 | 41,560.01 | 9513.74 | 53% |
| CET-HCP | 2026 | 1272.22 | 37,110.66 | 13,963.08 | 62% |
| CS | 2023 | 1200.37 | 28,572.73 | 22,501.22 | 82% |
Publisher’s Note: MDPI stays neutral with regard to jurisdictional claims in published maps and institutional affiliations. |
© 2022 by the authors. Licensee MDPI, Basel, Switzerland. This article is an open access article distributed under the terms and conditions of the Creative Commons Attribution (CC BY) license (https://creativecommons.org/licenses/by/4.0/).
Share and Cite
Dong, J.; Li, Y.; Li, W.; Liu, S. CO2 Emission Reduction Potential of Road Transport to Achieve Carbon Neutrality in China. Sustainability 2022, 14, 5454. https://doi.org/10.3390/su14095454
Dong J, Li Y, Li W, Liu S. CO2 Emission Reduction Potential of Road Transport to Achieve Carbon Neutrality in China. Sustainability. 2022; 14(9):5454. https://doi.org/10.3390/su14095454
Chicago/Turabian StyleDong, Jieshuang, Yiming Li, Wenxiang Li, and Songze Liu. 2022. "CO2 Emission Reduction Potential of Road Transport to Achieve Carbon Neutrality in China" Sustainability 14, no. 9: 5454. https://doi.org/10.3390/su14095454
APA StyleDong, J., Li, Y., Li, W., & Liu, S. (2022). CO2 Emission Reduction Potential of Road Transport to Achieve Carbon Neutrality in China. Sustainability, 14(9), 5454. https://doi.org/10.3390/su14095454