Abstract
The effects of low-intensity and high-frequency prescribed burning on the soil CO2 emissions from Pinus yunnanensis forestland should be explored to achieve sustainable operation and management under fire disturbance. A Li-6400XT portable photosynthesis meter (equipped with a Li-6400-09 soil respiration chamber) and a TRIME®-PICO 64/32 soil temperature and moisture meter were used to measure the soil CO2 flux, soil temperature, and soil moisture at fixed observation sites in two treatments (i.e., unburned (UB) and after prescribed burning (AB)) in a Pinus yunnanensis forest of Zhaobi Mountain, Xinping County, Yunnan, China from March 2019 to February 2021. We also determined the relationships between the soil CO2 flux and soil hydrothermal factors. The results showed that (1) the soil CO2 flux in both UB and AB plots exhibited a significant unimodal trend of seasonal variations. In 2020, the highest soil CO2 fluxes occurred in September; they were 7.08 μmol CO2·m−2·s−1 in the morning and 7.63 μmol CO2·m−2·s−1 in the afternoon in the AB treatment, which was significantly lower than those in the UB treatment (p < 0.05). The AB and the UB treatment showed no significant differences in annual soil carbon flux (p > 0.05). (2) The relationship between the soil CO2 flux and moisture in the AB and UB plots was best fitted by a quadratic function, with a degree of fitting between 0.435 and 0.753. The soil CO2 flux and soil moisture showed an inverted U-shaped correlation in the UB plot (p < 0.05) but a positive correlation in the AB plot (p < 0.05). Soil moisture was the key factor affecting the soil CO2 flux (p < 0.05), while soil temperature showed no significant effect on soil CO2 flux in this area (p > 0.05). Therefore, the application of low-intensity prescribed burning for fire hazard reduction in this region achieved the objective without causing a persistent and drastic increase in the soil CO2 emissions. The results could provide important theoretical support for scientific implementation of prescribed burning, as well as scientific evaluation of ecological and environmental effects after prescribed burning.
1. Introduction
The flux of carbon from soils to the atmosphere occurs in the form of CO2, and is primarily the result of soil respiration [1]. Increase in the storage of carbon in soils could help offset further anthropogenic emissions of CO2, whereas a release from soils could significantly exacerbate the increased atmospheric CO2 and reinforce the greenhouse-warming effect [2]. Soil respiration, as the second-largest flux of terrestrial ecosystems, not only strongly affects the global carbon balance but also plays an important role in regulating global climate change [3]. Soil respiration releases approximately 80–98 Pg C·a−1 of CO2 [4], which is 10 times higher than the emissions from global fossil fuels [5]. Small variations in soil respiration would significantly affect the amount of atmospheric CO2 and thus the global carbon balance [6]. Therefore, variations in soil respiration play a critical role in regulating the regional and global carbon cycles [7,8,9]. The changes in soil respiration and its influencing factors must be determined for prediction of global climate change. Most studies have focused on undisturbed ecosystems, such as forests [10], grasslands [11], wetlands [12], deserts [13], and tundra [14], while ignoring the changes in the carbon cycle in these ecosystems in response to factors such as fire control [15], litter removal [16], clear-cutting [17], and nitrogen addition [18]. In particular, the carbon cycle of an ecosystem under disturbance is more complex and has practical significance, which needs much more attention.
Soil respiration dynamics in undisturbed ecosystems is generally determined by soil temperature and moisture. Soil temperature is considered to be the main controlling factor of soil respiration because it significantly affects microbial decomposition, root respiration, and diffusion of enzymes and substrates [19]. Generally, the rate of CO2 emission increases with the increasing soil temperature [20]. However, soil temperature is not necessarily proportional to soil respiration rate, and some studies have shown that soil respiration rate decreases when the temperature exceeds 40 °C [21]. The results of Davidson et al. showed that soil temperature decreased significantly after autumn, but soil respiration rate increased rather than decreased [22]. Other studies have shown that CO2 emissions in the ecosystem are greatly affected by light radiation, while the correlation with temperature is weak [23]. Thus, there is much uncertainty about the relationship between soil respiration and temperature. Soil moisture is another abiotic environmental factor affecting soil respiration. The study of a semi-evergreen forest in Panama showed that soil respiration decreased significantly with the increase in soil moisture [24]. In contrast, other studies observed an increase in soil respiration with increased soil water content [25]. Furthermore, soil moisture may replace temperature as the main control factor of soil respiration in arid or semi-arid areas [26,27].
As one of the major disturbance factors of forest ecosystems, fire disturbance affects soil respiration through changing the physical (temperature and moisture), chemical, and biological properties in the soil [28]. The inconsistent results about the effects of forest fires on soil respiration are related to the intensity [29,30], postfire observation time [31,32,33], forest type [34,35], restoration process of the aboveground vegetation in the burned area [33], and climatic conditions [36,37]. As an important means of afforestation and forest fire prevention, prescribed burning eliminates excessive combustibles through the beneficial nature of low-intensity burning in a controlled, purposeful, planned, and step-by-step manner [38]. In contrast, prescribed burning is characterized by lower intensity and higher frequency, and its impact on the soil ecosystem is long-term and periodic [39]. Relevant studies in China and other countries have been based on the effect of forest fires (high intensity) or one-time burning of the cutover land (low frequency) on the soil carbon cycle in forests [40,41,42,43]. Since different fire behaviors can impact the soil respiration to different degrees and through different processes, there is an urgent need to identify the long-term effects of low-intensity and high-frequency burning disturbances on forest soil respiration. The results would provide theoretical and empirical support for evaluating the effects of prescribed burning on the forest carbon cycle and developing effective scientific forest fire management strategies.
Central Yunnan is one of the areas in Yunnan Province where forest fires often occur frequently and severely. It is a key area for the implementation of prescribed burning, with a long history of prescribed burning that can be traced back to the 1980s [44]. Pinus yunnanensis, as one of the major tree species in the Yunnan–Guizhou Plateau, comprises a large proportion of the forests in this area [45,46]. Given that prescribed burning has been continuously implemented for many years for preventing forest fires in the Central Yunnan Plateau, we conducted a prescribed burning experiment to explore the impact on the dynamics of soil CO2 flux in the 30 year-old nearly mature Pinus yunnanensis forests from the end of January to mid-February for nearly 20 years. This study aimed to: (1) explore the temporal variations of soil CO2 emissions in Pinus yunnanensis forests in response to prescribed burning, and (2) identify the primary driving factors of soil CO2 emissions after prescribed burning. The results could provide important theoretical support for scientific implementation of prescribed burning, as well as for scientific evaluation of ecological and environmental effects after prescribed burning.
2. Materials and Methods
2.1. Overview of the Study Area
The study area was located at the eastern pediment of the middle-segment Ailao Mountain in Zhaobi Mountain, southern Xinping County, Yuxi City, Central Yunnan Plateau (102°0′7″–102°0′8″ E, 24°2′38″–24°2′41″ N, Figure 1). The terrain is dominated by mountains, and the elevation is 1990–2050 m. The study area has a subtropical plateau monsoon climate, and the soil taxonomy belongs to red soil. The mean annual precipitation and temperature are 869 mm and 18.1 °C, respectively. The total annual sunshine duration is 2838.7 h, and the length of the frost-free period is 316 days. Prescribed burning of the Pinus yunnanensis forest in Xinping County has been carried out yearly from the end of January to mid-February for nearly 20 years. The occurrence of haze events in Kunming City since 13 February 2019 has raised environmentalists’ opposition to the prescribed burning of the Pinus yunnanensis forest in central Yunnan. Consequently, the Department of Ecology and Environment of Yunnan Province notified the Yuxi Municipal Government to stop prescribed burning-related activities.
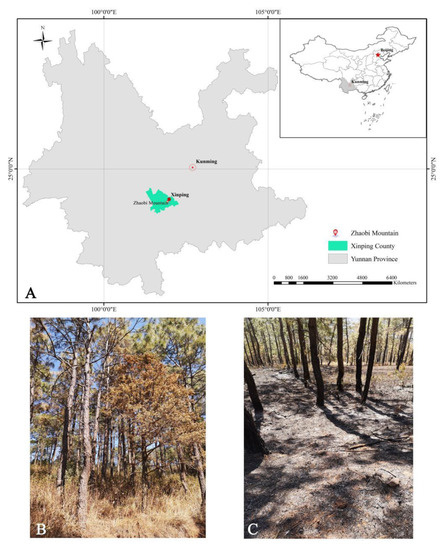
Figure 1.
Sampled plots in the Zhaobi Mountain, Southern Xinping County, Yuxi City, Central Yunnan Plateau (A); unburned (B); and after prescribed burning (C).
A 30 year-old Pinus yunnanensis natural secondary forest was selected as the study subject. The sample plots were subjected to two treatments: unburned (UB) and after prescribed burning (AB). The UB plot and the AB plot were located at the upper and lower sides of a fire escape, respectively. The Pinus yunnanensis forest in the AB plot had a stand canopy density of approximately 0.55, a mean diameter at breast height (DBH) of 16.14 cm, a mean tree height of 13.00 m, and a mean scorch height of 1.48 m, indicating that the prescribed burning had a low intensity [47]. After the prescribed burning, there were no understory shrubs or herbs, and the burning residues accumulated to 50.00 g·m−2. The Pinus yunnanensis forest in the UB plot had a total canopy density of approximately 0.95, a mean DBH of 16.93 cm, a mean tree height of 12.24 m, and an accumulative litter density of 244.00 g·m−2. The shrubs mainly included Schima superba and Rhododendron decorum, and the herbs mainly included Chalcites xanthorhynchus, Cyrtomium fortunei, Ranunculus japonicus, and Imperata cylindrica [48].
2.2. Determination of Forestland Soil CO2 Flux, Soil Temperature, and Soil Moisture
Six fixed plots of 20 m × 20 m (three plots for UB treatment and three plots for AB treatment) were set up in the Pinus yunnanensis forest. In each plot, three measurement sites were arranged on the upper slope, the mid-slope, and the lower slope, each. The prescribed burning was conducted on 12–13 February 2019, and continuous observations were made from March 2019 to February 2021. At the end of each quarter, the soil CO2 flux, soil temperature, and soil moisture were measured twice at each measurement site, once in the morning from 9:00 to 12:00 and once in the afternoon from 14:00 to 17:00. The measurement was repeated three times at each measurement site. The measurement could be carried out 1–3 days earlier or later if necessitated by rainfall. The soil CO2 flux was measured using a Li-6400XT portable photosynthesis meter (equipped with a Li-6400-09 soil respiration chamber). A polyethylene ring (an inner diameter of 10 cm, a height of 5 cm, buried 3 cm underground, and 2 cm above the ground) was embedded in each measurement site 24 h before the measurement to minimize the effect of soil disturbance. The soil temperature (°C) and soil moisture (volumetric moisture, %) at 10 cm depth were simultaneously measured using a TRIME®-PICO 64/32 soil temperature and moisture meter.
2.3. Calculation and Date Analysis
The annual soil carbon flux (g C·m−2·a−1) was estimated by the following equation: FC = 12 × 86,400 × 10−6 × ∑(RiDi), where FC is the annual carbon flux (g C·m−2·a−1), 12 is the molecular weight of C, 86,400 is the conversion coefficient between d and s, Ri is the average soil respiration rate (μmol CO2·m−2·s−1) in quarter i, and Di is the number of days in quarter i. The correlation between soil temperature and soil CO2 flux is usually described by an exponential equation or the Arrhenius equation [49]. Therefore, the correlation between soil CO2 flux and soil temperature was fitted using the exponential model [50]: Rs = aeβT (where Rs is the soil CO2 flux; T is the soil temperature; a is the soil CO2 flux when the soil temperature is 0 °C; and β is the temperature sensitivity coefficient). Q10 is an index that reflects the sensitivity of soil CO2 flux to temperature variations based on the fold of the increase in the soil CO2 flux for every 10 °C increased in temperature [49]. The value of the commonly used model for Q10 is Q10 = e10β (where β is the temperature response coefficient in the soil CO2 flux and soil temperature index model Rs = aeβT). Recent studies on the respective and combined influences of soil moisture and temperature on soil CO2 flux still have inconsistencies. Therefore, we analyzed the soil moisture (W/%) and soil CO2 flux (Rs) by three regression models [45] (linear: Rs = a + bW; quadratic: Rs = a + bW + cW2; and exponential: Rs = aebW) and analyzed the combined effects of soil temperature and moisture on soil CO2 flux using the two-factor models [45] (Rs = a + bTW, Rs = a + bT + cW, and Rs = aebTWc).
All statistical nonlinear regression and significant difference analyses were performed using SPSS 17.0. All data normality and equal variance were tested. Analysis of variance (ANOVA) was used to test the differences in Rs, T, and W among the different treatments or time. Regression analysis was applied to describe the relationships between Rs and T and W. The significance level of all statistical tests was 0.05, and OriginPro 8.0 was used for plotting.
3. Results
3.1. Seasonal Dynamics of Soil CO2 Flux
Based on the long-term continuous observation of soil CO2 flux in the Pinus yunnanensis forest (Figure 2), the soil CO2 flux in UB and AB plots after 2 years consecutive treatments exhibited an overall unimodal trend in seasonal dynamics (p < 0.05). Starting in June 2019, the soil CO2 flux in the UB plot increased, peaking in September 2019 (9.26 μmol CO2·m−2·s−1 in the morning and 8.76 μmol CO2·m−2·s−1 in the afternoon). The soil CO2 flux in the AB plot showed a similar trend. The maximum in soil CO2 flux in the AB plot also reached 9.26 μmol CO2·m−2·s−1 in the morning and only reached 6.57 μmol CO2·m−2·s−1 in the afternoon, which was lower than that of the UB plot (p < 0.05). After September, the soil respiration rate continued to decrease, reaching the lowest values in March of the following year (p < 0.05). The lowest soil respiration rates of the UB plot were 1.73 μmol CO2·m−2·s−1 in the morning and 1.60 μmol CO2·m−2·s−1 in the afternoon, while the lowest soil respiration rates of the AB plot were 1.94 μ CO2·m−2·s−1 in the morning and 1.66 μmol CO2·m−2·s−1 in the afternoon. The dynamics of soil CO2 flux in the following year was similar to those in the previous year, but there were significant interannual fluctuations. In 2020, the highest soil CO2 flux was again in September (p < 0.05). The highest soil CO2 fluxes in the UB plot were 8.80 μmol CO2·m−2·s−1 in the morning and 8.95 μmol CO2·m−2·s−1 in the afternoon, while those in the AB plot were 7.08 μmol CO2·m−2·s−1 in the morning and 7.63 μmol CO2·m−2·s−1 in the afternoon, which was lower than those of the UB plot (p < 0.05).
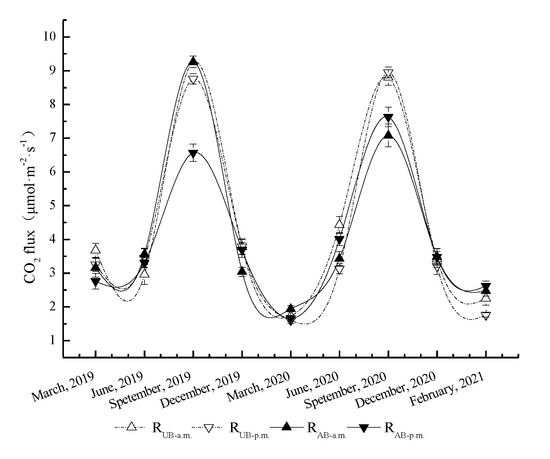
Figure 2.
Seasonal variations in soil CO2 flux in the Pinus yunnanensis forest after prescribed burning. RUB-a.m., RUB-p.m., RAB-a.m., and RAB-p.m. represent the soil respiration dynamics under unburned treatments in a.m. and in p.m. and burned treatments in a.m. and in p.m., respectively. The error bars represent the standard error (n = 9).
The annual soil carbon flux was calculated by adding the mean soil respiration rate in each quarter (Figure 3). During the observation period, the annual soil respiration in the UB plot were 1797.15 ± 169.49 g C·m−2·a−1 in 2019 and 1589.75 ± 169.49 g C·m−2·a−1 in 2020, indicating that the interannual difference was not significant. The annual soil respiration fluxes in the AB plot were 1659.59 ± 169.49 g C·m−2·a−1 in 2019 and 1547.60 ± 169.49 g C·m−2·a−1 in 2020. There were no significant differences in the annual or interannual soil respiration fluxes between the UB and AB plots in a given year the UB or AB plot (p > 0.05).
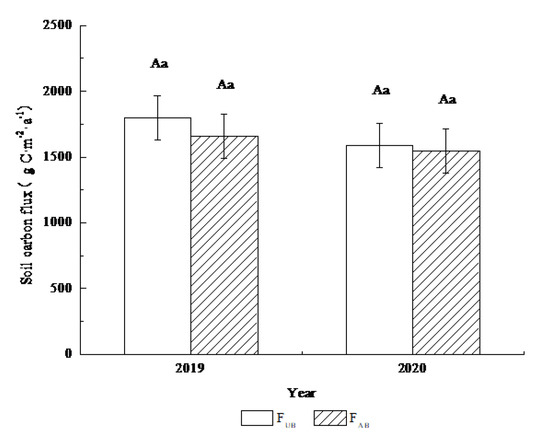
Figure 3.
Annual variations in soil carbon emissions from the Pinus yunnanensis forest after prescribed burning. FUB and FAB represent the annual carbon flux of unburned and burned treatments, respectively. The error bars represent the standard error (n = 9). The different lowercase and uppercase letters are significant at the 95% level in a given year and in the interannual level, respectively.
3.2. Seasonal Dynamics of Soil Temperature and Moisture
For this study, the soil temperature in the UB and AB plots showed significantly seasonal variations with the maximum occurring in summer and the minimum in winter (Figure 4). Soil temperature in the UB plot peaked in June (24.38 °C in the morning and 32.04 °C in the afternoon). The soil temperature in the AB plot showed a similar trend. The maximum soil temperature in the AB plot reached 25.68 °C in the morning but reached 35.57 °C in the afternoon, which was higher than that in the UB plot (p < 0.05). The soil temperature continued to decrease after June, with the lowest values in December. In January of the following year, the soil temperature began to rise. The soil temperature in the UB plot reached the highest value in June, while it reached the highest values 3 months earlier in the AB plot. The maximum soil temperatures in the AB plot were 30.79 °C in the morning and 31.15 °C in the afternoon, which was higher than those in the UB plot (p < 0.05).
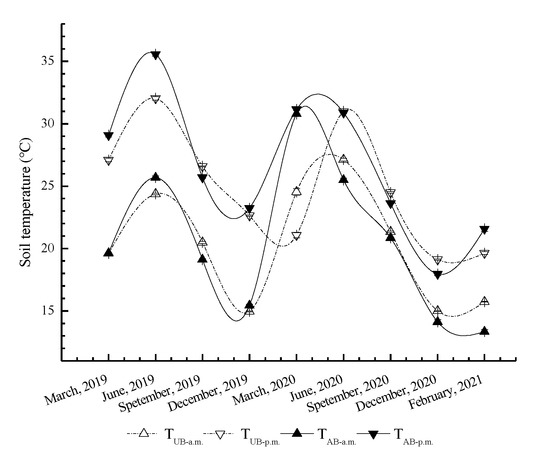
Figure 4.
Seasonal variations in soil temperature in the Pinus yunnanensis forest after prescribed burning. TUB-a.m., TUB-p.m., TAB-a.m., and TAB-p.m. represent the soil temperature dynamics under unburned treatments in a.m. and in p.m. and burned treatments in a.m. and in p.m., respectively. The error bars represent the standard error (n = 9).
The soil moisture in the UB and AB plots exhibited seasonal dynamics of being higher in the rainy season than in the dry season (Figure 5). Starting in March 2019, the soil moisture decreased, then increased in the rainy season (June). The soil moisture in the UB plot reached the maximum in September (13.09% in the morning and 10.37% in the afternoon). The AB plot showed a similar trend. The maximum soil moisture in the AB plot reached 16.20% in the monitoring and 17.22% in the afternoon, which was significantly higher than those in the UB plot (p < 0.05). After September, the soil moisture continued to decrease until March of the following year. The overall trend of soil moisture in 2020 was similar to that in 2019. The mean soil moisture in the UB plot in September 2020 was 19.84%, which was significantly higher than that (13.09%) in the UB plot in September 2019 (p < 0.05). The mean soil moisture in the AB plot in September 2020 was 23.10%, which was higher than that (16.71%) in the AB plot in September 2019 (p < 0.05).
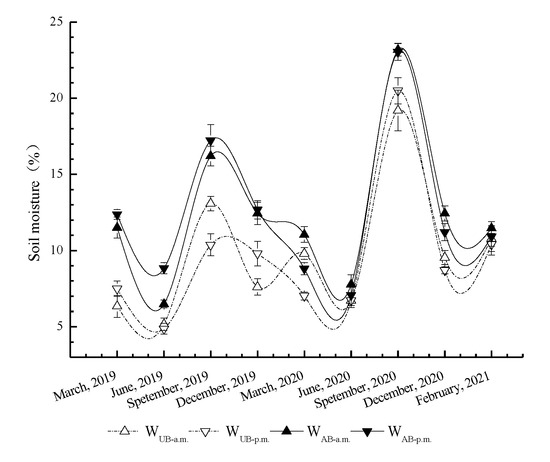
Figure 5.
Seasonal variations in soil moisture in the Pinus yunnanensis forest after prescribed burning. WUB-a.m., WUB-p.m., WAB-a.m., and WAB-p.m. represent the soil moisture dynamics under unburned treatments in a.m. and in p.m. and burned treatments in a.m. and in p.m., respectively. The error bars represent the standard error (n = 9).
3.3. Linking the Soil CO2 Flux with Soil Hydrothermal Factors
3.3.1. Relationship between Soil CO2 Flux and Soil Temperature
There was no significant correlation between the soil CO2 flux and soil temperature in the UB and AB plots (Table 1; p > 0.05). According to the exponential regression equation, the soil respiration rate in the AB plot decreased by 0.741 times for every 10 °C increase in the soil temperature. In addition, the soil respiration rate had a greater decrease with the increasing soil temperature in the AB plot than in the UB plot in the morning, indicating that the sensitivity of the soil CO2 flux to soil temperature was low in the AB plot.

Table 1.
Model parameters of the correlation between CO2 flux (Rs) and soil temperature (T).
3.3.2. Relationship between Soil CO2 Flux and Soil Moisture
The three regression models showed significant correlations between the soil CO2 flux and soil moisture (Table 2; p < 0.05). The linear model showed a positive effect of soil moisture on the soil CO2 flux in the UB and AB plots, with a fitness between 0.459 and 0.727. There was a positive correlation between the soil CO2 flux and soil moisture in the UB and AB plots based on an exponential model, with a goodness of fit between 0.424 and 0.567. The quadratic function model showed an inverted U-shaped curve between the CO2 flux and soil moisture in the UB plot, with goodness of fit between 0.435 and 0.753. The soil CO2 flux was positively correlated with soil moisture when the soil moisture in the UB plot was lower than 44.00% and 30.19% in the morning and afternoon, respectively, while soil CO2 flux was negatively correlated with soil moisture otherwise. The trend in the prescribed burning plot was different: when the soil moisture in the morning and afternoon was higher than 0% and 2.69%, respectively, the soil CO2 flux was positively correlated with the soil moisture.
Table 2.
Model parameters of the correlation between CO2 flux (Rs) and soil moisture (W).
3.3.3. Association of Soil CO2 Flux with Soil Temperature and Soil Moisture
The three two-factor models indicated significant correlations of soil CO2 flux with the composite roles of soil temperature and soil moisture (Table 3; p < 0.05). The exponential model well-explained the composite effects of soil temperature and soil moisture on the soil CO2 flux, with a goodness of fit between 0.437 and 0.721. The observational data of the UB plot showed that the soil CO2 flux was negatively correlated with soil temperature but positively correlated with soil moisture in the morning, while soil CO2 flux was positively correlated with both soil temperature and soil moisture. The observational data in the AB plot showed a similar trend, and the soil CO2 flux was more sensitive to the variations in soil temperature and moisture after the prescribed burning.
Table 3.
Model parameters of the correlation between CO2 flux (Rs) and the composite relationship between soil temperature (T) and moisture (W).
4. Discussion
4.1. Responses of Soil CO2 Flux, Soil Temperature, and Soil Moisture to Prescribed Burning of Forest
Seasonal variations in soil CO2 flux are mainly driven by temperature, moisture, photosynthate production, and/or their combined effects [49]. Forest fires can result in decreased forest canopy density and increased solar radiation on the surface, thereby changing the soil respiration rate [51]. This study showed that the soil respiration rates in the UB and AB plots had obvious seasonal variations, exhibiting a unimodal curve. Yunnan has a plateau monsoon climate with a distinct wet–dry cycle. The wet season lasts from May to October, and the dry season from November to April of the next year, so soil respiration is sensitive to the variations in soil temperature and moisture. According to our observations over two consecutive years, the soil CO2 fluxes in the UB and AB plots were both higher in the rainy season than in the dry season. In contrast, the annual soil respiration was not different after the prescribed burning, which is similar to the findings of Concilio et al. [52]. This may be owed to this Pinus yunnanensis forest having been subjected to low-intensity and high-frequency burning. Although low-intensity burning can damage the shrubs and grass, it may have not much of an influence on the plant roots and their respiration. Furthermore, the bark of Pinus yunnanensis has fire resistance, avoiding the damage of long-term periodic burning.
In this study, the soil temperature showed obvious seasonal dynamics which exerted a crucial impact on the soil respiration dynamics. The observed CO2 flux was significantly higher in the AB plot than in the UB plot, perhaps because the prescribed burning destroyed the shrubs, herbs, and surface litter in the forestland which induced an increase in solar radiation that heated up the soils of the AB plot [53]. On the global scale, the soil CO2 flux is the largest in summer when plant growth is also the most active [54,55]. In general, factors that are conducive to plant growth may be also favor soil metabolic activities. During the active growth season, plants distribute many substrates to roots and microorganisms that promote soil respiration [49].
Soil moisture is one of the main limiting factors for the soil CO2 flux, so the pattern of the variation in soil CO2 fluxes is highly consistent with that of soil moisture [56]. In this study, the soil moisture in the UB and AB plots began to decrease in March, increased significantly after entering the rainy season (June), and reached its maximum in September. After September, the soil moisture continued to decrease until March of the following year. This variation pattern of soil moisture was relatively consistent with the that of the soil CO2 flux. Therefore, we could preliminarily speculate that water deficit during the 6 month-long dry season might limit the biological activities; the seasonal dynamics of soil CO2 flux in the dry season are largely determined by the availability of soil water. Furthermore, the results from regression models further identified the associations of the dynamic pattern of soil CO2 fluxes with soil temperature and moisture.
4.2. Relationships between Soil CO2 Flux and Hydrothermal Factors under Prescribed Burning
Soil temperature and moisture are the main factors affecting soil respiration in forests. The soil temperature and moisture can explain most of the seasonal variations in soil respiration. The results from the exponential regression indicated that soil temperature had no significant effect on soil CO2 flux in this study, which agrees with the findings of Raich et al. [23]. The sensitivity of the respiration process to temperature (Q10) is an important indicator that expounds the effect of soil temperature on soil respiration variations. The sensitivity of soil CO2 flux to soil temperature was lower in the AB plot than in the UB plot. Studies in the past 5 years have shown that the measured Q10 values in Pinus yunnanensis forestlands are usually 2.12–3.86 [57,58]. The Q10 values of the AB plot did not fall in this range, indicating that the soil temperature in the study area was not the main factor affecting the forest soil CO2 flux. This may be related to the long-term periodic burning.
Soil moisture is another important factor affecting soil respiration. The study area has a distinct wet–dry cycle and thus has a wide variation in soil moisture. Under long-term drought conditions, some of the soil carbon is not released due to the suppressive effects of the drought. The rainy season following a long dry season brings lots of rainfall, which promotes the release of drought-suppressed carbon under the stimulation of microorganisms [57]. Therefore, soil moisture may be the main factor affecting the soil respiration, which agrees with the findings of Rey et al. [59]. Among all the regression models, the quadratic function had the highest fitness that could explain up to 75.3% of the soil respiration variations. The two-factor models showed a combined effect of soil temperature and soil moisture, which was superior to the models of the correlation between soil CO2 flux and soil temperature but inferior to the models of the correlation between soil CO2 flux and soil moisture. This again confirmed that soil moisture rather than soil temperature was the main factor affecting soil CO2 flux in this region. There is still a lack of consistency about the respective and combined influences of soil moisture and water on the soil respiration [60]. The study of a Larix gmelinii forest in northeast China found that CO2 flux was mainly affected by soil temperature [4]. In the study of a Pinus tabulaeformis forest in the loess hilly region of China, soil respiration was mainly controlled by soil moisture when it was low; however, soil respiration could be determined by soil temperature when it was higher than 13% [61]. For this study, soil moisture was the main factor affecting soil respiration rate in the Pinus yunnanensis forest during the drought period in southwest China [49]. The complex relationship between the soil CO2 flux and soil moisture has many underlying mechanisms and variations at different regional and temporal scales. Because seasonal and altitudinal variations in moisture are often accompanied by variations in soil temperature, root structure, and microbial activity, the relationship between soil CO2 flux and moisture is often confounded by other environmental factors. In order to understand how soil moisture affects soil CO2 flux, it is necessary to conduct a single-factor experiment that controls soil moisture alone, leaving constant other environmental factors such as soil temperature and biological conditions. This will be explored in our future experiments that will be conducted under laboratory conditions.
5. Conclusions
(1) Continuous 2 year observation found that the soil CO2 fluxes in the UB and AB plots of the Pinus yunnanensis forestland both exhibited a significant unimodal trend in seasonal variation. Furthermore, the soil CO2 flux was higher in the rainy season than in the dry season. In 2020, the highest soil CO2 fluxes occurred in September, with 7.08 μmol CO2·m−2·s−1 in the morning and 7.63 μmol CO2·m−2·s−1 in the afternoon in the AB plot, which was lower than those in the UB plot (p < 0.05). There were no significant differences in annual soil carbon fluxes between the AB and UB plots.
(2) The relationships between soil CO2 flux and soil moisture in the UB and AB plots were best fitted by a quadratic function (the fitness between 0.435 and 0.753). The soil CO2 flux and soil moisture showed an inverted U-shaped correlation in the UB plot, while a positive correlation was observed in the AB plot (p < 0.05). Soil moisture was the more important factor that regulates the variations in soil CO2 flux compared with soil temperature in this region.
Therefore, the application of low-intensity periodic prescribed burning for fire hazard reduction in this region achieved the objective without causing a persistent and drastic increase in the soil CO2 emissions.
Author Contributions
Conceptualization, Q.C. and J.L.; date curation, B.Y., Y.Z., and D.S.; formal analysis, B.Y. and D.S.; funding acquisition, Q.C.; investigation, B.Y., S.G., and D.S.; methodology, B.Y. and S.G.; resources, J.L. and B.Y.; supervision, Q.C.; validation, B.Y. and Y.Z.; writing—original draft, B.Y.; writing—review and editing, Q.C. and J.L. All authors have read and agreed to the published version of the manuscript.
Funding
This research was funded by National Natural Science Foundation of China (No. 31860212; No. 32060345).
Institutional Review Board Statement
Not applicable.
Informed Consent Statement
Not applicable.
Data Availability Statement
Not applicable.
Acknowledgments
We thank the Management and Protection Bureau of Xinping County Nature Reserve (China) for permitting the realization of this study for prescribed burn implementation.
Conflicts of Interest
The authors declare no conflict of interest.
References
- Schlesinger, W.H.; Andrews, J.A. Soil respiration and the global carbon cycle. Biogeochemistry 2000, 48, 7–20. [Google Scholar] [CrossRef]
- Bond-Lamberty, B.; Thomson, A. Temperature-associated increases in the global soil respiration record. Nature 2010, 464, 579–582. [Google Scholar] [CrossRef] [PubMed]
- Lei, J.S.; Guo, X.; Zeng, Y.F.; Zhou, J.Z.; Gao, Q.; Yang, Y.F. Temporal changes in global soil respiration since 1987. Nat. Commun. 2021, 12, 403. [Google Scholar] [CrossRef] [PubMed]
- Hu, T.X.; Sun, L.; Hu, H.Q.; Weise, D.R.; Guo, F.T. Soil respiration of the Dahurian Larch (Larix gmelinii) forest and the response to fire disturbance in Da Xing’an Mountains, China. Sci. Rep. 2017, 7, 2967. [Google Scholar] [CrossRef] [PubMed] [Green Version]
- Hashimoto, S. A new estimation of global soil greenhouse gas fluxes using a simple data-oriented model. PLoS ONE 2012, 7, 41962. [Google Scholar] [CrossRef]
- Burton, A.J.; Pregitzer, K.S. Field measurements of root respiration indicate little to no seasonal temperature acclimation for sugar maple and red pine. Tree Physiol. 2003, 23, 273–280. [Google Scholar] [CrossRef] [Green Version]
- Raich, J.W.; Schlesinger, W.H. The global carbon dioxide flux in soil respiration and its relationship to vegetation and climate. Tellus Ser. B Chem. Phys. Meteorol. 1992, 44, 81–99. [Google Scholar] [CrossRef] [Green Version]
- Haaf, D.; Six, J.; Doetterl, S. Global patterns of geo-ecological controls on the response of soil respiration to warming. Nature Climate Change 2021, 11, 623–627. [Google Scholar] [CrossRef]
- Lal, R. Soil carbon sequestration impacts on global climate change and food security. Science 2004, 304, 1623–1627. [Google Scholar] [CrossRef] [Green Version]
- Patrick, M.; Wood, T.E.; Galbraith, D.R.; Brando, P.M.; Da, C.A.C.L.; Rowland, L.; Ferreira, L.V. Threshold responses to soil moisture deficit by trees and soil in tropical rain forests: Insights from field experiments. BioScience 2015, 65, 882–892. [Google Scholar]
- Wang, Y.S.; Hu, Y.Q.; Ji, B.M.; Liu, G.; Xue, M. An investigation on the relationship between emission/uptake of greenhouse gases and environmental factors in semiarid grassland. Adv. Atmos. Sci. 2003, 20, 119–127. [Google Scholar] [CrossRef]
- Wang, L.; Mei, W.; Yin, Q.; Guan, Y.; Le, Y.; Fu, X. The variability in CO2 fluxes at different time scales in natural and reclaimed wetlands in the yangtze river estuary and their key influencing factors. Sci. Total Environ. 2021, 799, 149441. [Google Scholar] [CrossRef] [PubMed]
- Wang, W.F.; Chen, X.; Zheng, H.W.; Yu, R.D.; Qian, J.; Zhang, Y.F.; Yu, J.J. Soil CO2 uptake in deserts and its implications to the groundwater environment. Water 2016, 8, 793. [Google Scholar] [CrossRef] [Green Version]
- Uchida, M.; Muraoka, H.; Nakatsubo, T. Sensitivity analysis of ecosystem CO2 exchange to climate change in High Arctic tundra using an ecological process-based model. Polar Biol. 2016, 39, 251–265. [Google Scholar] [CrossRef]
- Santos, F.L.M.; Nogueira, J.; Souza, R.A.F.d.; Falleiro, R.M.; Schmidt, I.B.; Libonati, R. PrescribedBurning Reduces Large, HighIntensity Wildfires and Emissions in the Brazilian Savanna. Fire 2021, 4, 56. [Google Scholar] [CrossRef]
- Wang, J.; Zhang, A.; Zheng, Y.J.; Song, J.; Ru, J.Y.; Zheng, M.M.; Hui, D.F.; Wan, S.Q. Long-term litter removal rather than litter addition enhances ecosystem carbon sequestration in a temperate steppe. Funct. Ecol. 2021, 35, 2799–2807. [Google Scholar] [CrossRef]
- Wen, Y.; Schuler, J.L.; Liu, S.R.; Mou, P.; Wang, H.; Yu, H.L. Soil carbon dynamics in a Pinus massoniana plantation following clear-cutting and slash removal. J. Plant Ecol. 2016, 9, 20–29. [Google Scholar]
- Kang, H.Z.; Fahey, T.J.; Bae, K.; Fisk, M.; Sherman, R.E.; Yanai, R.D.; See, C.R. Response of forest soil respiration to nutrient addition depends on site fertility. Biogeochemistry 2016, 127, 113–124. [Google Scholar] [CrossRef]
- Jassal, R.S.; Black, T.A.; Novak, M.D.; Gaumont-Guay, D.; Nesic, Z. Effect of soil water stress on soil respiration and its temperature sensitivity in an 18-year-old temperate douglas-fir stand. Glob. Change Biol. 2010, 14, 1305–1318. [Google Scholar] [CrossRef]
- Tang, J.W.; Baldocchi, D.D.; Qi, Y.; Xu, L.K. Assessing soil CO2 efflux using continuous measurements of CO2 profiles in soils with small solid-state sensors. Agric. For. Meteorol. 2003, 118, 207–220. [Google Scholar] [CrossRef]
- Castelle, A.J.; Galloway, J.N. Carbon dioxide dynamics in acid forest soils in Shenandoah National Park, Virginia. Soil Sci. Soc. Am. J. 1990, 54, 252–257. [Google Scholar] [CrossRef]
- Davidson, E.A.; Belk, E.; Boone, R.D. Soil water content and temperature as independent or confounded factors controlling soil respiration in a temperate mixed hardwood forest. Glob. Change Biol. 1998, 4, 217–227. [Google Scholar] [CrossRef] [Green Version]
- Raich, J.W.; Tufekcioglu, A. Vegetation and soil respiration: Correlations and controls. Biogeochemistry 2000, 48, 71–90. [Google Scholar] [CrossRef]
- Kursar, T.A. Elevation of soil respiration and soil CO2 Concentration in a low land moist forest in Panama. Plant Soil 1989, 113, 21–29. [Google Scholar] [CrossRef]
- Medina, E.; Zelwer, M. Soil respiration in tropical plant communities. In Tropical Ecology with an Emphasis on Organic Production; University of Georgia: Athens, GA, USA, 1972; pp. 245–269. [Google Scholar]
- Sun, S.Q.; Lei, H.Q.; Chang, S.X. Drought differentially affects autotrophic and heterotrophic soil respiration rates and their temperature sensitivity. Biol. Fertil. Soils 2021, 55, 275–283. [Google Scholar] [CrossRef]
- Linn, D.M.; Doran, J.W. Effect of water-filled pore space on carbon dioxide and nitrous oxide production in tilled and nontilled soils. Soil Sci. Soc. Am. J. 1984, 48, 1267–1272. [Google Scholar] [CrossRef] [Green Version]
- Guo, J.; Yang, Y.; Chen, G.; Gao, R.; Qian, W.; Xie, J. Effects of clear-cutting and slash burning on soil respiration in Chinese fir and evergreen broadleaved forests in mid-subtropical China. Plant Soil 2010, 333, 249–261. [Google Scholar] [CrossRef]
- Holden, S.R.; Rogers, B.M.; Treseder, K.K.; Randerson, J.T. Fire severity influences the response of soil microbes to a boreal forest fire. Environ. Res. Lett. 2016, 11, 035004. [Google Scholar] [CrossRef]
- Eckmeier, E.; Gerlach, R.; Skjemstad, J.O.; Ehrmann, O.; Schmidt, M.W.I. Minor changes in soil organic carbon and charcoal concentrations detected in a temperate deciduous forest a year after an experimental slash-and-burn. Biogeosciences 2007, 4, 377–383. [Google Scholar] [CrossRef] [Green Version]
- Binkley, D.; Richter, D.; Davis, M.B.; Caldwell, B. Soil chemistry in a loblolly/longleaf pine forest with interval burning. Ecol. Appl. 1992, 2, 157–164. [Google Scholar] [CrossRef]
- Bélisle, C.A.; Leduc, A.; Gauthier, S.; Desrochers, M.; Mansuy, N.; Morin, H.; Bergeron, Y. Detecting local drivers of fire cycle heterogeneity in boreal forests: A scale issue. Forests 2016, 7, 139. [Google Scholar] [CrossRef] [Green Version]
- Kraemer, J.F.; Hermann, R.K. Broadcast burning: 25-year effects on forest soils in the western flanks of the Cascade Mountains. For. Sci. 1979, 25, 427–439. [Google Scholar]
- Macadam, A.M. Effects of broadcast slash burning on fuels and soil chemical properties in the Sub-boreal Spruce Zone of central British Columbia. Can. J. For. Res. 1987, 17, 1577–1584. [Google Scholar] [CrossRef]
- Dyrness, C.T.; Van, C.K.; Levison, J.D. The effect of wildfire on soil chemistry in four forest types in interior Alaska. Can. J. For. Res. 1989, 19, 1389–1396. [Google Scholar] [CrossRef]
- Kobziar, L.N. The role of environmental factors and tree injuries in soil carbon respiration response to fire and fuels treatments in pine plantations. Biogeochemistry 2007, 84, 191–206. [Google Scholar] [CrossRef]
- Guo, J.F.; Yang, Y.S.; Chen, G.S.; Xie, J.S.; Lin, P. Soil C and N pools in Chinese fir and evergreen broadleaf forests and their changes with slash burning in mid-subtropical China. Pedosphere 2006, 16, 56–63. [Google Scholar] [CrossRef]
- Fontúrbel, T.; Carrera, N.; Vega, J.A.; Fernández, C. The effect of repeated prescribed burning on soil properties: A review. Forests 2021, 12, 767. [Google Scholar] [CrossRef]
- Alcañiz, M.; Outeiro, L.; Francos, M.; Úbeda, X. Effects of prescribed fires on soil properties: A review. Sci. Total Environ. 2018, 613, 944–957. [Google Scholar] [CrossRef]
- Conard, S.G.; Sukhinin, A.I.; Stocks, B.J.; Cahoon, D.R.; Davidenko, E.P.; Ivanova, G.A. Determining effects of area burned and fire severity on carbon cycling and emissions in Siberia. Clim. Change 2002, 55, 197–211. [Google Scholar] [CrossRef]
- Galdos, M.V.; Cerri, C.C.; Cerri, C.E.P. Soil carbon stocks under burned and unburned sugarcane in Brazil. Geoderma 2009, 153, 347–352. [Google Scholar] [CrossRef]
- Sullivan, B.W.; Kolb, T.E.; Hart, S.C. Wildfire reduces carbon dioxide efflux and increases methane uptake in ponderosa pine forest soils of the southwestern USA. Biogeochemistry 2011, 104, 251–265. [Google Scholar] [CrossRef]
- Hu, H.Q.; Hu, T.X.; Sun, L. Spatial heterogeneity of soil respiration in a Larix gmelinii forest and the response to prescribed fire in the Greater Xing’an Mountains, China. J. For. Res. 2016, 27, 1153–1162. [Google Scholar] [CrossRef]
- Su, W.H.; Shi, Z.; Zhou, R.; Zhao, Y.J.; Zhang, G.F. The role of fire in the Central Yunnan Plateau ecosystem, southwestern China. For. Ecol. Manag. 2015, 356, 22–30. [Google Scholar] [CrossRef]
- Wang, S.J.; Zhao, J.X.; Chen, Q.B. Controlling factors of soil CO2 efflux in Pinus yunnanensis across different stand ages. PLoS ONE 2015, 10, 1–13. [Google Scholar] [CrossRef]
- Su, W.H.; Yu, J.E.; Zhang, G.F.; Shi, Z.; Wang, L.L.; Zhao, G.H.; Zhou, R. Comparison of the canopy and soil seed banks of Pinus yunnanensis in central Yunnan, China. For. Ecol. Manag. 2019, 437, 41–48. [Google Scholar] [CrossRef]
- Wenger, K.F.; Foresters, S.O.A. Forestry Handbook. Q. Rev. Biol. 1984, 60, 225–227. [Google Scholar]
- Tian, R.; Chen, Q.B.; Li, J.Q.; Zhao, Y.T.; Yang, G.L.; Zuo, M. Effects of prescribed burning on soil microbes and enzyme activities in Pinus yunnanensis forests. Ecol. Environ. Sci. 2020, 29, 695–701. [Google Scholar]
- Luo, Y.; Zhou, X. Soil Respiration and the Environment; Academic Press: Cambridge, MA, USA; Elsevier: Amsterdam, The Netherlands, 2006. [Google Scholar]
- Van’t Hoff, J.H. Etudes de Dynamique Chimique (Studies of Chemical Dynamics); Frederik Muller and Co.: Amsterdam, The Netherlands, 1844; Volume 3, pp. 333–336. [Google Scholar]
- Munoz-Rojas, M.; Lewandrowski, W.; Erickson, T.E.; Dixon, K.W.; Merritt, D.J. Soil respiration dynamics in fire affected semi-arid ecosystems: Effects of vegetation type and environmental factors. Sci. Total Environ. 2016, 572, 1385–1394. [Google Scholar] [CrossRef]
- Concilio, A.; Ma, S.Y.; Ryu, S.R.; North, M.; Chen, J. Soil respiration response to experimental disturbances over 3 years. For. Ecol. Manag. 2006, 228, 82–90. [Google Scholar] [CrossRef]
- Iverson, L.R.; Hutchinson, T.F. Soil temperature and moisture fluctuations during and after prescribed fire in mixed-oak forests, USA. Nat. Areas J. 2002, 22, 296–304. [Google Scholar]
- Raich, J.W.; Potter, C.S. Global patterns of carbon dioxide emissions from soils. Glob. Biogeochem. Cycles 1995, 9, 23–26. [Google Scholar] [CrossRef] [Green Version]
- Raich, J.W.; Potter, C.S.; Bhagawati, D. Interannual variability in global soil respiration, 1980–1994. Glob. Change Biol. 2002, 8, 800–812. [Google Scholar] [CrossRef]
- Davidson, E.A.; Verchot, L.V.; Cattanio, J.H.; Ackerman, I.L.; Carvalho, J.E.M. Effects of soil water content on soil respiration in forests and cattle pastures of eastern Amazonia. Biogeochemistry 2000, 48, 53–69. [Google Scholar] [CrossRef]
- Zhao, J.X.; Wang, S.J.; Chen, Q.B.; Chen, M.Q.; Shu, J.J.; Li, Y.J. Soil respiration and its affecting factors of Pinus yunnanensis in the middle regions of Yunnan. J. Northwest For. Univ. 2014, 57, 71–76. [Google Scholar]
- Zuo, M.; Chen, Q.B.; Li, J.Q.; Yang, G.L.; Hu, J.; Sun, K. Effects of alteration in forest litter input on CO2 release in Pinus yunnanensis forestland in central Yunnan Plateau. Acta Ecol. Sin. 2020, 41, 4552–4561. [Google Scholar]
- Rey, A.; Pegoraro, E.; Oyonarte, C.; Were, A.; Escribano, P.; Raimundo, J. Impact of land degradation on soil respiration in a steppe (Stipa tenacissima L.) semi-arid ecosystem in the SE of Spain. Soil Biol. Biochem. 2011, 43, 393–403. [Google Scholar] [CrossRef]
- Luo, Y.Q.; Wan, S.Q.; Hui, D.F.; Wallace, L.L. Acclimatization of soil respiration to warming in a tall grass prairie. Nature 2001, 413, 622–625. [Google Scholar] [CrossRef]
- Xie, Y.L.; Chen, Y.M.; Tang, Y.K.; Wu, X.; Wen, J. Soil respiration dynamics and its response to soil temperature and water content of Pinus tabulaeformis and Hippophae rhamnoides plantations in the Loess Hilly region. Sci. Soil Water Conserv. 2017, 15, 33–42. [Google Scholar]
Publisher’s Note: MDPI stays neutral with regard to jurisdictional claims in published maps and institutional affiliations. |
© 2022 by the authors. Licensee MDPI, Basel, Switzerland. This article is an open access article distributed under the terms and conditions of the Creative Commons Attribution (CC BY) license (https://creativecommons.org/licenses/by/4.0/).