Article

Development of an Online Holistic Standardized Recipe: A Design Science Approach

1
ESGHT, Universidade do Algarve, 8005-246 Faro, Portugal
2
ESGHT/CiTUR, Universidade do Algarve, 8005-246 Faro, Portugal
3
ESS/CESUAlg, Universidade do Algarve, 8005-246 Faro, Portugal
*
Author to whom correspondence should be addressed.
Sustainability 2022, 14(9), 5330; https://doi.org/10.3390/su14095330
Submission received: 21 February 2022 / Revised: 31 March 2022 / Accepted: 14 April 2022 / Published: 28 April 2022

Abstract

:
Concerns around healthy and sustainable food, particularly regarding the standardization of production, cost control, and revenue maximization, are issues challenging food and beverages researchers and professionals. There are some available models to create standardized recipes for food and beverages, but they are weak in holistic terms from the point of view of management and legally required information. The purpose of this study was to develop an artifact, an online holistic standardized recipe, to allow the management of information in terms of recipes, costs, allergens, sustainability, nutrition facts, and menu pricing strategies. The research approach was conducted using a design science research methodology developed in two cycles. The artifact was produced from a literature review conducted to define the design principles, and it was evaluated across exploratory focus group and field study phases. The primary outcome of this research was the development of an online holistic standardized recipe. The artifact was considered relevant and useful by the stakeholders participating in the exploratory focus group and field study. However, studying the edible portion and the average weight of the recipe ingredients is necessary for the artifact to become more robust. The paper provides new insights and practical guidelines for academics and professionals in the food and beverage industry.

1. Introduction

The development of standardized recipes (SR) or cost control sheets for standardized recipes is not a recent topic. The standardized recipe has essential roles: (1) in the parameterization of the quality and quantity of products to be used in a recipe; (2) in key performance indicators (KPIs) management; (3) and is essential for the calculation of the nutrition facts and allergen information of a recipe [1].
Safety, health, and food are determining factors that influence decisions when choosing a tourism destination [2]. Therefore, adequate nutritional information for traditional recipes from tourism destinations such as the Algarve should be considered carefully [3]. Standardized recipes or cost control sheets for standardized recipes have become fundamental in any food and beverage (F&B) department because the cost control sheet for the standardized recipe, when combined with other factors, leads to the profitability of the department [4]. The cost control sheet for a standardized recipe is essential for calculating and setting the sale price of each recipe [5]. Having a thorough knowledge of costs is important to ensure the establishment’s profitability [4].
This study aims to develop an artifact, an online holistic standardized recipe (OHSR) to allow the management of standardized recipes, cost control sheets for standardized recipes, allergens, nutrition facts, and menu pricing strategies. Additionally, the management of this information is important due to constantly changing costs and information regarding the seasonality of food products, which change with the more favorable times of year of production. In the literature, there is a lack of consensus on the specific format for standardized recipes and cost control sheets, although it offers guidance on the type of information that this document should contain [6].
To achieve our research aim, first we conducted a literature review focused on the research areas of sustainability, food production, nutrition facts, food information, and support to F&B management. The research focused on keywords associated with standardized recipes, cost control sheets for the standardized recipes, nutrition facts and their indicators, sustainability and the seasonality of food products, allergen information, and menu pricing strategies. Subsequently, it was necessary to research similar existing platforms (e.g., [1,7,8]). With the identification of an unsolved problem, a design science research (DSR) methodology was followed. The objective of this method was to develop an artifact, and, therefore, it was necessary to collect information about the procedures to be followed in the methodology.
This paper includes: a literature review that focuses on the theoretical framework regarding standardized recipes in general, sustainability, nutrition facts, food allergens, and cost control sheets to acquire deeper insight into the topic; the methods used to address the aims of the study; the design principles for the artifact development; the online holistic standardized recipe development; conclusions, implications of the results for professionals and researchers, and limitations of this study.

2. Literature Review

2.1. Standardized Recipe

An SR is an internal document prepared separately for each menu item [4,9] that ensures the standardization and consistency of the dishes served to the customer [5]. An inconsistency in these can be seen as an enemy of any establishment [9,10,11]. The SR is a tool that guarantees quality and quantity [12], and can be used to guide new employees and trainees [5]. It also helps supervisors fill out requisition forms [4].
An SR is not just a “well-written” recipe, but a recipe that has been reviewed and tested by the restaurant; the quantities of each ingredient are defined, and it can be described as a maintenance tool for quality standards [13]. The SR guarantees that cooking times, portion size, and procedures to be followed have been adequately tested beforehand. This controls workplace errors [12] and the customer will always receive the same item each time they order the same dish [10].
These features of SRs play an essential role in a restaurant. The definition and structurization of a restaurant concept, the theme that defines a restaurant [14], are important for business success. The restaurant concept should not be heterogenetic [9]; it should be consistent, and remain constant [15]. SRs will help with consistency and standardization, ensuring the same dish will always be served with the same weight, presentation, taste, and quality [6]. The restaurant concept must be correctly defined to guide the managers in offering customers the best experience [11].
The SR includes all the useful information for the dish preparation and serving, such as [13]: (1) name of the dish; (2) classification (e.g., starters, main courses, desserts, etc.); (3) number of servings; (4) portion serving size: weight and measure; (5) total dish weight; (6) pan size; (7) cooking temperature; (8) cooking time; (9) ingredients list; (10) weight or volume expressed in unit; (11) method of procedure; (12) descriptive terms (e.g., cut, chopped, etc.); (13) specify the type or brand name ingredient to be used; (14) use applicable terminology; (15) use only the front SR; (16) directions for serving (e.g., garnishes, accompaniments, serving equipment); (17) service type [16]; (18) total preparation time [17]; (19) date [18]; (20) picture of what the finished product should look like [19]; (21) cooking mode [12]; (22) instructions for storing and leftover use should be placed on the back of the sheet [18]; (23) selling point [20]; (24) instructions about dish presentation [16]; (25) employee name and supervisor [16]; (26) dish/ingredient ID [11]; (27) nutrition facts [9,11,18,21]; (28) recipe difficulty rating [22]; (29) ontological categories [23]; (30) original region [23].
The SR can be constructed for more than one portion [12]. In this case, the conversion factor must be used to determine the quantity produced per ingredient of the recipe [11]. The conversion factor is calculated by dividing the desired portions by the SR portions [5,10,24]. Henderson [25] argues that constructing SR for 100 people allows for easier conversions. On the other hand, Dopson et al. [10] defend that SR should be conceptualized for ten persons, with the option of expanding them to one hundred.
Some authors argue that costs can optionally be included in SR [10,12,13,20]. Therefore, Ribeiro [5] believes that there are two distinct SR template types: (1) an SR that must be presented to the food production and F&B service brigade; (2) a cost control sheet for the SR (CCSforSR) prepared by the F&B supervisor. The CCSforSR was introduced with the progress of computerization. Managerial oversight of procedures is, nevertheless, needed, regardless of the sophistication processes developed through time [26]. A CCSforSR can be elaborated with current specialized software or by using Microsoft Excel spreadsheet-like software [11].

2.2. Key Performance Indicators

From a F&B management standpoint, the CCSforSR is one of the most important documents [5]. Its elaboration should ensure the restaurant’s profitability [4]. Only the kitchen staff involved in the procedure will have access to the information in SR. Some KPIs from the F&B department should be considered while elaborating a CCSforSR. The total unit cost, which is the isolated cost of each ingredient [4], is one of them. To obtain the cost of each ingredient it is necessary to know their purchase costs [20]. The cost price is calculated by summing all the total unit costs [6]. If a CCSforSR is designed for more than one person, the cost price per portion must be calculated by dividing the CCSforSR’s cost price by the number of portions [27,28]. Other CCSforSR add up to 10% for seasonings, frying fat, garnish, or crackers [28].
The Decreto-Lei No. 138/90 requires that all sales prices (SP) must include all fees and be expressed in Portuguese currency so that the customer is aware of the exact value he must pay for the product [29]. The rates applied for restaurants assume the value of the value-added tax, commonly referred as VAT. In Mainland Portugal, three VAT rates can currently be applied, and only two are used in restaurants. The 13% VAT rate is generally charged in food services and still water. A rate of 23% is applied to all beverages except still water [30].
The VAT is calculated by multiplying the net sales price (NSP) by the corresponding rate. According to Economias [31], the SP is calculated by utilizing Formula (1).
SP = NSP × (1 + VAT percentage)
The unit contribution margin is calculated by subtracting the NSP and the cost price [4]. The SP calculation must be in line with the cost price calculation [24,32]. The SP must be calculated similarly if the cost price is calculated per portion.

2.3. Advantages of Standardized Recipe

Although the use of the SR has benefits for the staff and supervisors, it is frequently met with some resistance. Despite SR implementation being a time-consuming process [12], it is possible to save time, remove guessing, and reduce quality variance in the long run [13]. It also prevents the dependency on cooks or chefs [12], even though some cooks claim their recipes are secret [10]. Consistency in quality and quantities served are also two of the benefits inherent to SR usage. However, the measurement pattern must be consistent, and all foods must be weighed. In the case of liquids, a volume measurement must be used for greater precision [12]. Purchasing ingredients accurately, dietary concerns, pricing without losing money, and computerized F&B operations may occur using SR [10].
It is recommended to have an SR repertoire that guarantees a menu change as a contingency plan in the case of an unexpected event. The repertoire should contain the triple number of dishes on the menu [11]. It is necessary to redo the SR [17,33] when the materials or quantities change, which makes this procedure a constantly ongoing task. Additionally, supplier pricing does not remain constant over time [33], prompting regular SR updates [5,9]. It is done every six months in some restaurants [28].

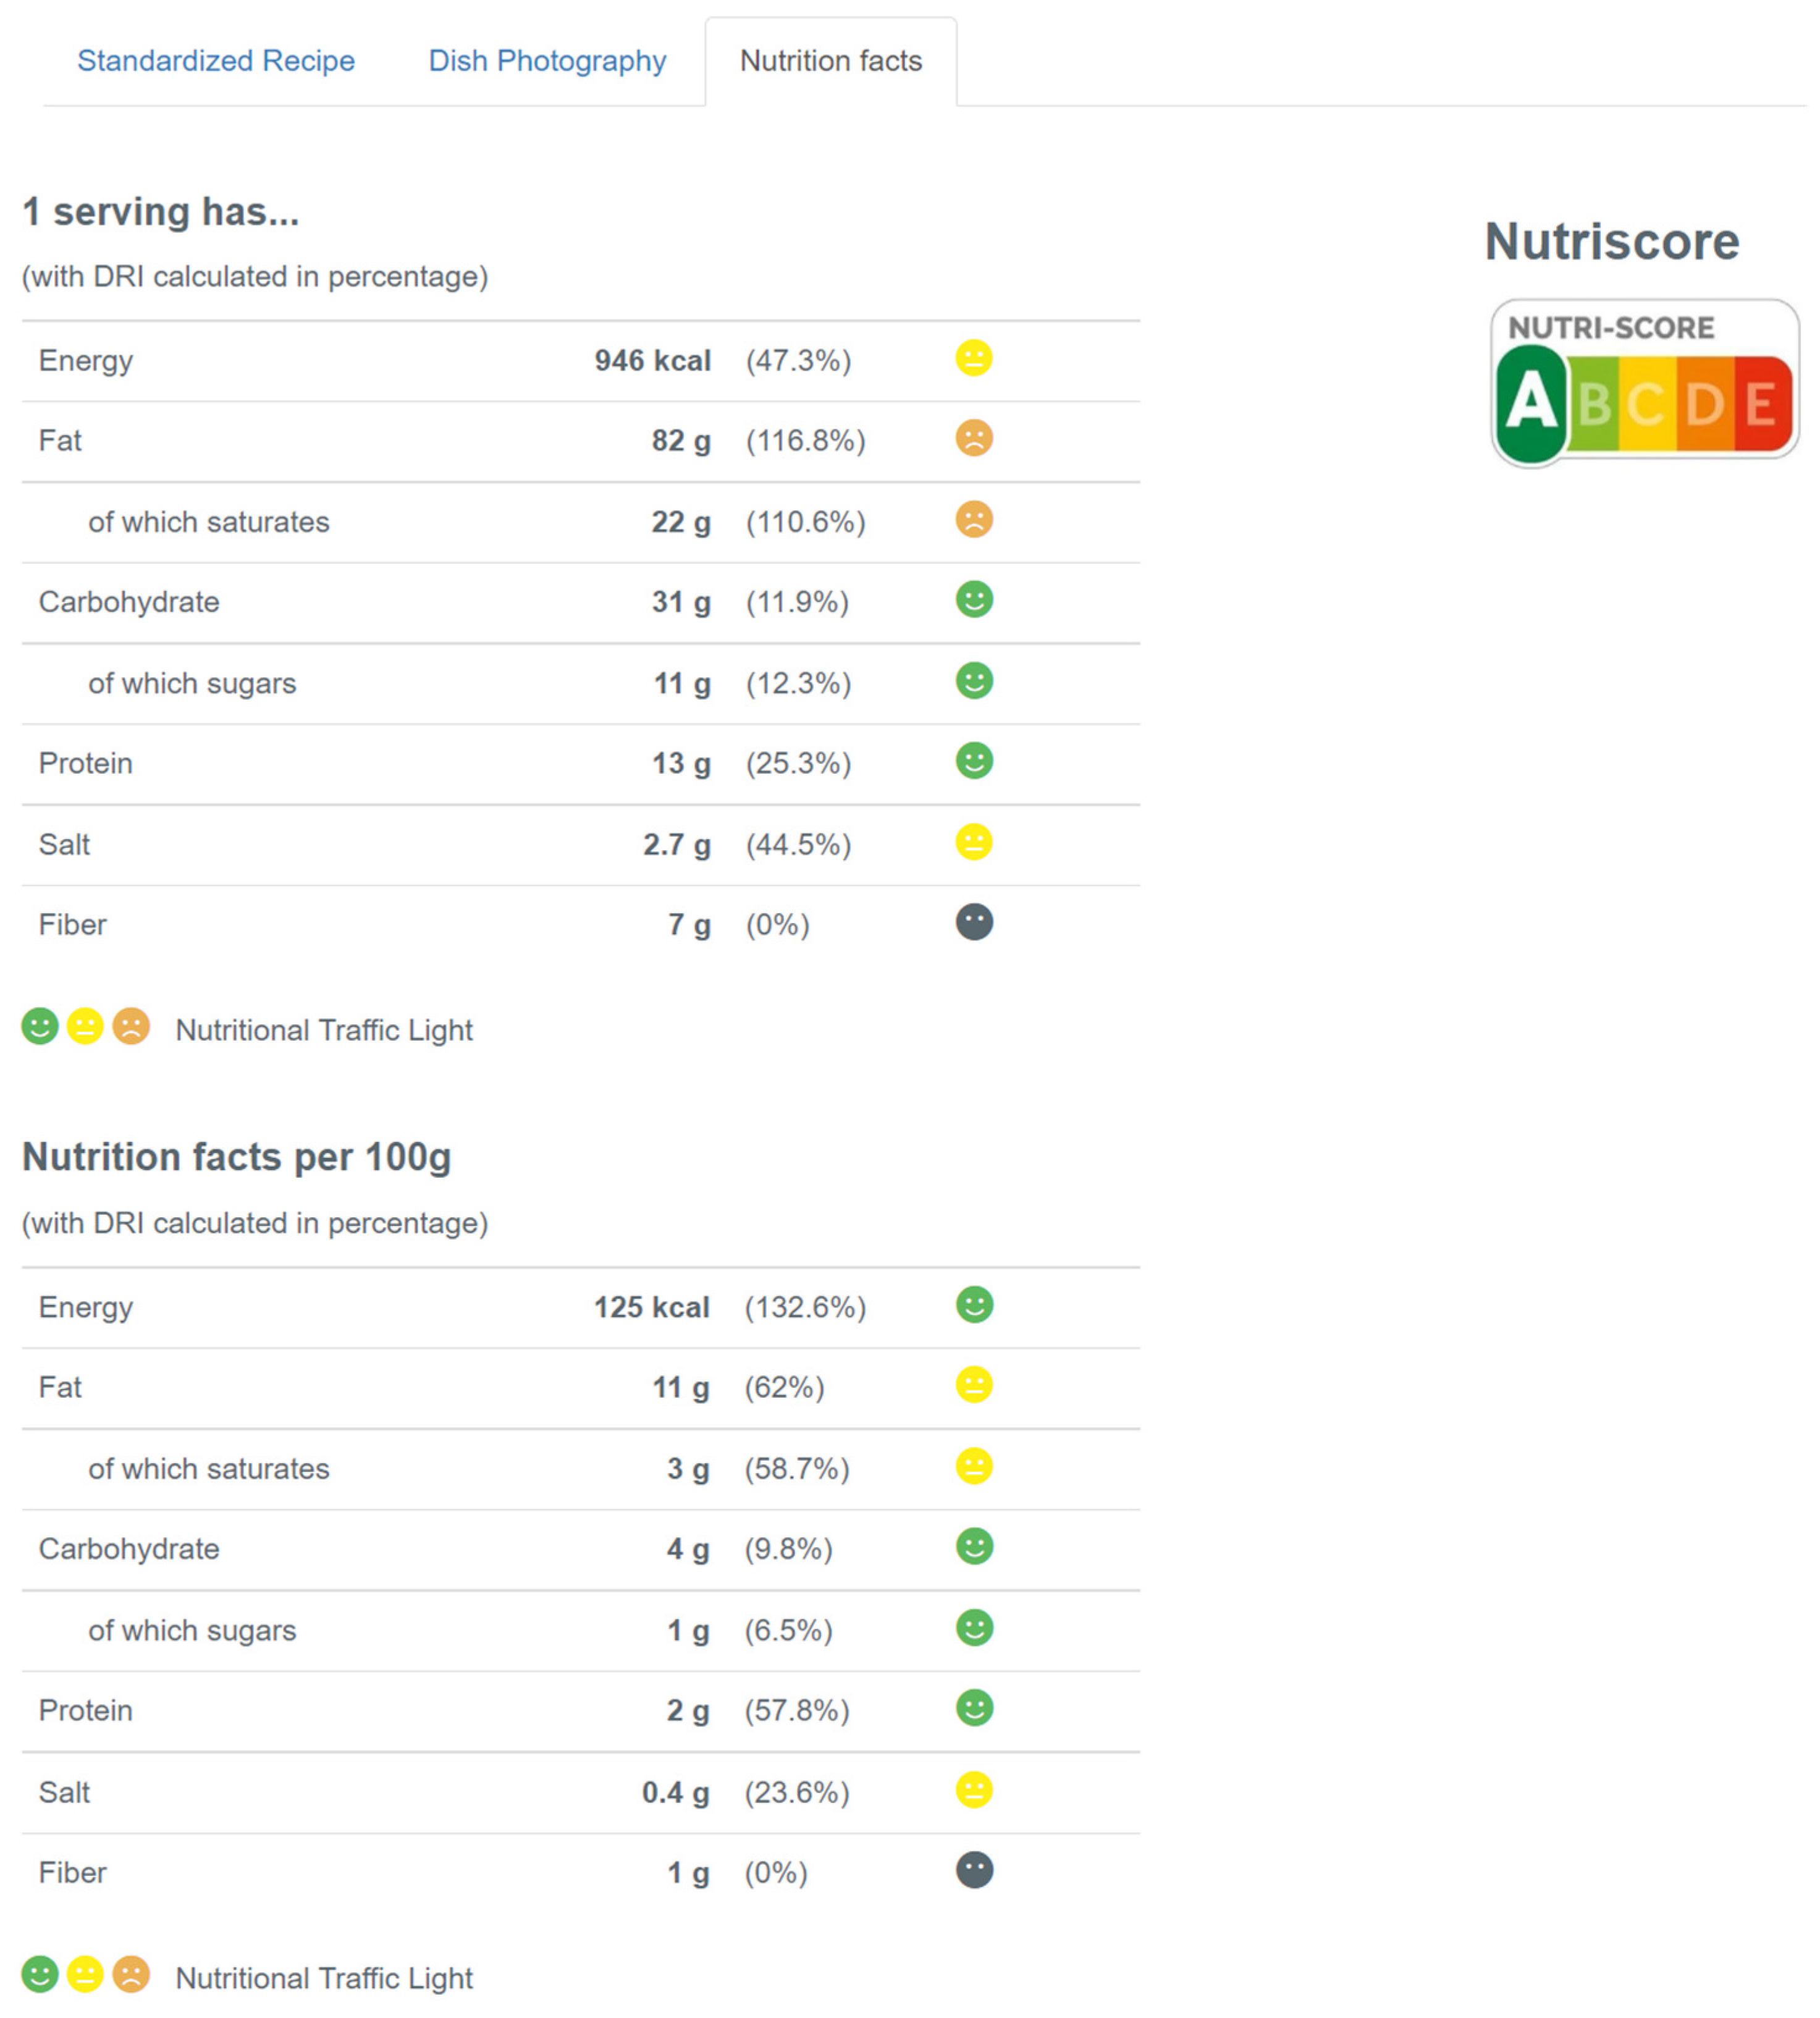
2.4. Nutrition Facts

Following European Regulation (EU) No. 1169/2011, and after a five-year period of implementation that ended in December 2016 for all member states, almost all pre-packed foods must bear a nutrition declaration, often presented on the back of the food packaging. This nutrition declaration must provide information, expressed per 100 g or 100 mL, regarding energy and total amount of fat, saturated fat, carbohydrates, sugars, protein, and salt. The nutritional declaration may also be expressed per portion or consumption unit of the product [34].
Several nutrition associations, consumer organizations, and commercial brands have been promoting the supplementation, or voluntarily supplementing the nutritional declaration with additional information, such as the amounts of monounsaturated and polyunsaturated fat, polyols, vitamins, and minerals. Furthermore, with easy-to-understand pictograms, customers may be able to make better informed food choices. Using these pictograms or indicating additional dietary information is not required under current EU standards. The EU did not recommend a standardized presentation format or a set of symbols when the law was adopted in 2011, and it was agreed to leave it up to member states and food business operators to establish their own schemes, adapted to their customers [35]. Some member states and non-EU countries already had different pictograms or symbols in widespread use before EU Regulation No. 1169/2011, and others adopted or developed them.
In Portugal, the two most used visual aids for nutrition information are a version of a nutritional traffic light label [36] and NutriScore [37]. The National Health Directorate proposed the nutritional traffic light label in its National Program for Promoting Healthy Eating (Programa Nacional para a Promoção da Alimentação Saudável—PNPAS), based on previous similar tools, such as the one proposed by the Food Standards Agency in the United Kingdom [35], and on the nutritional guidelines on healthy eating aimed at the public. This tool has been adopted by other community intervention and education projects, both regional and national.
The nutritional traffic light presents consumers with three colors, from which it is possible to decode F&B labels for every 100 grams (g) and milliliters (mL), respectively. In Portugal, since 2009, some companies have adopted the nutritional traffic light usage [38]. Table 1 presents the low, medium, and high labels per 100 g of food in sugars, fat, saturates, and salt.
Table 2 presents the low, medium, and high labels per 100 mL of beverage in sugars, fat, saturates, and salt.
The label “Low” is linked with the green color, while the yellow color is connected to the “Medium” label, and the label “High” with the red color. According to the original proposers of this tool [35], consumers can make healthier food choices, as green represents the healthiest option. Meals with nutrients classified as yellow should be consumed in moderation, either in quantity or frequency, whereas foods with red nutrients should be consumed only occasionally. The EU proposes a reference intake for energy, macronutrients, and salt, in healthy adults, shown in Table 3.
Nutri-Score is a system to evaluate nutritional profiles on food products. This rating system is used in Europe with a five-level scale, from A to E, which combines letters and colors. Thus, consumers can obtain information about a food product’s nutritional profile, helping consumers choose the most balanced foods and beverages. The letter “A” indicates the healthiest products, whereas the letter “E” corresponds to the least healthy products [39]. The Nutri-Score system was created by an exempt organization, and all producers that use it follow the same set of rules [37]. The Nutri-Score label is shown in Figure 1.
Nutrition facts play a detrimental role on the decision-making process of customers who are more aware of this information and adhere to certain dietary guidelines [21], resulting in requests for healthier dishes [40]. If a customer considers a given food to be highly nutritious, choosing it is more probable [41]. Hwang and Lorenzen [40] stated that customers feel more positive about choosing low-fat dishes, and according to Yamamoto et al. [42], customers are prepared to pay more for a dish that contains nutrition facts.
The Office of the Surgeon General et al. [43] suggested that nutrition facts should be available on the dishes, and DiPietro et al. [44] conclude that healthy foods are on the rise on restaurant menus. According to Davis et al. [9], Jeffrey [18], Patil and Pol [21], and the Centre for Tourism Studies (CESTUR) [11], nutrition facts can be included in the SR. Through the SR, it is possible to check nutritional values, quantities of the recipe, and the quality of the products [21]. The calculation of nutrition facts per 100 g is also achievable [28].

2.5. Sustainability

Sustainability can be described as policies that encourage the use, employment, and respect for natural resources with the purpose of preserving and conserving; the preservation and dissemination of genuine traditions and customs; the economic viability of institutions through the creation of jobs, tools, and tools suitable for them and the opportunity for entrepreneurship accessible to all [45]. The dimensions of sustainability can be mentioned at environmental, social, and governance levels and there are 17 sustainable development goals (SDG). The 12th SDG ensures sustainable consumption and production patterns by 2030 [46]. The same SDG aims for the reduction of food waste, whether at the level of production and supply chains or off-season harvesting. In addition to this situation, the 12th SDG encourages the development and implementation of tools that promote the local culture and products of the regions [47].
The concept of sustainability integrates the total use of food in the recipes to produce reuses, like broth [48]. Additionally, food that has deteriorated due to its expiry date, food leftovers from buffets or dishes produced in excess, and even the reduction of waste that comes from customers’ dishes [49]. It is possible to reduce waste through SRs sustainability functionality [21]. It avoids guesswork and the use of low-quality products [6]. It is essential to respect the seasonality of local products, only using them in their harvest seasons (e.g., [7,50,51]).

2.6. Allergens

“Food allergy is an adverse health reaction that occurs when the immune system misrecognizes a food as an aggressive entity to the body. The fraction of this food that is responsible for the allergic reaction is called an allergen” [52] (p. 5). The EU No. 1169/2011 clarifies the food groups where allergic reactions can occur, such as cereals containing gluten, crustaceans, eggs, fish, nuts, soya, milk, peanuts, celery, mustard, sesame, sulfur dioxide, lupines, and mollusks. Food allergy can also happen through cross-contamination between food products. Allergies may manifest mucocutaneous, gastrointestinal, respiratory, and cardiovascular effects [52]. The sentence in the menu, “If you have any food allergies to any of these 14 elements, please contact us” [53] (p. 44), is suggested by the Portuguese General Directorate of Health. Pádua et al. [53] advise cooks and confectioners to draw an SR for each dish, detailing the ingredients to be used and referencing the presence of allergens, always keeping it up to date. The Portuguese Association for Hotels and Restaurants (AHRESP) [54] states that it is mandatory to provide information about the allergens of each dish in F&B establishments.

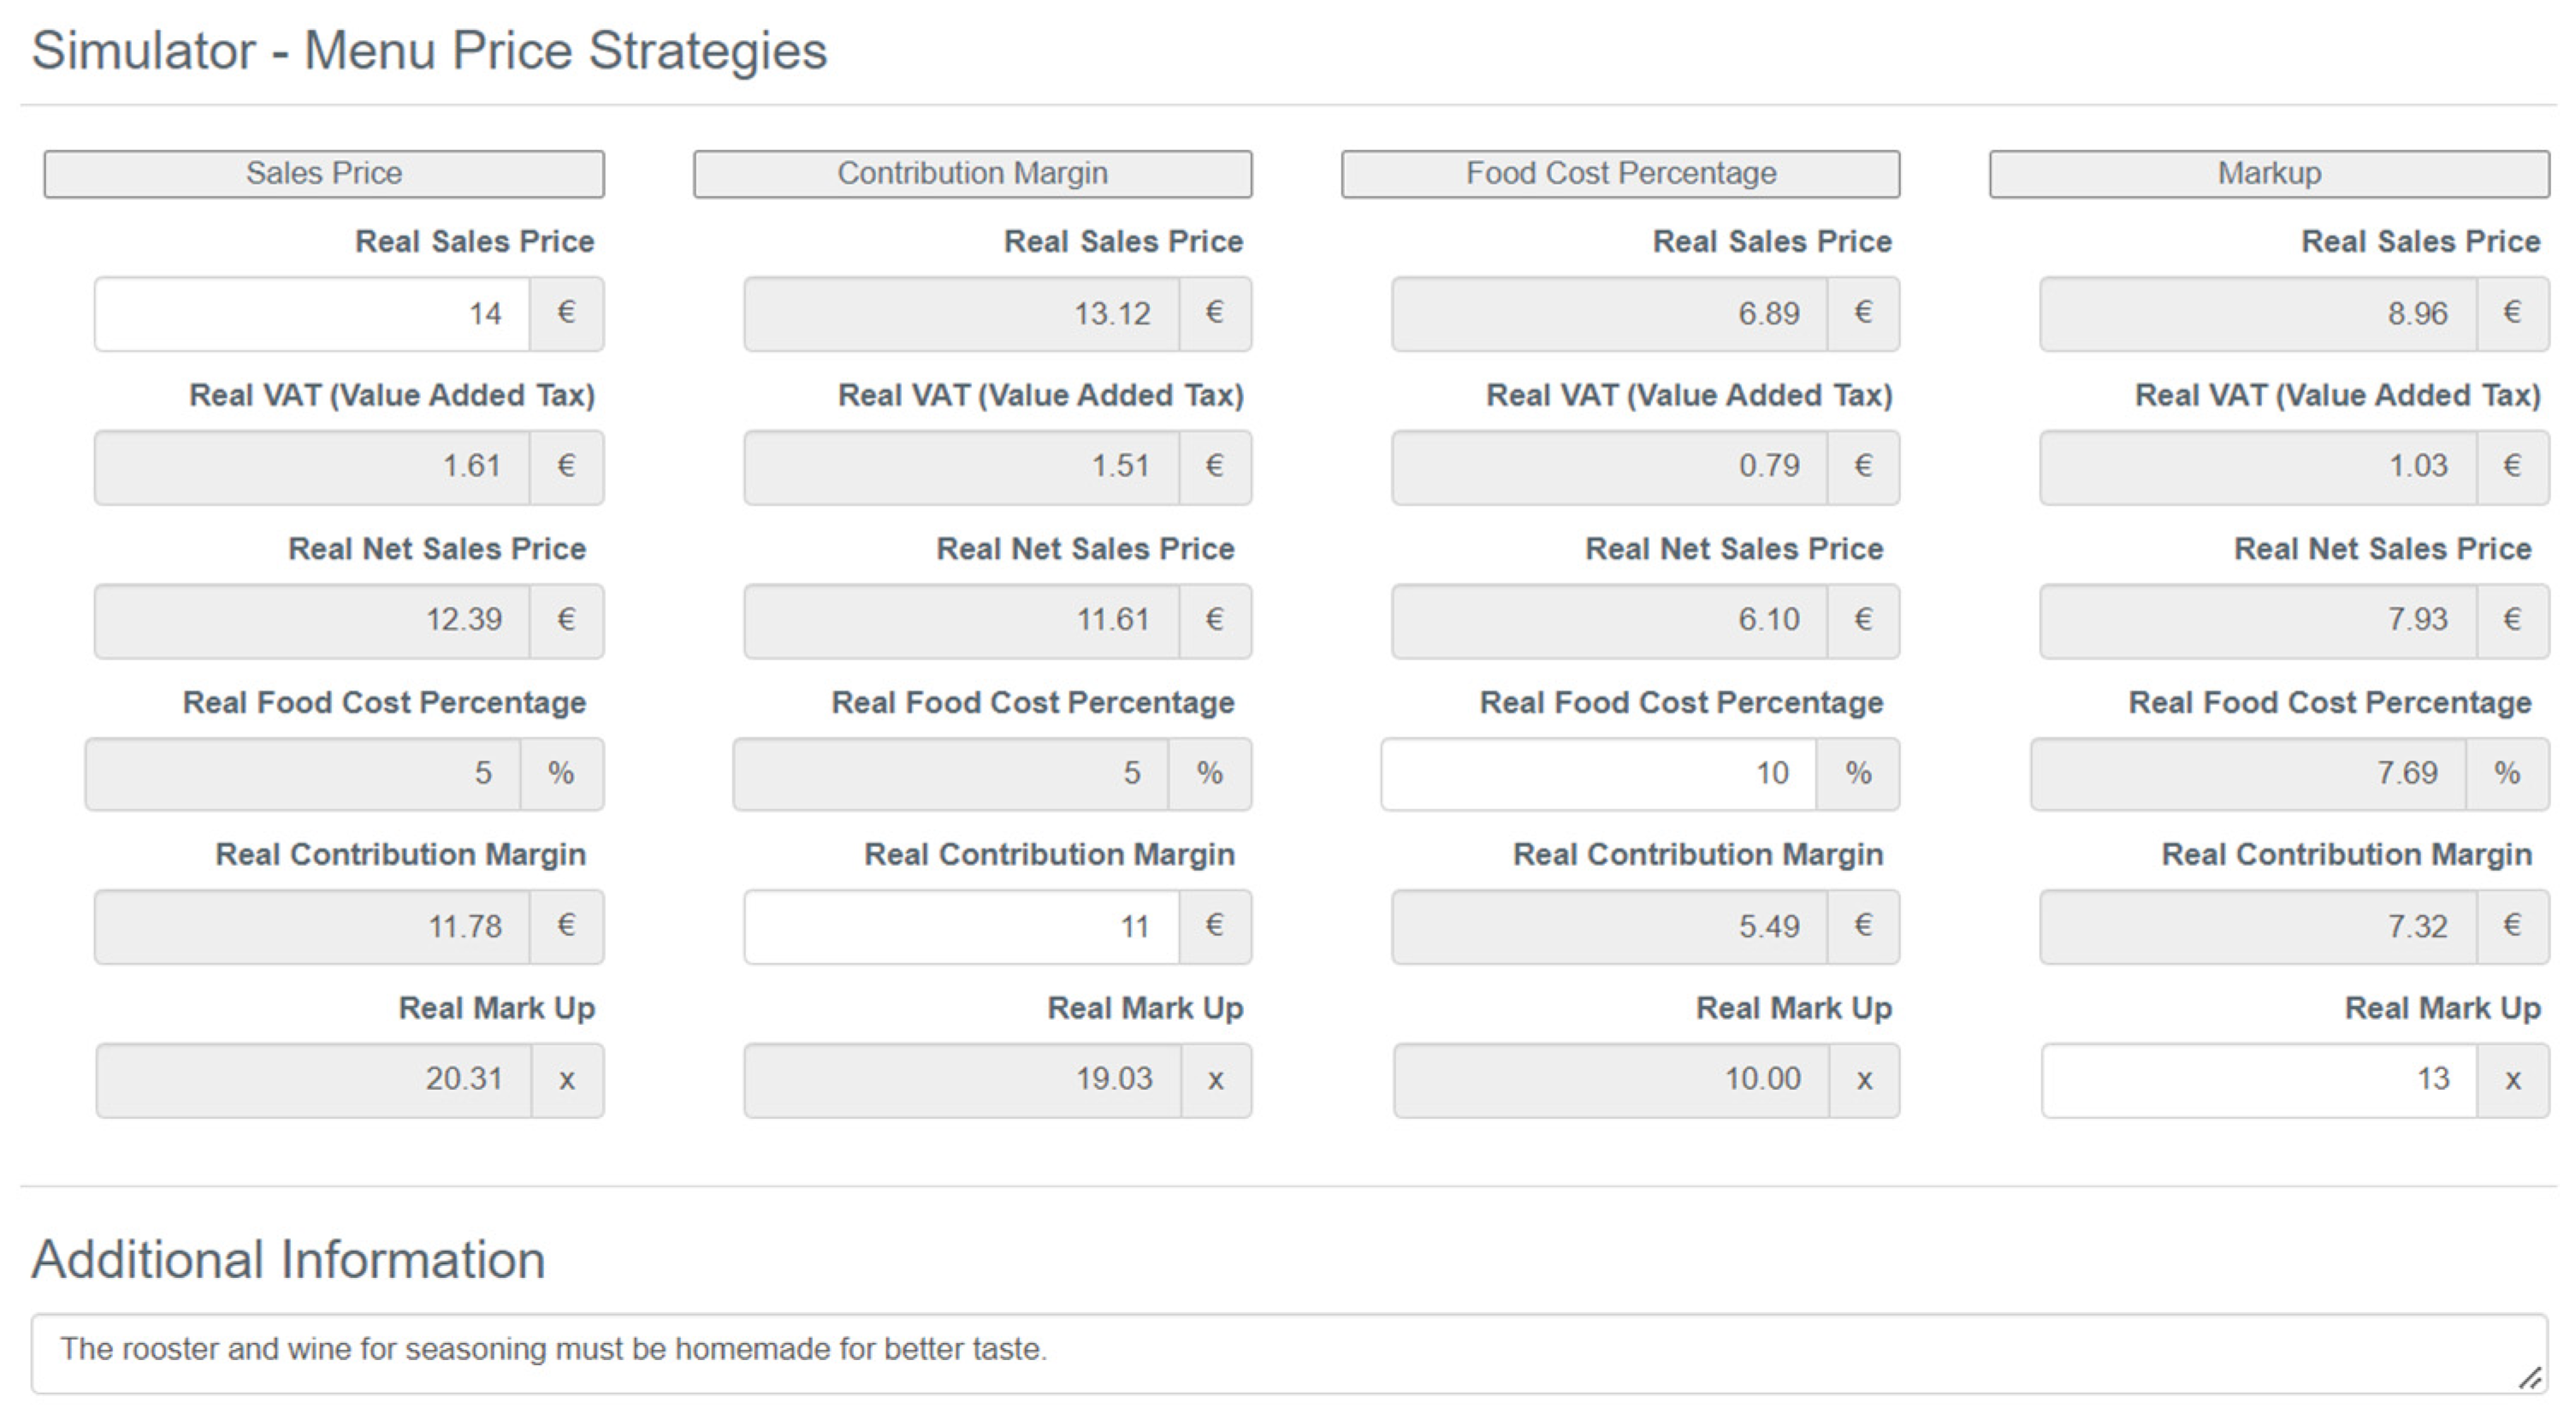
2.7. Menu Pricing Strategies
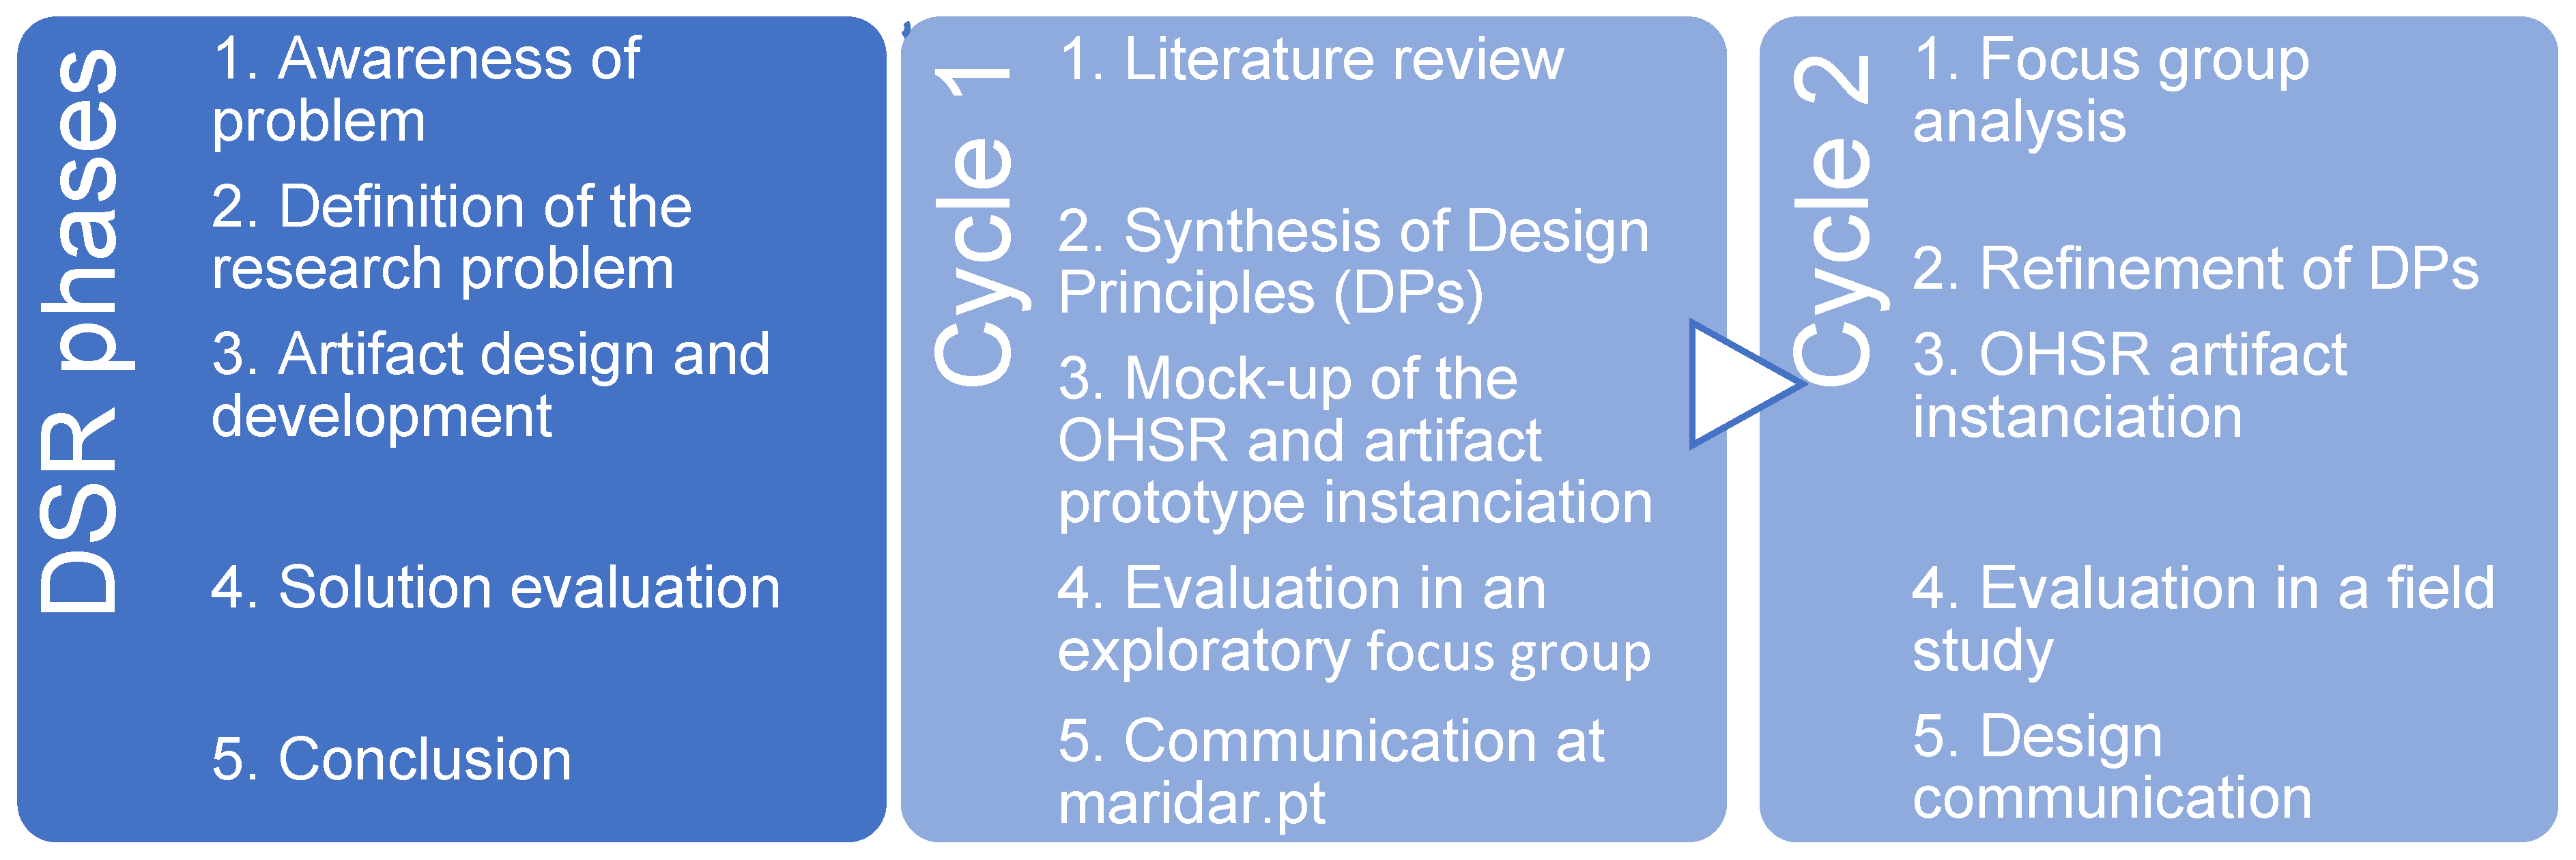
According to Barnard [6], there are qualitative and quantitative pricing strategies. Qualitative pricing strategies are widely discussed in the literature [55]. However, they neglect some management concepts, such as costs, revenues, and profit. Strategies such as the market positioning method, trial-and-error method, and the rule-of-thumb method are some examples [56].
The market positioning method is a price fixation method for menu dishes, focusing on the same dish sold by the competition, called competitive prices [57]. By observing the competition’s sale price, the manager can place the same price on its product, or a lower or higher price, depending on desired market positioning [9,11,27,58].
The trial-and-error method is used to fixate prices based on the manager’s intuition. Adjustments will be made later depending on this price, reflecting market fluctuations and considering supply and demand [9,57].
The rule-of-thumb method is based on a management indicator known as the F&B cost percentage. A food cost percentage of 34% is set based on data provided by the Restaurant Industry Operations Report 2006/2007. In general, this KPI manages to cover costs and generate revenue for restaurants that do not have a thorough knowledge of their costs.
Strategies such as the markup method, the food cost percentage method, the factor method, and the contribution margin method [58] are examples of quantitative strategies [6]. To use this type of pricing strategy it is necessary to know the cost price of a dish, which comes from the sum of all the unit costs of the ingredients in a CCSforSR [6].
A markup is a management indicator to which it is possible to multiply the cost price to find the NSP [9,59]. Mathematically it is possible to represent the markup method through the Formula (2) [10,11,12,32]:
Net   sale   price = Cos t   price   ×   Markup
The food cost percentage is a ratio between cost price and NSP [10,20]. A low food cost percentage ensures greater profitability for the establishment [60]. If the value is known, fixing the food cost percentage is recommended. Using Formula (3) it is possible to find the NSP to fix, using the food cost percentage method [11,12,24,27,28,32]:
Net   sale   price = Cos t   price Food   cos t   percentage
The factor method is used to find a markup, knowing the food cost percentage. The formula to use in a first approach is Formula (4), and then, to calculate the NSP, Formula (2) can be used [10,11,12,28]:
Markup = 100 Food   cos t   percentage
The contribution margin is the subtraction between the cost price and the NSP [59], gross profit concept in management [61]. If the value is known, it is recommended to set the contribution margin. Using Formula (5), it is possible to find the NSP using the contribution margin method [10,11,12,24]:
Net   sale   price = Contribuition   margin + Cost   price
No pricing method can be considered the best [10]. Pavesic [57] argues that a combination of menu pricing methods should be chosen, not disregarding factors such as location, market trends, restaurant quality, environment, and service, which are presented as closely linked with menu pricing. The NSP must predict profitability. However, ultimately the market will dictate its price [10,57].

3. Methods

A DSR methodology [62] was used to develop an online holistic standardized recipe, available through a web system that allows for dynamic updating and administration of information. The DSR methodology follows an artifact creation approach. DSR is associated with product and process type artifacts, described as technical and socio-technical artifacts [63]. The product artifact can be characterized by elaborating tools, diagrams, software, etc., used to accomplish tasks. The process artifact can be characterized by methods or procedures that guide people while performing a given task [64].
Thus, this research follows a product artifact creation approach. Additionally, as the technical artifact does not require human action after being launched but the socio-technical artifact requires human action to provide information, the present product artifact is characterized as a socio-technical artifact. Manipulation and management of the system will require human intervention, and some users will benefit from the system’s services [64]. According to March and Smith [65], this socio-technical product artifact is classified as instantiation type because it is a functional system that can be used to execute a practice or task.
In DSR, the usefulness of the artifact is considered to measure the relevance of the results [66]. In this study, the development of the OHSR artifact is a solution to a practical problem that F&B professionals and managers experience in their activities. This type of problem can be solved by means of an artifact. As design principles (DPs) for developing an OHSR are non-existent, this study will contribute to the knowledge in the area of information systems applied to F&B management. In this way, DSR produces results, DPs, and an artifact instantiation that are relevant for a local and global practice (i.e., a community of local practices and for the research community) [64].
The development of our DSR approach follows the model proposed by Kuechler and Vaishnavi [67] and is carried out in two design cycles, as shown in Figure 2.
On the left side of Figure 2, the DSR phases of the model used to conduct this research are represented by the (1) awareness of problem, the (2) definition of the research problem, the (3) artifact design and development, the (4) solution evaluation, and the (5) conclusion [67]. The artifact development will be conducted in a two-cycles process.
For a solid and complete approach to the awareness of problem, it was necessary to start the first design cycle with relevant knowledge found in an extensive and structured literature review, focused on the following keywords: SR, CCSforSR, allergens, sustainability (in terms of seasonality), and nutrition facts. The literature search was carried out using Google Scholar, Scopus, and Web of Science. We also collected information in books, technical and professional manuals and reports. Some authors propose SR and CCSforSR templates and models, frequently using spreadsheet software such as Microsoft Excel, which were useful for this stage of our study.
To the best of our knowledge, currently there is no web platform that compiles all the information we propose to use and, at this stage, the future artifact will have to solve an identified problem effectively [62]. There is a web platform originating in Brazil from which it is possible to extract information about SR with the indication of cost price (see [8]), but it neglects other requirements that our artifact foresees.
The second phase of the first cycle presents the DPs of the OHSR artifact. The DPs were defined based on the information supported in the literature review and interaction with relevant stakeholders to draw the design and identify functions of the OHSR mock-up and the OHSR artifact prototype instantiation. Document studies can provide an understanding of the practice under consideration, which provides clues for requirements [64].
The OHSR artifact in research has a holistic profile. Holistic is a concept that derives from Greek, translating into a synonym for integer [68], which can be described in the social and human sciences as a defender of the importance of an integral and general view of phenomena and not just the isolated analysis of factors that constitute it [69]. The OHSR will be the artifact resulting from the followed methodology, integrating a CCSforSR template and adding factors such as sustainability, nutrition facts, and allergens. In addition to the factors mentioned above, it is still possible to decide which menu pricing strategies to follow.
In the following phase (Cycle 1, Phase 3), a mock-up and prototype instantiation of the OHSR was created to address the problem requirements, the design, and functions defined in the mock-up and DPs of the previous phase. A mock-up of an artifact provides an overview of the functions and displays the interface between the artifact and the user. Additionally, what the artifact offers to the user facilitates communication among those involved in the construction of the artifact and provides guidance for further development. The prototype instantiation development used software prototype development techniques, pair design techniques, and peer reviews [64].
The next phase of the first cycle (Cycle 1, Phase 4) involved the artifact prototype instantiation’s ex-ante and naturalistic formative evaluation strategy. Evaluating the artifact prototype instantiation determines how well it can solve the problem and to what extent it fulfils the DPs. Ex-ante evaluation means that the artifact is evaluated without being used or fully developed, to obtain feedback for further improvement. Naturalistic evaluations are carried out in real settings with multiple stakeholders involved, ensuring different perspectives and interests. In this way, it is particularly valuable when evaluating socio-technical artifacts. The formative evaluation identifies opportunities to improve it during subsequent design activities and several iterations [70,71].
The evaluation strategy consisted of exploratory focus group research [72] involving a group of specialists, professionals, and users who tested and made suggestions for OHSR improvements. The group consisted of operational professionals, management professionals, nutritional professionals, students in the field, and even users with no management or F&B skills. The address of the web system used to conduct the evaluation is https://maridar.pt/sgftcomidas.
The last phase of the first cycle (Cycle 1, Phase 5) concerned the communication of the OHSR prototype instantiation by using and inserting 250 typical Algarve recipes on the website maridar.pt [73]. The website maridar.pt [73] is part of the IT-AMGABAlgarve [74] project that intends to develop an information technology system that compiles and presents relevant information about 250 typical Algarve recipes. These recipes are presented in their original form in an alternate, nutritionally improved version. This portfolio can be accessed by the public and catering professionals, focusing on recipes presented as a heritage of the region, with a high immaterial value.
The second cycle (Cycle 2, Phase 1) of the project started after the exploratory focus group and consisted of analyzing the data resulting from the evaluation process involving a group of specialists, professionals, and users.
In the next stage (Cycle 2, Phase 2), researchers improved the DPs through the suggestions and opinions resulting from the previous stage.
Then (Cycle 2, Phase 3), the research moved on to the OHSR artifact instantiation phase, following the same development techniques as Cycle 1, Phase 3: prototype instantiation software prototype development techniques, pair design technique, and peer reviews [64].
The next phase (Cycle 2, Phase 4) concerned the ex-post and naturalistic summative evaluation strategy of the OHSR artifact instantiation. Ex-post evaluation requires artifact employment and full development. Summative evaluation was carried out to determine the usefulness of our artifact [63,70].
The evaluation strategy was conducted with a field study research method. Two restaurant professionals were invited to submit their recipes on the platform in order to assess the proposed solution to the problem. Additionally, in the field study evaluation, students from the first year of the Hospitality Management master’s degree were invited to use the OHSR to develop group work.
Communication will be done through academic publications and conferences in the last phase (Cycle 2, Phase 5), open to peer review [64]. We intend for the OHSR to be used by professionals and students.

4. Design Principles

This section presents the DPs based on interaction with relevant stakeholders and the literature review of SR, CCSforSR, sustainability, nutrition facts, allergens, and menu pricing strategies. The literature review can provide an understanding of the practice under consideration and provide clues for requirements [64]. Additionally, it enables the identification of functional and non-functional requirements of the OHSR mock-up and the OHSR artifact prototype instantiation.

4.1. DP1: OHSR Header

The header of a given OHSR is formed by a set of information relevant to its construction. Ericson [13] suggests introducing the name of the dish (DP 1.1), classification (e.g., starter, main course, dessert, etc.) (DP 1.2), the number of servings (DP 1.3), total dish weight (DP 1.4), cooking temperature (DP 1.5), and cooking time (DP 1.6).
Moser [16] also suggests including the service type (DP 1.7), name of the person responsible for constructing the OHSR (DP 1.8), and name of the person responsible for verification (DP 1.9). Florendo [17] adds the total preparation time (DP 1.10) and reinforces the use of cooking time, cooking temperature, and the number of servings. Jeffrey [18] suggests concluding the OHSR with the inclusion of the date for the OHSR version (DP 1.11).
Miller et al. [12] suggest the cooking mode (DP 1.12). Gomes [20] argues that the selling point where the dish will be served should also be included (DP 1.13), and according to CESTUR [11], a code system for the dish, based on ingredient identifier (ID), should also be included (DP 1.14).
Serra [23] defends that the original region (DP 1.15) and ontological categories (DP 1.16) must be included. Due to the in-depth nature of our study, the categories were subdivided into two levels (DP 1.17). Following recommendations from Writer and Whitmore [22], we included recipe difficulty ratings, and decided to set them at three difficulty levels (DP 1.18).

4.2. DP2: Method of Procedure

Ericson [13], Florendo [17], and Miller et al. [12] argue that there should be a field describing the order-making procedures.

4.3. DP3: Instructions about Dish Presentation

According to Moser [16], in an SR is important to give instructions about dish presentation.

4.4. DP4: Ingredients

CESTUR [11] highlights the importance of ingredients’ ID (DP 4.1). According to Ericson [13], Florendo [17], and Patil and Pol [21], the quantity of each ingredient, both in terms of weights and exact measurements (DP 4.2), are essential. Ericson [13] defends that the weight or volume will be expressed in units (DP 4.3). Patil and Pol [21] and Ericson [13] also believe that the list of ingredients (DP 4.4) is very important. Gomes [20] states that the purchase cost of different items must be an indicator, and proposed including unit purchase price (DP 4.5). Abranja et al. [4] argue that the isolated cost for ingredients should be calculated for each one, which implies adding a cost subtotal (DP 4.6).
Ericson [13] defends that the quantities of each ingredient should be placed in the OHSR. For example, in terms of valuing this ingredient, one bay leaf should be placed according to the purchased unit of measurement. The DP 4.7 will have a field where the description corresponding to the example can be placed, naming alternative weight.

4.5. DP5: Product Seasonality Information

The products’ seasonality is related to the harvest times of each ingredient in an OHSR. It is imperative to respect the seasonality of products. Our objective was to alert the web system users that a given product is off harvest (DP 5.1), so that they can consider replacing it with a more sustainable option. DP 5.2 concerns the products at harvest time of the recipes. If the product is at harvest time, a green-colored calendar icon pops out, as shown in Figure 3a.
In turn, if the product is off harvest time, an icon with “✕” in a red color appears, as shown in Figure 3b.
This information is included in the OHSR header (DP 5.3) to alert users in general, in addition to the ingredient on a case-by-case basis.

4.6. DP6: Key Performance Indicators

Barnard [6] and Florendo [17] argue that the sum of all total unit costs is the total cost price (DP 6.1) of each OHSR. Dittmer [27] and Kotschevar and Withrow [28] argue that if an OHSR is constructed for more than one person, it is necessary to divide the cost price of the OHSR by the number of portions to obtain the cost price per person (DP 6.2).
The SP reflects the costs of production and preparation of the dishes [76]. After using simulations, it is suggested to include real management indicators, resulting from the real SP. Therefore, after using the simulator, real indicators will be available. Thus, it is necessary to enter real SP (DP 6.3), real VAT (DP 6.4), real NSP (DP 6.5), real contribution margin (DP 6.6), real food cost percentage (DP 6.7), and real markup (DP 6.8).

4.7. DP7: Menu Pricing Strategies

Jagels [56] argues that there are qualitative pricing strategies: the market positioning method, the trial-and-error method, and the rule-of-thumb method. The market positioning and trial-and-error methods must follow a pricing strategy through the SP (DP 7.1). The rule-of-thumb method should follow a pricing strategy through the food cost percentage (DP 7.2).
Barnard [6] identifies quantitative pricing strategies as the markup method, the factor method, the food cost percentage method, and the contribution margin method. The markup method (DP 7.3) is recommended by Dopson et al. [10], Miller et al. [12], Brito [32], and CESTUR [11].
The food cost percentage method (DP 7.2) is suggested by Dittmer [27], Kotschevar and Withrow [28], Miller et al. [12], Brito [32], Jones [24], and CESTUR [11].
The factor method is suggested by Dopson et al. [10], Kotschevar and Withrow [28], Miller et al. [12], and CESTUR [11]. Dopson et al. [10], Miller et al. [12], Jones [24], and CESTUR [11] suggested the contribution margin method (DP 7.4).
According to Dopson et al. [10], no pricing option is better than the other. Pavesic [57] argues that a combination of menu pricing strategies should be chosen. In the pricing strategy design process, it is necessary to simulate the differences that occur using one, two, or more pricing strategies simultaneously (DP 7.5).

4.8. DP8: Additional Information

All complementary information not visible in DP1 should be included in DP8. There are some broad and comprehensive DPs. We propose following the method suggested by Ericson [13], who states that descriptive terms of actions in each ingredient should be included (e.g., cut into cubes, slices, etc.). Additionally, the use of cooking terminology, the use of only the front of a recipe and not writing on the back, and the inclusion of directions for serving (e.g., garnishes, accompaniments, serving equipment), recipients of production, and pan size, are also recommended.
Patil and Pol [21] and Ericson [13] argue that the specific quality of ingredients should be mentioned (brands) due to the change in flavors that occurs between brands. Jeffrey [18] proposes including instructions for storing and using leftovers, if considered relevant.

4.9. DP9: Dish Photography

Olsen [19] and Ribeiro [5] suggest not neglecting the way that a dish should be presented (DP9), and suggest including photography to document desired presentation. Gomes [20] reinforces the importance of presenting the dish (DP3) (e.g., on a separate platter, on the same plate, or the complementary decoration to be included).

4.10. DP10: Allergens List

The sentence in the menu, “If you have any food allergies to any of these 14 elements, please contact us” [53] (p. 44), is suggested by the Portuguese General Directorate of Health. For this to happen, Pádua et al. [53] advise that an up-to-date SR for each dish should exist, detailing the allergenic ingredients (DP10). AHRESP [54] proposes that an F&B establishment provide its customers with mandatory information about the allergens in each dish.

4.11. DP11: Nutrition Facts

The European Regulation (EU) No. 1169/2011 refers to energy, total fat, saturated fat, total carbohydrates, sugars, protein, and salt. The same regulation defines fiber content as mandatory supplementary information (DP 11.1). The reference intake for adults was transformed into a percentage (DP 11.2) and, based on commonly used dietary intake information [77], it was considered that an adult should have, on average, three meals a day. Additionally, the nutritional traffic light categories were computed (DP 11.3) whenever possible. In all other instances, an “information not available” icon appears.
The European Regulation (EU) No. 1169/2011 refers that it is important to use symbols and icons. The green-colored icon concerns 1/3 of the reference intake, as shown in Figure 4a below. This information was also calculated as a percentage value of the reference intake.
The yellow-colored icon concerns 2/3 of the reference intake, as shown in Figure 4b below. This information was also calculated as a percentage value.
The orange-colored icon concerns 3/3 of the reference intake, as shown in Figure 4c below. This information was also calculated as a percentage value.
The grey-colored icon, as shown in Figure 4d, symbolizes that there is no information available about the product.
Davis et al. [9], Jeffrey [18], Patil and Pol [21], and CESTUR [11] claim that nutrition facts can be entered on the OHSR. As suggested in the literature, we defined it as a DP, making it possible to calculate nutrition facts for every 100 g (DP 11.4) [28] and one serving of the dish (DP 11.5).
Another DP to be presented is the Nutri-Score (DP 11.6), ranging between A to E. The first category, A, refers to healthier dishes, and the last category, E, refers to less healthy dishes, as shown in Figure 1 and used in Figure 5.
In Figure 5, we can see the OHSR mock-up resulting from the DPs presented in this section of the paper. This OHSR mock-up supported by the DPs served as the basis for designing and developing the OHSR artifact prototype.

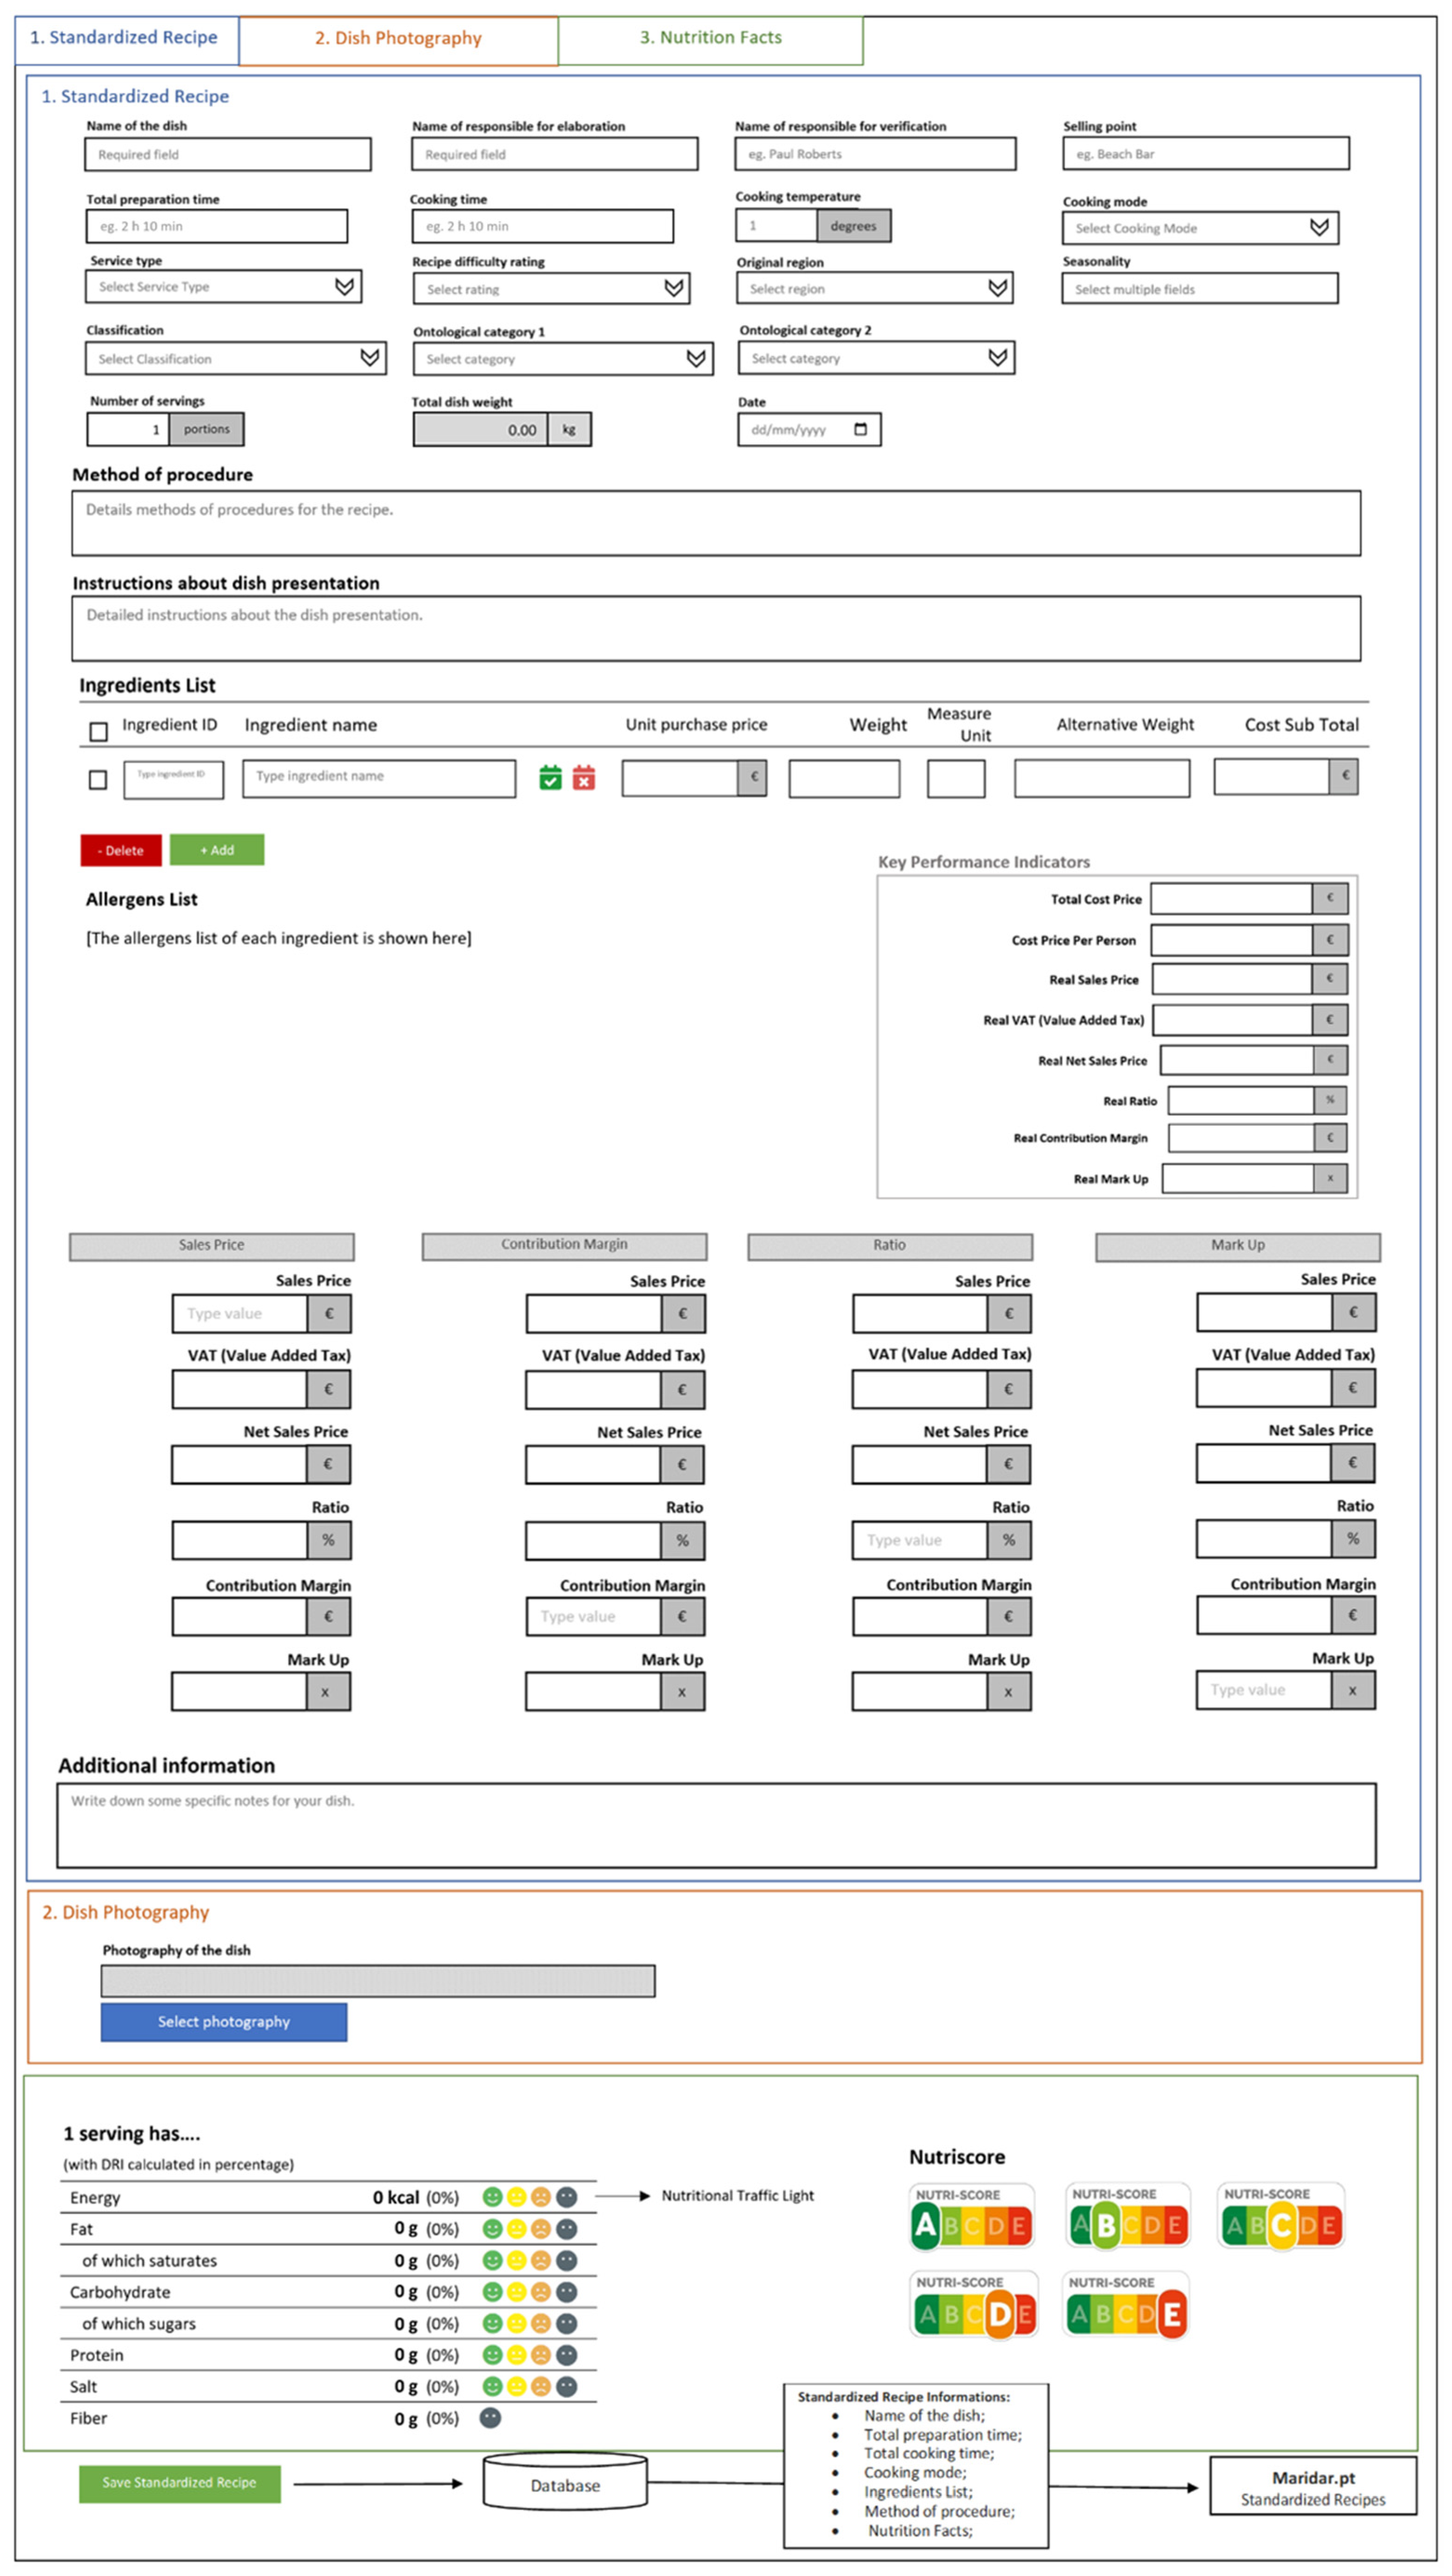
5. OHSR Artifact Development

5.1. Cycle 1: OHSR Prototype Development and Exploratory Focus Group

In the first development cycle, an OHSR prototype was instantiated with the implementation of the 11 DPs subdivided among other DPs and the design proposed in the mock-up. The OHSR prototype was evaluated with an exploratory focus group method.
The development of the OHSR prototype artifact was instantiated on http://maridar.pt/sgftcomidas and was carried out by a small group of software and usability researchers. As the knowledge base for the activity, the group used software prototype development techniques. Furthermore, the group frequently used pair design to design the functions, the UI, and the architecture. Additionally, the process used peer reviews to obtain feedback from different stakeholders. To develop the instantiation of the OHSR prototype, an internet hosting service was installed with the following technical features: Linux operating system, MySQL database, PHP language, and Bootstrap. It was necessary to use PHP and JavaScript language, CSS, and Bootstrap in the development process.
The evaluation strategy of the artifact prototype instantiation was structured with an exploratory focus group research method. Specialists, professionals, and potential users participated in this exploratory focus group. Four groups of specialists, professionals, and users were formed, each with its own schedule. The focus group session was held online, and group members were notified by email. The exploratory focus groups’ goal was previously specified as validating the integration of DPs and the design proposed in the mock-up in the OHSR prototype. In addition, we asked for suggestions for changes that would make the OHSR prototype instantiation process easier.
The online sessions began with a briefing on the objectives and tasks to be completed. The participants were then instructed to insert an SR into the platform. Finally, we moved on to a discussion of suggestions and enhancements, which resulted in the creation of new DPs or adjustments to existing DPs. The session was recorded and later deleted. Two culinary arts students, one IT student, one chef, two food engineers, one management and IT teacher, one IT engineer, one hotel manager, and two users with no management or F&B abilities make up the total of 11 group members. During the sessions, some functioning problems were noted, such as difficulties adding commas in the field for ingredients quantity. Furthermore, the nutritional traffic light was not functioning properly, the ingredients list field was designed to search ingredients by the "contains" rule rather than "starts with" rule, and while uploading a photograph for the dish, some image formats were not supported by the platform.
Validation tests were carried out by the participants. The probable introduction of alphanumeric data was one of the errors to be reported. When they were supposed to be restricted to numeric fields, there were no defined mandatory fields, and it was possible to introduce SR names with more than one hundred characters. The suggestions for improvement were related to changes such as: (1) adding a “save” button and a “save and close” button, (2) the simulator having a different appearance depending on the KPI, (3) assumption that the person responsible for the elaboration is the user inputting information in the platform, (4) insertion of a website redirect that allows the user to submit new data to created drop-down lists, and (5) addition of emojis associated with nutritional traffic light colors.
Functional errors were corrected and not all the suggestions were considered. However, notes were taken for future updates to the platform. The success and contributions that could result from this focus group depended on the quality of information and knowledge held by group members and, thus, it was essential to collect participants’ views, perceptions, and experiences, since they intervened in the process.

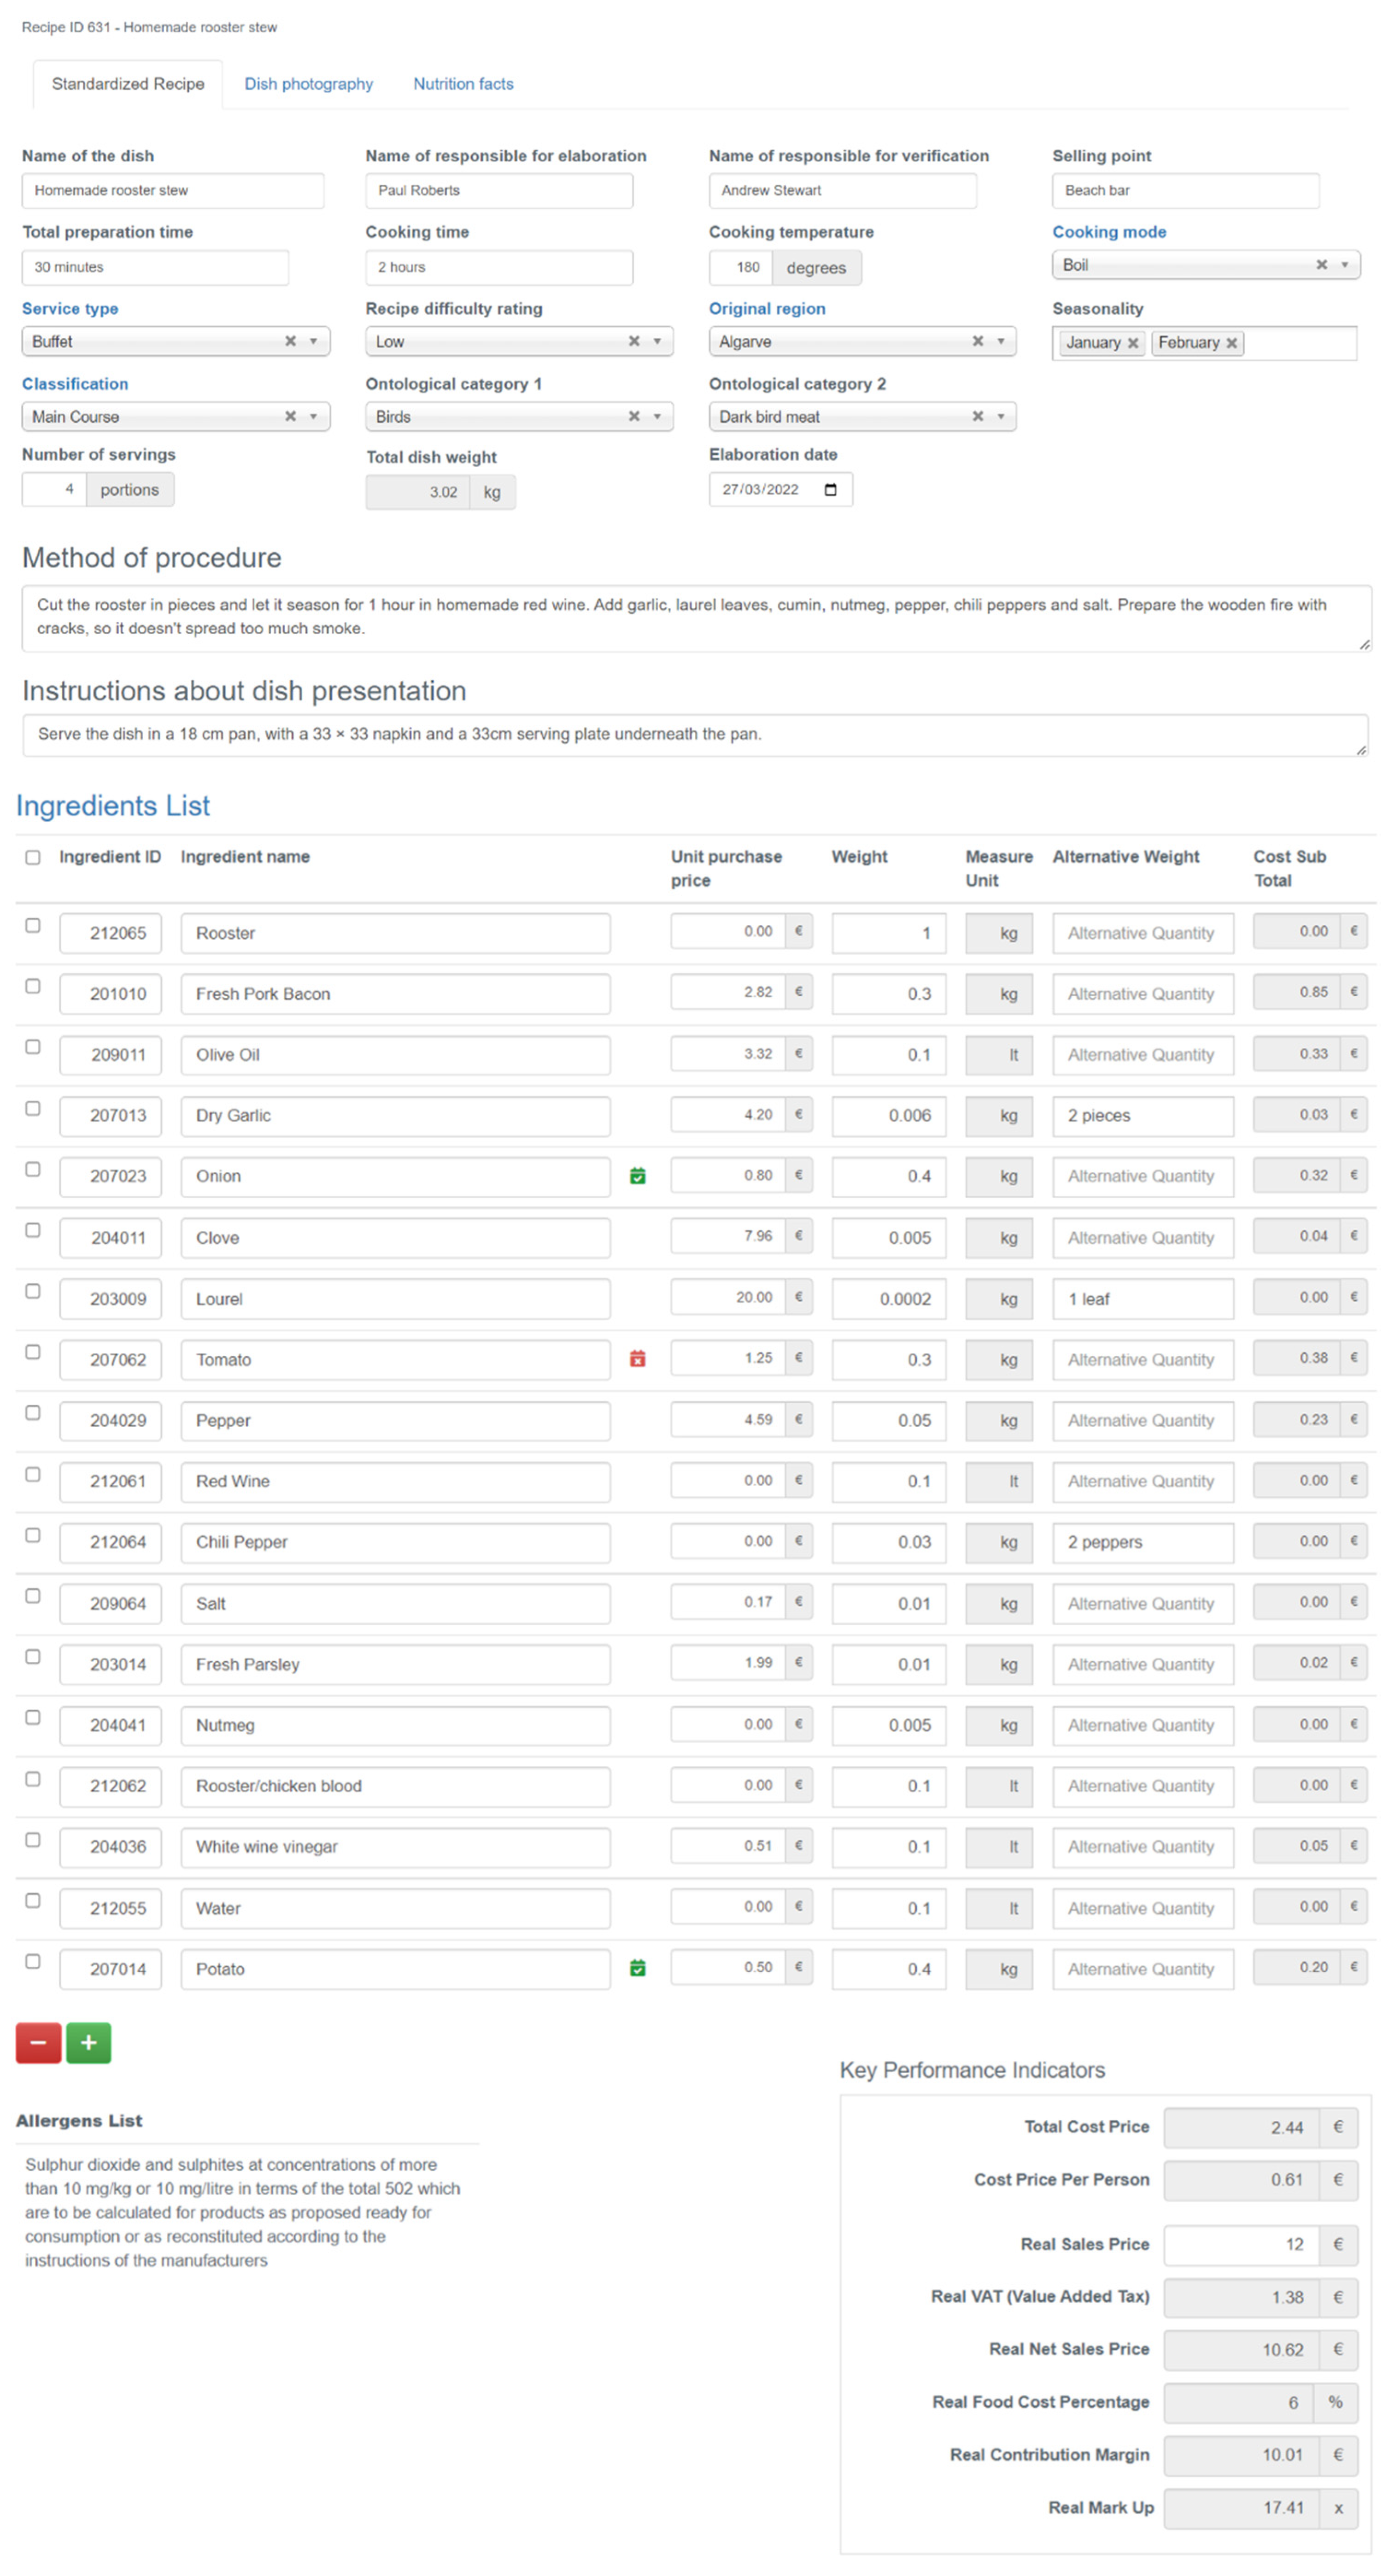
5.2. Cycle 2: OHSR Artifact Development and Evaluation in a Field Study

In the second development cycle, the OHSR artifact instantiation phase followed the same development techniques and technical features used in the prototype development phase. The OHSR artifact instantiation development incorporated improved DPs (see Figure 6, Figure 7 and Figure 8) due to the data analysis resulting from the OHSR prototype evaluation process involving the group of specialists, professionals, and users. OHSR artifact was instantiated on the website maridar.pt [73] that is part of the IT-AMGABAlgarve [74] project and intends to develop an information technology system that compiles and presents relevant information about Algarve recipes and support F&B operational and managerial process.
According to Venable et al. [63] and Pries-Heje et al. [70], in the research phase of OHSR artifact evaluation, the artifact was submitted to an ex-post and naturalistic summative evaluation strategy with a field study research method to determine the usefulness of the artifact. A group of 24 students from the first year of the Hospitality Management master’s degree and two restaurant owners and managers from the Algarve region participated in this second cycle phase. The scope and objectives of the field study were explained in an email to the participants. Three separate users were created in the platform, one for each of the restaurant managers and one for the group of students. Students proceeded with the insertion of 18 OHSRs on the artifact. The managers started introducing all their SRs on the online system.
Participants felt the need for some explanations before starting the process. The situations reported concerned the ingredients list, containing around 1390 ingredients. The OHSR artifact does not include all the ingredients needed for the restaurants’ SRs. The upload of some photos was not possible, and the “print” function also had some usage issues. Some issues with the nutrition data tab, particularly in the "nutrition facts per 100 g" section, were also noticed. Users offered some suggestions for improvement, given that the table generated for Microsoft Excel does not contain all of the information shown in the OHSR. All users praised the OHSR artifact and agreed that it was useful. After these two DSR research cycles, the OHSR artifact incorporated contributions from all those involved in the process. Around 37 people participated in our study, demographically distributed between 25 women and 12 men. In the first cycle, 75 occurrences were reported, and 38 of the previously reported situations were included in the OHSR. The OHSR features three tabs denominated “Standardized recipe”, “Dish photograph”, and “Nutrition facts”.
Figure 6 presents the OHSR header (DP1), the method of procedure (DP2), the instructions about dish presentation (DP3), the ingredients (DP4), the product seasonality information (DP5), the KPIs (DP6), the menu pricing strategies (DP7), the additional information (DP8), the dish photograph (DP9), the allergens list (DP10), and the nutrition facts (DP11). Figure 6 refers to the information seen in the first tab of the OHSR. Figure 7 presents the information found in the second tab of the OHSR, which concerns the DP9 named dish photograph. The photograph of the dish can be directly uploaded to the OHSR from the device. Figure 8 depicts the information included in the OHSR’s third tab, which is dedicated to the DP11 nutrition facts.

6. Conclusions

We used DSR methodology to develop an online holistic standardized recipe, which proved to be a useful and appropriate method for creating the artifact on the website maridar.pt [73], which is part of the IT-AMGABAlgarve [74] project. This project sought to develop a dynamic web platform to support F&B operations. After free registration, it is possible to insert and manage standardized recipes with holistic characteristics using information from SR, prices, sustainability, nutrition data, and menu pricing adjustments. This OHSR can aid in the production of consistent, high-quality dishes [12] and provides information on nutrients per serving and pricing, allowing institution managers to better anticipate the selling price to be fixed [21]. In terms of sustainability, eating meals at the proper time [50] can help to reduce environmental impact, which contributes to the 12th SDG.
A structured literature review was required to describe all DPs suited for the intended artifact in the two-cycle DSR methodology with five phases [67]. Similar platforms already exist but they are not as comprehensive as OHSR and are not provided free of charge to its users. Our project’s rigor and relevance were ensured by combining the literature review, exploratory focus group, and field study [78].
A focus group approach allowed to record experts’ feedback, in order to validate DPs and promote improvements to the final artifact and the platform. The field study also made validating DPs possible and allowed us to have a broader view of the process, by involving professionals and students. All the suggestions from participants were considered pertinent and contributed to an improved artifact.
During the evaluation process, the artifact was deemed valuable and relevant [66] to the difficulties that F&B professionals and managers face in their daily activities. Furthermore, the lack of design principles (DPs) for designing an OHSR make this study useful and a contribution to information systems applied to F&B management. The DSR was used to generate DPs and an artifact that is relevant to both local and global practice (i.e., a community of local practices and for the research community). With the OHSR use, maridar.pt presents an inventory of 250 recipes of typical dishes from the Algarve region, and their nutritionally improved versions, totaling 500 OHSR. It should be noted that by free registering on https://maridar.pt/sgftcomidas, users and professionals are given the possibility to create their own OHSR. Users can change and add new OHSRs at any moment in their own personal section.
Future research may improve this artifact. Not all SRs contemplate the amounts in edible portions because of the waste that food suffers [10]. Thus, further studies detailing OHSR on this topic should be conducted. For better and healthier nutritional information, information on average calories of food items and beverages should be computed and displayed in the OHSR [79]. Difficulties regarding traditional dishes from other parts of the country, and possibly from other countries, would be interesting to discuss. Because neither party has previous knowledge of sales, labor costs, or other costs, other menu pricing options were not addressed in this work. Thus, it is suggested that certain menu pricing strategies, as described by Barnard [6], Kotschevar and Withrow [28], and CESTUR [11], be implemented. Other qualitative characteristics, such as atmosphere, location, and surroundings, are explored by Davis et al. [9] and Miller et al. [12] and may be incorporated in menu pricing techniques.

Author Contributions

Conceptualization, D.S., M.S. and C.M.A.; methodology, D.S., M.S. and C.M.A.; software, D.S., M.S., E.P., C.M.A. and C.M.d.A.; validation, D.S., M.S., C.M.A., E.P. and C.M.d.A.; formal analysis, D.S., M.S., C.M.A., E.P. and C.M.d.A.; investigation, D.S., M.S., C.M.A., E.P. and C.M.d.A.; resources, D.S., M.S., C.M.A., E.P. and C.M.d.A.; data curation, D.S., M.S., C.M.A., E.P. and C.M.d.A.; writing---original draft preparation, D.S., M.S., C.M.A., E.P. and C.M.d.A.; writing---review and editing, D.S., M.S. and C.M.A.; funding acquisition, M.S. and C.M.A. All authors have read and agreed to the published version of the manuscript.

Funding

This work was financially supported by European Structural and Investment Funds (FEEI)—Feder, within the scope of the project SAICT-ALG/39590/2018.

Institutional Review Board Statement

Ethical review and approval were waived for this study, due to experts giving expression permission to publish results and the study not involving humans or animals.

Informed Consent Statement

Informed consent was obtained from all subjects involved in the study.

Acknowledgments

We are grateful to Nuno António, Mariana Afonso, and Rita Jacinto, IT-AMGABAlgarve project team members, for their support. We are also grateful to the experts who contributed with their knowledge in the focus group process for the artifact evaluation. We thank “O Chefe Silvestre”, “Tertúlia Algarvia”, and F&B master students for their support in the field study process for the artifact evaluation.

Conflicts of Interest

The authors declare no conflict of interest.

References

  1. Movelife Solução Intuitiva e Adaptada Ao Seu Negócio. Available online: http://www.movelife.net/horeca.html (accessed on 1 August 2021).
  2. UNWTO. Second Global Report on Gastronomy Tourism; Affiliate Members Report: Madrid, Spain, 2017; ISBN 978-92-844-1869-5. [Google Scholar]
  3. Serra, M.; Pinto, E.; Afonso, C.; Antonio, N. Composição Nutricional de Iguarias Típicas do Algarve Seleccionadas Por Especialistas; TMS Algarve: Olhão, Portugal, 2016. [Google Scholar]
  4. Abranja, N.; Almeida, A.E.; Almeida, M. Gestão Hoteleira: O Produto, o Serviço e as Técnicas, 1st ed.; Lidel—Edições Técnicas: Lisboa, Portugal, 2020; ISBN 978-989-752-510-0. [Google Scholar]
  5. Ribeiro, J. A Gestão Na Restauração—Práticas de F&B, 1st ed.; Ex-Libris: Lisboa, Portugal, 2015; ISBN 978-989-8714-38-1. [Google Scholar]
  6. Barnard, M.W. A Case Study to Examine the Application of Food Cost Theories in Menu Pricing and Cost Control Management within a New Restaurant Operation. Master’s Thesis, University of Nevada, Las Vegas, NV, USA, 2009. [Google Scholar]
  7. Prato Certo Produtos Sazonais e Locais. Available online: https://www.pratocerto.pt/produtos-e-produtores/produtos-sazonais-e-locais (accessed on 1 August 2021).
  8. Menu Control Software Para Ficha Técnica de Alimentos e Precificação. Available online: https://www.menucontrol.com.br/ (accessed on 15 August 2021).
  9. Davis, B.; Lockwood, A.; Alcott, P.; Pantelidis, I.S. Food and Beverage Management, 4th ed.; Elsevier Ltd.: Oxford, UK, 2008; ISBN 978-0-7506-6730-2. [Google Scholar]
  10. Dopson, L.R.; Hayes, D.K.; Miller, J.E. Food and Beverage Cost Control, 4th ed.; John Wiley & Sons, Inc.: Hoboken, NJ, USA, 2008; ISBN 978-0-471-69417-5. [Google Scholar]
  11. CESTUR. Guias Técnicos de Investimento em Turismo—Gestão em Restauração e Bebidas, 1st ed.; Instituto de Turismo de Portugal: Lisboa, Portugal, 2006; ISBN 978-972-99590-2-8.
  12. Miller, J.E.; Hayes, D.K.; Dopson, L.R. Food and Beverage Cost Control, 2nd ed.; John Wiley & Sons, Inc.: New York, NY, USA, 2002; ISBN 0-471-35515-1. [Google Scholar]
  13. Ericson, M.H. Recipe Standardization: Standardize Recipes to Eliminate the Guesswork and Maintain Better Quality, Portion, and Cost Controls. Cornell Hotel. Restaur. Adm. Q. 1960, 1, 55–59. [Google Scholar] [CrossRef]
  14. Goldman, K.L. Concept Selection for Independent Restaurants. Cornell Hotel. Restaur. Adm. Q. 1993, 34, 59–72. [Google Scholar] [CrossRef]
  15. WebstaurantStore Choosing a Restaurant Concept. Available online: https://www.webstaurantstore.com/article/149/how-to-choose-a-restaurant-concept.html (accessed on 15 December 2021).
  16. Moser, F. Manual de Gestão de Alimentos e Bebidas, 1st ed.; Edições CETOP: Mem Martins, Portugal, 2002; ISBN 978-972-641-521-3. [Google Scholar]
  17. Florendo, M.S. Standardizing Selected Quantity Rice Recipes for Use in the Philippines. Master’s Thesis, Oklahoma State University, Stillwater, OK, USA, 1966. [Google Scholar]
  18. Jeffrey, J.L. Establishment of a Master Cycle Menu and Standardized Recipe System for Residence Halls Food Service. Master’s Thesis, Oklahoma State University, Stillwater, OK, USA, 1967. [Google Scholar]
  19. Olsen, M. The Systems Approach to Food Service Management: A Labor Cost Control System; Virginia Polytechnic Institute and State University: Blacksburg, VA, USA, 1977. [Google Scholar]
  20. Gomes, V. Introdução à Gestão de Alimentação e Bebidas, 1st ed.; Lidel—Edições Técnicas: Lisboa, Portugal, 2017; ISBN 978-989-752-250-5. [Google Scholar]
  21. Patil, H.N.; Pol, R. A Study on Effects of Standardized Recipes of Bakery Products in Pune Region. Int. J. Multidiscip. Consort. 2014, 1, 82–91. [Google Scholar]
  22. Writer, G.; Whitmore, V. Recipe Difficulty Ratings. Available online: https://www.cdkitchen.com/feeddaily/recipe-difficulty-ratings/ (accessed on 30 June 2021).
  23. Serra, M.A.D. Algarve—Relação Enogastronómica. Master’s Thesis, Universidade of the Algarve, Faro, Portugal, 2015. [Google Scholar]
  24. Jones, T. Culinary Calculations: Simplified Math for Culinary Professionals, 2nd ed.; John Wiley & Sons, Inc.: Hoboken, NJ, USA, 2008; ISBN 978-0-471-74816-8. [Google Scholar]
  25. Henderson, W.E. Articulated, Performance-Based Instruction Objective Guide for Food Service/Food Service Management. In Tests/Evaluation Instruments; Greenville Technical Coll, S.C.: South Carolina, Greenville, 1983. [Google Scholar]
  26. Riley, M. Food and Beverage Management: A Review of Change. Int. J. Contemp. Hosp. Manag. 2005, 17, 88–93. [Google Scholar] [CrossRef]
  27. Dittmer, P.R. Principles of Food, Beverage, and Labor, 7th ed.; John Wiley & Sons, Inc.: New York, NY, USA, 2003; ISBN 0-471-39703-2. [Google Scholar]
  28. Kotschevar, L.H.; Withrow, D. Management by Menu, 4th ed.; John Wiley & Sons, Inc.: Hoboken, NJ, USA, 2008; ISBN 978-0-471-47577-4. [Google Scholar]
  29. ASAE Preços Em Serviços de Restauração. Available online: https://www.asae.gov.pt/perguntas-frequentes1/precos-em-servicos-de-restauracao.aspx (accessed on 11 July 2021).
  30. Autoridade Tributária e Aduaneira Código do Imposto Sobre o Valor Acrescentado Lei no75-B/2020. Available online: https://info.portaldasfinancas.gov.pt/pt/informacao_fiscal/codigos_tributarios/Cod_download/Documents/CIVA.pdf (accessed on 15 July 2021).
  31. Economias Como Calcular o IVA. Available online: https://www.economias.pt/como-calcular-o-iva/ (accessed on 30 July 2021).
  32. Brito, F. Manual Prático de Gestão e Controlo de Alimentos e Bebidas, 1st ed.; Editora Épica: Porto Salvo, Portugal, 2016; ISBN 978-989-99666-0-4. [Google Scholar]
  33. Mifli, M. Menu Development and Analysis. In Proceedings of the Fourth Biennial and International Conference on “Tourism and Hotel Industry in Southeast Asia & Indo-China: Development, Marketing and Sustainability, Chiang Mai, Thailand, 24 June 2000; pp. 24–26. [Google Scholar]
  34. Parlamento Europeu. Conselho da União Europeia Regulamento (UE) n.o 1169/2011 do Parlamento Europeu e do Conselho, de 25 de Outubro de 2011. J. Of. União Eur. 2011, 2011, 18–63. [Google Scholar]
  35. Department of Health; Food Standards Agency; Llydodraeth Cymru Welsh Government. Food Standards Scotland Guide to Creating a Front of Pack (FoP) Nutrition Label for Pre-Packed Products Sold through Retail Outlets. 2016. Available online: https://www.food.gov.uk/sites/default/files/media/document/fop-guidance_0.pdf (accessed on 25 September 2021).
  36. SNS Descodificador de Rótulos. Available online: https://www.sns.gov.pt/noticias/2017/09/28/descodificador-de-rotulos/ (accessed on 3 September 2021).
  37. Nestle Nutri-Score. Available online: https://empresa.nestle.pt/compreender-rotulos/nutri-score (accessed on 3 September 2021).
  38. Nutrimento As Empresas do Setor Agro-Industrial vão Implementar em Portugal o Semáforo Nutricional. Available online: https://nutrimento.pt/noticias/as-empresas-do-setor-agro-industrial-vao-implementar-portugal-semaforo-nutricional/ (accessed on 21 August 2021).
  39. Santé Publique France Lancement du NUTRI-SCORE: Informer et Guider le Consommateur Sur la Qualité des Aliments Qu’il Achète et Consomme. Available online: https://www.santepubliquefrance.fr/presse/2017/lancement-du-nutri-score-informer-et-guider-le-consommateur-sur-la-qualite-des-aliments-qu-il-achete-et-consomme (accessed on 3 September 2021).
  40. Hwang, J.; Lorenzen, C.L. Effective Nutrition Labeling of Restaurant Menu and Pricing of Healthy Menu. J. Foodserv. Bus. Res. 2008, 19, 270–276. [Google Scholar] [CrossRef]
  41. Glanz, K.; Basil, M.; Maibach, E.; Goldberg, J.; Snyder, D. Why Americans Eat What They Do: Taste, Nutrition, Cost, Convenience, and Weight Control Concerns as Influences on Food Consumption. J. Am. Diet. Assoc. 1998, 98, 1118–1126. [Google Scholar] [CrossRef]
  42. Yamamoto, J.A.; Yamamoto, J.B.; Yamamoto, B.E.; Yamamoto, L.G. Adolescent Fast Food and Restaurant Ordering Behavior with and without Calorie and Fat Content Menu Information. J. Adolesc. Health 2005, 37, 397–402. [Google Scholar] [CrossRef]
  43. Office of the Surgeon General (US); Office of Disease Prevention and Health Promotion (US); Centers for Disease Control and Prevention (US); National Institutes of Health (US). The Surgeon General’s Call To Action To Prevent and Decrease Overweight and Obesity; Publications and Reports of the Surgeon General; Office of the Surgeon General (US): Rockville, MD, USA, 2001.
  44. DiPietro, R.B.; Roseman, M.; Ashley, R. A Study of Consumers’ Response to Quick Service Restaurants’ Healthy Menu Items. J. Foodserv. Bus. Res. 2006, 7, 59–77. [Google Scholar] [CrossRef]
  45. Ministério da Economia e da Inovação. Decreto Lei no 191/2009; Diário da República n.º 158/2009; Série I; Ministério da Economia e da Inovação: Lisboa, Portugal, 2009; pp. 5336–5341.
  46. BCSD Objetivos de Desenvolvimento Sustentável (ODS)—BCSD Portugal. Available online: https://www.ods.pt (accessed on 11 July 2021).
  47. BCSD 12—Produção e Consumo Sustentáveis—Garantir Padrões de Consumo e de Produção Sustentáveis. Available online: https://www.ods.pt/objectivos/12-producao-e-consumo-sustentaveis/?portfolioCats=24 (accessed on 11 July 2021).
  48. Goldenberg, C. Gestão Estratégica Integrada Para Negócios Em Alimentação, 1st ed.; Senac: São Paulo, Brazil, 2020; ISBN 978-85-396-2544-4. [Google Scholar]
  49. AHRESP. Turismo de Portugal Guia de Boas Práticas Para Uma Restauração Circular e Sustentável, 1st ed.; AHRESP: Lisboa, Portugal, 2021; ISBN 978-972-8103-77-4. [Google Scholar]
  50. Eufic Explore Seasonal Fruit and Vegetables in Europe. Available online: https://www.eufic.org/en/explore-seasonal-fruit-and-vegetables-in-europe (accessed on 24 July 2021).
  51. Nunes, F. Calendário de Fruta e Legumes na Época Ideal. Available online: https://www.deco.proteste.pt/alimentacao/produtos-alimentares/dicas/calendario-fruta-legumes-epoca-ideal (accessed on 9 August 2021).
  52. Nunes, M.; Renata, B.; Moreira, P.; Moreira, A.; Mário Morais de, A. Alergia Alimentar, 1st ed.; Ministério da Educação e Ciência—Direção-Geral da Educação; Ministério da Saúde—Direção-Geral da Saúde: Lisboa, Portugal, 2012; ISBN 978-972-742-356-9.
  53. Pádua, I.; Barros, R.; Moreira, P.; Moreira, A. Alergia Alimentar Na Restauração; Programa Nacional para a Promoção da Alimentação Saudável—Direção-Geral da Saúde: Lisboa, Portugal, 2016.
  54. AHRESP. Obrigatoriedade de Indicação de Alergénios. Available online: https://ahresp.com/2018/12/obrigatoriedade-de-indicacao-dos-alergenios/ (accessed on 15 July 2021).
  55. Drysdale, J.A.; Aldrich, J.A. Profitable Menu Planning, 3rd ed.; Prentice Hall: Hoboken, NJ, USA, 2002; ISBN 978-0-13-089164-8. [Google Scholar]
  56. Jagels, M.G. Hospitality Management Accounting, 9th ed.; John Wiley & Sons, Inc.: Hoboken, NJ, USA, 2007; ISBN 978-0-471-68789-4. [Google Scholar]
  57. Pavesic, D.V. Psychological Aspects of Menu Pricing. Int. J. Hosp. Manag. 1989, 8, 43–49. [Google Scholar] [CrossRef]
  58. Kelly, T.J.; Kiefer, N.M.; Burdett, K. A Demand-Based Approach to Menu Pricing. Cornell Hotel. Restaur. Adm. Q. 1994, 35, 48–52. [Google Scholar] [CrossRef]
  59. Gomes, V. Gestão Da Restauração, 1st ed.; Lidel—Edições Técnicas: Lisboa, Portugal, 2020; ISBN 978-989-752-421-9. [Google Scholar]
  60. LeBruto, S.M.; Ashley, R.A.; Quain, W. Using the Contribution Margin Aspect of Menu Engineering to Enhance Financial Results. Int. J. Contemp. Hosp. Manag. 1997, 9, 161–167. [Google Scholar] [CrossRef]
  61. Taylor, J.J.; Brown, D.M. Menu Analysis: A Review of Techniques and Approaches. Hosp. Rev. 2007, 25, 6. [Google Scholar]
  62. Hevner, A.R.; March, S.T.; Park, J.; Ram, S. Design Science in Information Systems Research. Manag. Inf. Syst. Q. 2004, 28, 75–105. [Google Scholar] [CrossRef] [Green Version]
  63. Venable, J.; Pries-Heje, J.; Baskerville, R. FEDS: A Framework for Evaluation in Design Science Research. Eur. J. Inf. Syst. 2016, 25, 77–89. [Google Scholar] [CrossRef] [Green Version]
  64. Johannesson, P.; Perjons, E. An Introduction to Design Science; Springer: Cham, Switzerland, 2014; ISBN 978-3-319-10631-1. [Google Scholar]
  65. March, S.T.; Smith, G.F. Design and Natural Science Research on Information Technology. Decis. Support Syst. 1995, 15, 251–266. [Google Scholar] [CrossRef]
  66. Winter, R. Design Science Research in Europe. Eur. J. Inf. Syst. 2008, 17, 470–475. [Google Scholar] [CrossRef]
  67. Kuechler, B.; Vaishnavi, V. On Theory Development in Design Science Research: Anatomy of a Research Project. Eur. J. Inf. Syst. 2008, 17, 489–504. [Google Scholar] [CrossRef]
  68. Wikipédia Holismo. Wikipédia, a Enciclopédia Livre 2021. Available online: https://pt.wikipedia.org/wiki/Holismo (accessed on 20 February 2022).
  69. Priberam Holística. Available online: https://dicionario.priberam.org/holística (accessed on 3 September 2021).
  70. Pries-Heje, J.; Baskerville, R.; Venable, J. Strategies for Design Science Research Evaluation. In Proceedings of the ECIS 2008 Proceedings, Krakow, Poland, 4 September 2008; Volume 87. [Google Scholar]
  71. Venable, J.; Pries-Heje, J.; Baskerville, R. A Comprehensive Framework for Evaluation in Design Science Research. In Proceedings of the International Conference on Design Science Research in Information Systems, Advances in Theory and Practice, Las Vegas, NV, USA, 14–15 May 2012; Springer: Berlin, Heidelberg; Volume 7286, pp. 423–438. [Google Scholar]
  72. Tremblay, M.C.; Hevner, A.R.; Berndt, D.J. The Use of Focus Groups in Design Science Research. In Design Research in Information Systems: Theory and Practice; Hevner, A., Chatterjee, S., Eds.; Integrated Series in Information Systems; Springer: Boston, MA, USA, 2010; pp. 121–143. ISBN 978-1-4419-5653-8. [Google Scholar]
  73. maridar.pt maridar.pt—Gastronomia e Enologia Regional do Algarve. Available online: https://maridar.pt (accessed on 4 October 2021).
  74. IT-AMGABAlgarve Comidas—Gastronomia Regional e Vinhos Do Algarve. Available online: https://maridar.pt/page-comidas/ (accessed on 15 June 2021).
  75. Font Awesome Font Awesome. Available online: https://fontawesome.com/v5.0/icons?d=gallery&p=2 (accessed on 15 October 2021).
  76. Taylor, J.; Reynolds, D.; Brown, D.M. Multi-factor Menu Analysis Using Data Envelopment Analysis. Int. J. Contemp. Hosp. Manag. 2009, 21, 213–225. [Google Scholar] [CrossRef]
  77. Institute of Medicine; Panel on Macronutrients; Institute of Medicine; Standing Committee on the Scientific Evaluation of Dietary Reference Intakes. Dietary Reference Intakes for Energy, Carbohydrate, Fiber, Fat, Fatty Acids, Cholesterol, Protein, and Amino Acids; The National Academies Press: Washington, DC, USA, 2005; ISBN 978-0-309-08525-0. [Google Scholar]
  78. Hevner, A.R. A Three Cycle View of Design Science Research. Scand. J. Inf. Syst. 2007, 19, 87–92. [Google Scholar]
  79. Elbel, B. Consumer Estimation of Recommended and Actual Calories at Fast Food Restaurants. Obesity 2011, 19, 1971–1978. [Google Scholar] [CrossRef] [PubMed] [Green Version]
Figure 1. Nutri-Score label [37].
Sustainability 14 05330 g001
Figure 2. DSR research model with two design cycles adapted from Kuechler and Vaishnavi’s [67] DSR model.
Sustainability 14 05330 g002
Figure 3. (a) Product at harvest time [75]. (b) Product at off harvest time [75].
Sustainability 14 05330 g003
Figure 4. (a) Green icon for DRI [75], (b) yellow icon for DRI [75], (c) orange icon for DRI [75], (d) grey icon [75].
Sustainability 14 05330 g004
Figure 5. OHSR’s mock-up.
Sustainability 14 05330 g005
Figure 6. OHSR first tab (Standardized Recipe).
Sustainability 14 05330 g006aSustainability 14 05330 g006b
Figure 7. OHSR second tab (Dish Photography).
Sustainability 14 05330 g007
Figure 8. OHSR third tab (Nutrition facts).
Sustainability 14 05330 g008
Table 1. Food labels for nutritional traffic light per 100 g [36].
SugarsFatSaturatesSalt
Low>5 g>3 g>1.5 g>0.3 g
Medium5 g–22.5 g3 g–17.5 g1.5 g–5 g0.3 g–1.5 g
High<22.5 g<17.5 g<5 g<1.5 g
Table 2. Beverage labels for nutritional traffic light per 100 mL [36].
SugarsFatSaturatesSalt
Low>2.5 g>1.5 g>0.75 g>0.3 g
Medium2.5 g–11.25 g1.5 g–8.5 g0.75 g–2.5 g0.3 g–0.75 g
High<11.25 g<8.5 g<2.5 g<0.75 g
Table 3. Dietary Reference Intakes (DRI) for adults [34].
Energy or NutrientDRI
Energy2000 kcal/8400 kJ
Fat70 g
Fat of which saturates20 g
Carbohydrate260 g
Carbohydrate of which sugars90 g
Protein50 g
Salt6 g
Publisher’s Note: MDPI stays neutral with regard to jurisdictional claims in published maps and institutional affiliations.

