
The Landfilling of Municipal Solid Waste and the Sustainability of the Related Transportation Activities


Abstract
:1. Introduction
2. Materials and Methods
2.1. The Ecological Footprint Approach
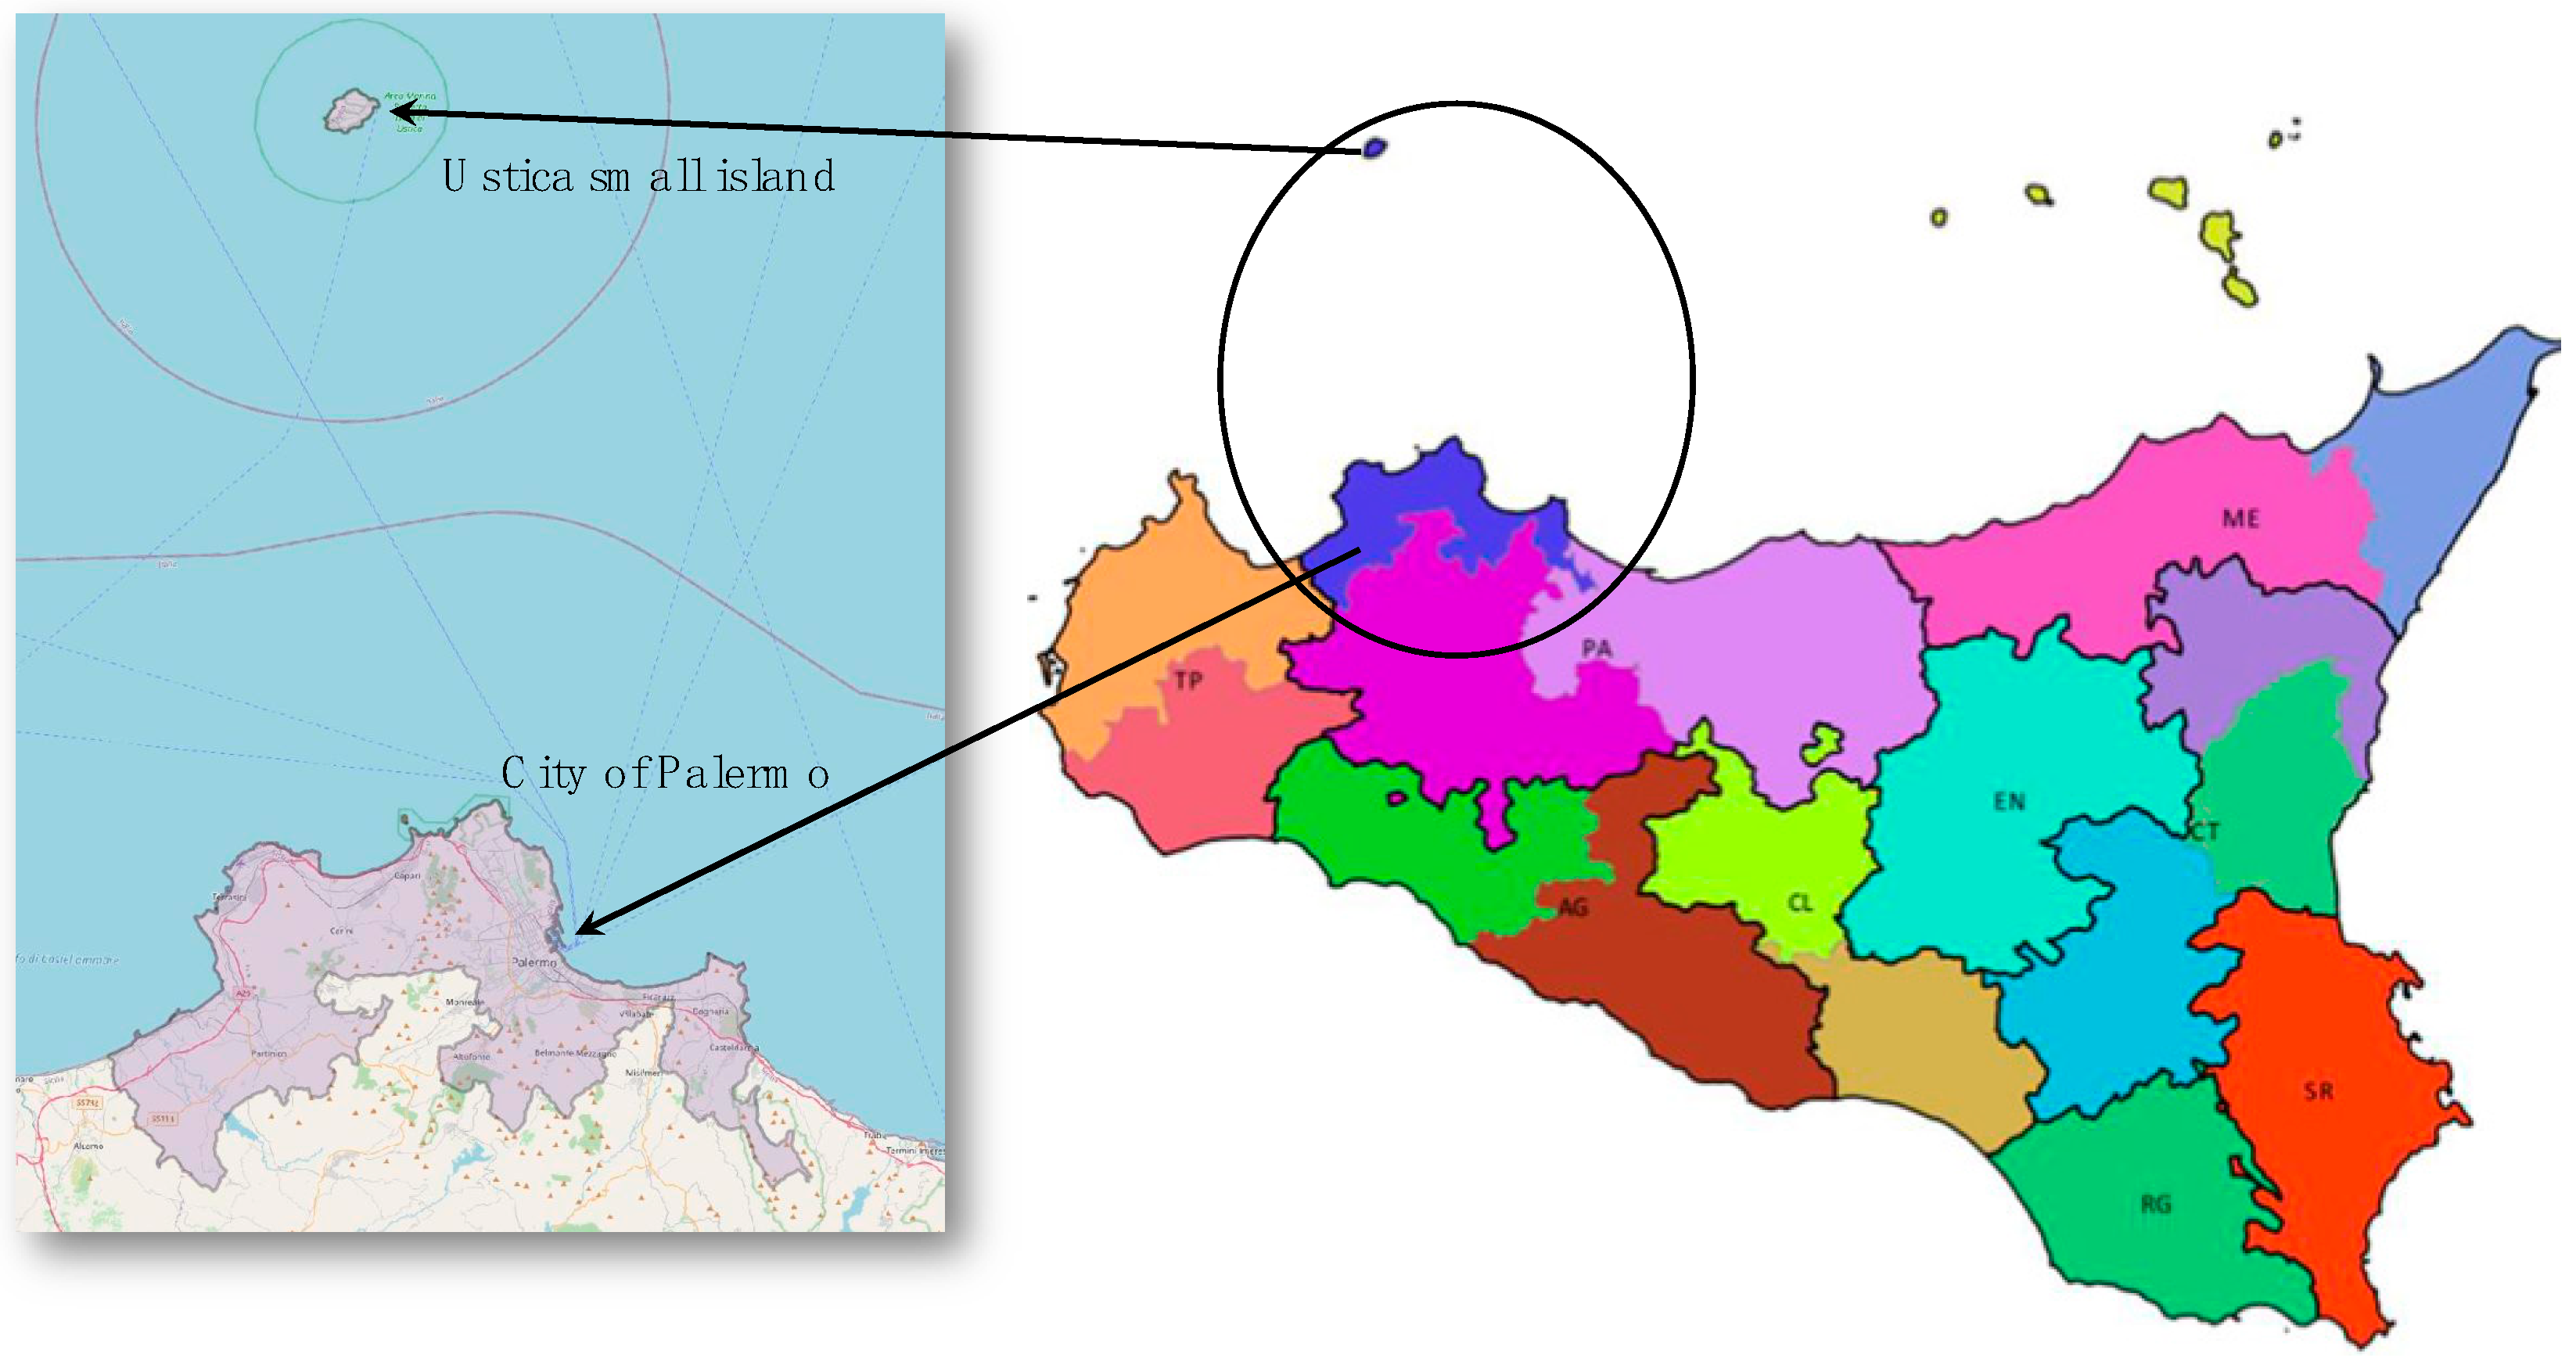
2.2. Computing the Ecological Footprint of the Municipal Solid Waste Management System of Palermo
3. Results
4. Discussion
5. Conclusions
Author Contributions
Funding
Institutional Review Board Statement
Informed Consent Statement
Conflicts of Interest
Abbreviation
| Parameter | Meaning | Unit |
| BF | Boosting energy factor for vehicles construction, maintenance and waste transportation | % |
| CF | Conversion factor | tC/x * or tCO2/x * |
| CU | Carbon uptake rate | ha/tCO2 or ha/tC |
| DTS | Average distance waste transportation by ship | km |
| EF | Ecological Footprint | ha |
| EI | Energy intensity of materials | MJ/kg |
| ELC | Annual electricity consumption | MJ |
| ESD | “Built-up land” pertinent to the disposal system | ha |
| ESG | “Built-up land” pertinent to the collection phase | ha |
| ESTR | “Built-up land” pertinent to the waste transference | ha |
| FC | Fuel consumption for running waste collection fleet | L |
| Fe | Amount of fuel used for generating the unit of electric energy | L/MJ |
| FI | Fuel energy intensity | MJ/L |
| Ft | Amount of fuel used for generating the unit of thermal energy | L/MJ |
| Md | Amount of materials of which bins are constituted | kg |
| Nd | Number of wheelie bins for the collection phase | - |
| PF | Factor of performance of the “built-up land” | - |
| POR | Statistical percentage of road surface occupied by garbage trucks | % |
| QFES | Factor of equivalence of “built-up land” | - |
| QFSFP | Factor of equivalence of forested land for energy | - |
| QFSFP, SEA | Factor of equivalence of land for energy for productive sea | - |
| SFPDE | “Land for electric energy” for disposal phase | ha |
| SFPDF | “Land for energy” (fossil fuel energy) for disposal phase | ha |
| SFPG | “Land for energy” for collection phase | ha |
| SFPTR | “Land for energy” for road transportation phase | ha |
| SFPTS | “Land for energy” for transportation phase by ship | ha |
| SS | Street surface occupied by carbage trucks from collection areas to the disposal points | ha |
| TC | Thermal energy consumption | MJ |
| TD | Landfill surface | ha |
| TG | Total surface occupied by bins | ha |
| WTS | Amount of waste yearly transported by ship | tons |
| * where x is the unit of measure related to parameter Ri of Equation (1). | ||
References
- EU Waste Recycling Policy. Available online: https://www.eea.europa.eu/ims/waste-recycling-in-europe (accessed on 13 April 2022).
- The European Commission 2010 Communication from the Commission-EUROPE 2020. A Strategy for Smart, Sustainable and Inclusive Growth, COM (2010) 2020 Final; Brussels. Available online: https://eur-lex.europa.eu/LexUriServ/LexUriServ.do?uri=COM:2010:2020:FIN:EN:PDF (accessed on 15 March 2022).
- The European Commission 2014. A Policy Framework for Climate and Energy in the Period from 2020 to 2030, COM (2014) 15 Final, Brussels. Available online: https://eur-lex.europa.eu/LexUriServ/LexUriServ.do?uri=COM:2014:0015:FIN:EN:PDF (accessed on 15 March 2022).
- Available online: https://www.covenantofmayors.eu/ (accessed on 15 March 2022).
- Bisegna, F.; Cirrincione, L.; Casto, B.M.L.; Peri, G.; Rizzo, G.; Scaccianoce, G.; Sorrentino, G. Fostering the energy efficiency through the energy savings: The case of the University of Palermo. In Proceedings of the EEEIC/I and CPS Europe 2019, Palermo, Italy, 11–14 June 2019. [Google Scholar]
- Guerrieri, M.; La Gennusa, M.; Peri, G.; Rizzo, G.; Scaccianoce, G. University campuses as small-scale models of cities: Quanti-tative assessment of a low carbon transition path. Renew. Sustain. Energy Rev. 2019, 113, 109263. [Google Scholar] [CrossRef]
- Cirrincione, L.; Marvuglia, A.; Scaccianoce, G. Assessing the effectiveness of green roofs in enhancing the energy and indoor comfort resilience of urban buildings to climate change: Methodology proposal and application. Build. Environ. 2021, 205, 108198. [Google Scholar] [CrossRef]
- Cirrincione, L.; Di Dio, S.; Peri, G.; Scaccianoce, G.; Schillaci, D.; Rizzo, G. A Win-Win Scheme for Improving the Environmental Sustainability of University Commuters’ Mobility and Getting Environmental Credits. Energies 2022, 15, 396. [Google Scholar] [CrossRef]
- Ruggieri, S.; Longo, V.; Perrino, C.; Canepari, S.; Drago, G.; L’Abbate, L.; Balzan, M.; Cuttitta, G.; Scaccianoce, G.; Minardi, R.; et al. Indoor air quality in schools of a highly polluted south Mediterranean area. Indoor Air 2019, 29, 276–290. [Google Scholar] [CrossRef] [PubMed]
- Marti, L.; Puertas, R. Influence of environmental policies on waste treatment. Waste Manag. 2021, 126, 191–200. [Google Scholar] [CrossRef]
- Ríos, A.M.; Picazo-Tadeo, A.J. Measuring environmental performance in the treatment of municipal solid waste: The case of the European Union-28. Ecol. Indic. 2021, 123, 107328. [Google Scholar] [CrossRef]
- Hosseinalizadeh, R.; Izadbakhsh, H.; Hamed Shakouri, G. A planning model for using municipal solid waste management tech-nologies- considering Energy, Economic, and Environmental Impacts in Tehran-Iran. Sustain. Cities Soc. 2021, 65, 102566. [Google Scholar] [CrossRef]
- Zupancic, M.; Mozic, V.; Moze, M.; Cimerman, F.; Golobic, I. Current Status and Review of Waste-to-Biogas Conversion for Se-lected European Countries and Worldwide. Sustainability 2022, 14, 1823. [Google Scholar] [CrossRef]
- Chen, F.; Chen, W.; Hou, J.; Li, W. Research on the variations in individual waste separation behavior due to different information strategies–Mediating effects of psychological distance. J. Environ. Manag. 2022, 304, 114320. [Google Scholar] [CrossRef] [PubMed]
- European Commission. Communication from the Commission to the European Parliament, the Council, the European Economic and Social Committee and the Committee of the Regions “Closing the Loop—An Eu Action Plan for the Circular Economy”. Brussels, 2.12.2015 COM (2015) 614 Final. 2015. Available online: https://eur-lex.europa.eu/legal-content/EN/TXT/?uri=CELEX:52015DC0614 (accessed on 15 March 2022).
- Magazzino, C.; Falcone, P.M. Assessing the relationship among waste generation, wealth, and GHG emissions in Switzerland: Some policy proposals for the optimization of the municipal solid waste in a circular economy perspective. J. Clean. Prod. 2022, 351, 131555. [Google Scholar] [CrossRef]
- Mazzanti, M.; Mazzarano, M.; Zecca, E. A selection bias approach in the circular economy context: The case of organic municipal solid waste in Italy. J. Clean. Prod. 2022, 348, 131266. [Google Scholar] [CrossRef]
- Istrate, I.R.; Galvez-Martos, J.L.; Dufour, J. The impact of incineration phase-out on municipal solid waste landfilling and life cycle environmental performance: Case study of Madrid, Spain. Sci. Total Environ. 2021, 755, 142537. [Google Scholar] [CrossRef]
- Available online: http://www.theworldcounts.com (accessed on 15 March 2022).
- Available online: https://eurelco.org (accessed on 15 March 2022).
- Nabavi-Pelesaraei, A.; Mohammadkashi, N.; Naderloo, L.; Abbasi, M.; Chau, K. Principal of environmental life cycle assessment for medical waste during COVID-19 outbreak to support sustainable development goals. Sci. Total Environ. 2020, 827, 154416. [Google Scholar] [CrossRef] [PubMed]
- Argentiero, A.; D’Amato, A.; Zoli, M. Waste recycling policies and Covid-19 pandemic in an E-DSGE model. Waste Manag. 2022, 141, 290–299. [Google Scholar] [CrossRef] [PubMed]
- Regione Sicilia. Ufficio del Commissario Delegato per l’Emergenza dei Rifiuti e la Tutela Delle Acque. Piano di Gestione dei Rifiuti Solidi Urbani. 2012. Available online: http://pti.regione.sicilia.it/portal/page/portal/PIR_PORTALE/PIR_LaStrutturaRegionale/ (accessed on 19 January 2022). (In Italian).
- Rigamonti, L.; Sterpi, I.; Grosso, M. Integrated municipal waste management systems: An indicator to assess their environmental and economic sustainability. Ecol. Indic. 2016, 60, 1–7. [Google Scholar] [CrossRef]
- Rodrigues, J.; Gondran, N.; Beziat, A.; Laforest, V. Application of the absolute environmental sustainability assessment frame-work to multifunctional systems–The case of municipal solid waste management. J. Clean. Prod. 2021, 322, 129034. [Google Scholar] [CrossRef]
- Chi, Y.; Dong, J.; Tang, Y.; Huang, Q.; Ni, M. Life cycle assessment of municipal solid waste source-separated collection and integrated waste management systems in Hangzhou, China. J. Mater. Cycles Waste Manag. 2015, 17, 695–706. [Google Scholar] [CrossRef]
- Saadatlu, E.A.; Barzinpour, F.; Yaghoubi, S. A sustainable model for municipal solid waste system considering global warming potential impact: A case study. Comput. Ind. Eng. 2022, 169, 108127. [Google Scholar] [CrossRef]
- Nabavi-Pelesaraei, A.; Bayat, R.; Hosseinzadeh-Bandbafha, H.; Afrasyabi, H.; Chau, K.-W. Modeling of energy consumption and environmental life cycle assessment for incineration and landfill systems of municipal solid waste management-A case study in Tehran Metropolis of Iran. J. Clean. Prod. 2017, 148, 427–440. [Google Scholar] [CrossRef]
- Widomski, M.K.; Gleń, P.; Łagód, G. Sustainable landfilling as final step of municipal waste management system. Probl. Ekorozw. 2017, 12, 147–155. [Google Scholar]
- Jeswani, H.K.; Smith, R.W.; Azapagic, A. Energy from waste: Carbon footprint of incineration and landfill biogas in the UK. Int. J. Life Cycle Assess. 2013, 18, 218–229. [Google Scholar] [CrossRef]
- Rimaityte, I.; Denafas, G.; Martuzevicius, D.; Kavaliauskas, A. Energy and environmental indicators of municipal solid waste incineration: Toward selection of an optimal waste management system. Pol. J. Environ. Stud. 2010, 19, 989–999. [Google Scholar]
- Ferronato, N.; Moresco, L.; Guisbert Lizarazu, G.E.; Gorritty Portillo, M.A.; Conti, F.; Torretta, V. Comparison of environmental impacts related to municipal solid waste and construction and demolition waste management and recycling in a Latin American developing city. Environ. Sci. Pollut. Res. 2021, 1–15. [Google Scholar] [CrossRef] [PubMed]
- Nabavi-Pelesaraei, A.; Bayat, R.; Hosseinzadeh-Bandbafha, H.; Afrasyabi, H.; Berrada, A. Prognostication of energy use and en-vironmental impacts for recycle system of municipal solid waste management. J. Clean. Prod. 2017, 154, 602–613. [Google Scholar] [CrossRef]
- Zilka, M.; Stieberova, B.; Scholz, P. Sustainability evaluation of the use of cargo-trams for mixed municipal waste transport in Prague. Waste Manag. 2021, 126, 97–105. [Google Scholar] [CrossRef] [PubMed]
- Pérez, J.; Lumbreras, J.; Rodríguez, E.; Vedrenne, M. A methodology for estimating the carbon footprint of waste collection vehicles under different scenarios: Application to Madrid. Transp. Res. Part D Transp. Environ. 2017, 52, 156–171. [Google Scholar] [CrossRef]
- Peri, G.; Ferrante, P.; La Gennusa, M.; Pianello, C.; Rizzo, G. Greening MSW management systems by saving footprint: The contribution of the waste transportation. J. Environ. Manag. 2018, 219, 74–83. [Google Scholar] [CrossRef]
- Corriere, F.; Peri, G.; Rizzo, G.; La Rocca, V. Environmental implications of traffic flow delays: A model for urban streets. Appl. Mech. Mater. 2013, 260, 1167–1172. [Google Scholar] [CrossRef]
- Corriere, F.; Rizzo, G.; Guerrieri, M. Estimation of air pollutant emissions in "turbo" and in conventional roundabouts. Appl. Mech. Mater. 2013, 394, 597–604. [Google Scholar] [CrossRef]
- Maurício Maués, L.; Beltrão, N.; Silva, I. GHG Emissions Assessment of Civil Construction Waste Disposal and Transportation Process in the Eastern Amazon. Sustainability 2021, 13, 5666. [Google Scholar] [CrossRef]
- Eisted, R.; Larsen, A.W.; Christensen, T.H. Collection, transfer and transport of waste: Accounting of greenhouse gases and global warming contribution. Waste Manag. Res. 2009, 27, 738–745. [Google Scholar] [CrossRef] [PubMed]
- ISO. 14040: 2006; Environmental Management—Life Cycle Assessment—Principles and Framework. International Organization for Standardization—ISO: Geneva, Switzerland, 2006.
- ISO. 14044:2006; Environmental Management—Life Cycle Assessment—Requirements and Guidelines. International Organization for Standardization—ISO: Geneva, Switzerland, 2006.
- Laurent, A.; Bakas, I.; Clavreul, J.; Bernstad, A.; Niero, M.; Gentil, E.; Hauschild, M.Z.; Christensen, T.H. Review of LCA studies of solid waste management systems-Part I: Lessons learned and perspectives. Waste Manag. 2014, 34, 573–588. [Google Scholar] [CrossRef]
- Laurent, A.; Clavreul, J.; Bernstad, A.; Bakas, I.; Niero, M.; Gentil, E.; Christensen, T.H.; Hauschild, M.Z. Review of LCA studies of solid waste management systems-Part II: Methodological guidance for a better practice. Waste Manag. 2014, 34, 589–606. [Google Scholar] [CrossRef] [PubMed]
- Wackernagel, M.; Rees, W. Our Ecological Footprint: Reducing Human Impact on the Earth; New Society Publishers: Gabriola Island, BC, Canada, 1996. [Google Scholar]
- Rees, W. Ecological Footprint and appropriated carrying capacity: What urban economics leaves out. Environ. Urban. 1992, 4, 121–130. [Google Scholar] [CrossRef]
- Rees, W.; Wackernagel, M. Ecological Footprints and appropriated carrying capacity: Measuring the natural capital requirements of the human economy. In Investing in Natural Capital: The Ecological Economics Approach to Sustainability; Jansson, A.-M., Hammer, M., Folke, C., Costanza, R., Eds.; Island Press: Washington, DC, USA, 1994. [Google Scholar]
- Rees, W.; Wackernagel, M. Urban Ecological footprint: Why cities cannot be sustainable and why they are a key to sustainability. Environ. Impact Assess. Rev. 1996, 16, 223–248. [Google Scholar] [CrossRef]
- Wackernagel, M.; Yount, J.D. The Ecological Footprint: An indicator of progress toward regional sustainability. Environ. Monit. Assess. 1998, 51, 511–529. [Google Scholar] [CrossRef]
- Giampietro, M.; Saltelli, A. Footprints to nowhere. Ecol. Indic. 2014, 46, 610–621. [Google Scholar] [CrossRef]
- Chambers, N.; Simmons, C.; Wackernagel, M. Sharing Nature’s Interest. In Ecological Footprint as an Indicator of Sustainability; Routledge: London, UK; Taylor & Francis Group: New York, NY, USA, 2000; ISBN 9781853837395. [Google Scholar]
- FAOSTAT (FAO Statistical Databases). Rome, Food and Agriculture Organization of the United Nations (FAO). Available online: http://www.fao.org/home/en/ (accessed on 20 January 2022).
- WWF International. Global Footprint Network, Netherlands Committee for the World Conservation Union (NC-IUCN), Europe 2005: The Ecological Footprint. Available online: http://www.footprintnetwork.org/content/images/uploads/Europe_2005_Ecological_Footprint.pdf (accessed on 20 January 2022).
- Herva, M.; Neto, B.; Roca, E. Environmental assessment of the integrated municipal solid waste management system in Porto (Portugal). J. Clean. Prod. 2014, 70, 183–193. [Google Scholar] [CrossRef]
- Herva, M.; Roca, E. Ranking municipal solid waste treatment alternatives based on ecological footprint and multi-criteria analysis. Ecol. Indic. 2013, 25, 77–84. [Google Scholar] [CrossRef]
- Simion, I.M.; Ghinea, C.; Maxineasa, S.G.; Taranu, N.; Bonoli, A.; Gavrilescu, M. Ecological footprint applied in the assessment of construction and demolition waste integrated management. Environ. Eng. Manag. J. 2013, 12, 779–788. [Google Scholar]
- Marrero, M.; Puerto, M.; Rivero-Camacho, C.; Freire-Guerrero, A.; Solís-Guzmán, J. Assessing the economic impact and ecological footprint of construction and demolition waste during the urbanization of rural land, Resources. Conserv. Recycl. 2017, 117, 160–174. [Google Scholar] [CrossRef]
- Li, Y.; Guo, T.; Li, P. Study on ecological footprint calculation of Beijing urban animal waste. Adv. Mater. Res. 2012, 356–360, 764–765. [Google Scholar] [CrossRef]
- Bian, S.; Huang, M.; Li, J.; Chen, X. An evaluation on the using ways of agricultural wastes reutilization in Fujian based on EMERGY and Ecological footprint theory. Shengtai Xuebao/Acta Ecol. Sin. 2010, 30, 2678–2686. [Google Scholar]
- Worrel, E.; Van Heijningen, R.J.J.; de Castro, J.F.M.; Hazeninkel, J.H.O.; de Beer, J.G.; Faaij, A.P.C.; Vringer, K. New gross energy-requirement figures for material production. Energy 1993, 19, 627–640. [Google Scholar] [CrossRef]
- Barrett, J.; Vallack, H.; Jones, A.; Haq, G. A Material Flow Analysis and Ecological Footprint of York-Technical Report. Stockholm Environment Institute, University of York; March 2002. Available online: http://www.york.ac.uk/inst/sei/ecofootprint/york-footprint.html (accessed on 20 January 2022).
- Ekvall, T.; Assefa, G.; Björklund, A.; Eriksson, O.; Finnveden, G. What life-cycle assessment does and does not do in assessments of waste management. Waste Manag. 2007, 27, 989–996. [Google Scholar] [CrossRef] [PubMed]
- Bovea, M.D.; Ibáñez-Forés, V.; Gallardo, A.; Colomer-Mendoza, F.J. Environmental assessment of alternative municipal solid waste management strategies. A Spanish case study. Waste Manag. 2010, 30, 2383–2395. [Google Scholar] [CrossRef] [PubMed]
- Al-Salem, S.M.; Evangelisti, S.; Lettieri, O. Life cycle assessment of alternative technologies for municipal solid waste and plastic solid waste management in the Greater London area. Chem. Eng. J. 2014, 244, 391–402. [Google Scholar] [CrossRef]
- Erses Yay, A.S. Application of life cycle assessment (LCA) for municipal solid waste management: A case study of Sakarya. J. Clean. Prod. 2015, 94, 284–293. [Google Scholar] [CrossRef]
- Buratti, C.; Barbanera, M.; Testarmata, F.; Fantozzi, F. Life cycle assessment of organic waste management strategies: An Italian case study. J. Clean. Prod. 2015, 89, 125–136. [Google Scholar] [CrossRef]
- Pastorello, C.; Dilara, P.; Martini, G. Effect of a change towards compressed natural gas vehicles on the emissions of the Milan waste collection fleet. Transp. Res. D Transp. Environ. 2011, 16, 121–128. [Google Scholar] [CrossRef]
- Fontaras, G.; Martini, G.; Manfredi, U.; Marotta, A.; Krasenbrink, A.; Maffioletti, F.; Terenghi, R.; Colombo, M. Assessment of on-road emissions of four Euro V diesel and CNG waste collection trucks for supporting air-quality improvement initiatives in the city of Milan, 2012. Sci. Total Environ. 2012, 426, 65–72. [Google Scholar] [CrossRef] [PubMed]


| Country | Number of Landfills | Share of Landfilled Waste on Total Waste Produced |
|---|---|---|
| United of Kingdom | 24,000 | 36% |
| Belgium | 4061 | 8% |
| Portugal | 3589 | 38% |
| Germany | 58,000 | 10% |
| Austria | 5882 | 8% |
| Italy | 40,000 | 23% |
| Greece | 30,000 | 79% |
| Netherlands | 4000 | 3% |
| Denmark | 3200 | 6% |
| Finland | 2600 | 11% |
| Sweden | 6000 | 9% |
| Hungary | 2730 | 60% |
| Material | Total (t/y) | 7% Rec. (t/y) | 37% Rec. (t/y) |
|---|---|---|---|
| Paper | 79,279 | 5550 | 29,333 |
| Glass | 18,018 | 1261 | 6667 |
| Plastic | 54,054 | 3784 | 20,000 |
| Metals | 9009 | 631 | 3333 |
| Organic | 144,144 | 10,090 | 53,333 |
| Gathering | Transportation | Disposal | Total | |
|---|---|---|---|---|
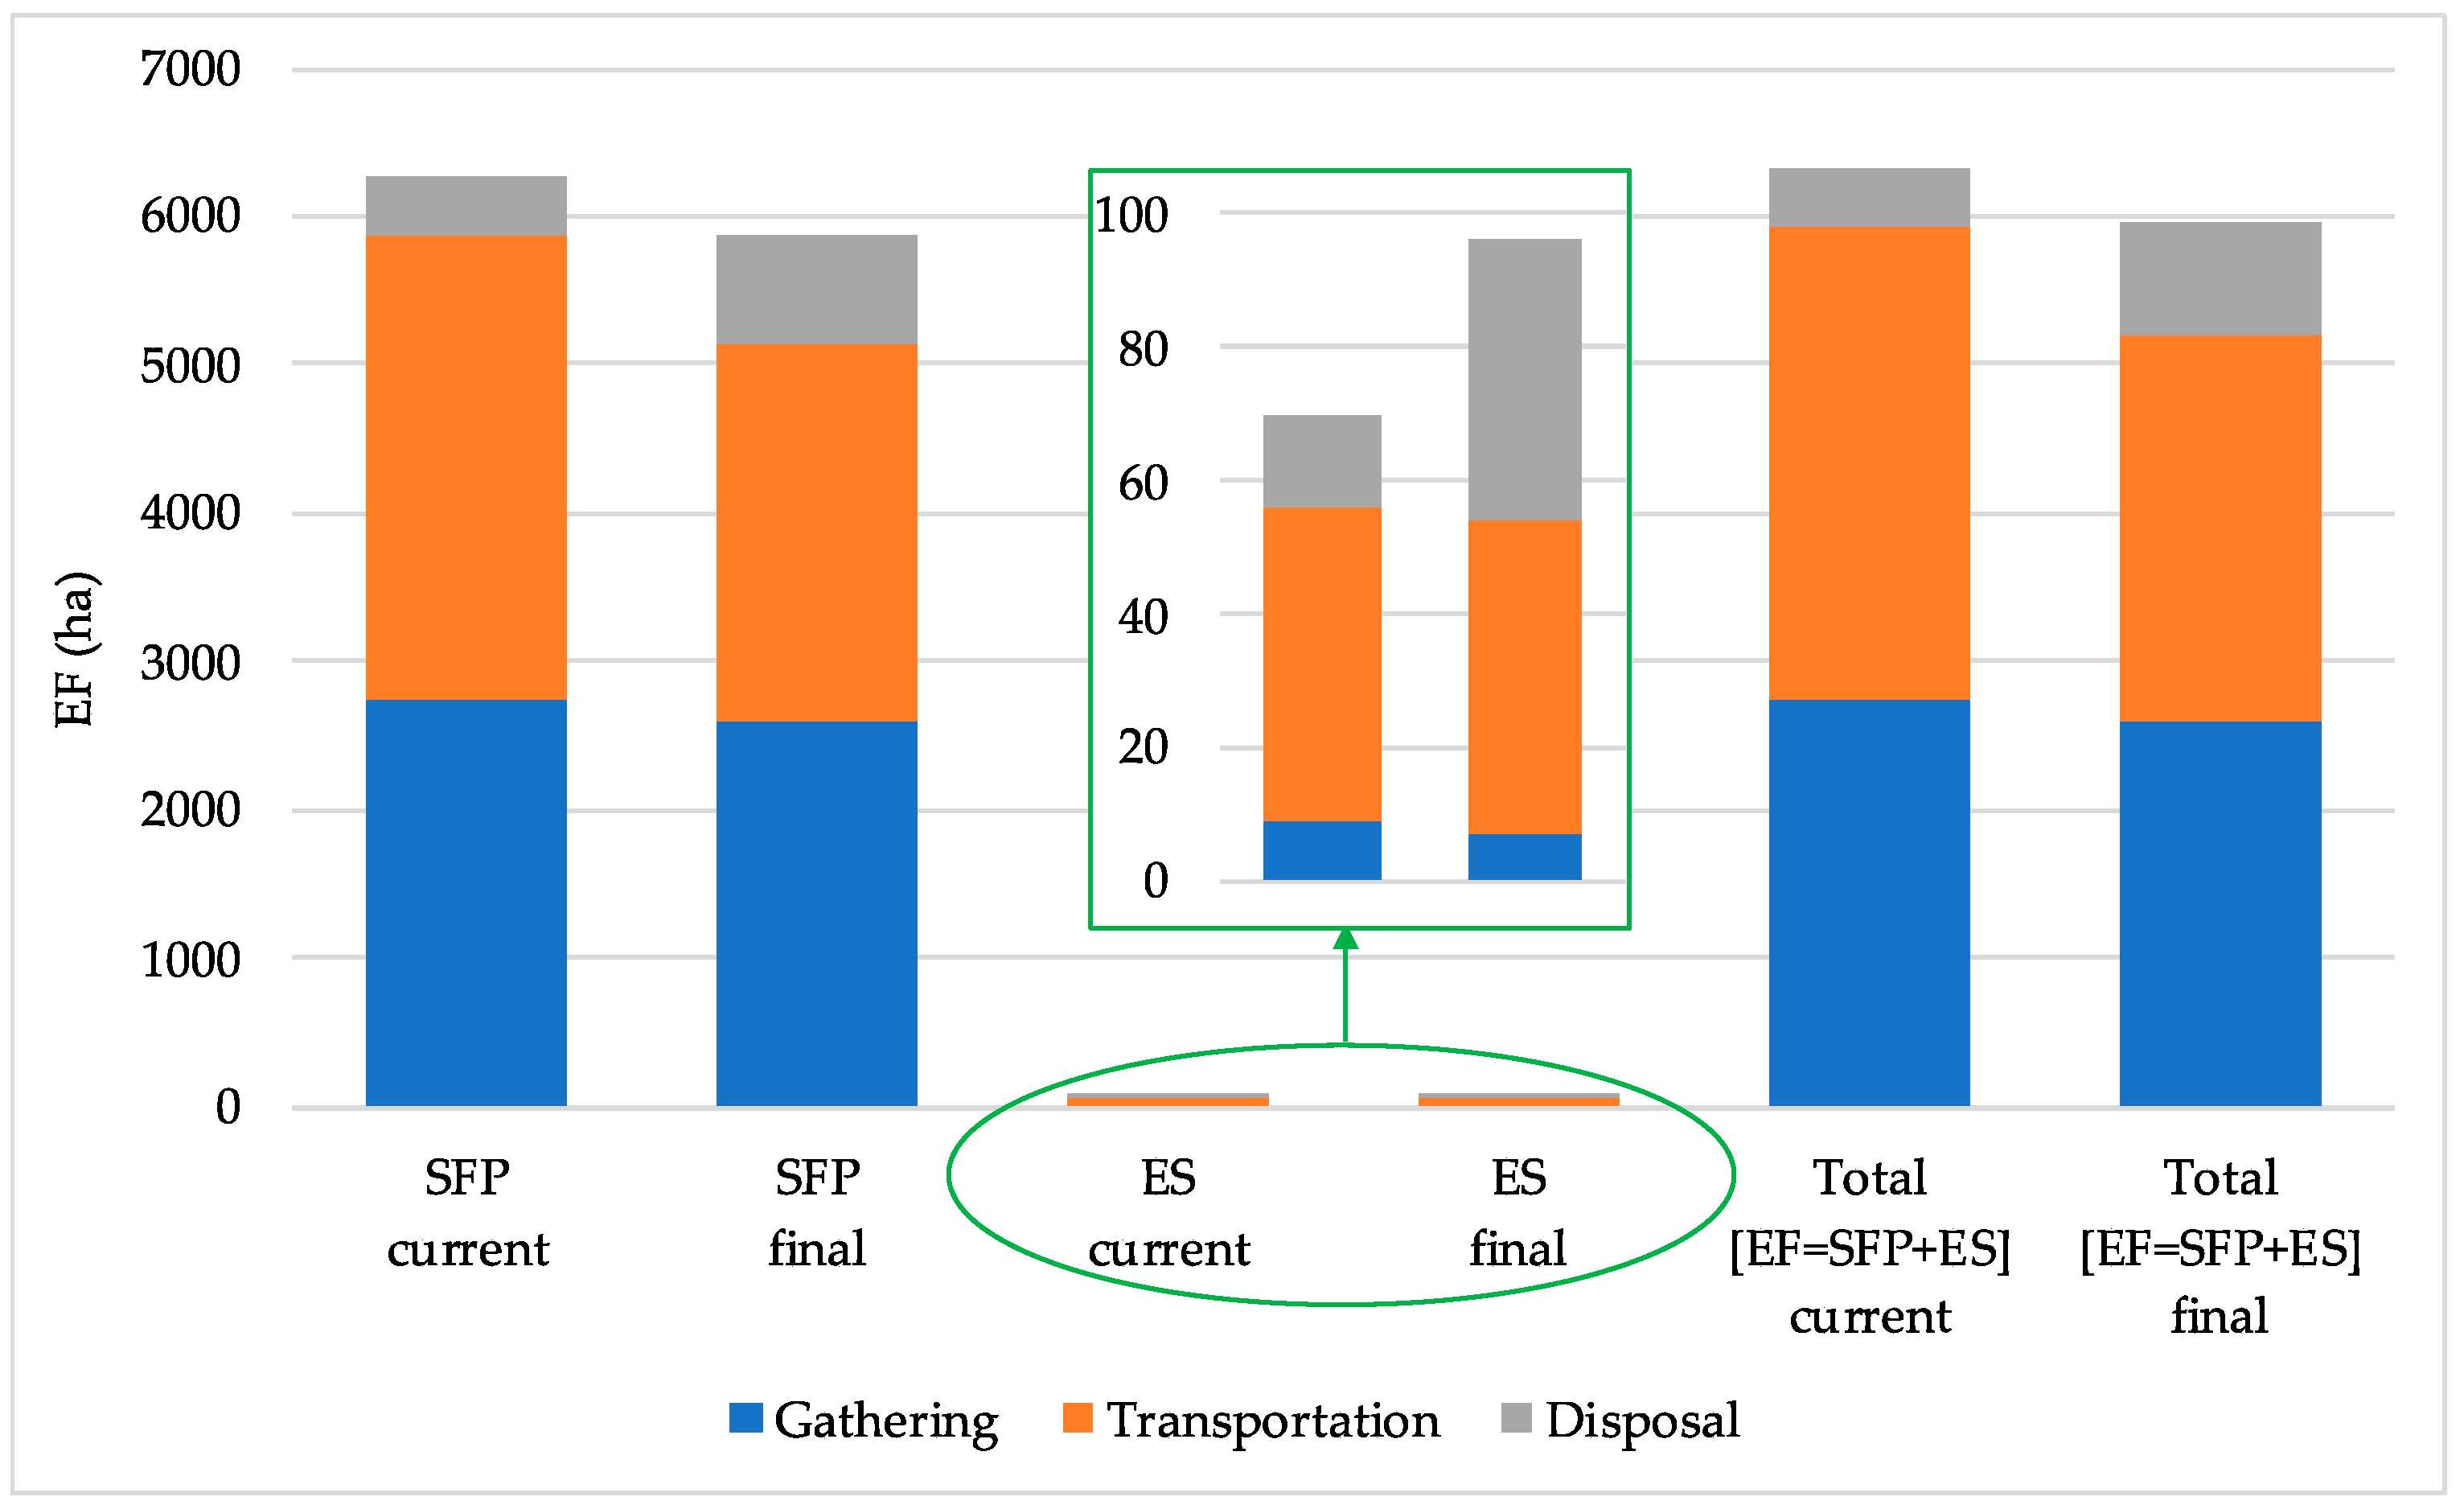
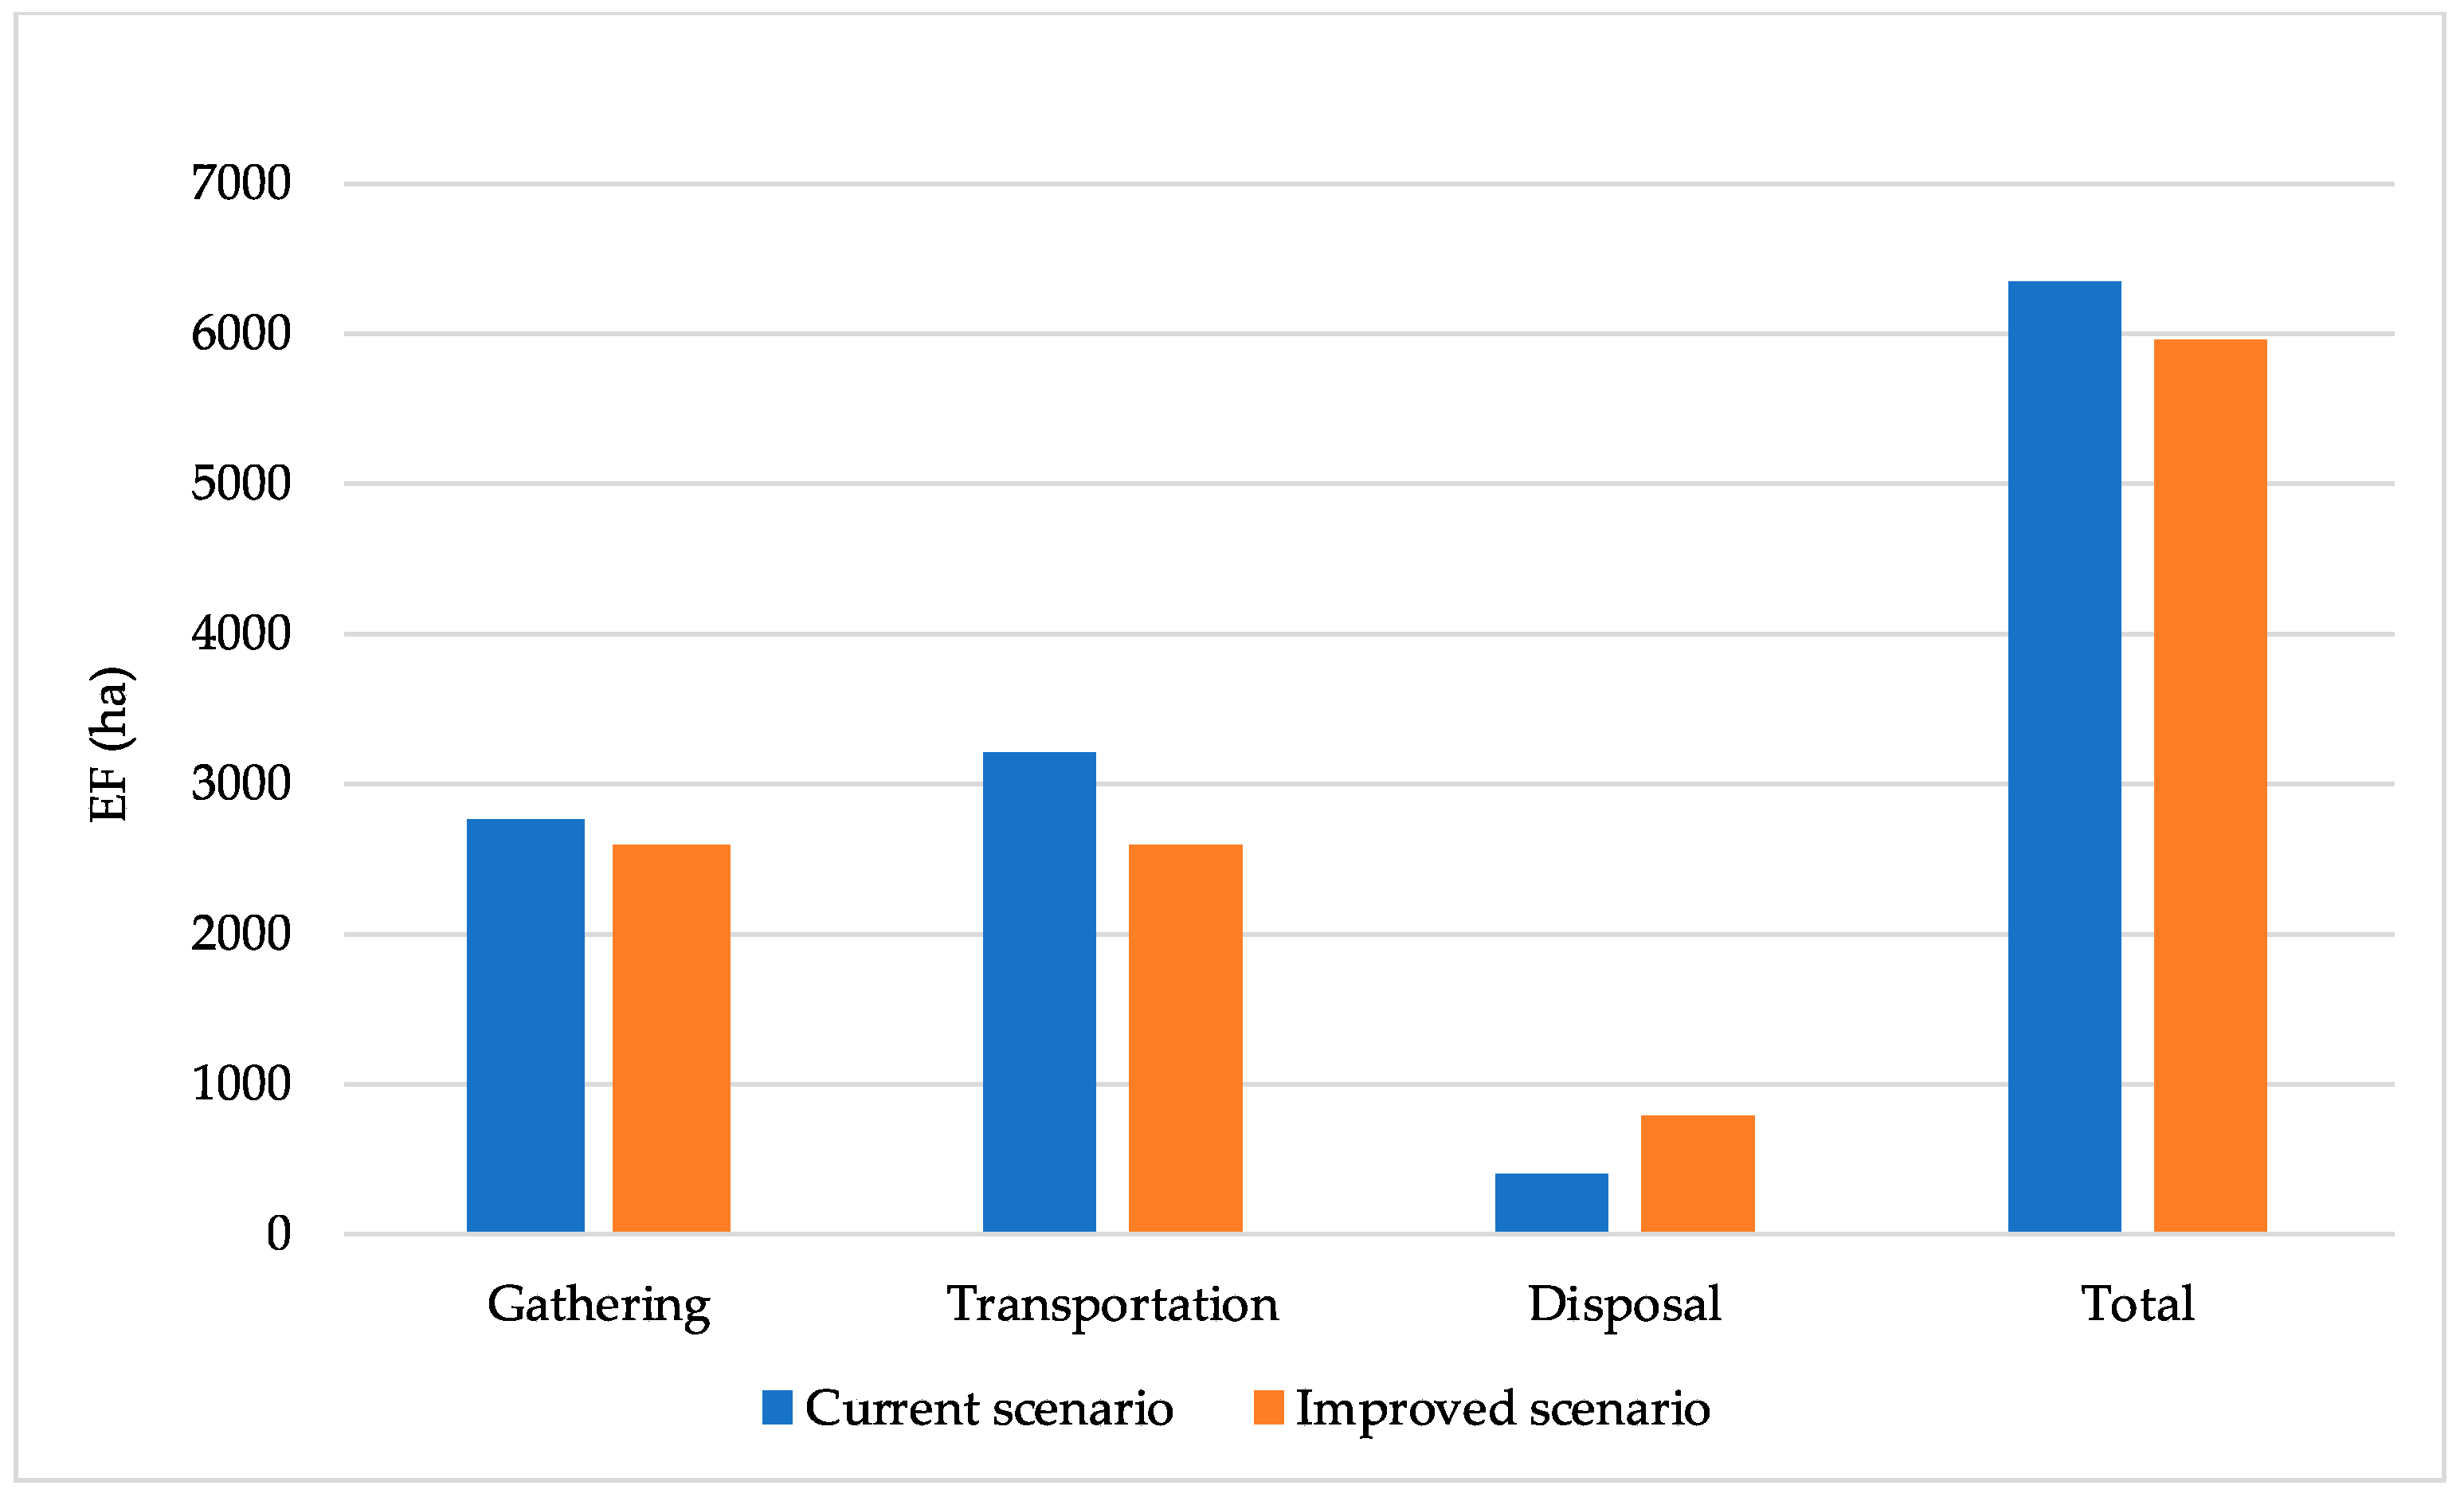
| SFP (ha) | 2740 | 3139 | 382 | 6261 |
| ES (ha) | 9 | 47 | 14 | 70 |
| Total [EF = SFP + ES] (ha) | 2749 | 3186 | 396 | 6331 |
| Phases percentage (%) | 43.42 | 50.33 | 6.25 | 100 |
| Material | Paper | Glass | Plastic | Metals | Organic |
|---|---|---|---|---|---|
| EF (ha/t) | 2.45 | 0.85 | 3.85 | 0.65 | 0.85 |
| Gathering | Transportation | Disposal | Total | |
|---|---|---|---|---|
| SFP (ha) | 2588 | 2539 | 733 | 5860 |
| ES (ha) | 7 | 47 | 42 | 96 |
| Total [EF = SFP + ES] (ha) | 2595 | 2586 | 775 | 5956 |
| Phases percentage (%) | 43.57 | 43.42 | 13.01 | 100 |
| Material | Total Content Theoretical EF (ha) | 7% Rec. Saved EF (ha) | 37% Rec. Saved EF (ha) |
|---|---|---|---|
| Paper | 194,234 | 13,596 | 71,866 |
| Glass | 15,315 | 1072 | 5667 |
| Plastic | 208,108 | 14,568 | 77,000 |
| Metals | 5856 | 410 | 2167 |
| Organic | 122,522 | 8577 | 45,333 |
Publisher’s Note: MDPI stays neutral with regard to jurisdictional claims in published maps and institutional affiliations. |
© 2022 by the authors. Licensee MDPI, Basel, Switzerland. This article is an open access article distributed under the terms and conditions of the Creative Commons Attribution (CC BY) license (https://creativecommons.org/licenses/by/4.0/).
Share and Cite
Cirrincione, L.; La Gennusa, M.; Peri, G.; Rizzo, G.; Scaccianoce, G. The Landfilling of Municipal Solid Waste and the Sustainability of the Related Transportation Activities. Sustainability 2022, 14, 5272. https://doi.org/10.3390/su14095272
Cirrincione L, La Gennusa M, Peri G, Rizzo G, Scaccianoce G. The Landfilling of Municipal Solid Waste and the Sustainability of the Related Transportation Activities. Sustainability. 2022; 14(9):5272. https://doi.org/10.3390/su14095272
Chicago/Turabian StyleCirrincione, Laura, Maria La Gennusa, Giorgia Peri, Gianfranco Rizzo, and Gianluca Scaccianoce. 2022. "The Landfilling of Municipal Solid Waste and the Sustainability of the Related Transportation Activities" Sustainability 14, no. 9: 5272. https://doi.org/10.3390/su14095272
APA StyleCirrincione, L., La Gennusa, M., Peri, G., Rizzo, G., & Scaccianoce, G. (2022). The Landfilling of Municipal Solid Waste and the Sustainability of the Related Transportation Activities. Sustainability, 14(9), 5272. https://doi.org/10.3390/su14095272