Abstract
Several studies show that the interaction between airborne pollutants and pollen grains can lead to greater pollen allergenicity, and thus increase and exacerbate the incidence of pollinosis, all of which represents a major public health problem. This article analyses the possible influence of various airborne pollutants (O3, PM10 and PM2.5, NO2, CO and SO2) on the tree-type pollen grains of Cupressaceae, Olea, Platanus, Pinus, Ulmus and Populus. The 11 areas around the stations in the Madrid Region’s pollen monitoring network (Red Palinocam) were taken as a geographic reference for this study. The degree of interaction between airborne pollutants and pollen types was explored using the rank correlation analysis. O3 and NO2 are the pollutants with the highest rate of significant correlations with pollen types. Olea, Cupressaceae and Platanus—the most highly allergenic in this study—are among the pollen types with the greatest number of significant correlations with almost all the air pollutants in the different areas. This could point to a potential associative effect between both variables which would exacerbate the negative effects on public health.
1. Introduction
The ecological benefits of each tree present in cities and in the surrounding areas have been demonstrated by studies on this subject. Their biophysical characteristics include energy savings in winter and summer as a result of the heat-regulating properties of tree crowns located beside dwellings; capture of airborne CO2 and O2 emissions; improvements in air quality thanks to the retention of harmful particles by leaf surfaces; and regulation of water flows in the case of copious rain, to name but a few; however, it is also worth mentioning the positive social effects of trees, which are in principle less tangible than their biophysical effects, but include improvements in public health and a reduction in criminality [1].
Numerous epidemiological studies have concluded that people who frequently visit, or who live in, spaces with more vegetation have better physical and psychological health than those with less access to green spaces. Indeed, people who live in areas where noise pollution, overcrowding, and citizen insecurity are a feature of daily life undergo greater stress, leading to anxiety, depression, and fatigue syndrome in addition to physical illnesses as a result [2].
Of course, a sustainable city implies the presence of trees in its streets and green areas, such as the abovementioned areas in the capital of Madrid and Aranjuez. This not only leads directly to environmental improvements in the social aspects of the city and in the overall health of its citizens, as mentioned, but it also encapsulates a wide range of other positive aspects that are perhaps less tangible for the public. Green areas increase the attractiveness of cities for both residents and visitors, which brings benefits in quality of life in the form of encouraging social relations and creating more favorable environments for everyday and work-related activities [3].
Green spaces in cities also offer economic benefits in the medium- and long-term such as a reduction in morbidity from respiratory infections, asthma, and—by extension—in hospital admissions [4]. Another economic benefit deriving from the presence of trees in cities concerns green space branding, which has several resulting utilities such as attracting tourism and investment to cities endowed with this sustainable characteristic, and it also covers health-related elements [5].
Airborne pollution poses a major environmental and health problem which, as mentioned, can be alleviated to a greater or lesser extent by the presence of trees [6]. Air pollution increases the risk of respiratory disease, and exposure to nitrogen dioxide (NO2) and carbon monoxide (CO) is associated with a greater prevalence of childhood asthma [7,8]. Exposure to sulphur dioxide (SO2) and particles (PM2.5 and PM10) may be linked to a higher occurrence of respiratory difficulties in children. Children with bronchiolitis may also have an increased likelihood of suffering asthma if they are exposed to high levels of ozone (O3), CO, and NO2 [9].
Pollen also represents an increasing problem for health, and one that affects an ever-greater number of people. The prevalence of asthma and allergic rhinitis has increased substantially in recent years, not only in the Madrid Region, but also in Japan, Europe, and North America [10,11].
A growing number of studies confirm that air pollution plays an important role in increasing pollinosis [12]. In a recent work [13] the effects produced by contamination (increasing allergenicity) in several pollen types, including Platanus and Cupressus, are shown. Moreover, in [14], positive associations were detected between allergic rhinitis in the grass pollination season, and ozone and PM2.5 pollution.
The six pollen types are considered: Cupressaceae, Platanus, Olea, Pinus, Populus, and Ulmus.
Cupressaceae pollen is the most abundant in the winter months, and almost the only allergenic pollen with a high airborne incidence at this time of year; it is the second most abundant pollen in the Madrid Region after Platanus. The pollen season for Cupressaceae is interannual, as it normally begins in November and extends to the end of March or beginning of April [15].
The levels of airborne concentrations of Platanus pollen, whose production is highly significant, exceed those of any other pollen type, not only out of the six discussed in this study, but all the pollens present in the Madrid Region. Its pollination period is also extremely short, as it normally begins in the second half of March and lasts only two to four weeks; however, its allergenic capacity is rated as moderate [15].
A significant fact is that Madrid has one with the highest airborne incidences of Platanus pollen of the Spanish cities, as evidenced by the study carried out in 14 Spanish cities with different biogeographical and climatic characteristics [16]. Indeed, according to this study, Madrid recorded the highest mean concentrations (with values of 377–896 g/m3) of all the cities studied during the Primary Pollination Period (PPP), when 90% of the total annual pollen is collected, discarding the initial and final 5%.
The presence of specimens of the Cupressaceae family and the Platanus genus in parks, gardens, and streets of cities in the Madrid Region is certainly highly significant. In the first case, Cupressus arizonica is perhaps the main originator of pollen given its great abundance, coupled with the fact that its flowering period coincides with the period of greatest incidence [15].
Among the rest of the pollen types in this research, Olea shows the highest allergenicity within the geographic scope of the study. It is regarded as a leading cause of pollinosis, as according to the analysis conducted in 12 Spanish cities, including Madrid, Olea pollen was the most frequent cause of positive PST (prick skin tests) among patients with pollinosis [17]. The same study revealed that it was the second most important cause of pollen-induced rhinitis and/or asthma in Spain, although with significantly less importance than Gramineae pollen. Its pollination period normally begins in April and continues until June [15].
Pinus pollen is considered to have low allergenic capacity and is normally present in the atmosphere of the Madrid Region from March until July. As occurs with Populus and Ulmus pollen, which have low and very low allergenic capacities, respectively [15], it is not normally studied in patients who visit the allergology consultancies in the specialized centers of the hospitals in the Madrid Region, where doctors perform prick tests in order to determine the pollinic allergen responsible for the pollinosis symptoms of these patients. Populus pollen becomes concentrated in the atmosphere in the Madrid Region from February to March, whereas the pollination period for Ulmus lasts from January to March [15].
The six airborne pollutants are considered: Ozone (O3), Nitrogen dioxide (NO2), Particles < 10 µm (PM10), Particles < 2.5 µm (PM2.5), Carbon monoxide (CO), and Sulphur dioxide (SO2).
O3 has a high oxidative power, far higher than oxygen, and is a component of what is known as photochemical or dry smog (photochemical fog), along with nitrogen oxides, aldehydes, peroxynitrites, and other secondary pollutants. Photochemical smog can be extremely harmful, particularly in airborne conditions that lead to a low dispersion of pollutants, which oblige the authorities to adopt measures designed to reduce the concentrations [18].
Similarly to O3, NO2 is a gas that intervenes in tropospheric photochemical processes and is also toxic. It has a predominantly anthropogenic origin, specifically in combustion processes that occur at high temperatures (as in the case of internal combustion engines in vehicles—mobile sources—and boilers fueled by fossil fuels, or fixed sources).
The effect of this gaseous pollutant on health is manifested in ocular and nasal irritation starting at a concentration of 13 ppm (24.450 µg/m3), which may ultimately be complicated by respiratory problems in the lower respiratory tract in the form of pulmonary oedema and even death, not only in humans but in the majority of animal species, if its concentration in the atmosphere increases even further to 100 ppm (188.040 µg/m3) [18].
In the case of particles, less than 20% of the particles suspended in the atmosphere are of anthropogenic origin, and most of these originate from combustion processes and from losses deriving from industrial processes such as iron and steel smelting, cement production, quarrying, mining, and municipal solid waste treatment, among others. The problems caused by the particles depend on their chemical composition and size; hence the finest particles in the study, PM2.5, have far more serious effects on health than PM10, which are unable to penetrate into the lungs as they are intercepted by the nasal hairs and the mucosa covering the nasal passages and the trachea, although they may trigger problems of respiratory allergy. In contrast, PM2.5 particles penetrate as far as the peripheral area of the lungs, which is particularly susceptible to lesions, and given their position, they are very difficult to eliminate [18].
CO is the most abundant and widely distributed pollutant in terms of mass. Over 90% of these particles present in the atmosphere come from natural sources, whereas the rest, from anthropogenic sources, are produced by the same activities indicated for NO2, in addition to incineration and waste treatment plants, among others. Their effects on health can be seen in the form of behavioral changes (in humans and in animals that also use hemoglobin as a transporting agent for oxygen), with airborne concentrations ranging from 4–12 mg/Nm3 (in normal conditions), through to headaches, fatigue, drowsiness, coma, respiratory failure, and death when their airborne concentrations reach between 74 and 625 mg/Nm3. CO’s affinity for hemoglobin, some 200 times higher than that of oxygen (O2), is the reason for its potential for tissue damage caused by a lack of O2 [18]. The concentration of this pollutant is therefore monitored and controlled on an eight-hourly basis, as in the case of O3, by the Madrid Region Air Quality Network.
Finally, less than 50% of the total emissions of SO2 are produced by human activity (the rest are of natural origin), namely, the combustion of fuels containing sulphur, such as stationary combustion sources (either industrial, energy production, or for domestic heating). In this case, unlike the case of O3, NO2, and CO, combustion by engines that move vehicles is responsible for a very small percentage of these emissions [18]. They may produce irritations in the respiratory system in the case of animals and humans, in addition to eye irritations when the concentrations reach the threshold values of 350 µg/m3 within one hour, or 125 µg/m3 in 24 h [19].
The aim of this study is to establish whether there is a relation between pollutant and pollen emissions into the atmosphere in the study area.
These relationships could serve as a basis for future studies to explain whether this could lead to higher pollen allergenicity in more polluted versus less polluted areas.
2. Material
2.1. Study Area
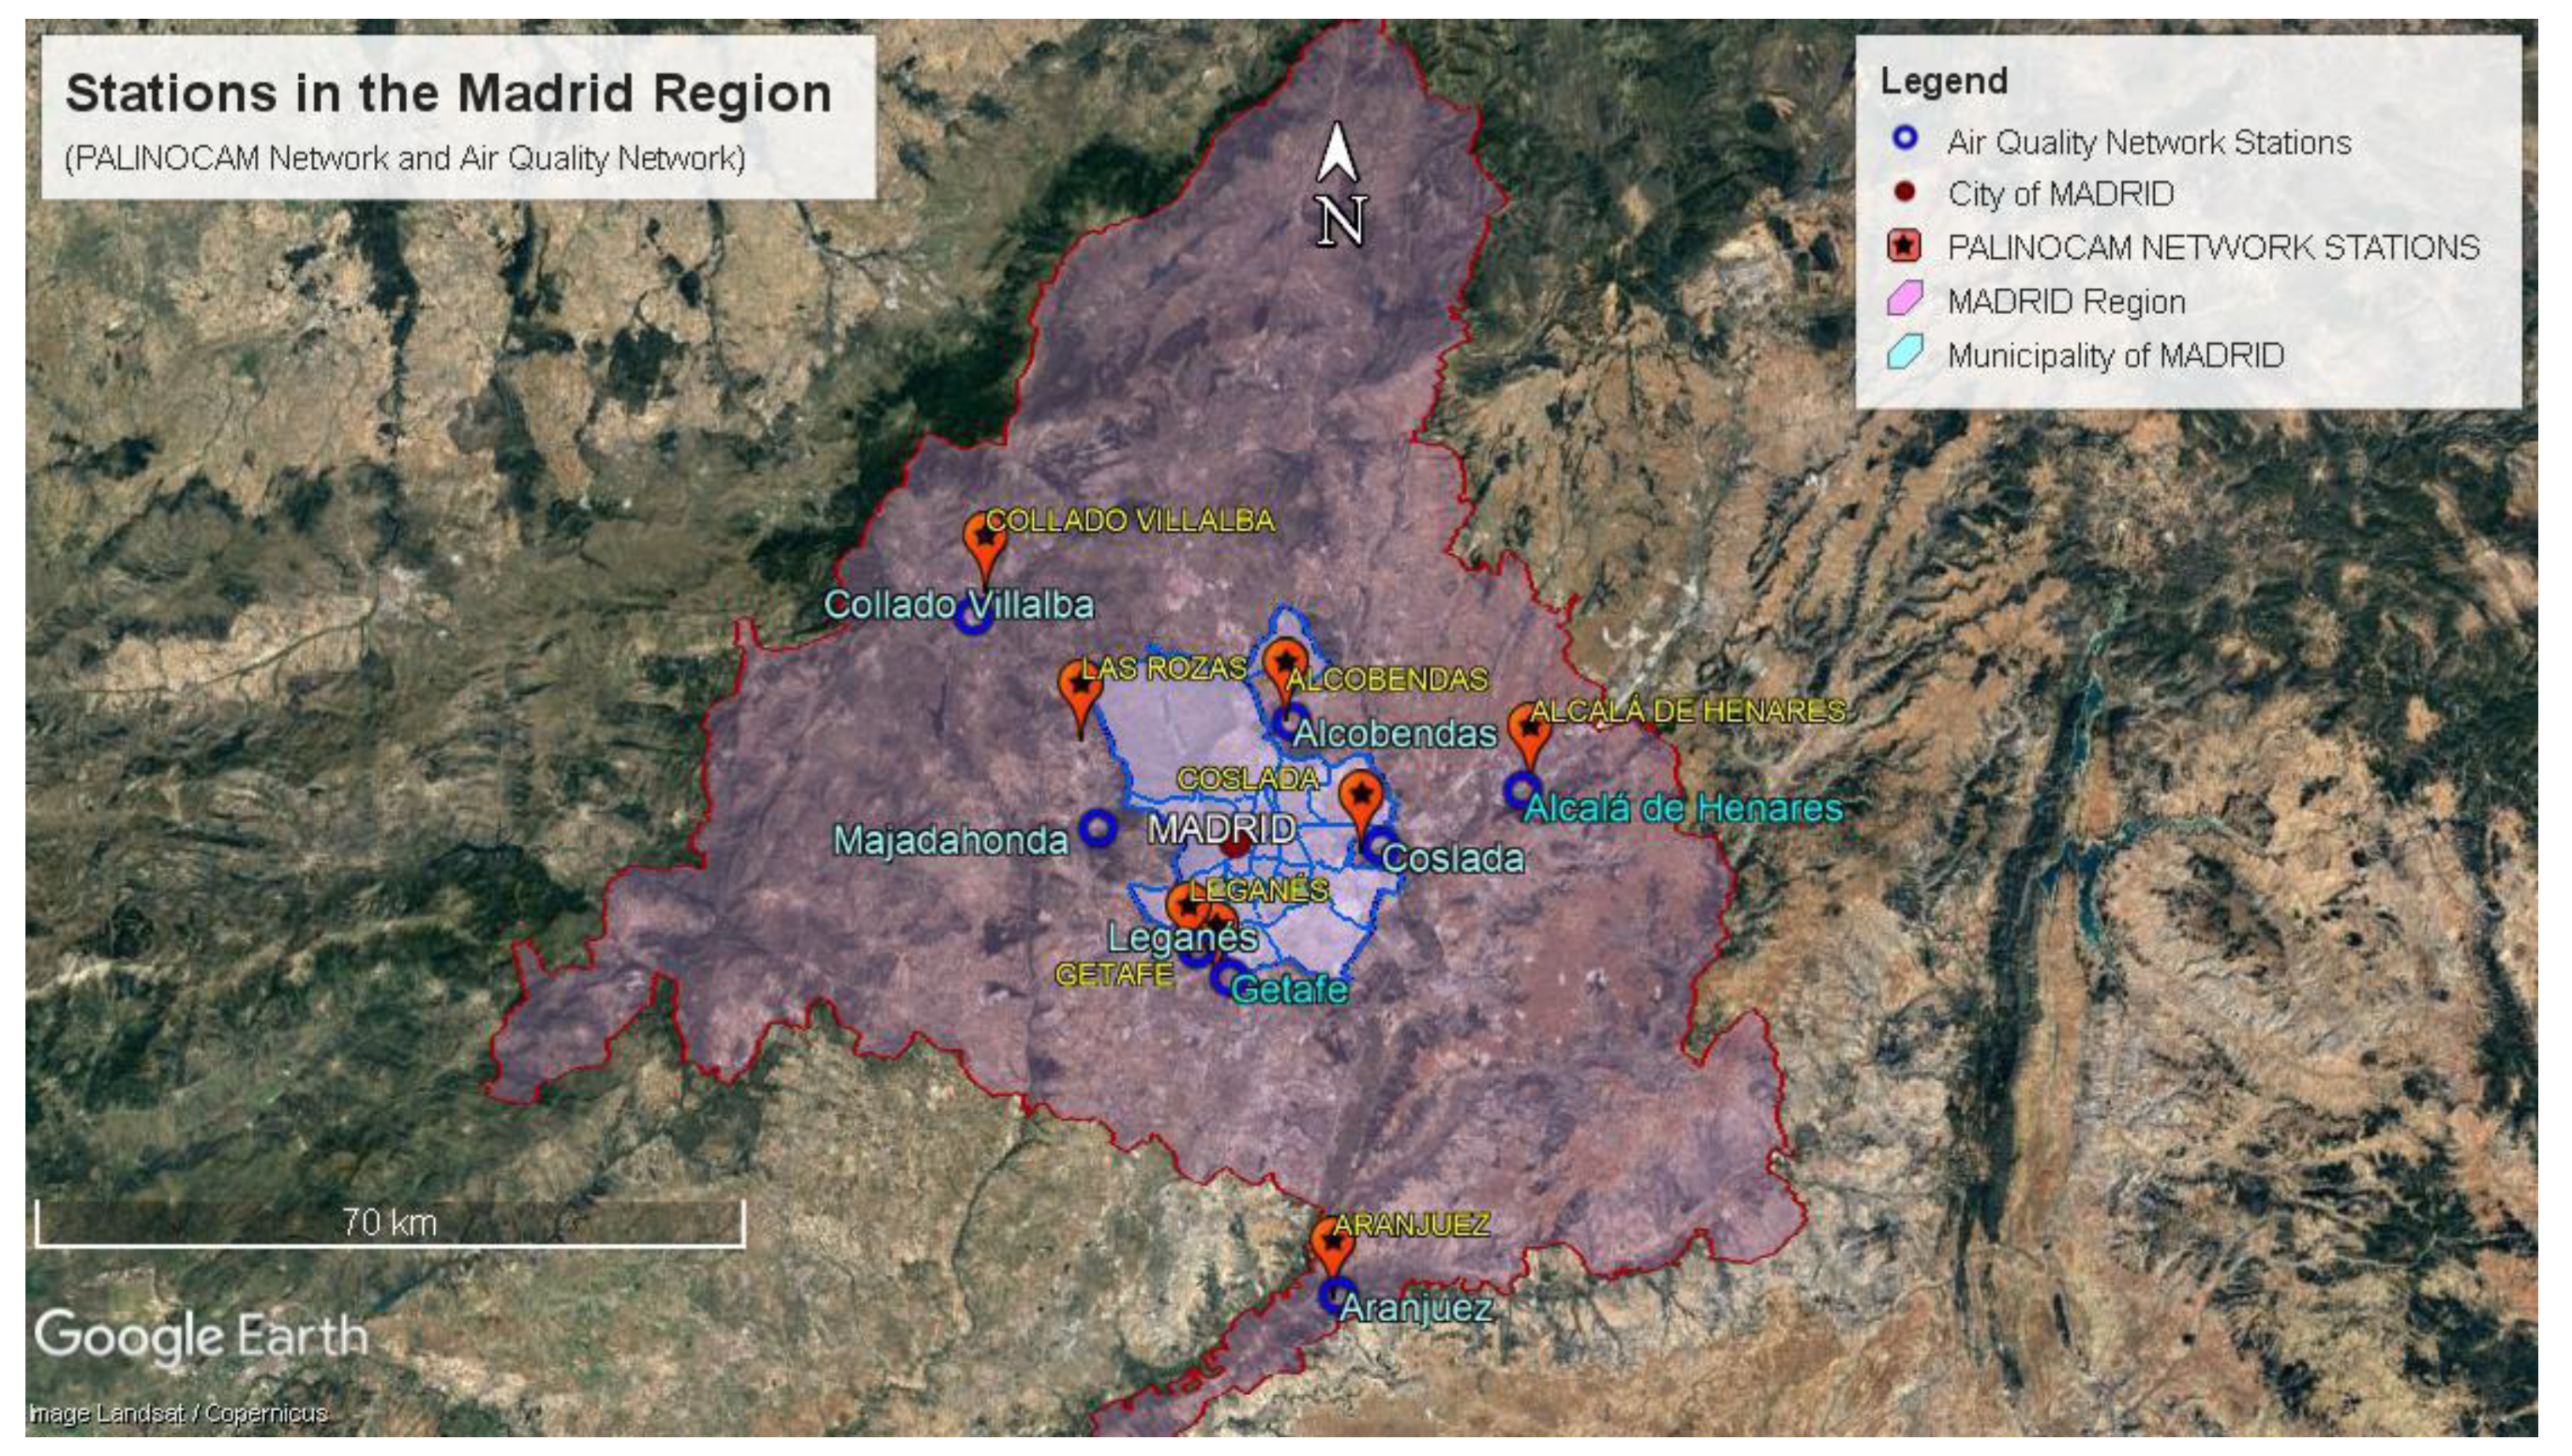
The Madrid Region (Figure 1) has extensive tree-covered areas: 55% (442,658 ha) of its territory is forest, of which over 273,000 ha are tree groves. Its protected natural spaces contain a high biodiversity of trees within their limits, among which, the following are particularly worth mentioning due to their large territorial extension: the Sierra de Guadarrama National Park (part of whose area lies within the province of Segovia, belonging to the Castile-León Region), the Cuenca Alta del Manzanares Regional Park, the Regional Park around the lower course of the Manzanares and Jarama Rivers, and the Regional Park around the middle course of the Guadarrama River and its surroundings [20]. Another important space is the Monte de El Pardo, managed by the Patrimonio National Heritage Organization, with over 15,821 ha, and located to the north of the municipal district of Madrid. Apart from these highly significant spaces, many of the municipal districts within the territory of the Madrid Region are especially renowned for their abundant wooded areas. One such case is the municipality of Aranjuez, the site of two monitoring stations for pollen and airborne pollutants, which is notable not only for the presence of trees in its streets, but also for the gardens of El Príncipe and La Isla, and the gardens in the Royal Palace of Aranjuez.

Figure 1.
Location of pollen and air quality measurement stations in the Madrid Region.
The capital of Madrid (Figure 2) is another good example and is the site of 3 of the 11 pollen measuring stations, and three of the airborne pollution monitoring stations included in this study. It has a dense tree cover in the form of parks and gardens, with over 6000 ha in total, part of which is represented by historic and unique parks such as the emblematic gardens of El Buen Retiro and the gardens of Sabatini, another part is represented by wooded parks, which notably includes the Casa de Campo, and finally, by the countless parks and gardens distributed throughout the territory [21]. Indeed, along with another 58 cities throughout the world, Madrid was named “Tree City of the World 2019” in February 2020 by the Food and Agriculture Organization of the United Nations (FAO) and the Arbor Day Foundation, as part of the “Tree Cities of the World” program designed to encourage more sustainable and resilient cities [22].
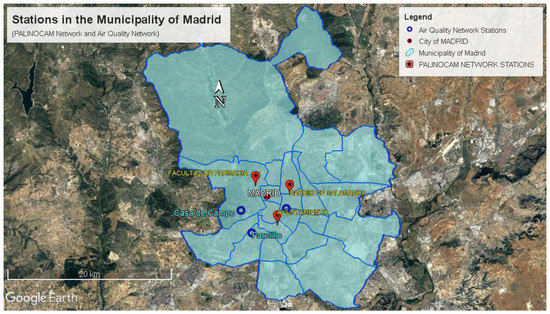
Figure 2.
Location of pollen and air quality measurement stations in the municipality of Madrid.
This study covers the years 2013 to 2017. This study was conducted using pollen data from the Madrid Region’s Palynological Network (Red Palinocam) in the Regional Ministry of Health, and the data on airborne pollutants from the Air Quality Network in the Regional Ministry for the Environment, Territorial Ordination and Sustainability of Madrid, and the Madrid City Council’s Air Quality Network.
The stability of pollen concentrations over time is shown in Table 2. On the other hand, atmospheric pollutants also showed a stable trend from 2013 to 2021, except for NO2, which registered a decrease from 2020 to 2021, and can be related to the health situation derived from COVID-19 [23].
The two types of data were obtained from the measurements made in each sampling station (Figure 1 and Figure 2), whose designation is shown in Table 1.

Table 1.
Names of the stations in the Palinocam Network and the Air Quality Network of the Madrid Region and the Madrid City Council (the latter is shaded in blue, as are the stations in the Palinocam Network located in the capital of Madrid). In the right-hand column, approximate distances between the respective stations are measured with Google Earth.
As can be seen, the measuring stations for the parameters of “pollen concentrations” and “airborne pollutant concentrations” are located less than 1 km apart, only in the case of the three first population centers in Table 1. In all the other cases, the separation ranges from just over 1 km (in the case of Getafe) to almost 9 km between the pollen sampling station in the town of Las Rozas and the airborne pollutant measuring station in the municipal district of Majadahonda, both of which are adjacent but in different territories, thereby implying a greater distance.
2.2. Pollen Data
The Palinocam Network consists of 11 sampling stations, of which three (those shaded in blue in Table 1) are located in the capital of the Madrid Region [23] The municipal district that hosts the 11 stations is home to approximately 80% of the total population of the autonomous region, meaning that they are strategically placed to be able to obtain measurements that are highly representative of the total territory of the region. Indeed, the phytogeographical characteristics of this territory, with a sampling radius of 30 km, allow the determination of the emission levels of pollen, to which over 90% of the population in the study territory is exposed [23].
The six pollen types (described in [15]) were chosen based on the criterion that they should correspond essentially to tree taxa that have a highly significant representation in the parks, gardens, and streets of the towns in the study area. Pollen types were also selected that produce a greater or lesser degree of pollinosis [15].
Currently, the system adopted by the International Association of Aerobiology, of which the Spanish Aerobiology Network is a part, and by the PALINOCAM network of the Community of Madrid, is the volumetric system, with a Hirst-type capture device marketed by the Burkard house that allows daily samples to be obtained. These collectors have a sampling coverage of about 20 km under normal orographic and settlement conditions, and a potentiometrically controlled suction flow rate of 10 L/min. All its components are enameled or anodized to prevent corrosion, they have a built-in suction pump and turbine, with a work selector with 220 V alternating current or with a 12 V battery, and a clock timer for taking samples continuously for seven days [15].
The technique followed for the mounting and analysis of the samples, obtained by the Burkard collector, consists of using fluid silicone as an adhesive substance and glycerogelatin dyed with fuchsin as a mounting medium for the preparations. Several bands are read on the same slide and an arithmetic mean of the results is made, because due to the turbulence and inequalities of the shock of the wind, some areas of the slide are different from others. For a reading of the preparations at 400× magnification, on four longitudinal bands, the surface examined corresponds to approximately 10% of the total surface of the sample. The data obtained expresses the average daily concentrations in number of pollen grains per m3 of air. The data are subsequently analyzed in the laboratory by expert personnel [15]. Daily data is converted to monthly data, using the mean values.
2.3. Air pollutant Data
The data provided by the Regional Ministry for the Environment, Territorial Ordination and Sustainability, and the data from the Madrid City Council through their respective Air Quality Networks, are obtained from their measuring stations. As can be seen in Table 1, three—shaded in blue—are located in the capital of Madrid.
The stations closest to the Palinocam Network were selected. In the case of the city of Madrid, the stations were chosen by taking into account a second criterion in addition to proximity; namely, the three stations in the capital that provide the most information on the six airborne pollutants studied here.
Pollution is measured by automatic sampling stations that provide hourly data on pollutants [24]. Hourly data is converted to monthly data using the mean values.
This study focuses on chemical pollutants, mainly primary (all those shown in Table 3, except O3); that is, all agents that are emitted directly into the atmosphere and which constitute over 90% of the problem with regard to air pollution. In contrast, O3 is a secondary pollutant originating in the so-called photolytic cycle of nitrogen oxides, which includes nitrogen monoxide (NO) and NO2.
3. Methods
The information provided on the variables for “pollen grain concentrations” [15] and “airborne pollutant concentrations” refers to daily data. These were used to calculate the monthly means for each measuring station and for each year in the study. The data on pollutants and pollen concentration were taken in the same months and years, which allows the variables to be related through correlation coefficients.
The data analysis tool, Statgraphics Centurion 18, was applied to calculate the degree of correlation between both variables. Statgraphics Centurion 18 is a statistical specialized software that calculates Spearman correlation matrices and incorporates the results of the independence tests in the matrix [25,26]. This was done with a multivariable analysis, calculating Spearman’s linear correlation coefficient [27,28] for the pollen types with each of the six variables for the six airborne pollutants in the study. A rank correlation coefficient was used, as the pollen concentrations do not have a normal distribution.
The correlation was first calculated for all the data from all the pollen concentrations and air pollutant measuring stations, and for the total years in the study.
The correlation was then calculated for each of the 11 study zones. Previously, an analysis of variance was carried out [29,30] on the two types of variables in order to determine whether there is any significant difference in their mean values between one year level and another.
In cases where the analysis of variance concluded that there is a significant difference, a multiple rank test was [31] carried out (the method used to discriminate between the means is Fisher’s least significant difference (LSD), which determines the year levels in which there are significant differences in the mean values of the study variables, with a confidence level of 95%). The years in which significantly homogeneous mean values occurred were thus established within the period 2013–2017. Finally, Spearman’s rank correlation analysis was carried out between the variables for airborne pollutants and the variables for pollen types for the different year levels.
4. Results
From the mean values calculated in the years of the study shown in Table 2, it can be seen that the figure for Platanus is 48.767 g/m3, followed by Cupressaceae with 32.206 g/m3. The third highest value corresponds to Pinus with 11.662 g/m3, followed by Olea with 9.789 g/m3. Finally, the lowest mean values calculated for the six pollen types correspond to Populus with 6.005 g/m3 and Ulmus with 4.445 g/m3.
As can be observed, in all cases the results of the standard deviation (Table 2) amply exceed the values of the means, which implies a very significant dispersion of the values around the mean values. This circumstance can be seen in the results for the coefficient of variation, which is over 200%, indicating that at least the standard deviation is double the mean, and is almost four times greater in the case of Platanus, Populus, and Ulmus pollen.
All this points to the existence of maximum year-round rates of pollen concentrations in the atmosphere, coinciding with pollination periods, in contrast with the values during most of the rest of the year, which may be zero or practically zero.
Table 2.
Values of the size, mean, standard deviation (in pollen grains per cubic meter of air, g/m3), and coefficient of variation (as a percentage) obtained for the pollen types. The two right-hand columns show the percentage of representation of the pollen types (%PT) in terms of the total pollen collected in all the stations in the Palinocam Network in two different periods (mean values highlighted in blue, and the range with the lowest and highest value obtained in a station in the network between parentheses in red).
| Pollen Types (Size Major Axis in μm) | Mean | Standard Deviation | Coefficient of Variation (%) | %PT 1994–1999 | %PT 2013–2017 |
|---|---|---|---|---|---|
| Cupressaceae | 16.1 | 17.8 | |||
| (22–28) | 32.206 | 67.613 | 209.938 | (8.2–23.6) | (13.1–27.3) |
| 6.4 | 5.4 | ||||
| Olea (18–25) | 9.789 | 31.531 | 322.117 | (4.2–9.6) | (1.6–8.7) |
| 4.9 | 6.6 | ||||
| Pinus (68–95) | 11.662 | 29.009 | 248.736 | (2.1–7.8) | (3.3–10.9) |
| 21.6 | 22.6 | ||||
| Platanus (17–22) | 48.767 | 180.791 | 370.723 | (4.0–36.5) | (1.5–43.7) |
| 4.0 | 3.1 | ||||
| Populus (29–35) | 6.005 | 23.485 | 391.085 | (1.5–7.1) | (1.2–6.8) |
| 2.9 | 2.1 | ||||
| Ulmus (23–30) | 4.445 | 17.446 | 392.527 | (1.0–5.9) | (0.4–5.8) |
Two columns have also been added to the right of Table 2 to show the percentage of representation of each pollen type (%PT) compared with the total pollen measured for the 18 pollen types analyzed by the Palinocam Network in all its stations. The data for the period 1994–1999 [15] are shown in one column, and the far-right column contains the same values for the period in the present study (2013–2017).
These results reveal a similar variation in the data for the different pollen types in both periods. It can be seen that in both cases, the representation of Platanus is markedly higher than that of the other types (with a %PT of 21.6% and 22.6%, respectively), followed by Cupressaceae (with 16.1% and 17.8%, respectively). Only in Olea and Pinus is there a slight discrepancy between both periods, making them third and fourth. Olea has the highest %PT of the two in the first period, with 6.4%, compared with Pinus at 4.9%, whereas in the second period, Pinus has 6.6% and is ahead of Olea, which represents 5.4% of the total pollen measured. Ulmus is last in both cases, with the lowest proportion (2.9% in the first period and 2.1% in the second), behind Populus (with 4.0% and 3.1%, respectively).
It can also be seen that the mean percentages in the period 2013–2017 fall within the range (highlighted in red in Table 2) of the minimum and maximum values in the network for the period 1994–1999 and vice versa, which suggests a certain continuity over time in terms of the variable %PT.
Additionally, the mean values shown in the right-hand column of Table 2 follow the same order as for %PT for the period 2013–2017, with Platanus being the pollen type with the highest concentrations, while also having the highest %PT, whereas Ulmus has the lowest values in both parameters. The same is true of the period 1994–1999, except in the case of Pinus and Olea, where the order is reversed for the parameter %PT.
The left-hand column of Table 3 shows the mean annual values for airborne pollutants. The right-hand column shows the threshold values (for the protection of health) established for these parameters in RD 102/2011 [32] in order to serve as a reference and compare the mean values in this study. In the case of O3 and CO, the threshold values are established as maximum daily values (the result of the mean of the eight-hourly values), and in the case of SO2, as a mean daily value. In these three cases it would not be sufficient to establish annual threshold values because these are pollutants that must be closely monitored owing to their serious health implications.
For this reason, the mean values obtained in this study can only be compared in a very partial way with these threshold values, although it is true that the annual mean values calculated and displayed in the left-hand column are in all three cases significantly lower than the threshold values, even taking into account the results of the standard deviation in the second column of Table 3.
Table 3.
Values of the mean, standard deviation, and coefficient of variation (as a percentage) for airborne pollutants. The right-hand column shows the threshold values established for these pollutants.
Table 3.
Values of the mean, standard deviation, and coefficient of variation (as a percentage) for airborne pollutants. The right-hand column shows the threshold values established for these pollutants.
| Airborne Pollutants | Mean | Standard Deviation | Coefficient of Variation (CV) | Threshold Values |
|---|---|---|---|---|
| Ozone (O3) (µg/m3) | 50.902 | 20.735 | 40.736% | 120 (daily maximum of the mobile eight-hourly means) Objective value (mean for 2010, 2011 and 2012) |
| Nitrogen dioxide (NO2) (µg/m3) | 33.745 | 14.840 | 43.976% | 40 (mean annual value) Threshold value in force since 2010 |
| Particles < 10 µm (PM10) (µg/m3) | 21.107 | 6.308 | 29.887% | 40 (mean annual value) Threshold value in force since 2005 |
| Particles < 2.5 µm (PM2.5) (µg/m3) | 10.957 | 3.214 | 9.337% | 25 (mean annual value) Threshold value in force since 2015 |
| Carbon monoxide (CO) (mg/m3) | 0.375 | 0.140 | 37.434% | 10 (daily maximum of the mobile eight-hourly means) Threshold value in force since 2005 |
| Sulphur dioxide (SO2) (µg/m3) | 4.147 | 3.251 | 78.390% | 125 (mean daily value) Threshold value in force since 2005 |
Source for right-hand column: RD 102/2011, as of 28 January, regarding improvements in air quality (gestiona.madrid.org, accessed on 23 March 2022).
The value of the standard deviation implies that the result obtained for the mean in the case of NO2, although below the threshold value (here annual, as in the case of PM10 and PM2.5), may be exceeded, which is not the case for particles (PM10 and PM2.5), as their mean values, added to those of the standard deviations, are lower than the threshold values established for particles by RD 102/2011 [32], according to Spanish legislation that establishes limit values, target values, and thresholds for air quality in order to avoid the harmful effects of the abovementioned substances (Table 3) on human health and the environment.
Unlike the results for pollen types, the dispersion of the data around the mean value measured by the standard deviations is comparatively lower, so the results for the coefficient of variation are also significantly lower. Indeed, the highest value for CV is 78.4% in the case of SO2. This can be explained by the fact that these pollutants are, to a large degree, produced by combustion processes that basically occur in private, and commercial vehicles, industrial activities, and domestic boilers, whose activity remains more or less stable over the months (activity is especially concentrated in winter, part of autumn, and spring).
4.1. Correlation Analysis for All the Study Zones and the Period 2013–2017
Table 4 shows the results of the Spearman’s rank correlation coefficient analysis (ρ) in pairs for the variables analyzed in this study. The results for ρ are stronger and closer to 1 or −1 in the case of Olea with O3 and Pinus with O3, with values of 0.6776 and 0.6427, respectively. The results highlighted in orange correspond to correlation values over 0.3 and p values lower than 0.05, indicating correlations that are significantly different from 0, with a confidence level of 95%.
Table 4.
Correlations between the variables “pollen type” and “airborne pollutant” (significant results are shaded in orange).
It can be seen that although the pairs of variables of the six pollen types with SO2 show a value of p < 0.05, they have a very weak ρ value, that is to say, close to 0; however, the correlations analyzed with O3 give significant results (ρ > 0.3 and value p < 0.05), except with Populus and Ulmus.
In most cases, the correlation with ρ > 0.3 and p < 0.05 is negative, so—for example—in the correlation of Cupressaceae with O3, higher values of Cupressaceae correspond to lower values of O3, and vice versa.
The number of data pairs used to calculate each coefficient in the table was always less than 660, corresponding to the maximum number of data possible for each variable analyzed. Thus, in the case of Cupressaceae with O3, 658 pairs of data are shown due to the absence of one data item in each variable. The most notable case of a lack of data occurs with the <2.5 µm particles, as this parameter is only measured in three of the 11 air-quality stations considered in this study.
4.2. Correlation Analysis in Each Study Zone and by Years
In various years in the period 2013–2017, and in each of the study zones—as demonstrated by the analysis of variance with a 5% significance level—a statistically significant difference in the mean values is found only for airborne pollutants, and in no case for pollen types, and solely with the data from five of the 11 measuring stations for airborne pollutants: Alcobendas, Coslada, Escuelas Aguirre, Farolillo, and Casa de Campo.
In these five cases, the Spearman’s correlation coefficient was calculated for the mean value of airborne pollutants in different non-homogeneous year levels (Table S2).
The correlation values were determined for the five years of the study as a whole and for the different zones (Table S1). As can be seen, there are significant correlations between O3 and the pollen types Cupressaceae, Olea, Pinus, and Platanus in all zones, and even with Populus in the case of the Madrid Faculty of Pharmacy. This is very similar to the result obtained for the total of the study areas and the total of the period 2013–2017 (Table 4).
There is also an absence of data on airborne pollutants in eight stations; complete data for these variables are only available in the stations of the Madrid Faculty of Pharmacy, Madrid City Hall, and Villalba. The data most commonly lacking are those for PM2.5, as they are missing in the eight airborne pollutant monitoring stations, in which not all the data are available. The other two variables for which data are missing are CO and SO2, specifically in the stations in Aranjuez, Getafe, Leganés, and Las Rozas (Table S1). The Coslada station does not have data for CO, although it does have data for SO2.
The three airborne pollutants that have no significant correlations with pollen types are SO2 and PM10, and PM2.5 (Table S1). More specifically, SO2 has no significant correlations in the stations of Alcobendas and the Madrid Faculty of Pharmacy. PM10 has no significant correlations in the Getafe station, specifically. PM2.5 has no correlations in the Villalba station. As can be seen in Table 4, SO2 has no significant correlations with any pollen type.
The strongest ρ results, closest to 1 or −1, in the analysis for the whole of the study period (Table S1), are found in all the stations between the variable O3 and the pollen types Olea (in the 11 cases) and Pinus (in all cases except in the Madrid Faculty of Pharmacy and Villalba). There is also one significant correlation between O3 and Platanus in the Madrid Faculty of Pharmacy, with a ρ value of 0.6646. NO2 is the variable with the second highest number of significant correlations (in eight stations: with Pinus in seven cases and with Olea in another five cases).
Additionally, ρ attains a value of −0.6167 between Cupressaceae and PM10 in the Aranjuez station, and 0.6652 between Cupressaceae and CO in Villalba.
Apart from the values mentioned, all the other significant correlations present ρ values below 0.6.
The strongest correlation for the analysis of the total years (Table S1) occurs with a ρ value of 0.7984 between O3 and Olea in Madrid Salamanca District. This highlights the importance of the analysis broken down into zones; among other things, it reveals that there are higher significant values than in the study zones as a whole (the ρ value for Olea with O3 is 0.6776, as can be seen in Table 4).
Unlike in the analysis for the whole of the study period (Table S1), the results obtained by years (Table S2) show correlations that are significantly different from 0, with a 95% confidence level, for the variable SO2 in the Alcobendas station, where ρ values of -0.6515 are found with Olea and −0.7146 with Platanus in 2013, and −0.6199 with Olea in 2014.
With regard to the variable PM10, significant correlations occur in the Coslada station both in the period 2013–2017 (with Pinus and Platanus) and in the different year levels. In this last case, the strongest correlations occur for 2016 with Platanus and Ulmus, with ρ values of −0.7619 and −0.7018, respectively, and with Pinus in 2013 with a ρ value of −0.6294. The 2014, 2015, and 2017 year groups show significant correlations with Olea, Pinus, and Platanus (Table S2).
In the Madrid Faculty of Pharmacy, the variable NO2 shows significant correlations with Olea, Pinus, Platanus, and Populus in both the study period and in the 2015 and 2016 year levels, although it is stronger in this last case. In 2014, significant correlations occur with Pinus and Platanus (with a ρ value of −0.6503 and −0.6084, respectively), and in 2013 and 2017, there are no correlations with any pollen type.
This station shows values of ρ > 0.3 and p < 0.5 for CO with Cupressaceae, Olea, and Platanus, both in the period as a whole and in the 2013, 2014, 2016, and 2017 year levels (in both cases with similar ρ values); however, in 2015, the correlations are stronger with Cupressaceae and Olea (with ρ values of 0.8392 and −0.8827, respectively); in fact, these are the highest ρ values in this study.
Continuing with the station of the Madrid Faculty of Pharmacy, and in relation to the variable SO2, there are no significant correlations in the total years of the study, whereas there are in the homogeneous year groups 2013, 2014, and 2017, with Olea, Pinus, and Platanus on the one hand, and the year groups 2015 and 2016, with Cupressaceae on the other. This is the same situation described for the Alcobendas station.
In the Madrid Salamanca District, PM10 has only one significant correlation with Populus in the study years as a whole, whereas in the years 2013, 2014, and 2015 there are significant correlations for Cupressaceae, Populus, and Ulmus, and in 2016, with Platanus. There are no significant correlations in 2017.
In the same station, this time with the variable CO, ρ has a higher value of 0.3 with Cupressaceae, Olea, and Pinus in both sets of years, and in the 2013, 2016, and 2017 year groups. There are no significant correlations in either 2014 or in 2015.
Finally, in the station of Madrid City Hall, the variable SO2 only presents a significant correlation with Pinus in the period 2013–2017, whereas it has values of ρ > 0.3 with Populus and Ulmus in 2013, and with Olea, Pinus, Platanus, and Populus in the year groups 2015 and 2016. In both year levels mentioned, these correlations are significantly stronger than for the set of years as a whole. There are no significant correlations in 2014 and 2017.
The variable O3 has the highest number of significant correlations with pollen types: 45 out of a total of 145 in the period 2013–2017 as a whole (Table S1), and these correlations occur in all the stations. NO2 is the second variable for airborne pollution, with a total of 39 significant correlations, and PM10 is the third, with 22 in the all the study zones as a whole. The other three variables have fewer correlations with pollen types, although as mentioned earlier, it should be noted that SO2, CO, and PM2.5 are the only variables for which there is a lack of data in several of the study zones.
With regard to pollen types, and in the set of years as a whole (Table S1), Olea and Pinus have 32 significant correlations each with airborne pollutants, which places them in first place. Olea does not show values of ρ > 0.3 with the variable PM2.5 in any of the study zones, whereas Pinus presents this value with all the airborne pollutants in the different zones. Cupressaceae has 29 significant correlations with all the pollutants except PM2.5, whereas Platanus has 29, with the absence of SO2. The analysis by year levels shows significant correlations with this variable in the stations of Alcobendas, the Madrid Faculty of Pharmacy, and Madrid City Hall (Table S2). Ulmus and Populus are the pollen types with the least number of significant correlations for the set of years as a whole (12 and 11, respectively), namely due to all the airborne pollutants, with the exception of O3 and NO2 in the case of Ulmus, and CO in the case of Populus, in the different study zones (Table S1).
As mentioned, the analysis by year provides information on the significant correlations between pollen types and airborne pollutants. Particularly notable is the case of SO2, as judging by the results shown in Table S1, this variable is not correlated with any pollen type in the stations of Alcobendas and the Faculty of Pharmacy, and only with Pinus in Madrid City Hall; however, Table S2 shows that these correlations occur in different year levels and with different pollen types.
Four variables were analyzed by years: NO2, PM10, CO, and SO2. One possible explanation of the absence of interannual variability for O3 is that its concentrations remained stable in the atmosphere in the period 2013–2017, specifically in the troposphere. The same could be said of PM2.5, although it is worth noting the lack of data on this variable in eight of the 11 study zones.
5. Discussion
The variability in the airborne concentrations of the six types of pollen grains in the study throughout the year is significantly high. This could explain the occurrence of the highest rates during the pollination periods, which last between one month in the case of Platanus, and approximately five months in the case of Pinus and Cupressaceae. Outside of this period, the concentrations decline to zero or practically zero for most of the rest of the year. It is important to note that the pollination and flowering periods can be influenced by the concentrations of airborne pollutants [33].
A continuity over time has been observed in the mean and %PT for all pollen types between the study period, 2013–2017, and the period 1994–1999, with slight variations between both (Table 2). This is because the mean percentage for the period 2013–2017 may lie within the network’s minimum and maximum range, corresponding to the period 1994–1999, and vice versa; however, it should be noted that the mean values of %PT are higher in the period 2013–2017 than in 1994–1999 in the case of Cupressaceae (17.8 compared with 16.1), Pinus (6.6 compared with 4.9), and Platanus (22.6 compared with 21.6), whereas the reverse occurs for Olea (5.4 vs. 6.4), Populus (3.1 vs. 4.0) and Ulmus (2.1 vs. 2.9).
These results also show much higher concentrations for Platanus, which is clearly in first place, and Cupressaceae, in second place, compared with the rest of the pollen types in the study.
However, this does not correlate with the number of individuals of these tree taxa, at least in the city of Madrid, at the locations of three of the 11 pollen capture stations in the Palinocam Network. In fact, Platanus hybrida represents 7.2% of the total trees in the city. Ulmus pumila is the species with the greatest representation within the genus, with 6.1%, whereas Cupressus arizonica (the main Cupressaceae species in the city of Madrid) accounts for 4.1% of the total. The other taxa in the study, Olea sp. and Populus sp., have a very limited presence; however, Pinus pinea is by far the most abundant species, with 27.1% of the total specimens [34]. The city of Granada presents a clear contrast, with a very high representation of Cupressaceae, making it one of the top Mediterranean cities in terms of the population sensitized to this type of pollen [28,35].
In the study carried out in the city of León (Spain), a significant upward trend was observed over time in the concentration of Fraxinus pollen throughout the period 1997–2016 [33], and the results of another study conducted in another Spanish city, Granada, reveal an increasing trend in seven of the eight pollen types studied (Cupressaceae, Olea, Pinus, Platanus, Poaceae, Populus, and Quercus) in the period analyzed, 1992–2018 [28].
Together with Cupressaceae and Platanus pollen, Olea shows the highest allergenicity in the Madrid Region. It is considered to be one of the main causes of pollinosis and was the second most important cause of pollen-induced rhinitis and/or asthma in Spain, although it is considerably less important than pollen from Gramineae [17]. Olea was also the main causative agent of pollen allergies in the Mediterranean population [28,35,36,37].
The concentrations of the airborne pollutants analyzed show a much lower variability than in the case of pollen concentrations, which suggests greater year-round stability in pollution rates. In the aforementioned study, in the city of León, a significant downward trend can be seen in the airborne pollutant concentrations (CO, NO, NO2, PM10, SO2 and O3) during the period 1994–2016 [33].
The results are significant in 11 of the 36 possibilities of correlation between the two types of variables studied (for the set of the study zones and in the whole of the period 2013–2017); therefore, it can be said to be an interrelation between both types of variables in these 11 cases. O3 is the pollutant with the highest number of significant correlations with pollen types. It also presents three of the 11 highest results for the ρ value.
As in the present study, the correlation between the airborne pollutants and pollen types studied in Granada also reveals that O3 is the pollutant with the highest influence (although some pollen types also show a correlation with NO2, SO2, CO and PM10). This finding is supported by the use of generalized linear models (GLM) between the two variables, which highlight O3 as the predominant variable in this study [28].
However, another study carried out in two Swedish cities found no significant relations between the occurrence of high daily poplar pollen concentrations and high daily O3 levels (maximum eight-hour values of >80 µg/m3) in either of the two cities in the study [38].
Based on the categorical principal components analysis (CATPCA), carried out in case studies in Madrid, the Poaceae allergen, Phl p 1, was found to have a positive correlation with O3 outside the clinically relevant season [39].
Additionally, the study conducted in the cities of Gothenburg and Malmö [38] revealed strong and significant relations between the high presence of poplar pollen and high maximum daily concentrations of NO2 (max. > 60 µg/m3) in Gothenburg. There was also a strong positive and significant correlation between high levels of poplar pollen and PM10 (max. > 50 µg/m3). This significant relation with NO2 was not found in the other city in the study, Malmö, nor with PM10.
NO2 is the second air pollution variable after O3 in the study by zones with the most significant correlations with pollen types, and PM10 is the third. Other studies have also found significant correlations between PM10 and the variation in pollen concentrations [28,40,41].
No significant correlations occurred between SO2 (ρ > 0.3 and p value < 0.05) and any pollen type in the study zones as a whole and in the total period 2013–2017 (Table 4); however, the analysis by zones and by years (Tables S1 and S2) reveal significant correlations with several pollen types, sometimes with values of ρ > 0.5. Several of the pollen types studied in the city of Granada present correlations with SO2, although they are very low [28].
In addition, the results of the Spearman’s correlation analysis in the study carried out in Bratislava for Poaceae pollen show a significant and positive correlation with all the airborne pollutants in this study (PM10, PM2.5, CO, O3 and NO2), with the exception of the last [27].
In most of the cases studied (for the set of study zones and the period 2013–2017 as a whole), the correlation is negative with ρ > 0.3 and p < 0.05. It is only positive for O3 with Olea, Pinus, and Platanus. A detailed analysis of this finding would definitely be of interest in time (taking into account the monthly values and breaking down the results into the five years of the study) and in space (comparing the results in all stations), in order to find an explanation; this could be done by analyzing climate-related factors and other factors that could be assumed to produce these results.
The analysis by study zones (Table S1) in the period 2013–2017 as a whole reveals a greater number of significant correlations between the variables, which were obscured in the analysis carried out for the total number of zones. This is even more evident in the study examining zones and years, which produces the strongest correlations, closer to 1 or to −1 in this study, and also with a greater range of pollen types; hence the strongest correlations occur in the Madrid Faculty of Pharmacy for the year 2015, corresponding to the variable CO with Cupressaceae and Olea (with values of ρ of 0.8392 and −0.8827, respectively).
In the study examining zones, the variable O3 is confirmed as the airborne pollutant with the highest number of significant correlations with pollen types (as in the study in the city of Granada [28]): 45 out of a total of 145 in the period 2013–2017. One possible explanation for the absence of interannual variability for O3 is that its concentrations remained stable in the atmosphere in the period 2013–2017, specifically in the troposphere. The same could be said of PM2.5, although it is worth noting the lack of data on this variable in 8 of the 11 study zones.
The pollen types, Olea and Pinus, present a greater number of significant correlations (32 each) with airborne pollutants, closely followed by Cupressaceae with 29, and Platanus with 29 as well. It can be assumed that, with the exception of Pinus, the other three pollen types are the most allergenic in this study, and also have significant correlations with almost all the airborne pollutants in different zones.
The Spearman correlation performed for NOx showed a significant positive correlation with Celtis occidentalis and an insignificant correlation with Eucalyptus sp. and Morus alba. In contrast, except for Eucalyptus sp., PM10 and PM2.5 were negatively correlated to total pollen concentration and other taxa in the city of Chandigarh, India [42].
The significant correlations of Platanus with NO2 are negative, which indicates that when NO2 pollution increases, pollen concentration decreases, so there will not be such a negative effect, as in the case of both increasing at the same time, which can compensate for the demonstrated effect of allergenic exacerbation of Platanus pollen by NO2 contamination [43].
This could imply a potential associative effect between these pollen types and airborne pollutants, which exacerbates the negative effects on citizens’ health, as also indicated in the study in the city of León, which explores the potential for interaction between bioaerosols and airborne pollutants, with the resulting increase in adverse effects for human health [33].
6. Conclusions
Although the variability in airborne concentrations of the six types of pollen grains in the study throughout the year is significantly high, there is continuity over time in the mean and %PT for the six types of pollen considered, and the results show less variability in atmospheric pollutants; therefore, the results obtained in the study are representative of the true relationships between pollen concentrations and pollutants. The aim of this study is to establish whether there is a relation between pollutant and pollen emissions into the atmosphere in the study area. The results show that there is an interrelation between atmospheric variables and the concentration of tree pollen. The following relationships have been found. Populus and Ulmus are the least related to contaminants. The highest positive correlations are between O3 and pollen from Olea, Pinus, and Platanus. The highest negative correlations are between NO2 and pollen from Olea and Pinus. PM10 is the third air pollution variable with the most significant negative correlations. The significant negative correlations can compensate for the effect of allergenic exacerbation by NO2 and PM10 contamination. The potential associative effect between the types of pollen studied and atmospheric pollutants, especially in cases of positive correlations, could favor negative effects on the health of citizens. The relationships found show the importance of atmospheric O3 control to avoid major allergy problems in the population.
The study has not considered the possible interaction with atmospheric variables that could interfere with the relationships found. Other geographical variables that could be of interest have not been considered either. Only the pollination periods of each species could also be considered to make the relationships more visible, although this would reduce the number of data used in the analyses. These relationships could serve as a basis for future studies to explain whether this could lead to higher pollen allergenicity in more polluted versus less polluted areas. More studies with data on the incidence of diseases caused by pollen allergy are needed.
Supplementary Materials
The following are available online at https://www.mdpi.com/article/10.3390/su14095259/s1, Table S1: Correlations between the variables “pollen type” and “airborne pollutant” for the period 2013–2017 and for each of the study zones, designated with the name of the stations in the Palinocam Network (significant results shaded in orange); Table S2: Correlations between the variables “pollen type” and “airborne contaminant” in the five study zones where the values for airborne pollutants in the table differ from the mean in the different year levels specified (significant results shaded in orange).
Author Contributions
Conceptualization, J.C.-F. and E.A.-T.; Formal analysis, J.C.-F. and E.A.-T.; Methodology, E.A.-T.; Resources, J.C.-F.; Supervision, E.A.-T.; Writing—original draft, J.C.-F. All authors have read and agreed to the published version of the manuscript.
Funding
This research received no external funding.
Institutional Review Board Statement
Not applicable.
Informed Consent Statement
Not applicable.
Data Availability Statement
The data analyzed in this study can be found in the references of the work.
Conflicts of Interest
The authors declare no conflict of interest.
References
- Geoffrey, H. Donovan Including public-health benefits of trees in urban-forestry decision making. Urban For. Urban Green. 2017, 22, 120–123. [Google Scholar]
- Van den Berg, M.; van Poppel, M.; van Kamp, I.; Andrusaityte, S.; Balseviciene, B.; Cirach, M.; Danileviciute, A.; Ellis, N.; Hurst, G.; Masterson, D.; et al. Visiting green space is associated with mental health and vitaly: A cross sectional study in four European cities. Health Place 2016, 38, 8–15. [Google Scholar] [CrossRef] [PubMed]
- Jansson, M. Green space in compact cities: The benefits and values of urban ecosystem services in planning. Nord. J. Archit. Res. 2014, 26, 139–160. [Google Scholar]
- Alcock, I.; White, M.; Cherrie, M.; Wheeler, B.; Taylor, J.; McInnes, R.; Otte im Kampe, E.; Vardoulakis, S.; Sarran, C.; Soyiri, I.; et al. Land cover and air pollution are associated with asthma hospitalisations: A cross-sectional study. Environ. Int. 2017, 109, 29–41. [Google Scholar] [CrossRef]
- Chan, C.-S. Health-related elements in green space branding in Hong Kong. Urban For. Urban Green. 2017, 21, 192–202. [Google Scholar] [CrossRef]
- Badach, J.; Dymnicka, M.; Baranowski, A. Urban Vegetation in Air Quality Management: A Review and Policy Framework. Sustainability 2020, 12, 1258. [Google Scholar] [CrossRef] [Green Version]
- Manisalidis, I.; Stavropoulou, E.; Stavropoulos, A.; Bezirtzoglou, E. Environmental and health impacts of air pollution: A review. Front. Public Health 2020, 8, 14. [Google Scholar] [CrossRef] [Green Version]
- Lin, L.; Li, T.; Sun, M.; Liang, Q.; Ma, Y.; Wang, F.; Duan, J.; Sun, Z. Effect of particulate matter exposure on the prevalence of allergic rhinitis in children: A systematic review and meta-analysis. Chemosphere 2021, 268, 128841. [Google Scholar] [CrossRef]
- Dick, S.; Friend, A.; Dynes, K.; Alkandari, F.; Doust, E.; Cowie, H.; Ayres, J.G.; Turner, S.W. A systematic review of associations between environmental exposures and development of asthma in children aged up to 9 years. BMJ Open 2014, 4, e006554. [Google Scholar] [CrossRef]
- Bălă, G.P.; Râjnoveanu, R.M.; Tudorache, E.; Motișan, R.; Oancea, C. Air pollution exposure—The (in) visible risk factor for respiratory diseases. Environ. Sci. Pollut. Res. 2021, 28, 19615–19628. [Google Scholar] [CrossRef]
- Rondón, C.; Eguiluz-Gracia, I.; Campo, P. Is the evidence of local allergic rhinitis growing? Curr. Opin. Allergy Clin. Immunol. 2018, 18, 342–349. [Google Scholar] [CrossRef] [PubMed]
- Subiza, J. Papel de la polución en el aumento de la polinosis. Centro de Asma y Alergia Subiza, Madrid. Salud Rural. 2004, 21, 1–6. [Google Scholar]
- Sedghy, F.; Varasteh, A.R.; Sankian, M.; Moghadam, M. Interaction between air pollutants and pollen grains: The role on the rising trend in allergy. Rep. Biochem. Mol. Biol. 2018, 6, 219. [Google Scholar] [PubMed]
- Bédard, A.; Bousquet, J.; Antó, J.; Garcia-Aymerich, J.; Arnavielhe, S.; Laune, D.; Sofiev, M.; Basagaña, X. Interaction between air pollution and pollen seasons on allergic rhinitis control. Environ. Epidemiol. 2019, 3, 26. [Google Scholar] [CrossRef]
- Gutiérrez Bustillo, M.; Sáenz Laín, C.; Aránguez Ruíz, E.; Ordóñez Iriarte, J.M. Polen Atmosférico En La Comunidad De Madrid; Documentos técnicos de salud pública; Dirección General de Salud Pública, Consejería de Sanidad, Comunidad de Madrid: Madrid, Spain, 2001. [Google Scholar]
- Díaz de la Guardia, C.; Sabariego, S.; Alba, F.; Ruíz, L.; García Mozo, H.; Toro Gil, F.J.; Valencia, R.; Rodríguez Rajo, F.J.; Guardia, A.; Cervigón, P. Aeropalynological study of the genus Platanus l. in the Iberian Peninsula. Polen 1999, 10, 89–97. [Google Scholar]
- Subiza, J.; Feo Brito, F.; Pola, J.; Moral, A.; Fernández, J.; Jerez, M.; Ferreiro, M. Pólenes alergénicos y polinosis en 12 ciudades españolas. Comité de Aerobiología de la SEAIC. Rev. Esp. Alergol. Inmunol. Clin. 1998, 13, 45–58. [Google Scholar]
- Orozco Barrenetxea, C.; Pérez Serrano, A.; González Delgado, M.N.; Rodríguez Vidal, F.J.; Alfayate Blanco, J.M. Contaminación ambiental; Una visión desde la Química. Departamento de Química. Escuela Politécnica Superior; Paraninfo, Ed.; Universidad de Burgos: Burgos, Spain, 2003. [Google Scholar]
- Directiva 2008/50/CE Del Parlamento Europeo y Del Consejo, De 21 De Mayo De 2008, Relativa a La Calidad Del Aire Ambiente Y a Una Atmósfera Más Limpia En Europa. Available online: https://www.boe.es/buscar/doc.php?id=DOUE-L-2008-81053 (accessed on 16 April 2021).
- Protected Natural Spaces in the Madrid Region. Available online: https://www.comunidad.madrid/servicios/urbanismo-medio-ambiente/espacios-naturales-protegidos (accessed on 13 April 2021).
- Parks in Madrid. Available online: https://www.madrid.es/portales/munimadrid/es/Inicio/El-Ayuntamiento/Parques-y-jardines/Patrimonio-Verde/Parques-en-Madrid/?vgnextfmt=default&vgnextchannel=38bb1914e7d4e210VgnVCM1000000b205a0aRCRD (accessed on 13 April 2021).
- Madrid recognised Tree City 2019. Available online: https://www.madrid.es/portales/munimadrid/es/Inicio/Medio-ambiente/Parques-y-jardines/Madrid-reconocida-Ciudad-arborea-del-mundo-2019-por-la-FAO-y-la-Fundacion-Arbor-Day/?vgnextfmt=default&vgnextoid=3cdf84fec1732710VgnVCM2000001f4a900aRCRD&vgnextchannel=2ba279ed268fe410VgnVCM1000000b205a0aRCRD (accessed on 13 April 2021).
- Información de la Red Palinocam. Available online: https://www.comunidad.madrid/servicios/salud/aerobiologia-polen-esporas#red-palinocam (accessed on 8 April 2021).
- Dirección General de Medio Ambiente y Sostenibilidad (2022). Informe Anual Sobre la Calidad del Aire en la Comunidad de Madrid. Año 2021. Available online: http://gestiona.madrid.org/azul_internet/run/j/DescargaFicheros.icm?urlFichero=Informe_anual_2021.pdf (accessed on 7 April 2022).
- Martín Fernández, S.; Ayuga Téllez, E.; González García, C.; Martín Fernández, A. Guía Completa de Statgraphics. Desde MS-DOS a Statgraphics Plus; Complete Guide of STATGRAPHICS. From MS-DOS to Statgraphics Plus; Díaz de Santos: Madrid, Spain, 2001. [Google Scholar]
- Marchevsky, A.M.; Diniz, M.A.; Manzoor, D.; Walts, A.E. Prognosis in pathology: Are we “prognosticating” or only establishing correlations between independent variables and survival? A study with various analytics cautions about the overinterpretation of statistical results. Ann. Diagn. Pathol. 2020, 46, 151525. [Google Scholar] [CrossRef]
- Ščevková, J.; Vašková, Z.; Sepšiová, R.; Jozef Dušička, J.; Jozef Kováč, J. Relationship between Poaceae pollen and Phl p 5 allergen concentrations and the impact of weather variables and air pollutants on their levels in the atmosphere. Heliyon 2020, 6, e04421. [Google Scholar] [CrossRef]
- Cariñanos, P.; Foyo-Moreno, I.; Alados, I.; Guerrero-Rascado, J.L.; Ruiz-Peñuela, S.; Titos, G.; Cazorla, A.; Alados-Arboledas, L.; Díaz de la Guardia, C. Bioaerosols in urban environments: Trends and interactions with pollutants and meteorological variables based on quasi-climatological series. J. Environ. Manag. 2021, 282, 111963. [Google Scholar] [CrossRef]
- Ribeiro, H.; Duque, L.; Guimarães, F.; Abreu, I.; Noronha, F. Airborne Acer pollen wall elemental analysis and adhered particulate matter. Comun. Geológicas 2014, 101, 1355–1358. [Google Scholar]
- Yu, H.R.; Lin, C.R.; Tsai, J.H.; Hsieh, Y.T.; Tsai, T.A.; Tsai, C.K.; Lee, Y.C.; Liu, T.Y.; Tsai, C.M.; Chen, C.C.; et al. A Multifactorial Evaluation of the Effects of Air Pollution and Meteorological Factors on Asthma Exacerbation. Int. J. Environ. Res. Public Health 2020, 17, 4010. [Google Scholar] [CrossRef] [PubMed]
- Vo, G.T.; Liu, Z.; Chou, O.; Zhong, B.; Barrow, C.J.; Dunshea, F.R.; Suleria, H.A. Screening of phenolic compounds in australian grown grapes and their potential antioxidant activities. Food Biosci. 2022, 47, 101644. [Google Scholar] [CrossRef]
- Valores Límite y Objetivo, Según RD 102/2011. Available online: http://gestiona.madrid.org/azul_internet/html/web/2_3.htm?ESTADO_MENU=2_3 (accessed on 5 April 2021).
- Oduber, F.; Calvo, A.I.; Blanco-Alegre, C.; Castro, A.; Vega-Maray, A.M.; Valencia-Barrera, R.M.; Fernández-González, D.; Fraile, R. Links between recent trends in airborne pollen concentration, meteorological parameters and air pollutants. Agric. For. Meteorol. 2019, 264, 16–26. [Google Scholar] [CrossRef]
- Borrajo, J.M.; Rastrollo, A.; Nowak, D. Valor del Bosque Urbano de Madrid; Edita Ayuntamiento de Madrid: Madrid, Spain, 2018. [Google Scholar]
- Charpin, D.; Calleja, M.; Pichot, C.; Penel, V.; Hugues, B.; Poncet, P. Cypress pollen allergy. Rev. Des Mal. Respir. 2013, 30, 868–878. [Google Scholar] [CrossRef]
- Gaussorgues, R. The olive tree and its pollen in the Mediterranean basin. An allergy risk. Rev. Fr. Allergol. 2009, 49, 52–66. [Google Scholar]
- Ovidiu, B. Oleaceae pollen allergy and its cross-reactivity in the Mediterranean area in the context of globalization. Iran. J. Allergy Asthma Immunol 2014, 13, 290–295. [Google Scholar]
- Grundström, M.; Dahl, Å.; Ou, T.; Chen, D.; Pleijel, H. The relationship between birch pollen, air pollution and weather types and their effect on antihistamine purchase in two Swedish cities. Aerobiologia 2017, 33, 457–471. [Google Scholar] [CrossRef] [Green Version]
- Cabrera, M.; Subiza, J.; Fernández-Caldas, E.; García, B.G.; Moreno-Grau, S.; Subiza, J.L. Influence of environmental drivers on allergy to pollen grains in a case study in Spain (Madrid): Meteorological factors, pollutants, and airborne concentration of aeroallergens. Environ. Sci. Pollut. Res. 2021, 28, 53614–53628. [Google Scholar] [CrossRef]
- Puc, M.; Bosiacka, B. Effects of Meteorological Factors and Air Pollution on Urban Pollen Concentrations. Pol. J. Environ. Stud. 2011, 20, 611–618. [Google Scholar]
- Manninen, H.E.; Bäck, J.; Shito-Nishilä, S.L.; Huffman, J.A.; Pessi, A.M.; Hiltunen, V.; Aalto, P.P.; Hidalgo, P.J.; Hari, P.; Saarto, A.; et al. Patterns in airborne pollen and other primary biological aerosol particles (PBAP), and their contribution to aerosol mass and number in a boreal forest. Boreal Environ. Res. 2014, 19, 383–405. [Google Scholar]
- Lu, S.; Ren, J.; Hao, X.; Liu, D.; Zhang, R.; Wu, M.; Yi, F.; Lin, J.; Shinich, Y.; Wang, Q. Characterization of protein expression of Platanus pollen following exposure to gaseous pollutants and vehicle exhaust particles. Aerobiologia 2014, 30, 281–291. [Google Scholar] [CrossRef] [PubMed] [Green Version]
- Ravindra, K.; Goyal, A.; Mor, S. Influence of meteorological parameters and air pollutants on the airborne pollen of city Chandigarh, India. Sci. Total Environ. 2022, 818, 151829. [Google Scholar] [CrossRef] [PubMed]

Publisher’s Note: MDPI stays neutral with regard to jurisdictional claims in published maps and institutional affiliations. |
© 2022 by the authors. Licensee MDPI, Basel, Switzerland. This article is an open access article distributed under the terms and conditions of the Creative Commons Attribution (CC BY) license (https://creativecommons.org/licenses/by/4.0/).