Abstract
Limited knowledge on the water–energy–carbon nexus of water supply systems (WSSs) with brackish groundwater sources in arid regions exists to date. In addition, the large amount of fossil-fuel energy utilized by treatment processes generating a significant amount of carbon emissions remains a challenge for the municipalities in Saudi Arabia to meet long-term sustainability goals. To achieve Saudi Arabia Vision 2030’s target of sustainable cities with reduced CO2 emissions, the present study aimed to analyse the water–energy–carbon nexus for WSSs and propose mitigation measures for reducing energy and carbon footprints from both the water management and treatment technologies perspectives. The detailed energy consumption data for three main components (source extraction, water treatment, and conveyance and distribution) of the main WSS, serving the 600,000 population of Buraydah City (Qassim, Saudi Arabia), was obtained from the concerned municipality. The city water treatment plant removes naturally occurring iron, TDS, and radionuclides in the source water with the help of ion detention, oxidation, sand filtration, ultrafiltration, reverse osmosis, chlorination, and backwash water management. The study found that the treatment facility consumes around half of the total system’s energy (131,122 kWh/day); while, with deep confined aquifer (>600 m) and an average water loss of 8%, conveyance and distribution (34%) and source extraction (18%) are consistent with the reported literature. With oil-driven energy, carbon emissions were found to be 10.26, 27.18, and 19.72 million tons CO2 eq/year for source extraction, water treatment, and conveyance and distribution, respectively. The reverse osmosis process, with higher energy consumption—1.1 kWh/m3 of treated water—than the global average, consumes most (88%) of the treatment plant’s energy and thus needs effective energy management practices. Moving to renewable (solar and wind-driven) sources, subject to a detailed life cycle analysis, can achieve significant energy and associated carbon emission reductions. To sustainably meet the water demand of the growing population in arid regions, the study also suggests raising the awareness of the public about how water conservation can control CO2 emissions, proactive maintenance of aging infrastructure, and increasing rainwater and treated wastewater reuse, to enhance the operational life of existing treatment facilities.
1. Introduction
Despite the shortage of water in arid regions, the Gulf countries are facing many challenges in providing a reliable potable water supply, such as limited resources, high production costs, low water rates, and environmental impacts [1]. The water–energy–carbon nexus (WEC-Nexus) assessment is inescapable. As there exist fewer freshwater sources, most of the Gulf countries primarily rely on saline-seawater or brackish-groundwater sources and utilize extensive energy for treating these naturally contaminated sources [2]. In addition, primary dependence on fossil-fuels-based energy increases the complexity of the WEC-Nexus with every passing year. Globally, fossil-fuel burning and industrial activities have increased carbon dioxide (CO2) emissions by almost 90% in the last 50 years [3].
A water supply system (WSS) consists of several components (source extraction, transmission, treatment, and distribution) with varying remaining operational lifespans, obsolescence risks, and energy requirements. Although WEC-Nexus also incorporates water for energy (e.g., hydropower), the present research discusses energy for WSS and the associated carbon emissions emitted from the energy sources (e.g., fossil fuels and solar) used to produce electricity for different processes (treatment) and operations (pumping) in a WSS. To evaluate the performance of these components, energy consumption and associated emissions need to be assessed (i.e., estimated and compared with global averages) to identify more energy-intensive processes. Subsequently, for the long-term sustainability of WSSs, operators can improve the performance of high energy consuming components, adopt proactive maintenance strategies, and investigate the viability of new treatment technologies and alternative energy sources. The accuracy of the nexus assessment depends on a detailed energy data inventory for all the components. In the absence of the desired importance given to WEC-Nexus in arid regions, only serious efforts can acquire thorough operational data to accurately assess the dependence of municipal water supplies on energy, in consort with CO2 emissions. A reliable assessment can further evaluate the renewable energy options for the sustainable development of water supply systems in arid regions.
The total energy requirement of a WSS greatly depends on the water source. Fresh surface water sources are easy to extract and treat, as compared to saline or brackish water sources. As per Wakeel et al. [4], groundwater extraction can be up to 27% higher than that of surface-water sources. Furthermore, extraction of deeper and naturally contaminated groundwater in arid regions consumes relatively higher energy than the rest of the world [5,6]. The absence of high total dissolved solids (TDS) levels and shallow suction heads of pumps at water intakes demand simpler extraction and treatment processes. Saline or brackish groundwater sources generally need pumps with large suction heads and membrane treatment processes, e.g., reverse osmosis (RO), demanding high energy. Thermal desalination processes receiving raw water from sea water sources utilize the highest energy for treating municipal water supplies. To draw a comparison using the published information, conventional surface water treatment utilizes as low as 0.01 kWh/m3 in some WSSs in Australia [7] to as high as 0.47 kWh/m3 in the United States [8], the RO process consumes 0.36–0.47 kWh/m3 for treating brackish water at an osmotic pressure of 220–450 psi [9], while multistage-flash distillation exhausts 26.42–68.69 kWh to treat 1 m3 of raw water [10]. Both the type of water treatment processes and management practices influence energy consumption [4].
An urban water supply system with a groundwater source primarily consists of three discrete components, including extraction (mainly wells), treatment (processes and sludge removal), and transmission and distribution; each of these components consumes energy in the form of electricity. It is estimated that between 0.3–0.7 kg CO2 is emitted for each 1 KWh of energy (electricity) used [11,12]. The amount of CO2 emission differs depending on the type of treatment processes and plant design conditions. Recently, there has been an increased emphasis on including sustainability into water infrastructure design and reducing the CO2 emissions of water-related processes [13]. As the water sector is a large consumer of energy, energy use and associated CO2 emissions just seem to increase continuously as the world develops. Hence, detailed WEC-Nexus assessment is unavoidable for the sustainability of urban WSSs.
As of 2019, in the Kingdom of Saudi Arabia (KSA), desalinated seawater covers 60% of the water demand while non-renewable sources (e.g., groundwater and reclaimed wastewater) produce the remaining 40%. In KSA, the regions relying on deep (>500 m) groundwater sources and those naturally contaminated with TDS, iron, and radionuclides higher than the Saudi Arabian Drinking Water Quality Standards, demand high energy for extraction and treatment [14]. The KSA vision 2030 aims to reduce CO2 by 130 million tons nationwide [15]. As of 2019, KSA holds 33 desalination plants, 353 small-to-large size drinking water treatment plants (DWTPs), and about 204 wastewater treatment plants, which collectively consume about 10% to 20% of the country’s energy resources [14,16]. The country needs higher energy supplies with the growing population and corresponding increase in the size of urban water infrastructure over time. Life cycle emissions from renewables, e.g., solar photovoltaic (PV) systems, are much lower than fossil-fuel-based sources [13,17]. Similar to developed countries with the goal of reducing CO2 emissions, the water directorates in KSA are concerned with putting serious efforts and financial investments into water infrastructure for replacing fossil-fuel-based energy sources with renewables. In addition, the concerned authorities need to rethink the design and operation of WSSs and make an effort to reduce CO2 emissions through a reduction in energy consumption [12,15].
Although various studies evaluated energy consumption in wastewater treatment facilities worldwide [18,19,20,21], relatively fewer studies assessed the WEC-Nexus for WSSs, and fewer in arid regions. Moreover, the literature revealed that most of the past studies assessed energy consumption and carbon emissions for DWTPs relying on surface water sources. A study by Bukhary et al. [22] in Pakistan reported 7.4 Wh/m3 for chlorination and coagulation processes for a smaller DWTP, treating 0.017 m3/day. Later, Bukhary et al. [23] analyzed CO2 emissions from a DWTP in southwestern USA treating 3.94 m3/s and found that water pumps (158.1 Wh/m3) and the coagulation process (1.95 Wh/m3) were the largest consumers of energy. Their study suggested utilizing a photovoltaic (PV) system to reduce energy consumption and, hence, CO2 emissions at the plant. Limited studies on contaminated groundwater sources in arid regions highlight the need for further research on the topic, to help reduce CO2 emissions and improve water conservation practices.
Comprehending the absence of a detailed study covering energy consumption (and associated CO2 emissions) for all the components of WSS relying on brackish groundwater, the authors aimed to assess the water–energy–carbon nexus for the main WSS of the cities in KSA. The specific objectives of the present research are as follows: First, develop a complete inventory of energy consuming equipment and processes used for extraction, treatment, conveyance, and distribution. Second, estimate energy required for each process, the cumulative consumption for all components, and compare with the past studies. Finally, evaluate CO2 emissions by using appropriate emissions factors for the existing energy source (base-case scenario of fossil fuels in KSA) and appraise potential renewable options for emission reduction. The methodology has been applied to the main WSS of Buraydah City to help the Qassim Region Water Directorate in meeting the sustainability goals of the KSA 2030 vision.
2. Methodology
2.1. Water–Energy–Carbon Nexus for Water Supply Systems
Figure 1 illustrates the water–energy–carbon nexus for water supply systems operating in arid regions with naturally contaminated (brackish) groundwater sources. Unlike a surface water source with a long transmission main conveying withdrawal water to DWTP, groundwater wells are spatially distributed in the proximity of the water supply service area. Therefore, conveyance system is combined with the distribution system for NEC-Nexus assessment. The overall system’s components demand energy for: (i) source extraction of groundwater, (ii) treatment of brackish groundwater through a series of processes, and (iii) conveyance and distribution of treated water to the community. Water distribution process includes energy requirement of booster pumps for pressure and chlorine management up to the farthest consumers in the network. Energy requirements depend on type and energy efficiency of equipment (pumps and motors), age of transmission and distribution mains, and the type of treatment processes. All these components utilize energy and produce carbon dioxide (CO2) emissions during operations. Despite efficiency of equipment and age of linear assets, energy source plays the most important role in reducing CO2 emissions.
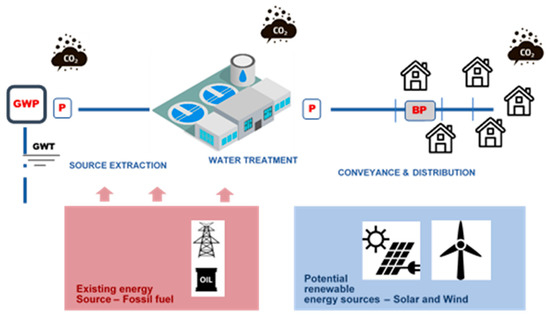
Figure 1.
Water–energy–carbon nexus for water supply system with brackish groundwater source. Abbreviations GWP, P, and BP represent groundwater pumping, pump, and booster pump.
One year data for the average energy consumed by the components (extraction, treatment, and distribution) was acquired from DWTP’s management (through an official request from Qassim University) in Buraydah City for detailed energy assessment. After calculating the CO2 emissions for all the processes individually, overall emissions are presented for each subcomponent and component. The subsequent step compares the estimated energy and CO2 emissions per m3 of produced water for various treatment and distribution components with any available data from the past studies. The final step compares the present CO2 emissions with potential renewable energy options, including solar and wind energy sources.
2.2. Study Area and Collection of Baseline Data
The selected DWTP is located in Buraydah, the capital of Qassim region of KSA, and provides treated groundwater to a population of just over 600,000. As of 2019, the per capita municipal water consumption in Buraydah city was 240 L/c/d, which is slightly lower than national average for KSA (260 L/c/d) [14]. The plant has the capacity to treat 150,000 m3 of water per day and is located in the south of Buraydah City. The raw groundwater entering the plant is transmitted from two well fields (with average well depth of 600–800 m) located in the south and center of the city. Turbidity, iron (Fe2+), manganese (Mn2+), total dissolved solids (TDS), salts (e.g., Chloride (Cl), nitrate (NO3), Sulphates (SO4), and radionuclides are the common naturally occurring pollutants in the groundwater of the well fields. The plant operates 24 h per day and is over 40 years old.
The raw water quality data, the process flow diagram (shown at the bottom of Figure 2) of the DWTP, and the operational data were obtained from the plant’s management. Additional operational data was obtained from authors’ past work [24,25]. Table 1 presents the average concentrations of different water-quality parameters in raw water (combined from 30 wells installed in well field number 1 and 2) received by the Buraydah DWTP. It can be seen in the table that TDS, turbidity, iron, manganese, chlorides, nitrates, and radium are higher than the Saudi Arabian Drinking Water Quality Standards (SA-DWQS) [26].
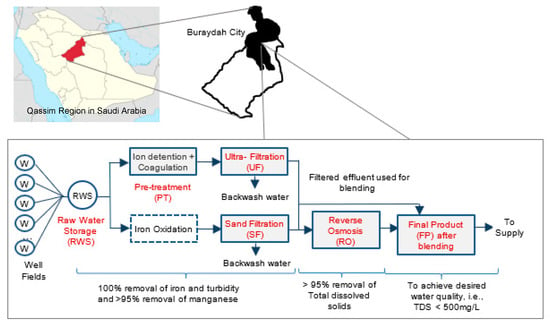
Figure 2.
Location and process flow diagram of the South Drinking Water Treatment Plant in Buraydah. Solid arrows track the treatment of water and dashed arrows represent the wastewater generated. Modified after [25].

Table 1.
Raw water quality of inflow to Buraydah City South DWTP.
Figure 2 shows that the South DWTP in the study area has both old and new treatment units. The old filtration receives raw water from the south and central well fields and adds chloride dose for removal of radium, and metal oxides through oxidation/aeration process. The water then follows through sand filtration for removal of suspended matter, precipitated forms of metal oxides, and floating and sinkable particles. The raw water extracted from the north well field is treated at the new unit, which consists of aeration/ion detention for removal of Fe and Mn, chorine dosing, hydrous manganese oxide dosing for removal of radium, and flocculation, followed by UF for removal of suspended solids (e.g., clay and silt), precipitated metal oxides, and bacteria. Subsequently, the RO process removes TDS from the effluents of both the sand filtration and ultrafiltration units. The RO product is blended with the ultrafiltration (UF) treated water to achieve desired-TDS levels, less than 500 mg/L, as per the KSA drinking water quality standards. The final product, after blending, is disinfected with chlorine gas and then distributed.
2.3. Energy-Consuming Equipment at Water Treatment Plant
High energy consumption increases the cost of treatment and contributes to global warming. The South DWTP in Buraydah treats groundwater extracted from two well fields located in the south and center of the city with average well depth ranging between 600 m and 800 m. Different components (extraction, treatment, and conveyance and distribution) of the DWTP described in the above section consume varying energy levels. Each of the components consist of subcomponents and a subcomponent may consists of multiple equipment. Table 2 presents all the components, subcomponents, and energy-consuming equipment for the DWTP in the study area.

Table 2.
Summary of components, subcomponents, and equipment used at the DWTP.
In the old unit, 3 pumps add the barium chloride dose to the raw water. Subsequently, the water enters into two aeration towers that have eight air blowers and two mixers for oxidation of iron (Fe) and manganese (Mn), followed by the settling tower. After settling, the water is distributed over twenty sand filters for removal of suspended matter and precipitation of metal (primarily Fe and Mn) oxides. Four backwash pumps, four air blowers, and two air compressors clean the filters with air and water on daily basis for a duration of 35 min. Backwash wastewater is collected and transferred to the evaporation ponds for final disposal.
The water entering the new plant is sent to two aeration towers that have four air blowers. The water is then transferred to two tanks for iron detention followed by two tanks for flocculation, where four mixers, four chemical-dosing and transfer pumps, and five drain pumps are used. After aeration/ion detention step, the water is filtered using seven ceramic UF units with seven permeate-water pumps. The UF filters are backwashed with air and water twice per day for a duration of 2 min using two backwash pumps, two air blowers, and two air compressors. Like the old unit, UF backwash water is also collected and transferred to the evaporation ponds. Two pumps perform the clean-in-place (CIP) chemical cleaning, while four additional pumps are used for chemical dosing.
In RO process, fourteen skids of spiral wound composite polyamide RO membranes with a recovery rate of 85% are used. Nineteen feed and high-pressure pumps are used to feed the water into the RO membranes. Five pumps are used for CIP, while fourteen pumps perform chemical dosing. Six blending pumps, two flushing pumps, and two mixers are used. RO reject brine water is sent to evaporation ponds. The RO permeate is blended with a percentage of UF permeate (to balance TDS) and sent to five chlorinated units using five booster pumps. The final treated water from the plant is sent to distribution system through sixteen booster pumps. The wastewater generated from other routine activities (e.g., kitchen, floor cleaning, washing, and flushing) at the plant is sent to wastewater pumping station using two pumps.
2.4. Energy Consumption and Carbon Emissions Assessment
As pumping is the only energy-consuming operation in groundwater extraction (GE), the following equation estimated the energy consumption for water extraction:
where EGE is energy consumed in water extraction (kWh/day), Vw is the amount of water extracted per day (m3/day), and EIGE is the energy intensity by the groundwater wells (Wh/m3). Equation (1) multiplied the average daily amount of water consumed (m3/day) with energy consumption (kWh/day) to obtain daily energy consumption. The denominator “1000” converts “Wh” to “kWh”.
CO2 emissions produced by groundwater extraction were estimated with the help of the following equation:
where CWE denotes the CO2 emissions generated by water extraction (kg CO2 eq/day) and CEFo denotes the carbon-emission factor (kg CO2 eq/kWh) for fossil-fuels energy.
As the subsequent component of water treatment (WT) involves several subcomponents. Each of the subcomponents consists of various equipment.
where EWT is energy consumed in water treatment (kWh/day) and EIi is the energy intensity by the six subcomponents (see Table 2 for details). The denominator “1000” converts Wh to kWh.
The following equation estimated CO2 emissions produced by water treatment:
Finally, energy consumed by conveyance and distribution (CD) was estimated as:
where ECD is energy consumed in conveyance and distribution (kWh/day) and EIi is the energy intensity by the two subcomponents (see Table 2 for details).
In addition, the following equation estimated CO2 emissions produced by conveyance and distribution activities:
The total energy consumed by the entire water supply system under study is:
and the total CO2 emissions generated by the water supply system are:
The Clean Development Mechanism Authority of KSA reported the share of oil (including crude oil, diesel, and residual fuel oil) to be 45% with 55% of natural gas in the energy mix, while the carbon emission factor is 0.568 kg CO2/KWh as of 2021 [27]. The value lies within the reported range of 0.3–0.7 kg CO2/KWh for carbon-emission factor from electricity usage [11,12]. Stages [17] reported that median values below 50 g CO2 e/kWh for solar photovoltaic systems. Wang and Sun [28] reported lifetime emission intensity ranging between 5 and 8.2 g CO2/kWh electricity for wind-power plants. Table 3 presents the carbon-emission factors used for oil-based energy and the potential renewable energy options, including solar and wind energy, used in the present study.

Table 3.
Carbon-emission factors for different energy sources.
3. Results and Discussion
3.1. Energy Consumption Assessment
Table 4 presents detailed information of the energy-driving units and energy-intensities values at various stages of the main WSS of Buraydah City. To treat 15,000 m3/day, the total daily operational energy consumption of the WSS was estimated as 2476 Wh/m3, which includes energy consumption by the groundwater extraction (330 Wh/m3), the water treatment plant’s processes (1421 Wh/m3), and conveyance and distribution (725 Wh/m3).

Table 4.
Energy-assessment results for the main water supply system of Buraydah City.
The percentage distribution for energy consumption by all the components is shown in Figure 3a,b. Equation (3) estimated that 58% (131,122 KWh/day) of the energy is consumed by the water treatment plant. Figure 3b further elaborates the energy distribution by different treatment processes. It can be seen in the figure that the RO process is the primary energy consumer (88%) at the DWTP, with 115,500 KWh/day involved in the operations of high-pressure and chemical-dosing pumps. Out of the remaining 12% of the energy consumption, around 4% is consumed for backwash-sludge management. The UF process consumes 4275 KWh/day, which represents 3% of the total energy consumption by the main treatment processes. Ion detention (2698 KWh/day) and oxidation (2014 KWh/day) processes utilize about 3.6% of the total energy consumption at the DWTP. The sand filtration process, including backwash pumps, consumes 975 KWh/day of energy, representing 0.74% of the total energy consumption. Prior to supply, five chlorine injectors consume 150 KWh/day, which corresponds to 0.11% of the overall energy consumed by the DWTP. The sludge management process, consisting of collection of backwash and residual wastewater, consumes 24% (5510 KWh/day) of the plant’s energy.
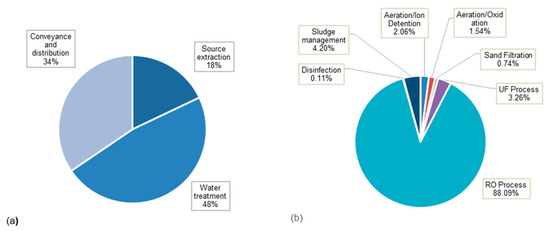
Figure 3.
Percentage distribution of energy consumption in (a) water supply systems as a whole, and (b) water treatment plant of Buraydah City.
Using Equation (5), conveyance and distribution processes contribute 34% to the WSS’s overall energy use. Here, the main pumps consume 12,000 KWh/day (4.4%), while 16 booster pumps utilize the remaining 30% of the energy (83,100 KWh/day). Equation (1) calculated that groundwater extraction utilizes 49,200 KWh/day in the groundwater pumping process, which is 18% of the overall energy requirement of the WSS in the study area.
3.2. Carbon-Emissions Assessment
Figure 4 illustrates the carbon emissions generated from fossil-fuels-based electricity consumption by each component (and subcomponent) of Buraydah City’s WSS. Using Equation (2), Figure 4a shows that water extraction and conveyance produce the lowest (18%) CO2 emission, 10,262 tons CO2 eq/year, while Equation (4) yielded that the main water treatment processes produce the highest (48%) CO2 emission, of 27,184 tons CO2 eq/year. This is expected, due to the high energy consumption by the RO process at the DWTP. From Equation (6), conveyance and distribution produce 19,716 tons CO2 eq/year (34%), mainly from the use of booster pumps. Equation (8) estimated total CO2 emissions from Buraydah DWTP to be approximately 57,163 tons CO2 eq/year.
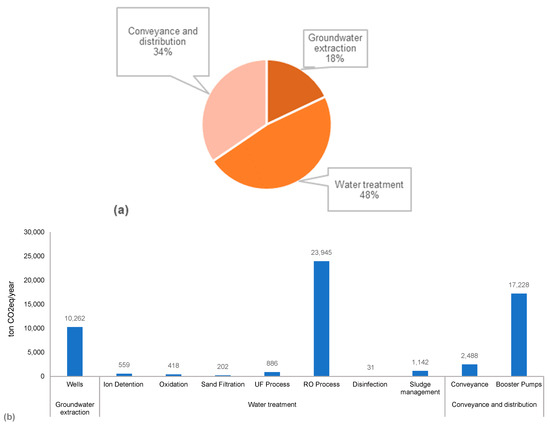
Figure 4.
CO2 emissions generation at water supply system of Buraydah City: (a) per annum CO2 emissions by different components, (b) percentage contribution by different components.
Figure 4b shows the highest CO2 emission generation by the RO process (23,945 tons CO2 eq/year), representing 88% of the total CO2 emissions generated from water treatment and 42% of the overall emissions produced by the WSS. Booster pumps are the second-highest emitters of CO2, with total annual emissions of 17,229 tons KgCO2 eq/year representing 30% of the overall emissions. With an 18% contribution to the total emissions, groundwater extraction is the third highest emitter of CO2, with total annual emissions of 10,262 tons CO2 eq/year, while the disinfection process makes the least contribution of less than 0.1%.
3.3. Discussion
Most of the past studies evaluated energy consumption for water supply systems with surface water sources and conventional treatment facilities, while fewer studies reported energy consumption by various stages of WSS with groundwater sources [29,30,31]. Irrespective of source water and type of treatment, Wakeel et al. [4] presented the per unit energy consumption by the WSSs in twelve countries from different regions around the world and mentioned 0.942 kWh/m3 as an average value. As per their report, ten countries (including US average, UK, Australia, Netherlands, and the Scandinavian countries) consume less than 0.8 kWh/m3 for their WSSs, while the systems in Germany and California State utilize 1.71 and 4.9 kWh/m3, respectively. The present study reports 2.48 kWh/m3 cumulative energy consumed by all the three components of the Buraydah WSS, which is much higher than the global average on one side but around half of the highest value reported for California. Nevertheless, pumping depth and source water quality are the main driving factors affecting energy consumption by any WSS.
In arid regions, EGE depends on groundwater table, pumping depth, and flow and efficiency of the pump [9]. In particular, the depth of groundwater significantly affects the energy consumption; for instance, the past studies reported 0.01 kWh/m3 for 36.5 m depth (0.000274 kWh/m3 per 1 m) and 0.05 kWh/m3 for 121 m depth (0.000413 kWh/m3 per 1 m) [5,29]. The study area, with 600 m depth of pumping, reporting 0.33 kWh/m3 (0.00055 kWh/m3 per 1 m), seems rational if compared with studies with much shallower groundwater sources.
Figure 5 draws a comparison with two past studies with similar WSS’s characteristics. Klein et al. [29] estimated the electricity use for an urban groundwater treatment system in California as 0.04 kWh/m3 for extraction, 0.026 kWh/m3 for water treatment, and 0.32 kWh/m3 for water distribution. Similarly, Marsh et al. [31] reported the energy consumption for a typical groundwater treatment system in Australia as 0.5 kWh/m3 for extraction, 0.3 kWh/m3 for water treatment, and 1 kWh/m3 for water distribution. Figure 4 shows variations in energy consumption patterns amongst the three studies. The study by Klein et al. [29] represented much lower values than the other two studies, while the study by Marsh et al. [31] reported higher values for extraction and distribution in comparison to the present study. These variations show that depth of groundwater, location and terrain of source (e.g., mountainous in Australia and rolling in Qassim), and the topography of a distribution network’s service area significantly affect energy consumption. The much higher energy consumption by the Buraydah DWTP compared to those reported by previous studies might be due to there being more contaminated source water than the other two studies. These high values for energy consumption also highlight the need for detailed performance monitoring of water treatment units and management of backwash water streams to reduce energy requirements.
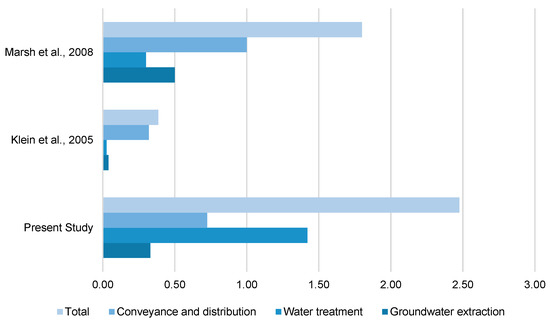
Figure 5.
Comparison showing energy estimates for different components of the water supply system in the study area and past studies [29,31].
Table 5 compares energy consumption by Buraydah WSS with some systems in other regions relying on brackish groundwater sources. It can be clearly seen that EGE in the Buraydah WSS lies within the range of energy consumption of other WSSs in California, Sydney, Spain, and Canada. In terms of EWT, Buraydah DWTP is clearly higher (than USA, Australia, and China) or in the upper range of energy consumption ranges reported for Spain and Canada. These findings also suggest the need for improvements in energy management at DWTP.

Table 5.
Energy consumption of various water-treatment systems in different regions.
As part of GHG emissions, CO2 emissions are released into the air as a result of anthropogenic activities and industrial processes. CO2 emissions are crucial due to their larger contribution as compared to other GHG gasses. Fossil fuel burning and industrial activities emitted 588 million tons of CO2 emissions in KSA as of 2020, which corresponds to one of the largest per capita CO2 emission production around the world [12]. The CO2 emissions from the Buraydah WSS are estimated to be 1.04 kg CO2 eq/m3 of treated water, which are much higher than most of the other water system operating under similar conditions, e.g., China, Spain, and Canada (see Figure 6).
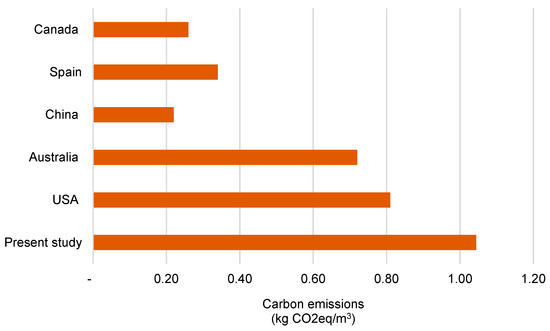
Figure 6.
Comparison of CO2 emissions generated from Buraydah WSS and some other water supply systems with groundwater sources.
4. Energy and CO2 Emissions Management in Water Supply Systems
One of the main goals of the KSA 2030 vision is to reduce annual CO2 emissions by 130 million tons CO2/year [15]. Energy consumption and CO2 emissions analysis revealed that existing treatment technologies and energy-management practices at Buraydah DWTP have room for improvement. Considering the less challenging water quality of the source water (i.e., groundwater) in comparison to sea water, the energy and carbon footprints of DWTP are considerably higher compared to other similar DWTPs and are expected to increase over the next years due to the expected increase in the city population. A number of mitigation measures are proposed here to help reduce energy and carbon footprints, from both water management and treatment technologies perspectives, and to help achieve the KSA 2030 vision with regards to the reduction in CO2 emissions.
The present study proposed an overall approach for water–energy nexus of WSSs in arid regions facing water scarcity. WEC-Nexus of a water supply system depends on the geographical and hydrogeological conditions of the area. For instance, the depth of groundwater significantly affects pumping energy; the distance between the well field, DWTP, and service area can be the main driving factor for energy requirements of the conveyance system; concentrations of salts and radionuclides define the energy for the membrane-treatment process; and the terrain of the service area of the distribution network essentially affects distribution energy requirements. In addition, the two most important factors affecting the water demand of an area are population growth and climate change. To fulfil the growing urban water demand, existing treatment facilities need to be expanded. Alternative water sources, such as rainwater harvesting, artificial groundwater recharge, and greywater treatment and recycling will preserve the limited water resources as well as minimize energy requirements and CO2 emissions by confining the expansions of existing water treatment facilities. These decentralized water systems can be integrated with the central system.
The best possible way of incorporating the centralized and decentralized water systems is by implementing the strategy of fit-for-purpose for water supplies, as recently suggested by Nair et al. [36]. To reduce the energy consumption and carbon footprint of DWTP, the framework shown in Figure 7 integrates centralized and decentralized water sources in one frame. The treated water (from all sources) is considered as a centralized water source, while the decentralized water supply is from harvested rainwater and treated greywater. The water supply source is carefully selected as per the purpose of use, to meet the desired quality of that particular purpose. For instance, rainwater can be used for non-potable use, e.g., laundry, toilet flushing, and flor cleaning, while stormwater and treated greywater can be used for landscaping. In this way, around 20–25% of total potable water demand can be reduced, which will minimize the energy consumption by DWTP.
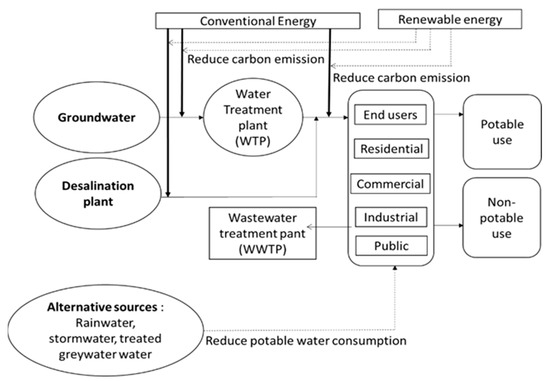
Figure 7.
Proposed approaches for urban water systems in arid regions.
Reduction in water consumption is one of the first strategies that need to be implemented to lower the energy and carbon footprint of the DWTP. Sustainable cities, one of the main goals of the KSA 2030 vision, requires the reduction in daily-per-capita consumption from the national average of 260 L/c/d in 2019 to 150 L/c/d by 2030 [15]. Reduction in water consumption per capita will have significant impacts on the amount of treated water required and, hence, the amount of energy needed. Raising public awareness and using water-saving devices are the first steps to reduce water consumption. It is reported that the effective implementation of both measures could reduce water consumption and save water by 30% [37]. Thus, both measures can reduce the per-capita consumption in Buraydah City from 240 to 168 L/c/d. If the year 2021 is considered as a base for water-savings calculation, this would be translated into savings of about 17,000 ton CO2 eq/year. A significant amount of CO2 can be avoided and mitigated if these water conservation policies are made and put in place.
As a result of aging mains and inefficient metering practices, the KSA can lose up to 30%, at any given day, of its transmitted treated water in urban areas before it reaches customers [38]. Presently, municipalities in KSA are trying to reduce water losses to 8% (i.e., a national benchmark) through planned active leakage control programs in their service areas. However, water leakage remains one of the persistent issues in Buraydah City, as it losses more than 8% of its transmitted water due to leaks, service-connection failures, and cracks in storage tanks [1]. Considering production costs and appreciating the environmental value of water in arid regions, existing targets seems quite unambitious. Controlling leakage in distribution systems by implementing proactive maintenance activities and pressure management would be expected to go a long way toward minimizing water leakage and reducing the need for expansion of water treatment facilities and associated CO2 emissions production. If the year 2021 is considered as a base for CO2 emissions reduction, maintaining water leakage by 8% (or less) would result in saving approximately 12,000 m3 of treated water per day. This would be translated into savings of about 3600 ton CO2 eq/year. A substantial amount of CO2 can be reduced if water leakage programs are made and put in place.
One of the main energy-consuming units at the current Buraydah DWTP is the RO system, which represents almost 40% of the total energy, thus contributing to a higher percentage of CO2 emissions. The main function of the RO system at the plant is to remove TDS from water and provide effluent with TDS of < 500 mg/L (i.e., an acceptable drinkable water TDS level).
In the recent past, an increased interest towards including sustainability in water infrastructure design and reducing the CO2 emissions of water-related processes has been noticed [4]. One way to achieve these goals is to shift to renewable energy sources instead of purely relying on fossil-fuels energy. Solar energy helps reduce energy demand, as well as reducing the environmental pollution, including CO2 emissions, caused by traditional energy sources (electricity). Renewable energy has significant potential in KSA due to the abundance of renewable resources, e.g., solar, wind, and geothermal. In particular, the use of solar energy to produce water could be a viable option as it provides cleaner energy, reduces the CO2 footprint and health impacts, and minimizes reliance on electricity sources. Driving energy from solar panels is not known to produce CO2 emissions; however, carbon can be produced during the manufacturing, transportation, and installation of the solar panels [11,13]. The carbon emissions associated with solar-panel manufacturing and installation have been reported to be between 0.045 and 0.090 kg CO2/kWh [11,39]; these emission levels are 10-fold lower than that of traditional fossil-fuel-based sources. Solar energy applications for water treatment could be a promising avenue for the Buraydah city, Qassim region.
A photovoltaic (PV)-solar-energy powered RO system (PV-RO) is a potential solution to offset the energy consumption by the RO process (40% of the total energy consumed), hence, reducing its associated CO2 emissions. In PV systems, solar energy is captured and directly converted into electricity-employing solar cells. Considering that the RO system consumes approximately 115,500 KWh per day, and considering 6 h of sunlight per day, the PV plant can have the capacity of 25 MW and can be built over a 250 m × 500 m area (12 hectares) adjacent to the existing RO system. The PV plant can be connected to both the DWTP and the national grid and can produce power during peak operation that will be sufficient to sustain the energy requirement of the DWTP. Water production can be increased during periods of peak power supply from the PV system. Moreover, energy storage can be used to produce electricity during the night or in bad weather conditions. Wind-driven energy is another potential renewable option.
Figure 8 compares kg CO2 eq/year generated by fossil-fuel energy from Buraydah WSS and the potential renewable options of solar and wind-driven energy. A significant amount of CO2 can be avoided and mitigated if renewable energy is integrated with the existent DWTP. Figure 8 shows that significant (91% for solar and 98% for wind) lifecycle emission reductions can be achieved by shifting to renewable-energy options. KSA has a great potential for solar energy, with average solar radiations between 4.48 and 7.00 kWh/m2 and sunshine hours varying from 7.4 to 9.4 h/day [40]. Almasoud and Gandayh [41] evaluated the potential of solar photovoltaic (PV) energy in KSA. Their study found that solar energy is a more economical option than fossil fuels, excluding the government-supported cost for conventional power plants and including the indirect environmental and health costs. Nevertheless, implementing measures such as energy-recovery devices and the battery-less system can further reduce the overall cost of the PV system. With an average wind speed of 7–8 m/s in the eastern and western coasts and 5–6.5 m/s in the central region, KSA holds the potential for wind as a potential cleaner energy option [42]. A detailed life cycle cost (LCC) and life-cycle assessment (LCA) can further support these findings, prior to the implementation of renewable-energy options in the study area. In the absence of carbon-emission factors for solar and wind energy in KSA, the present research assumed these factors from the past studies [17,28]. This limitation is expected to be addressed in future studies on the WEC-Nexus of water supply systems in KSA.
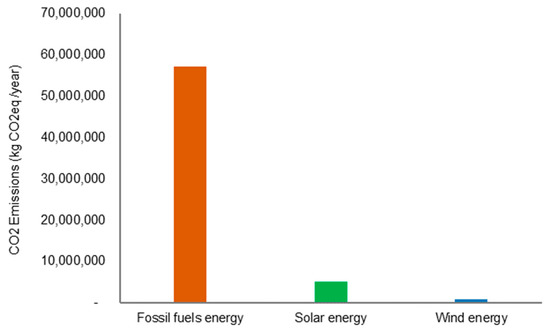
Figure 8.
Annual CO2 emissions comparison for different energy options for Buraydah water supply system.
5. Conclusions
Studies on the water–energy–carbon nexus for water supply system relying on brackish groundwater sources in arid regions are limited. Most of the energy in KSA is generated from fossil fuels, which generate a significant amount of carbon emissions. With the use of high-energy-intensive processes, CO2 emissions from drinking water treatment plants remain one of the main pressing issues being faced by the municipalities to meet KSA Vision 2030 sustainability goals. The present study is the first to estimate energy consumption and associated CO2 emissions from the operations of the main water supply system serving the 600,000 population of Buraydah City of the Qassim region in KSA. Due to a groundwater source naturally contaminated with iron, TDS, and radionuclides, the city water treatment plant performs several processes, including ion detention, oxidation, sand filtration, ultrafiltration, reverse osmosis, chlorination, and sludge management. The methodology’s application revealed that 48% of the energy is being consumed by the treatment facility, while conveyance and distribution (34%) and source extraction (18%) utilize the remaining system’s energy needs. With a carbon emission factor of 0.568 kg CO2/KWh for oil-driven energy, the estimated carbon emissions were found to be 10.26 million tons CO2 eq/year for source extraction, 27.18 million tons CO2 eq/year for water treatment, and 19.72 million tons CO2 eq/year for conveyance and distribution. Although energies utilized by source extraction and conveyance and distribution are consistent with other regions, the water treatment plant (mainly RO process) needs to implement energy management practices due to its energy consumption per of m3 treated water (2.48 kWh/m3) being higher than the global average (0.942 kWh/m3).
Subject to detailed life cycle analysis, a shift to renewable (solar and wind-driven) sources can achieve significant energy and associated carbon-emission reductions. Other suggested efforts for reducing the carbon-energy footprint of water supply systems in arid regions are raising public awareness about water conservation and the public’s contribution to CO2 emissions, implementing proactive maintenance of aging distribution networks, and enhancing the reuse of rainwater and treated wastewater for delaying existing treatment facilities’ expansion. The study found that the water–energy–carbon nexus for water supply systems is a complex phenomenon with the involvement of several environmental (groundwater depth and natural source contamination) and techno-economic (energy source, infrastructure aging, and management practices) factors, which needs continuous efforts to identify local and region-specific challenges.
Author Contributions
Conceptualization, data curation, methodology, formal analysis, M.T.A.; Conceptualization, methodology, writing-original draft preparation, H.H.; Methodology, visualization, writing—review and editing, M.S.; Validation, writing-review and editing, S.S.A.; validation, writing–review and editing, M.A. All authors have read and agreed to the published version of the manuscript.
Funding
This research received no external funding.
Institutional Review Board Statement
Not applicable.
Informed Consent Statement
Not applicable.
Data Availability Statement
All required data are included in the main manuscript.
Acknowledgments
The authors gratefully acknowledge the Buraydah DWTP managers and staff for making this work possible. The authors also thank undergraduate students: Moaid Alduhaiman, Turkei Alrasheedi, Bssam Aljelaud, and Ahmad Alfawzan for assisting with data collection and organization.
Conflicts of Interest
The authors declare that they have no known competing financial interest or personal relationships that could have appeared to influence the work reported in this paper.
References
- Haider, H.; Al-Salamah, I.S.; Ghazaw, Y.M.; Abdel-Maguid, R.H.; Shafiquzzaman, M.; Ghumman, A.R. Framework to Establish Economic Level of Leakage for Intermittent Water Supplies in Arid Environments. J. Water Resour. Plan. Manag. 2019, 145, 05018018. [Google Scholar] [CrossRef]
- Haider, H.; Alkhowaiter, M.H.; Shafiquzzaman, M.; Alresheedi, M.T.; AlSaleem, S.S.; Ghumman, A.R. Source to tap risk assessment framework for intermittent water supply systems in arid regions: An integrated FTA and Fuzzy-FMEA methodology. Environ. Manag. 2021, 67, 324–341. [Google Scholar] [CrossRef] [PubMed]
- USEPA. Available online: https://www.epa.gov/ghgemissions/global-greenhouse-gas-emissions-data#:~:text=Global%20carbon%20emissions%20from%20fossil,increase%20from%201970%20to%202011 (accessed on 22 February 2022).
- Wakeel, M.; Chen, B.; Hayat, T.; Alsaedi, A.; Ahmad, B. Energy consumption for water use cycles in different countries: A review. Appl. Energy 2016, 178, 868–885. [Google Scholar] [CrossRef]
- US GAO. Energy-Water Nexus: Amount of Energy Needed to Supply, Use and Treat Water is Location-Specific and Can Be Reduced by Certain Technologies and Approaches; Report to the Ranking Member Committee on Science, Space and Technology; US House of Representatives: Washington, DC, USA, 2011; pp. 11–225. [Google Scholar]
- Alley, W.M.; Healy, R.W.; LaBaugh, J.W.; Reilly, T.E. Flow and Storage in Groundwater Systems. Science 2002, 296, 1985–1990. [Google Scholar] [CrossRef]
- Cammerman, N. Integrated Water Resource Management and Water Energy Climate Change Nexus. Master’s Thesis, Institute of Social Science Research, The University of Queensland, Brisbane, Australia, 2009; p. 102. [Google Scholar]
- WEF. Energy Conservation in Water and Wastewater Facilities, 1st ed.; WEF Press: New York, NY, USA; McGraw Hill: New York, NY, USA, 2010. [Google Scholar]
- Bennett, B.; Park, L.; Wilkinson, R. Embedded Energy in Water Studies: Water Agency and Function Component Study and Embedded Energy Water Load Profiles; California Public Utilities Commission: San Francisco, CA, USA, 2010. [Google Scholar]
- Younos, T.; Tulou, K.E. Overview of desalination techniques in desalination: A primer. J. Contemp. Water Res. Educ. 2005, 132, 1–10. [Google Scholar] [CrossRef]
- Wahidul, K.; Pauline, Y. Improving the carbon footprint of water treatment with renewable energy: A Western Australian case study. Renewables 2016, 3, 14. [Google Scholar]
- Statista, Carbon Dioxide Emissions from Fossil Fuel and Industrial Purposes in Saudi Arabia from 1970 to 2020. Available online: https://www.statista.com/statistics/486065/co2-emissions-saudi-arabia-fossil-fuel-and-industrial-purposes/#:~:text=Saudi%20Arabia%20emitted%20588%20million,18%20metric%20tons%20per%20person (accessed on 30 March 2022).
- Saria, B.; Jacimaria, B.; Sajjad, A. An Analysis of Energy Consumption and the Use of Renewables for a Small Drinking Water Treatment Plant. Water 2020, 12, 28. [Google Scholar]
- Ministry of Environment, Water and Agriculture. Statistical Book: Year 2019; Ministry of Environment, Water and Agriculture: Riyadh, Saudi Arabia, 2019; pp. 1440–1441. [Google Scholar]
- Ibrahim, A.; Nicholas, H.; Alessandro, L. Growth, Investment, and the Low-Carbon Transition: A Review from Saudi Arabia; Report of King Abdullah Petroleum Studies and Research Center; KAPSARC: Riyadh, Saudi Arabia, 2017. [Google Scholar]
- Khulood, A.; David, M.; Santosh, J.; John, H.; Ahmed, F. Water-Energy Nexus in Saudi Arabia. Energy Procedia 2017, 105, 3837–3843. [Google Scholar]
- Stages, L.C. Life Cycle Greenhouse Gas Emissions from Solar Photovoltaics (Fact Sheet); National Renewable Energy Laboratory (NREL): Golden, CO, USA, 2012. [Google Scholar] [CrossRef][Green Version]
- Smith, K.; Liu, S.; Chang, T. Contribution of Urban Water Supply to Greenhouse Gas Emissions in China. J. Ind. Ecol. 2015, 20, 792–802. [Google Scholar] [CrossRef]
- Fighir, D.; Teodosiu, C.; Fiore, S. Environmental and Energy Assessment of Municipal Wastewater Treatment Plants in Italy and Romania: A Comparative Study. Water 2019, 11, 1611. [Google Scholar] [CrossRef]
- Lahmouri, M.; Drewes, J.E.; Gondhalekar, D. Analysis of Greenhouse Gas Emissions in Centralized and Decentralized Water Reclamation with Resource Recovery Strategies in Leh Town, Ladakh, India, and Potential for Their Reduction in Context of the Water–Energy–Food Nexus. Water 2019, 11, 906. [Google Scholar] [CrossRef]
- Soares, R.B.; Memelli, M.S.; Roque, R.P.; Gonçalves, R.F. Comparative Analysis of the Energy Consumption of Different Wastewater Treatment Plants. Int. J. Arch. Arts Appl. 2017, 3, 79–86. [Google Scholar] [CrossRef]
- Bukhary, S.; Weidhaas, J.; Ansari, K.; Mahar, R.B.; Pomeroy, C.; Van Derslice, J.A.; Burian, S.; Ahmad, S. Using Distributed Solar for Treatment of Drinking Water in Developing Countries. In Proceedings of the World Environmental and Water Resources Congress, Sacramento, CA, USA, 21–25 May 2017; Volume 2017, pp. 264–276. [Google Scholar]
- Bukhary, S.; Batista, J.; Ahmad, S. Design Aspects, Energy Consumption Evaluation, and Offset for Drinking Water Treatment Operation. Water 2020, 12, 1772. [Google Scholar] [CrossRef]
- Haider, H. Performance assessment framework for groundwater treatment plants in Arid Environments: A case of Buraydah, Saudi Arabia. Environ. Monit. Assess. 2017, 189, 544. [Google Scholar] [CrossRef]
- Haider, H.; Ghumman, A.; Al-Salamah, I.; Thabit, H. Assessment Framework for Natural Groundwater Contamination in Arid Regions: Development of Indices and Wells Ranking System Using Fuzzy VIKOR Method. Water 2020, 12, 423. [Google Scholar] [CrossRef]
- Saudi Arabian Drinking Water quality Standards (SA-DWQS). Available online: https://www.thewatertreatments.com/water-treatment-news/water-quality-standards-saso-saudi/ (accessed on 16 March 2022).
- CDM. Development of the Kingdom’s Updated Grid Emission Factor 2021; Clean Development Mechanism—Designated National Authority: Riyadh, Saudi Arabia, 2021. Available online: https://cdmdna.gov.sa/content/files//aa4d63693729d06313ff24b1b9cb694d.pdf (accessed on 14 April 2022).
- Wang, Y.; Sun, T. Life cycle assessment of CO2 emissions from wind power plants: Methodology and case studies. Renew. Energy 2012, 43, 30–36. [Google Scholar] [CrossRef]
- Klein, G.; Krebs, M.; Hall, V.; O’Brien, T.; Blevins, B. California’s Water Energy Relationship; CEC-700-2005-011-SF; California Energy Commission: Sacramento, CA, USA, 2005. [Google Scholar]
- Plappally, A.K.; Lienhard, J.H. Energy requirements for water production, treatment, end use, reclamation, and disposal. Renew. Sustain. Energy Rev. 2012, 16, 4818–4848. [Google Scholar] [CrossRef]
- Marsh, D.M. The Water-Energy Nexus: A Comprehensive Analysis in the Context of New South Wales. Ph.D. Dissertation, University of Technology, Sydney, Australia, 2008. [Google Scholar]
- Kenway, S.J.; Priestley, A.; Cook, S.; Seo, S.; Inman, M.; Gregory, A. Energy Use in the Provision and Consumption of Urban Water in Australia and New Zealand; CSIRO: Water for a Healthy Country National Research Flagship; Water Services Association of Australia (WSAA): Sydney, Australia, 2008. [Google Scholar]
- Liu, J.; Zang, C.; Tian, S.; Liu, J.; Yang, H.; Jia, S. Water conservancy projects in China: Achievements, challenges and way forward. Global Environ. Change 2013, 23, 633–643. [Google Scholar]
- China Urban Water Association. China Urban Water Supply Yearbook (2012); China Urban Water Association Press: Beijing, China, 2012; p. 2012. [Google Scholar]
- Buonomenna, M.G. Membrane processes for a sustainable industrial growth. RSC Adv. 2013, 3, 5694–5740. [Google Scholar] [CrossRef]
- Nair, S.; George, B.; Malano, H.M.; Arora, M.; Nawarathna, B. Water–energy–greenhouse gas nexus of urban water systems: Review of concepts, state-of-art and methods. Resour. Conserv. Recycl. 2014, 89, 1–10. [Google Scholar] [CrossRef]
- Ministry of Water and Electricity. Saudi Arabia Ministry of Water and Electricity Annual Report; Ministry of Water and Electricity: Riyadh, Saudi Arabia, 2013. [Google Scholar]
- Global Water Market. Meeting the World’s Water and Wastewater Needs until 2020; Volume 4 of Middle East and Africa; Global Water Market: Riyadh, Saudi Arabia, 2017; pp. 1379–1385. [Google Scholar]
- Mashail, A. Residential Solar Panels and Their Impact on the Reduction of CarbonEmissions. 2013. Available online: https://nature.berkeley.edu/classes/es196/projects/2013final/ArifM_2013.pdf (accessed on 19 March 2022).
- Rehman, S. Solar radiation over Saudi Arabia and comparisons with empirical models. Energy 1998, 23, 1077–1082. [Google Scholar] [CrossRef]
- Almasoud, A.H.; Gandayh, H.M. Future of solar energy in Saudi Arabia. J. King Saud Univ.-Eng. Sci. 2015, 27, 153–157. [Google Scholar] [CrossRef]
- Allhibi, H.; Chowdhury, H.; Zaid, M.; Loganathan, B.; Alam, F. Prospect of wind energy utilization in Saudi Arabia: A review. Energy Procedia 2019, 160, 746–751. [Google Scholar] [CrossRef]
Publisher’s Note: MDPI stays neutral with regard to jurisdictional claims in published maps and institutional affiliations. |
© 2022 by the authors. Licensee MDPI, Basel, Switzerland. This article is an open access article distributed under the terms and conditions of the Creative Commons Attribution (CC BY) license (https://creativecommons.org/licenses/by/4.0/).