Article

Agricultural Land: Crop Production or Photovoltaic Power Plants

1
Department of Tractors and Agricultural Machines, Operating and Maintenance, Mykolayiv National Agrarian University, 54020 Mykolaiv, Ukraine
2
Institute of Socio-Economic Geography and Spatial Management, University of Opole, 45-040 Opole, Poland
3
Institute of Environmental Engineering and Biotechnology, University of Opole, 45-040 Opole, Poland
*
Author to whom correspondence should be addressed.
Sustainability 2022, 14(9), 5099; https://doi.org/10.3390/su14095099
Submission received: 28 March 2022 / Revised: 18 April 2022 / Accepted: 21 April 2022 / Published: 23 April 2022
(This article belongs to the Section Energy Sustainability)

Abstract

:
Mitigation of climate change requires a decrease in greenhouse gas emissions. It motivates an increase in renewable electricity generation. Farmers can develop renewable energy and increase their profitability by allocating agricultural land to PV power plants. This transition from crop production to electricity generation needs ecological and economic assessment from alternative land utilization. The novelty of this study is an integrated assessment that links economic and environmental (carbon dioxide emissions) indicators. They were calculated for crop production and solar power generation in a semi-arid zone. The results showed that gross income (crop production) ranges from USD 508/ha to USD 1389/ha. PV plants can generate up to 794 MWh/ha. Their market cost is EUR 82,000, and their production costs are less than wholesale prices in Ukrainian. The profitability index of a PV project ranges from 1.26 (a discount range is 10%) to 3.24 (a discount rate is 0). The sensitivity analysis was carried out for six variables. For each chosen variable, we found its switching value. It was revealed that the most sensitive variable is a feed-in tariff. Operational expenses and investment costs are the most sensitive variables. Carbon dioxide footprints range from 500 to 3200 kgCO2/ha (depending on the crop). A 618 kW PV plant causes a release of carbon dioxide in the range of 5.2–11.4 gCO2/kWh. The calculated carbon dioxide payback period varies from 5 to 10 months.

1. Introduction

An increase in greenhouse gas (GHG) emissions is a challenge for modern civilization [1]. World society increases the use of low carbon renewable energy to mitigate climate change. These kinds of energy show fast growth and absolute consumption [2]. However, currently, the transformation of world energy systems does not meet the requirements of the Paris Agreement [3].
The social-economic development expects an increase in second-generation biofuels and energy production from renewable energy, including solar power [4,5]. Annual power generated by solar photovoltaic (PV) needs to be in the range from 54 to 396 EJ to reach limiting warming (the 1.5 °C target by 2100) [5,6]. The development of bioenergy and PV requires the extent of land area. It can cause conflict with food production and, therefore, food security [7,8,9]. The solving of this problem requires using energy management planning [10,11]. The use of abandoned cropland for creating renewable energy infrastructure is a promising solution to reduce competition for arable land [12,13,14].
Abandoned agricultural land can be used for ground-mounted PV panels [15,16]. Due to a decline in specific installed PV system costs [2], solar power plants are expected to play a significant role in power supply systems [17]. As to farmland, about 30% of its area is suitable for PV [18,19,20]. There are a lot of studies concerning the utilization of land for solar energy [13,21,22,23].
Global electricity scenarios predict that the share of solar energy will be in the range of 20–60% and up to 90% in specific regions [24,25]. van de Ven et al. [26] studied the potential solar land requirements and carbon dioxide emissions. They found that solar power plants may occupy up to 5% of total land. The carbon dioxide emission payback period of solar energy is lower as compared to bioenergy [26,27].
Energy Return on Energy Investment (EROEI) is an important indicator for energy resources [28]. For sustainable development of human society, any kind of energy must surpass the “break-even point” (EROEI = 1) [29]. Moreover, the value of EROEI should minimize risks. The minimum values of EROEI were suggested in the range from 10 [29,30,31] to 20 [32]. Capellán-Pérez et al. [30] suggested a classification for EROEI. EROEI for solar PV ranges from 8.7 to 34.2 [33]. It is higher as compared to biofuels (EROEI = 0.69–11.26) [34]. According to the risk classification, solar PV is in the “no-risk” category.
A decrease in the cost of PV makes solar electricity competitive [35]. In the countryside, marginal land is especially promising for solar electricity generation [36,37]. The use of arable land for ground-mounted PV has been tested for agriculture [38]. A trade-off between food and green energy production was analyzed by Sacchelli et al. [39]. The environmental impact of photovoltaic infrastructure was studied by Maye [40]. Life cycle assessment was applied by Turconi et al. [41], Dubey et al. [42], and Hastik et al. [43]. Some studies [44,45] considered site characteristics and suitable degrees for photovoltaic energy generation on farmland. Calvert and Mabee [45] used market parameters to find a trade-off between solar electricity and energy crop production in Ontario, Canada. Dupraz et al. [46] optimized PV and crop cultivation in the same area to maximize energy efficiency. However, the impacts driven by PV plants were explored insufficiently. According to numerous scientific works, there is a conflict between farm photovoltaics and crop production. Nevertheless, the analysis revealed that it is necessary to carry out an integrated economic and environmental assessment for solar power generation and crop production in a semi-arid climate zone.
This study hypothesizes that PV is more profitable and environmentally friendly compared to crop production in a semi-arid climate zone. The purpose of this study is an integral economic and environmental (carbon dioxide emissions) assessment of a PV power plant in farmland and a comparison of the results obtained with crop production. Specific of our work is the analysis that was carried out for semi-arid climate zone. Several objectives were put forward to achieve this purpose:
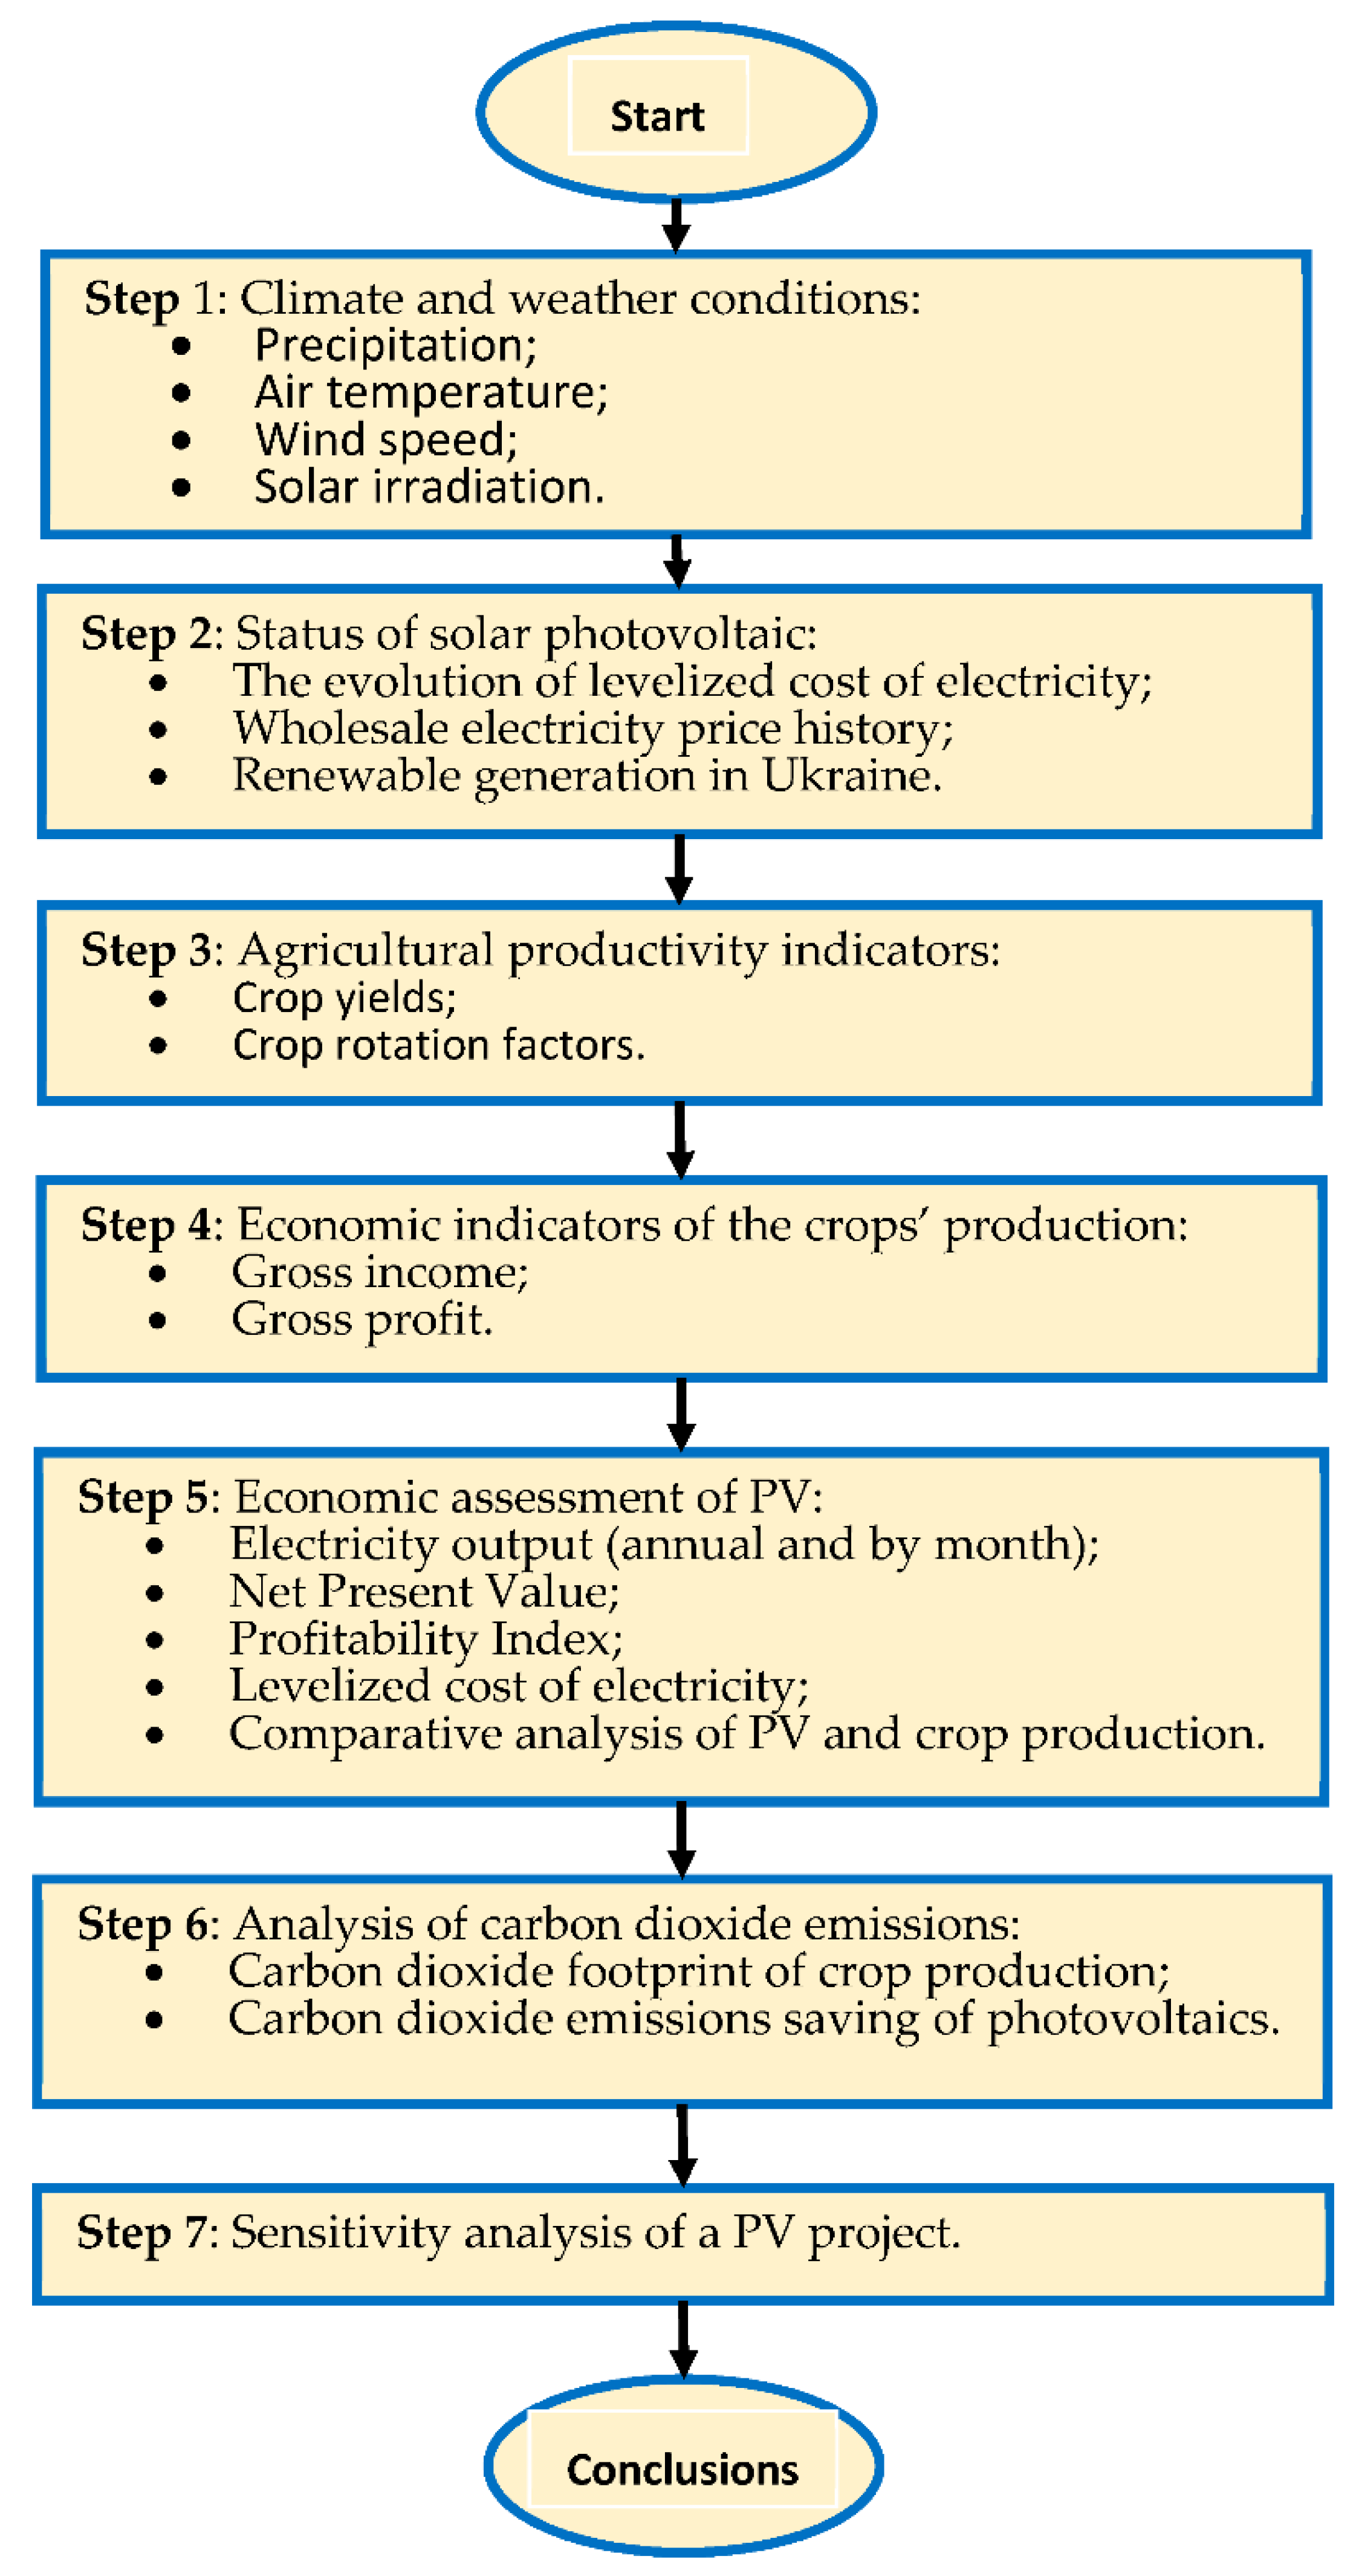
  • The clarifying of weather conditions in the area of field experiments;
  • The determining of gross income and profit of crop production;
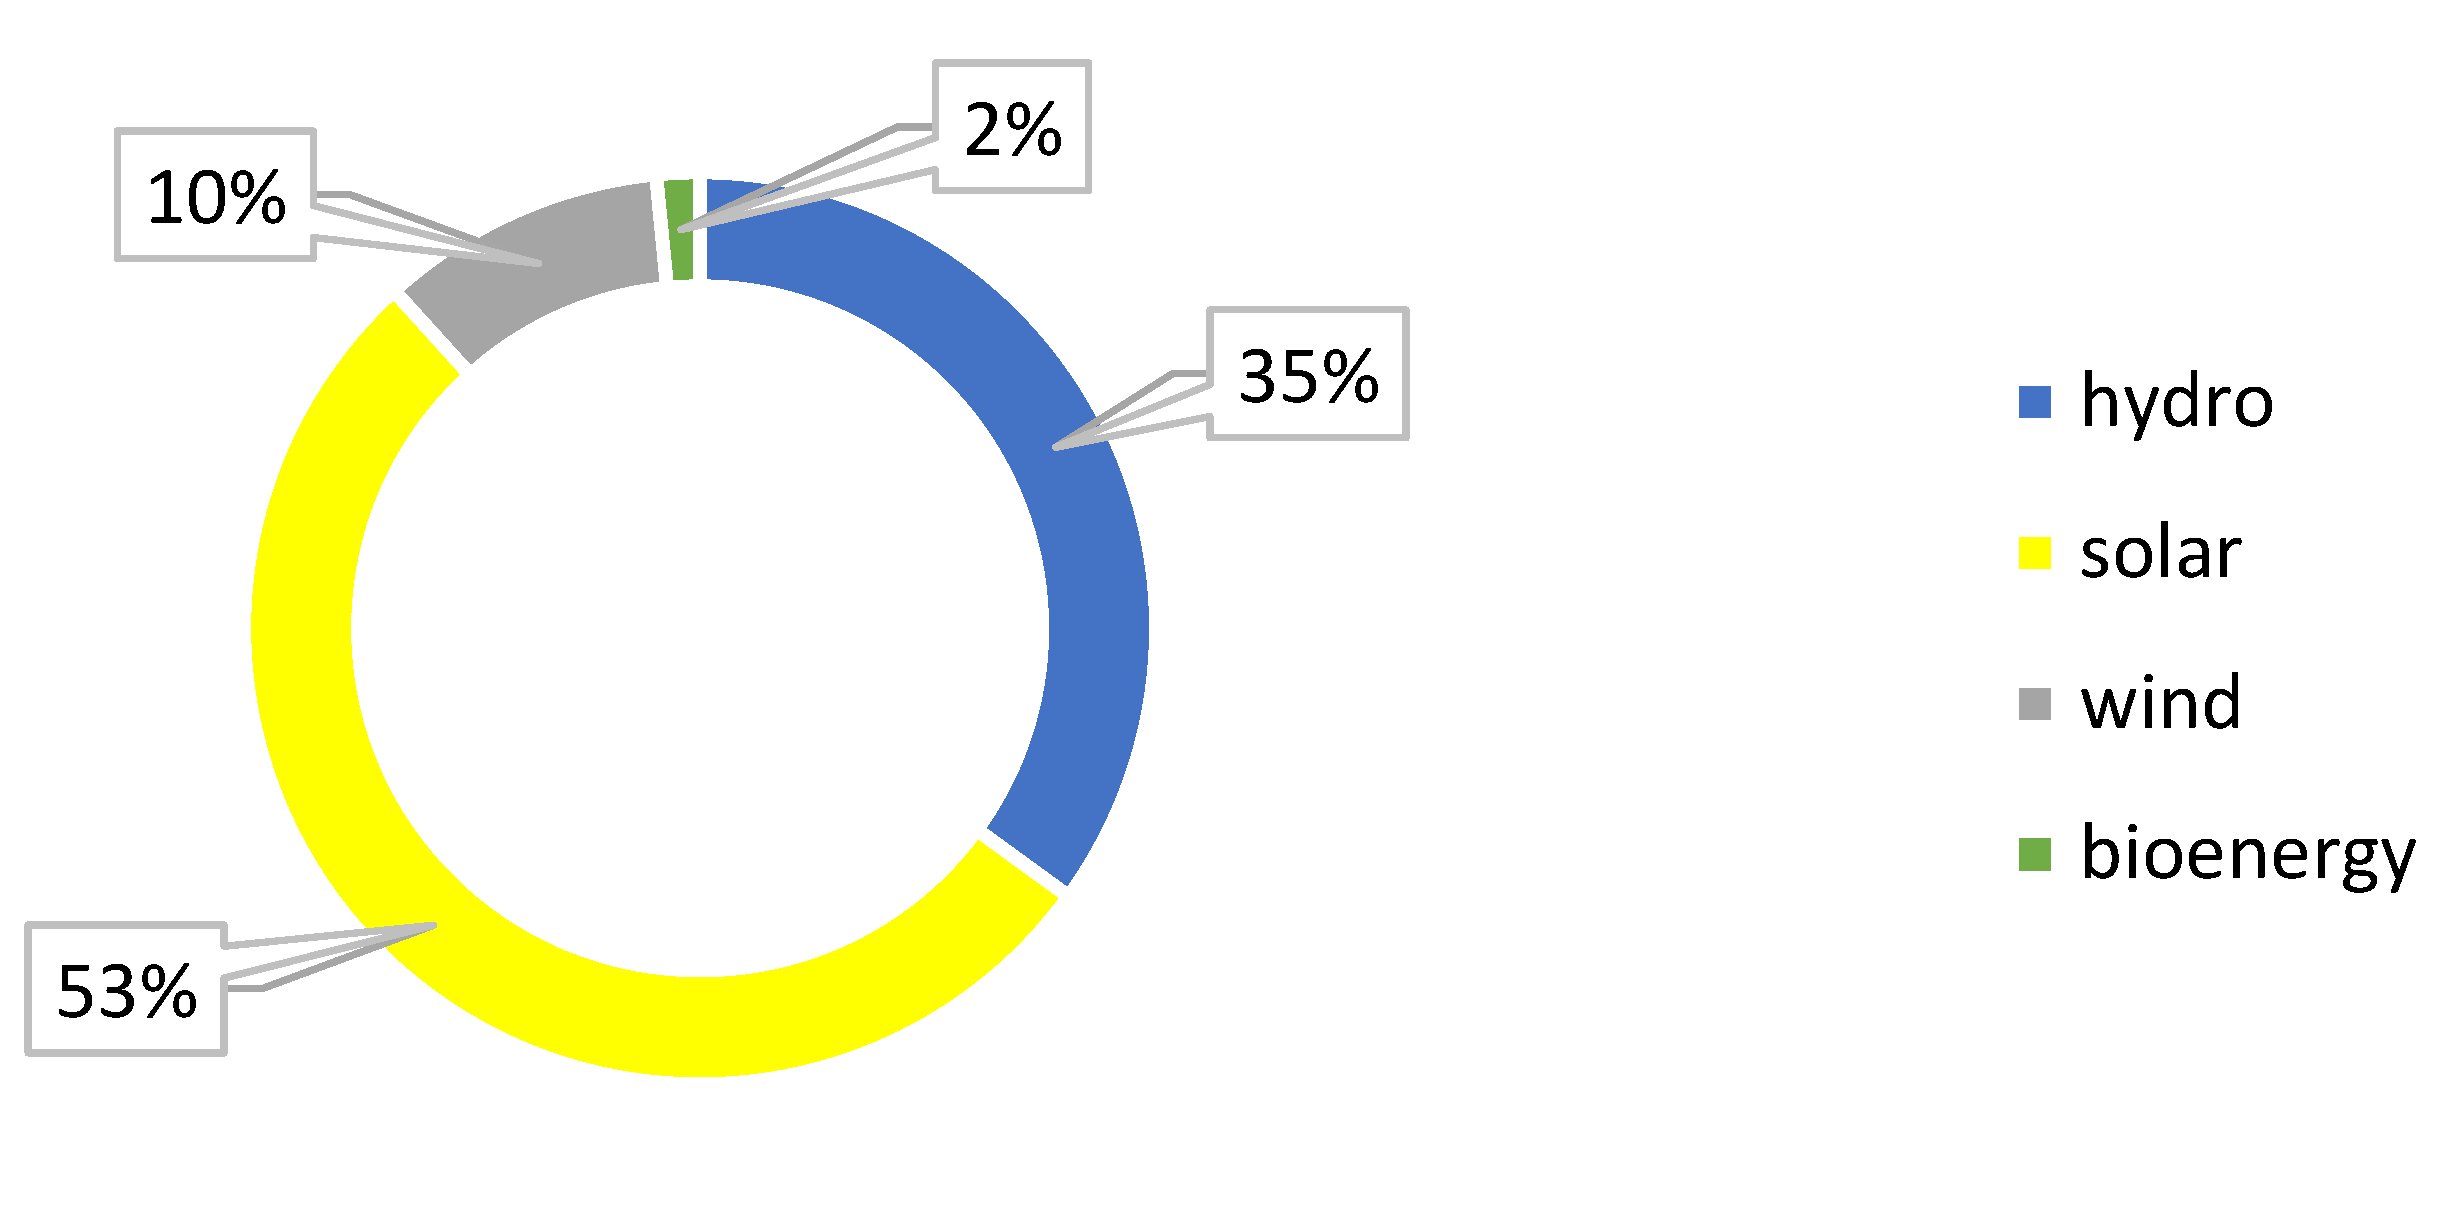
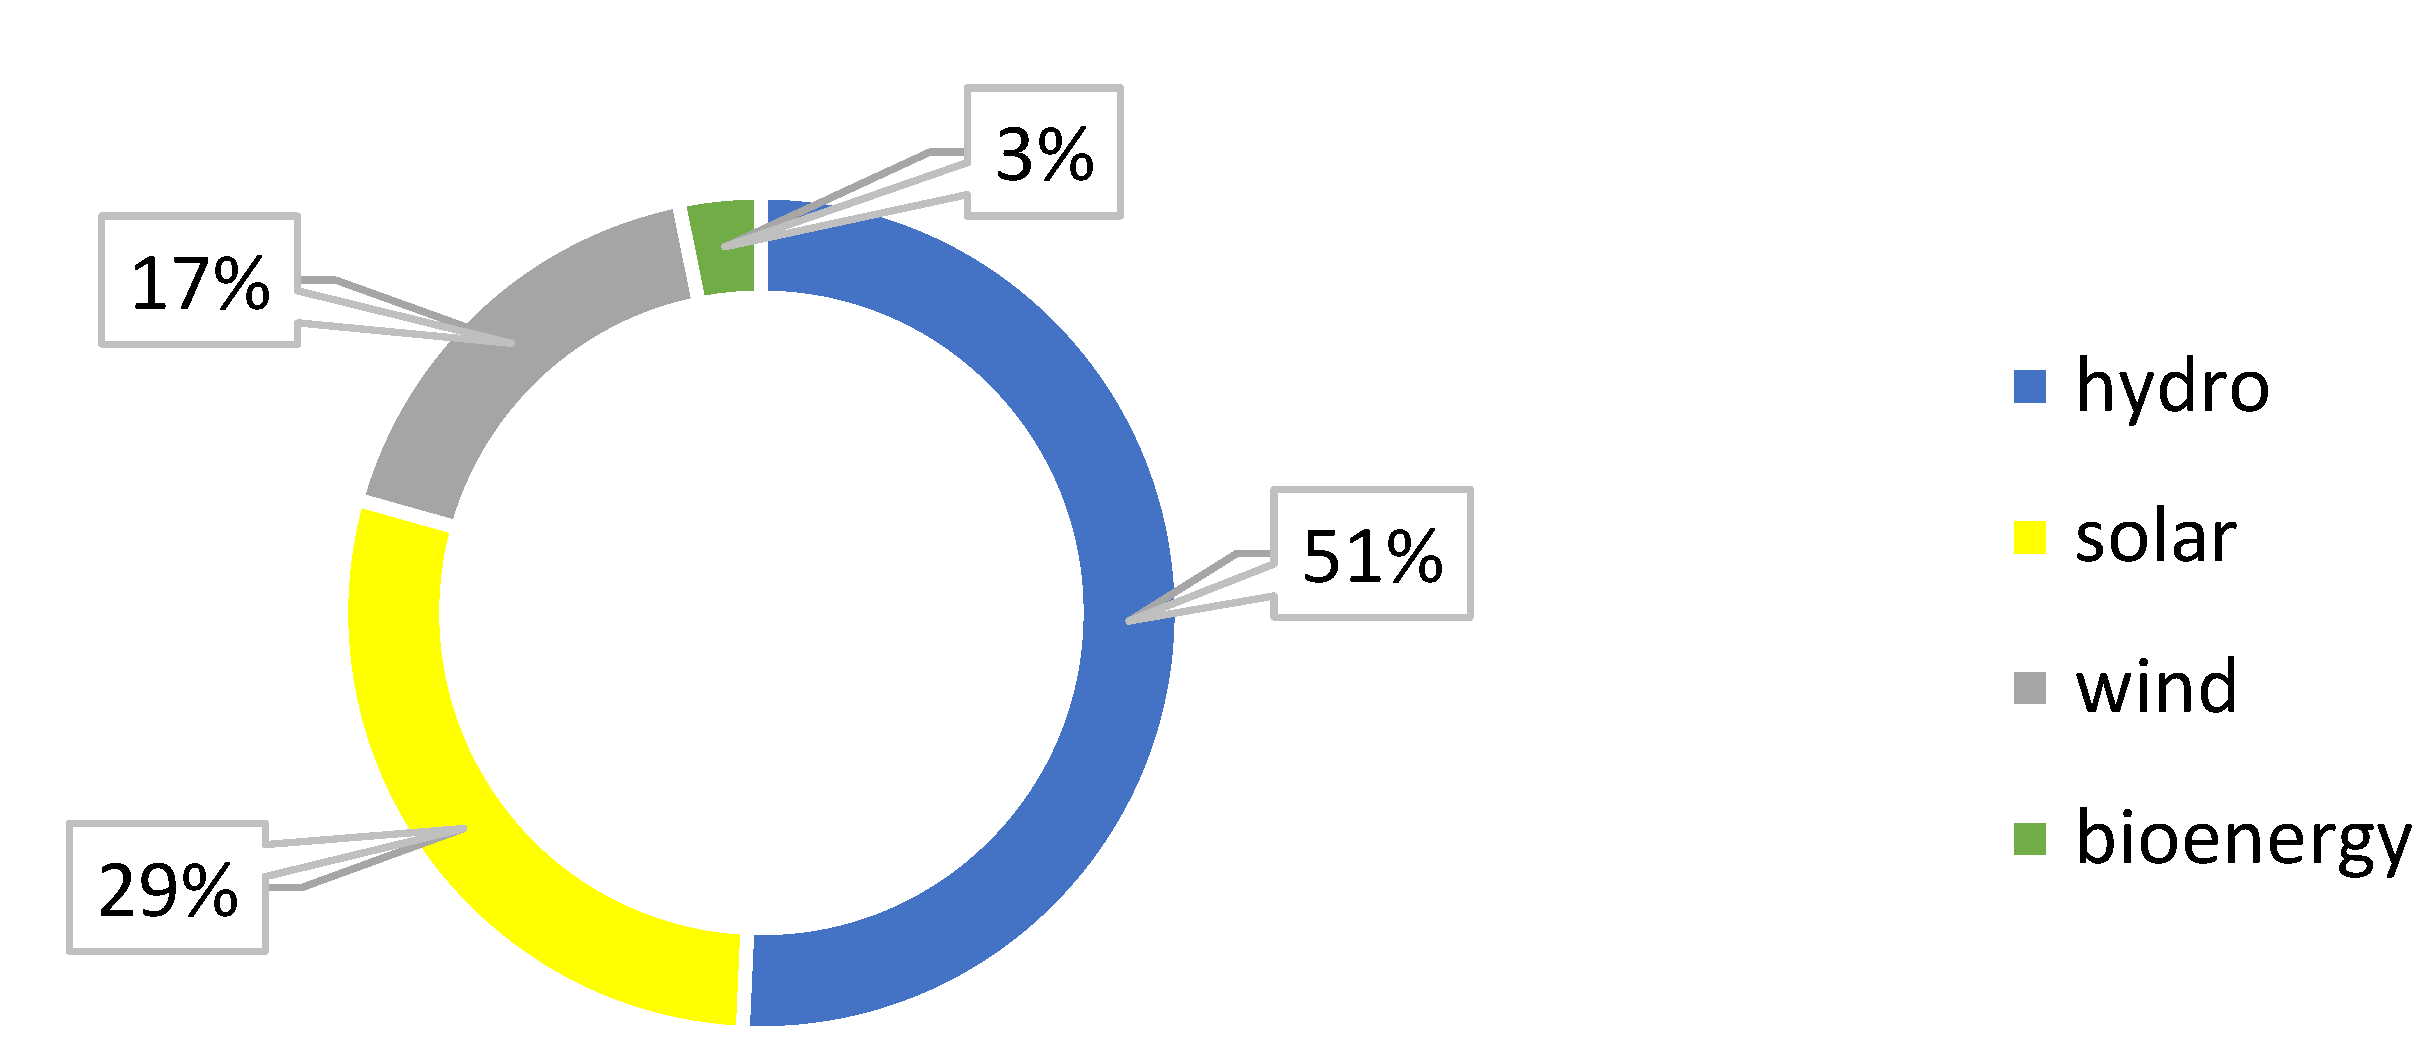
  • The analysis of the actual status of power generation, including renewables;
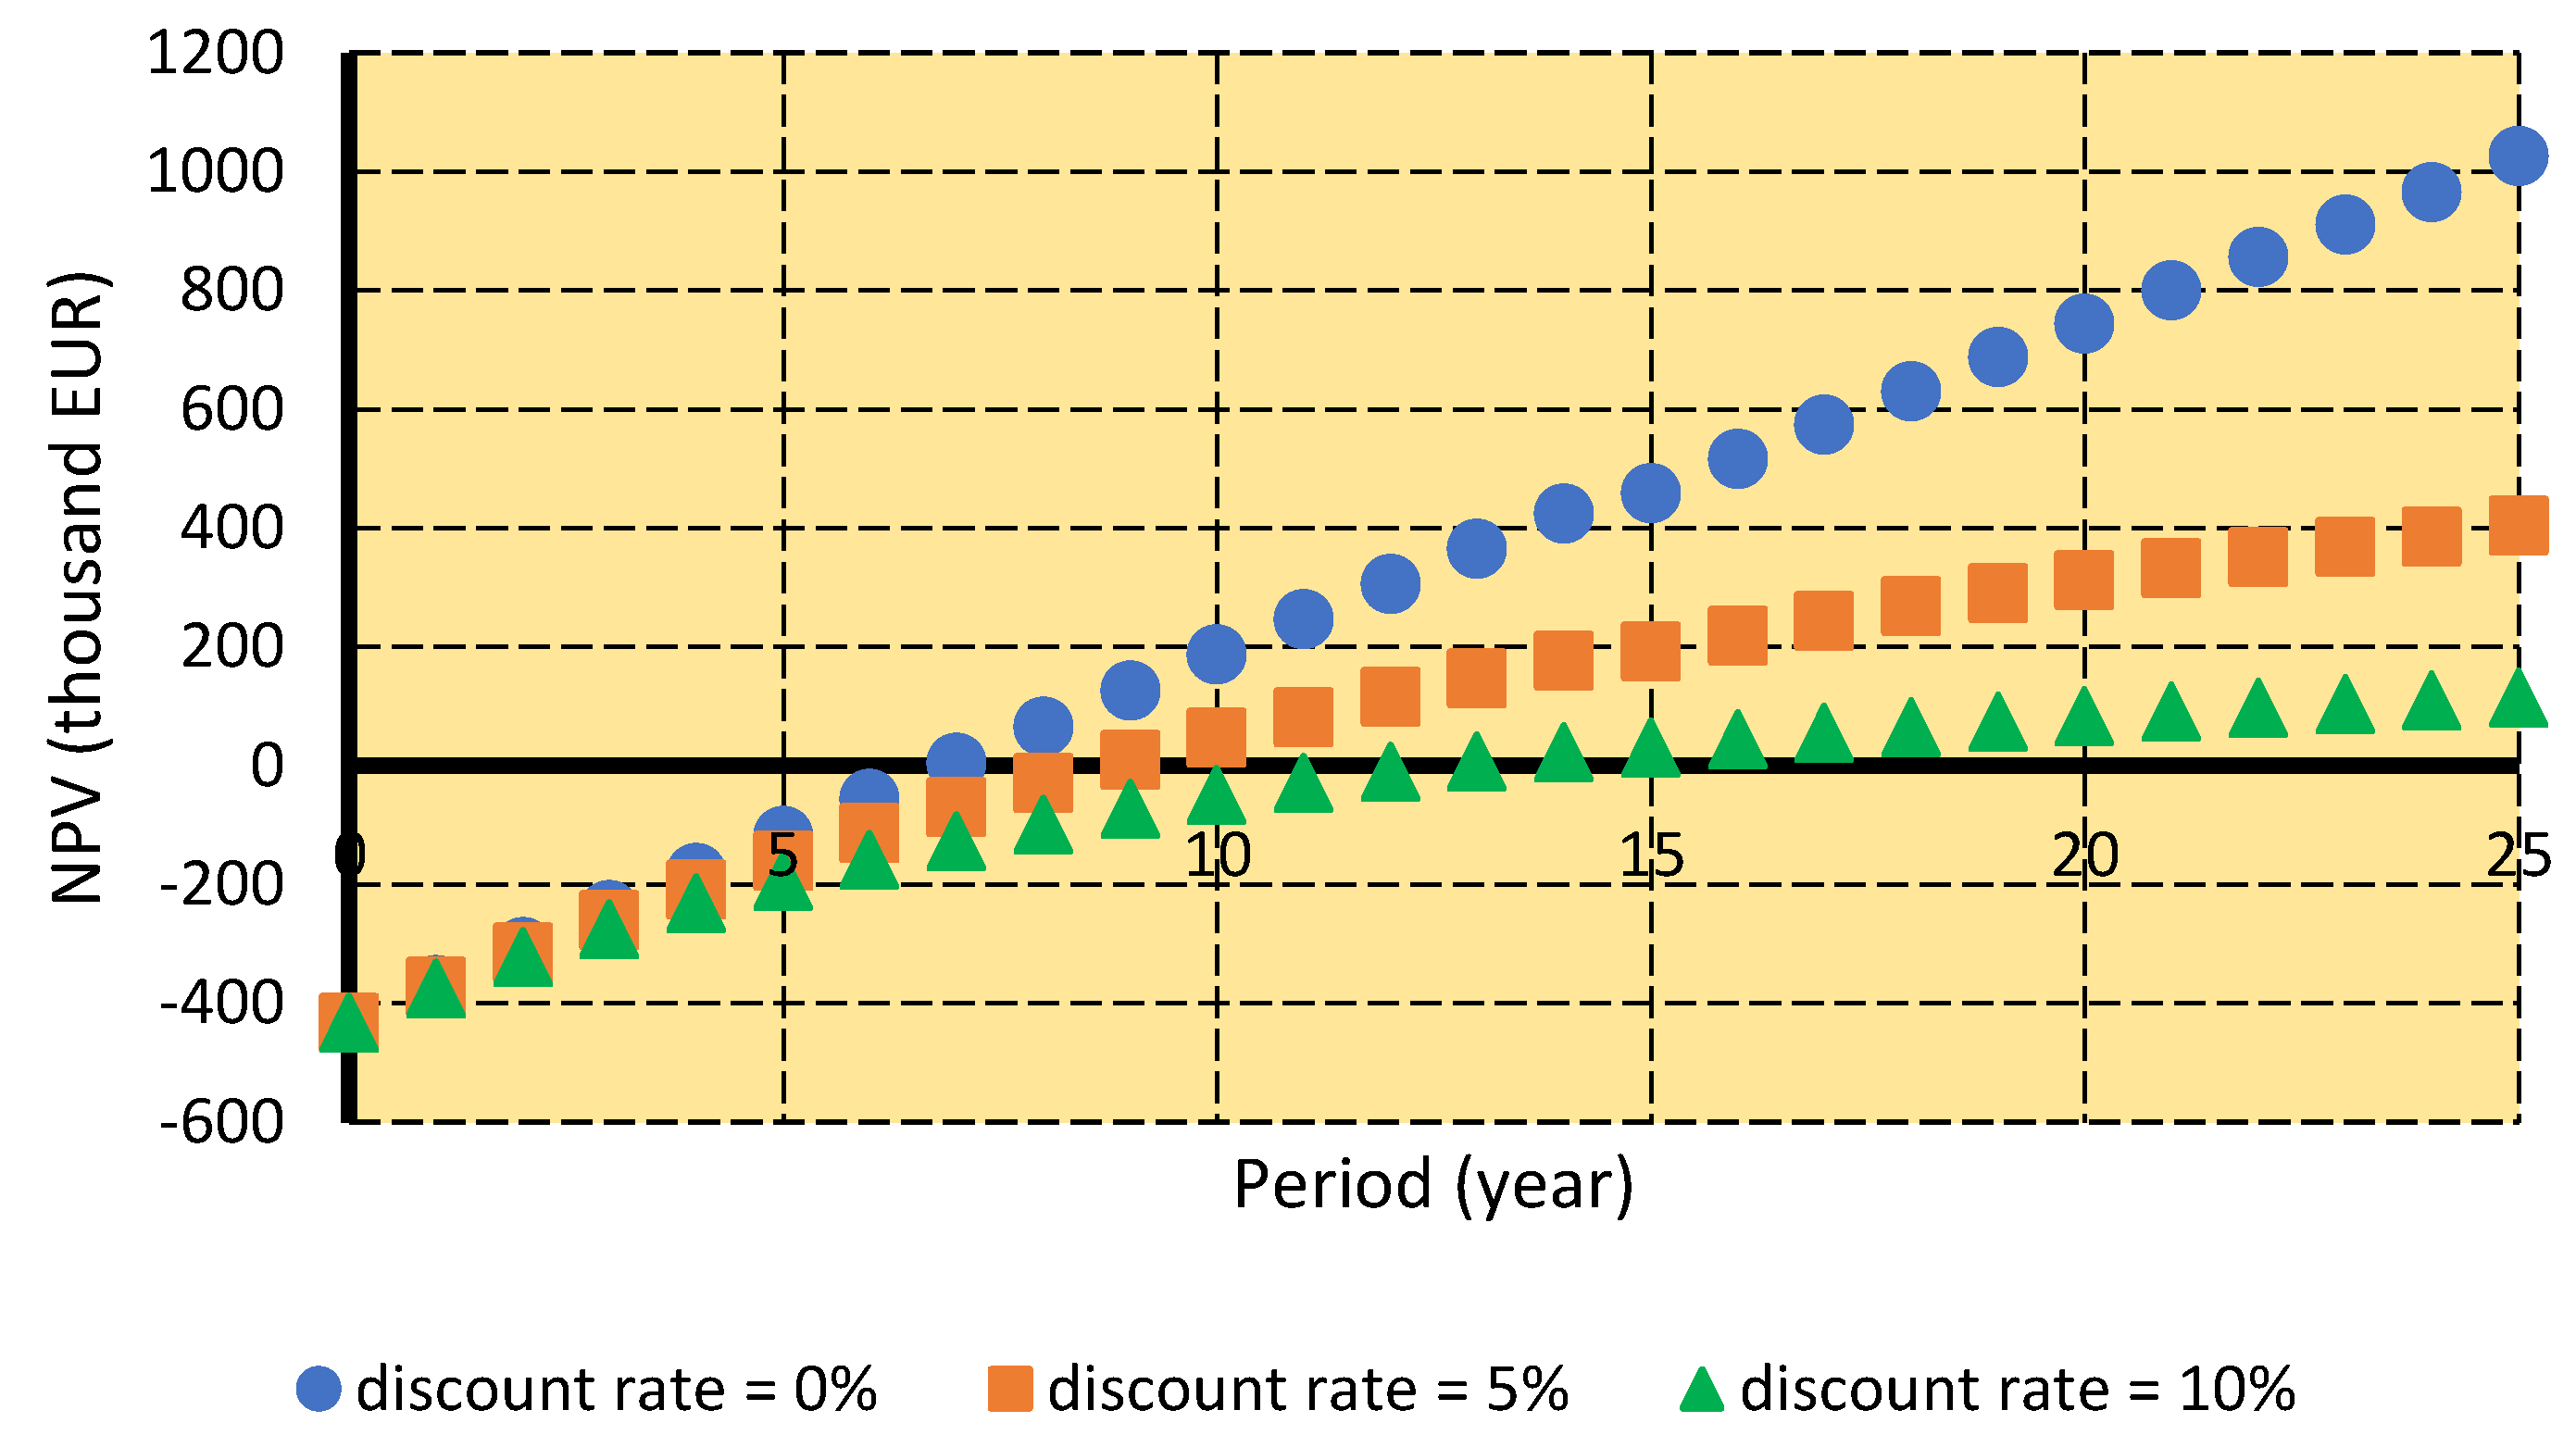
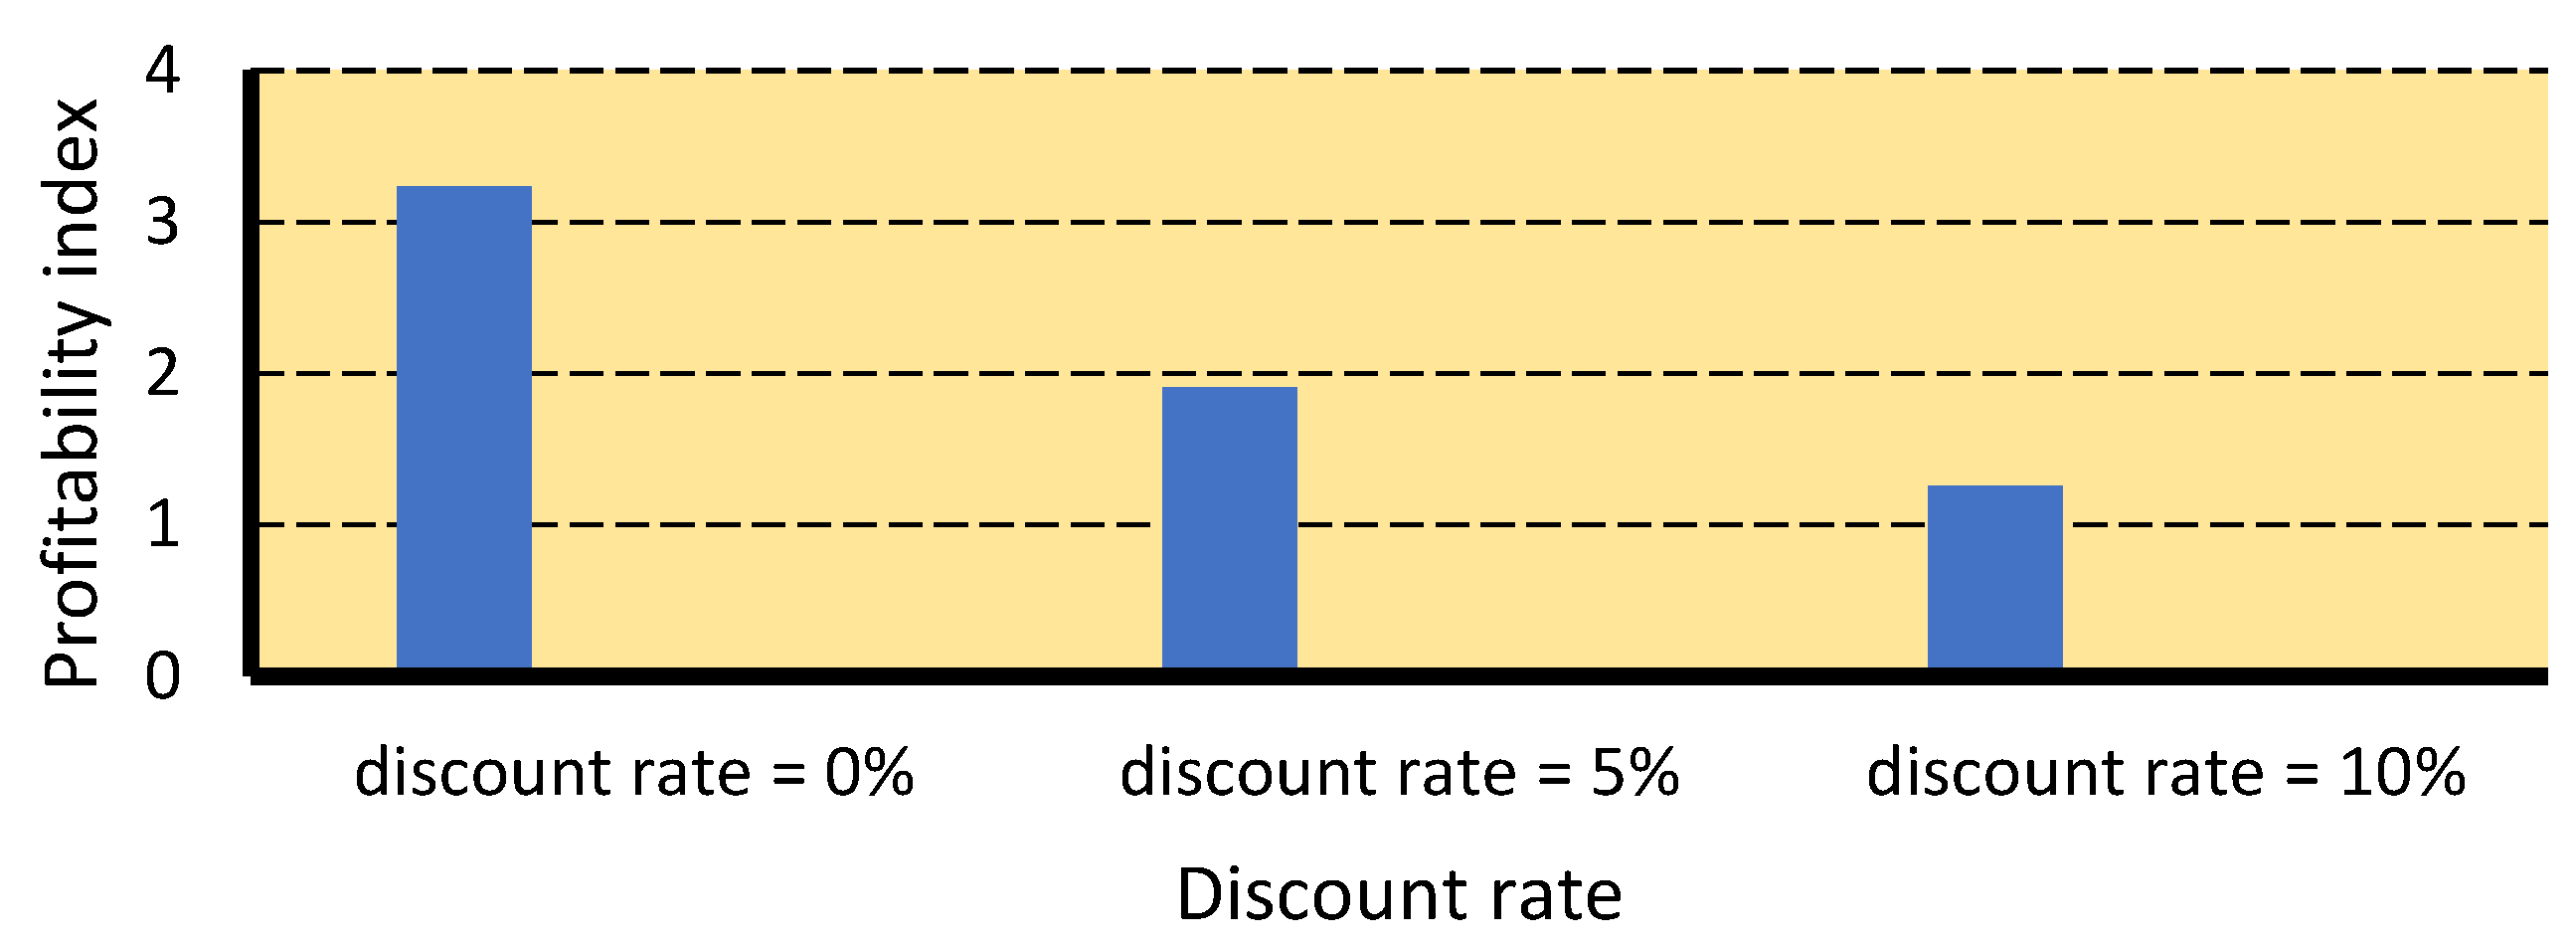
  • The assessing of the net present value and the profitability index of PV plants;
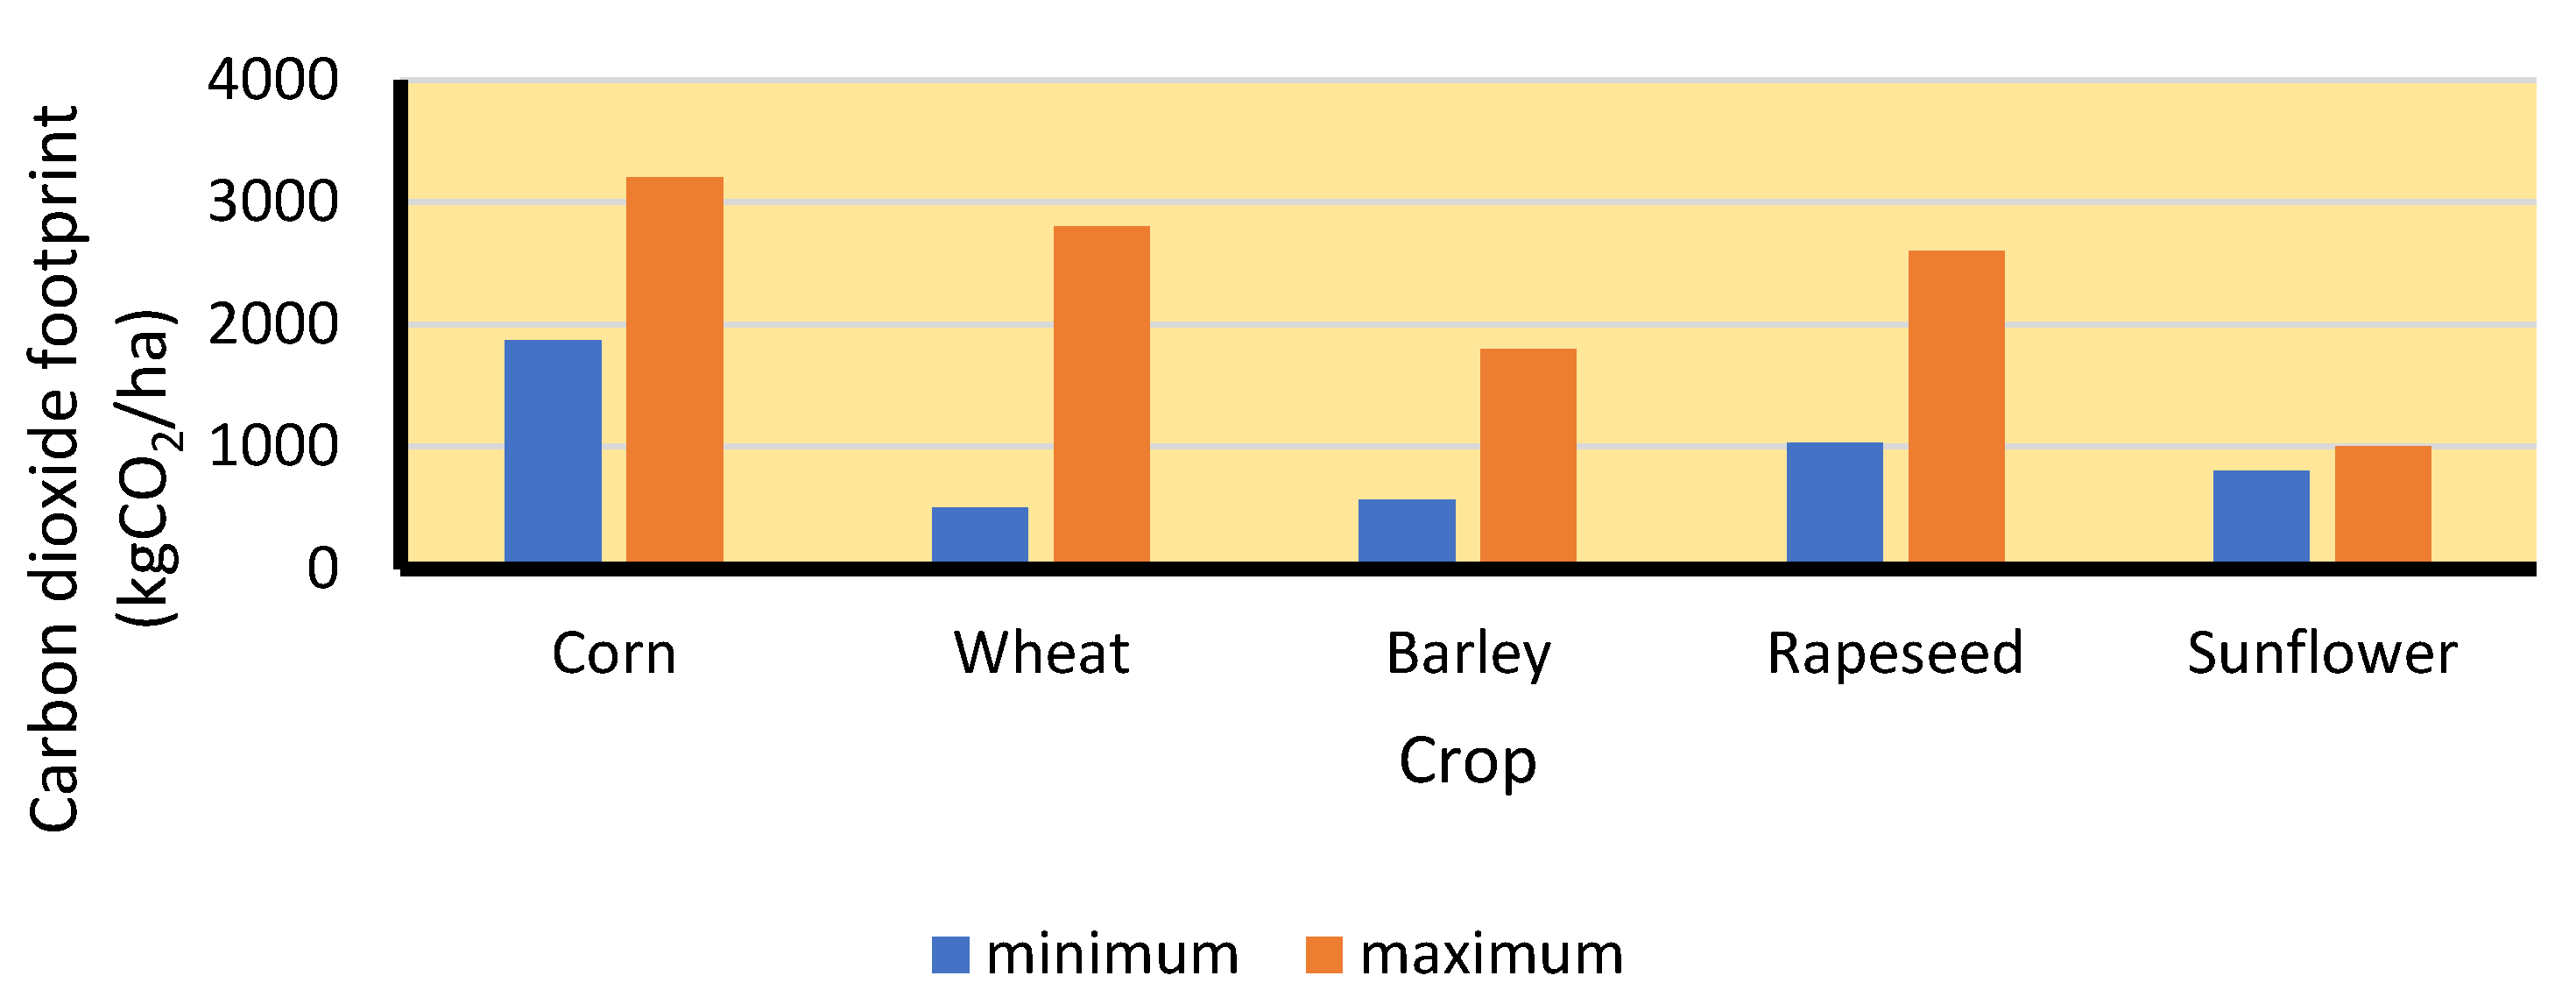
  • The calculation of the carbon dioxide footprint of crop production and solar power generation;
  • The carrying out of the sensitivity analysis of a PV project.
Farmers and policymakers can use the results obtained for economic and environmental analyzes of solar power plants. This study is intended to compare crop production versus PV electricity generation.

2. Materials and Methods

This study is based on the State Statistics Service of Ukraine, reports, research papers, actual prices, personal communication with stakeholders, etc. A semi-arid zone in the South of Ukraine (Mykolaiv province) is the subject of research.
The current study comprises seven steps (Figure 1). In the first step, we analyzed climate and weather conditions. We paid attention to precipitation, air temperature, wind, and solar radiation. In the second step, the power generation and the status of photovoltaics in Ukraine were analyzed. The third step was devoted to an analysis of crop growing. We used such indicators as crop yield and a crop rotation factor. In the fourth step, gross annual income from crop production was determined. Crop yields, crop rotation factors, and market prices were taken into account. In the fifth step, the profitability of a PV plant was estimated. We used the following indicators: net present value (NPV) and profitability index (PI). We factored in the feed-in tariff as the current support mechanism. In the sixth step, carbon dioxide emission savings were estimated. Finally, the sensitivity analysis of a PV plant was carried out.

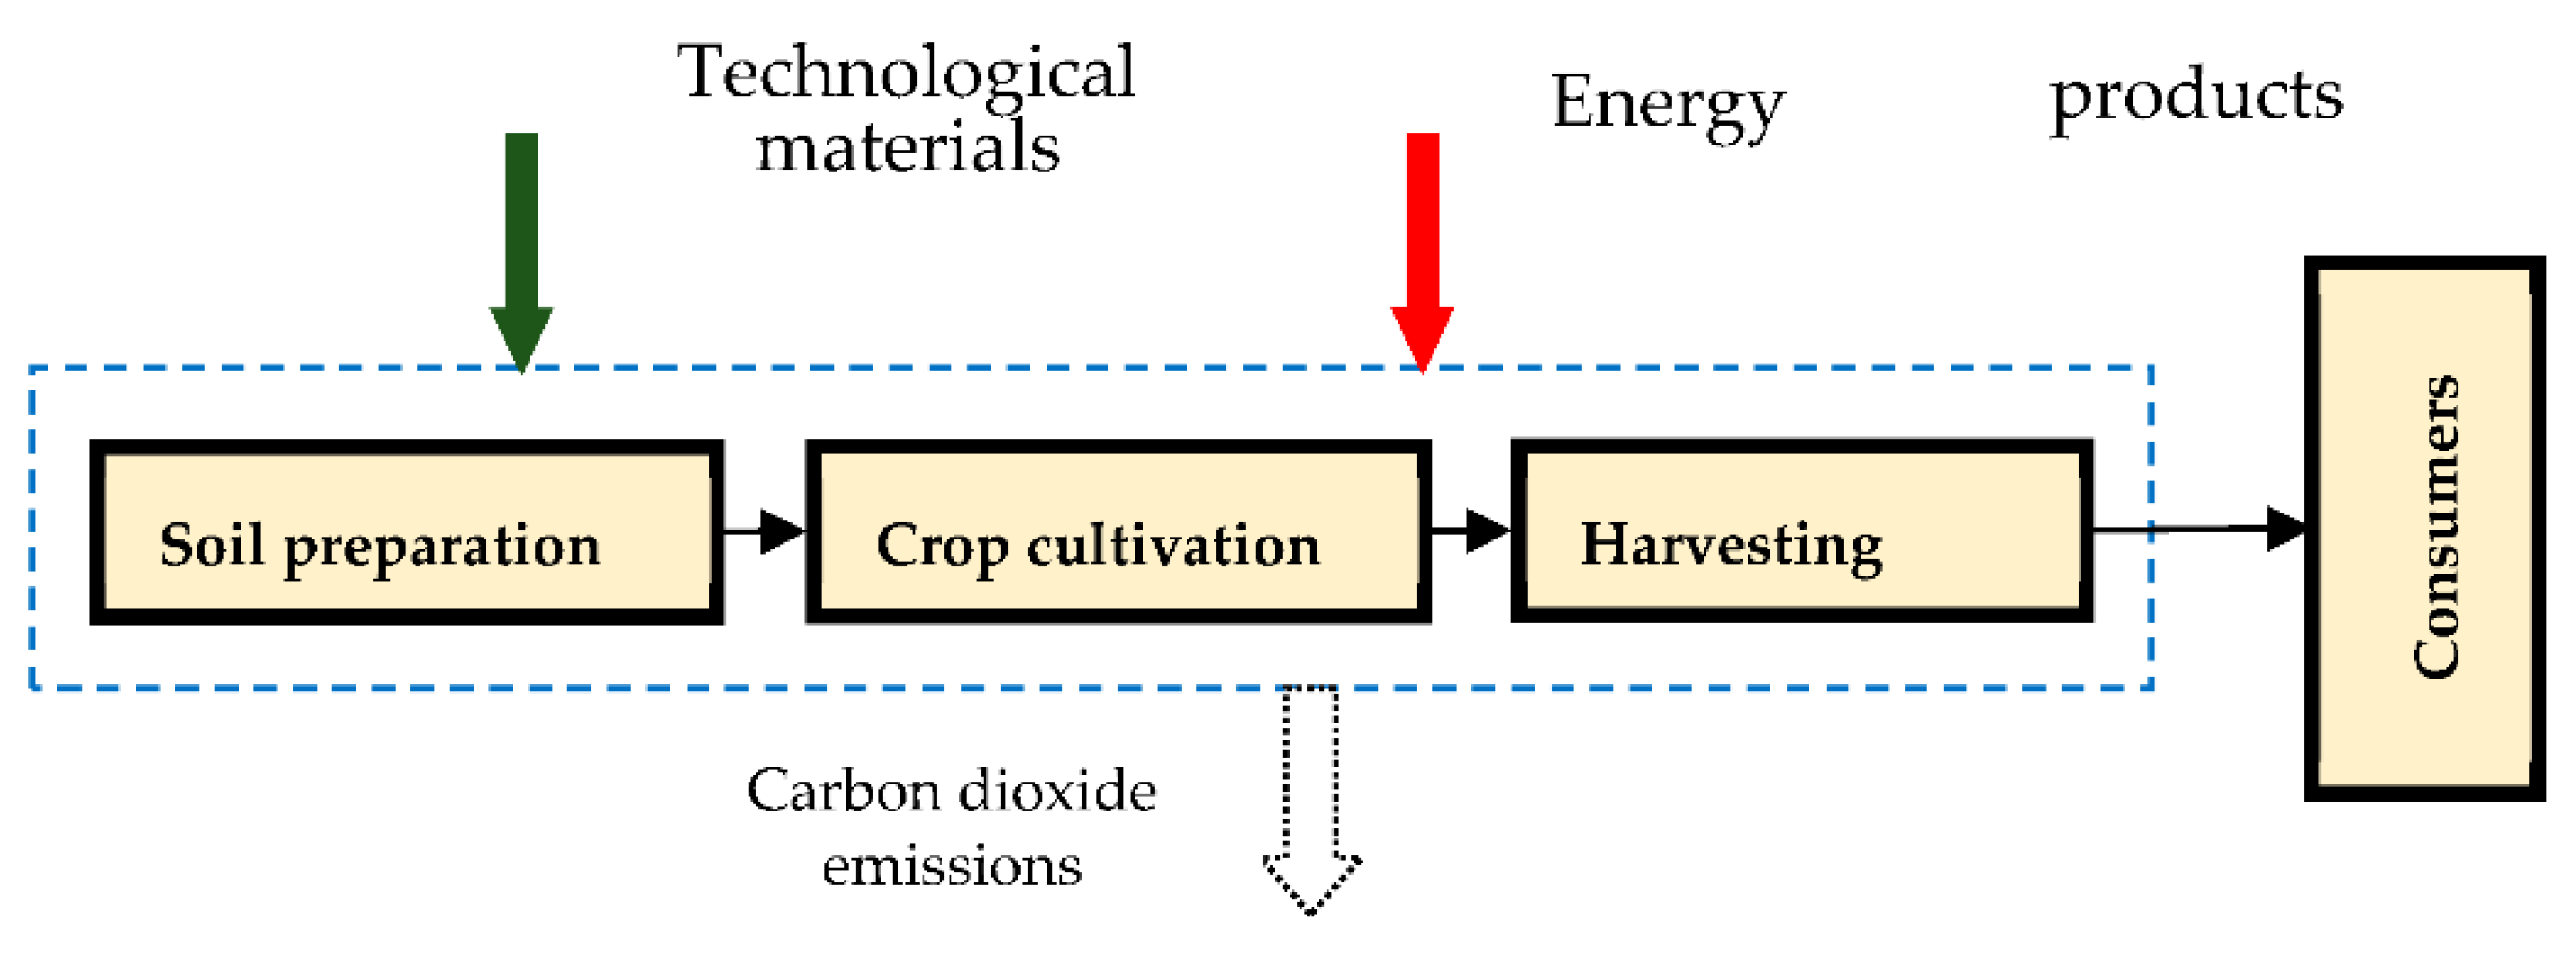
2.1. System Boundary

Crop production comprises many technological processes such as soil preparation, sowing, fertilization, crop protection, etc. These processes require technological materials and energy (diesel fuel, electricity, petrol, etc.). Direct and indirect carbon dioxide emissions were taken into account in this study (Figure 2). The boundary system for photovoltaics comprises two subsystems: the environmental system and the PV system (Figure 3). The PV system includes three main phases: manufacturing and construction, operation and maintenance, and dismantling. The environmental system was used to find carbon dioxide emissions savings.

2.2. Economic Indicators

The investment costs in a PV power plant include several components such as PV modules, inverters, cabling, transformers, mounting, and power management devices. In our case, since farmers use their own land, land availability is not a problem. Thus, land costs are discarded. The lifetime of PV modules is expected to be 25 years. Inverters have a lifetime of 10–15 years. Their anticipated time of replacement is 15 years [47].
Savage value is the worth of a PV plant after the completion of its operation. It depends on each PV panel weight, used panel price, and the number of panels [47].
S V = N P W T P P p r 1000 ( 1 + 0.01 d ) L T ,
where NP is the number of PV panels; WTP is the weight of PV panel, kg; Ppr is the used panel price, EUR/t; d is the discount rate, %; LT is the lifetime of the project, year.
The net present value is determined by the following equation [48]:
N P V = i = 0 L T ( B i O C i [ 1 + 0.01 d ] i ) I o I a [ 1 + 0.01 d ] L T R + S V ,   EUR ,
where Bi is the benefit in the ith year, EUR; OCi is the operating costs in the ith year, EUR; kg; Io is the initial investment costs, EUR; Ia is the replacement costs, EUR; LTR is the lifetime of replacement equipment (inverters), year.
The profitability index is equal to [49]
P I = i = 0 L T ( B i O C i [ 1 + 0.01 d ] i ) I o + I a [ 1 + 0.01 d ] L T R S V .
The payback period is found from the condition that NPV = 0
N P V = 0 = { i = 0 P B P ( B i O C i [ 1 + 0.01 d ] i ) I o i f   P B P   <   L T R i = 0 P B P ( B i O C i [ 1 + 0.01 d ] i ) I o I a [ 1 + 0.01 d ] L T R i f   P B P   >   L T R ,
where PBP is the payback period, year.

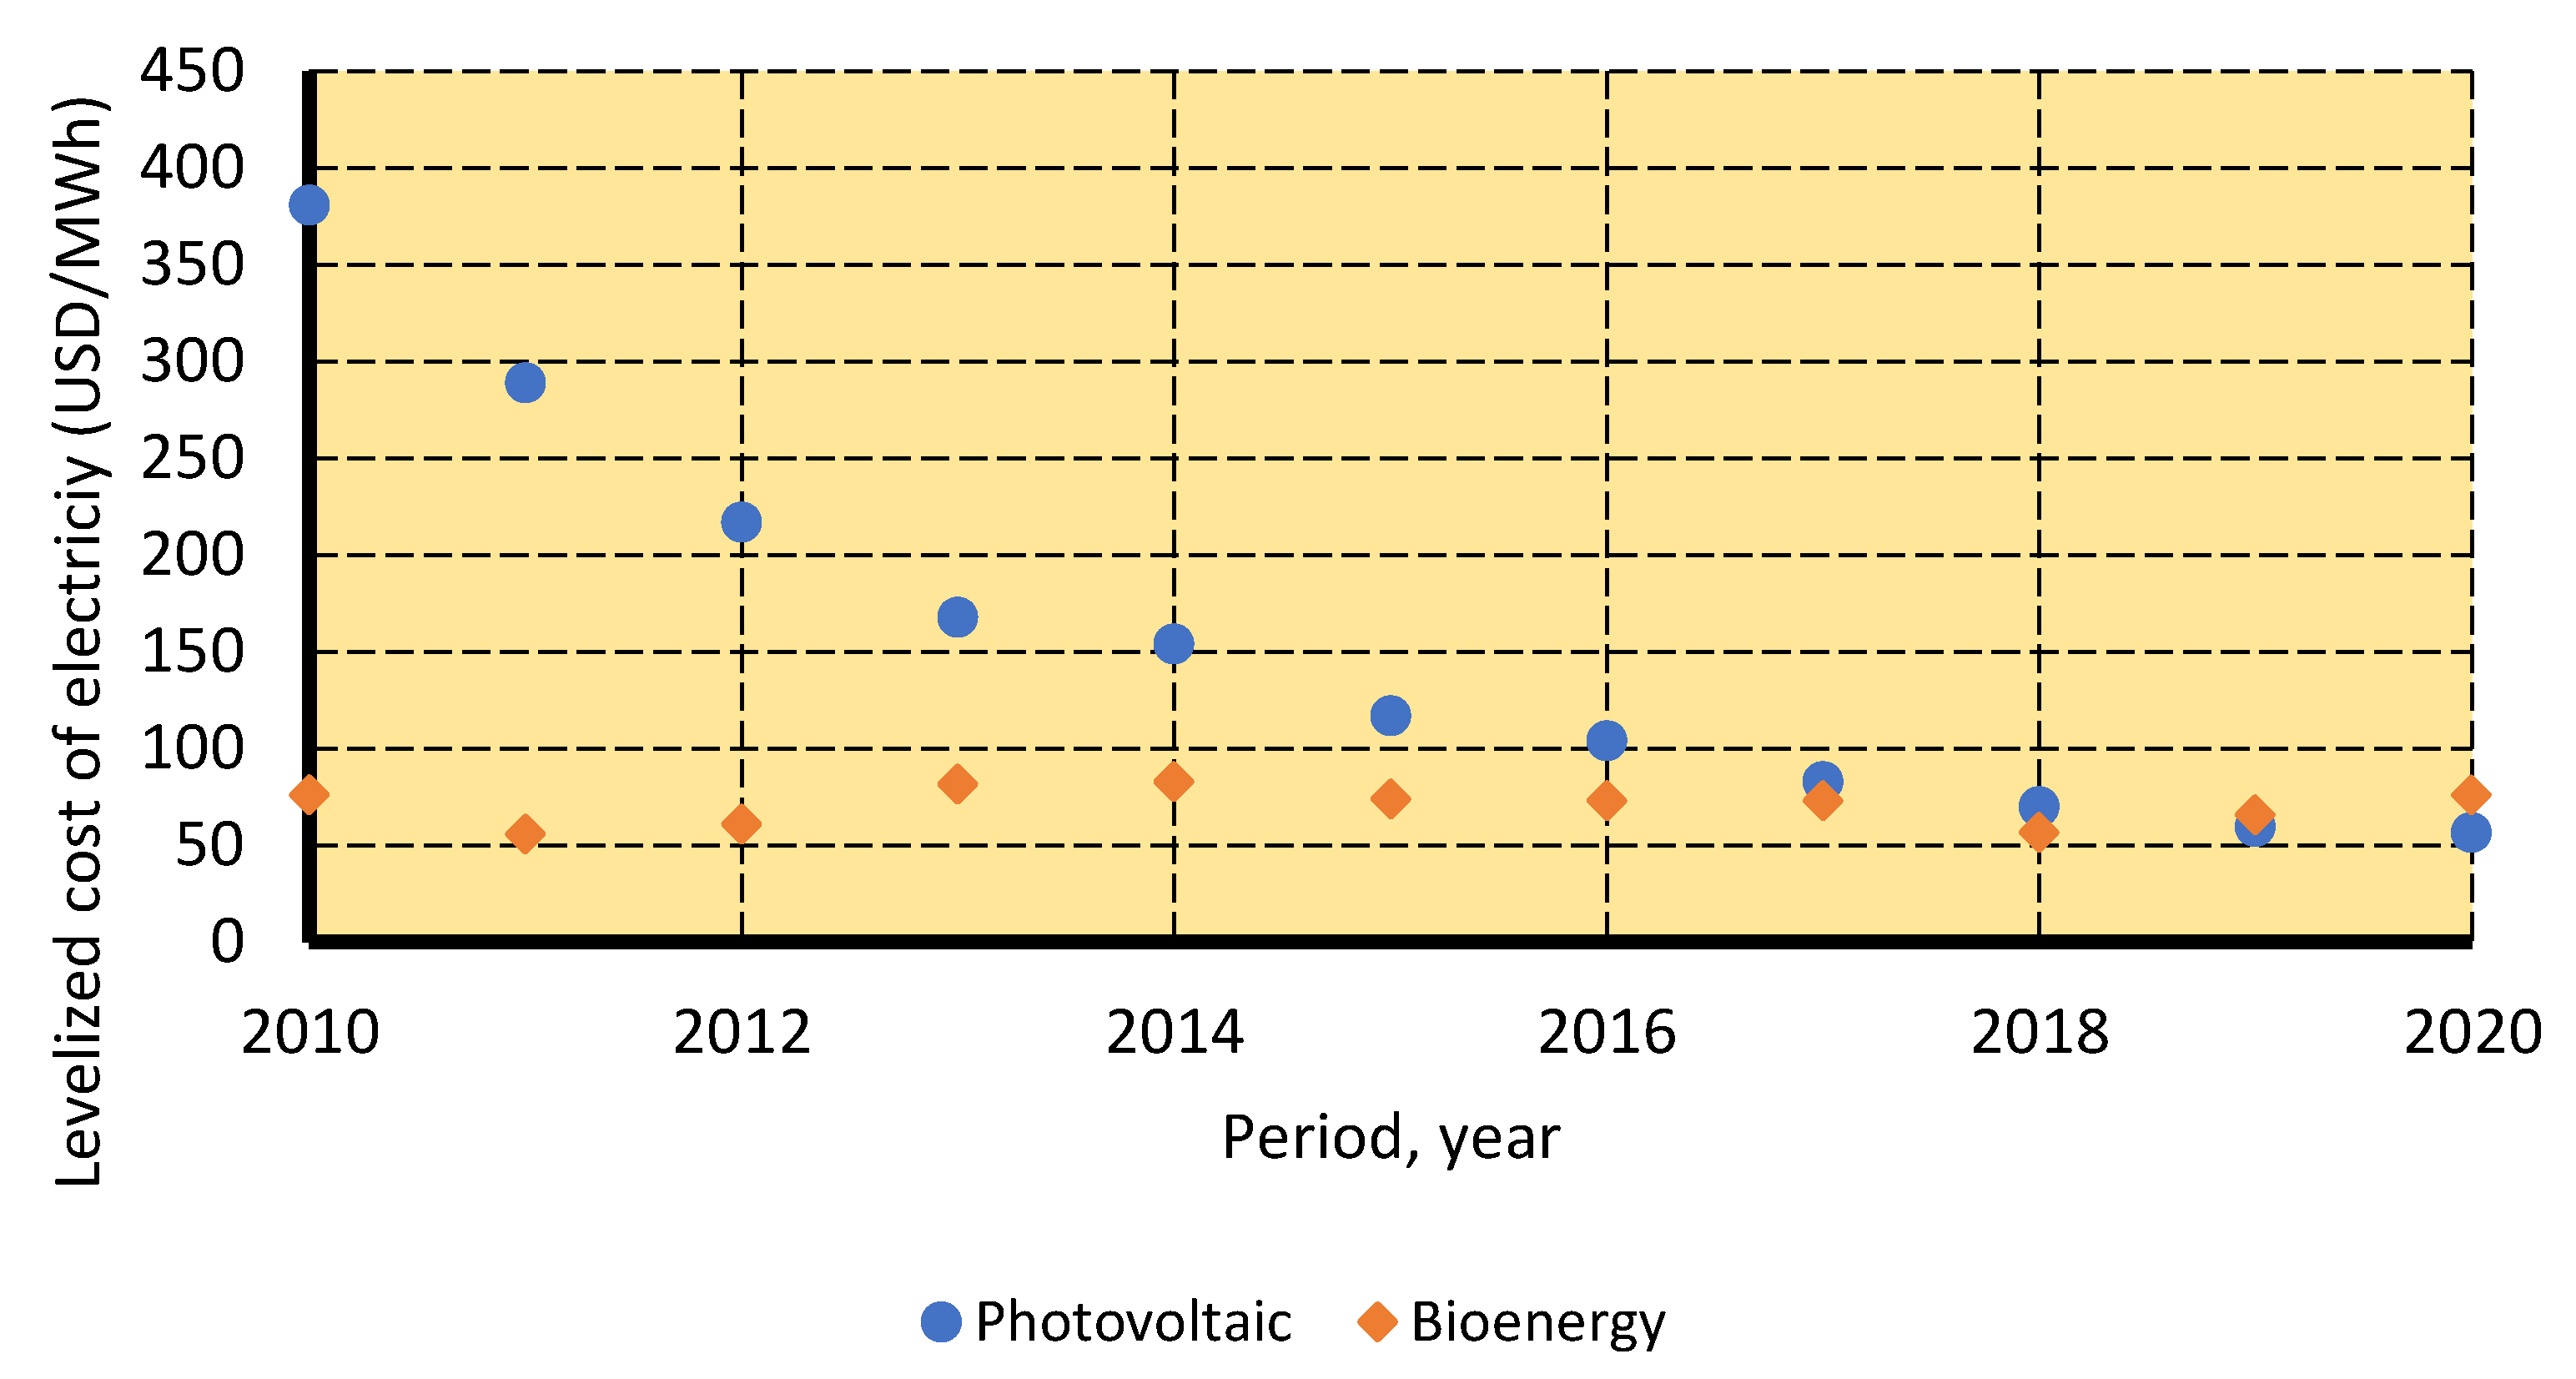
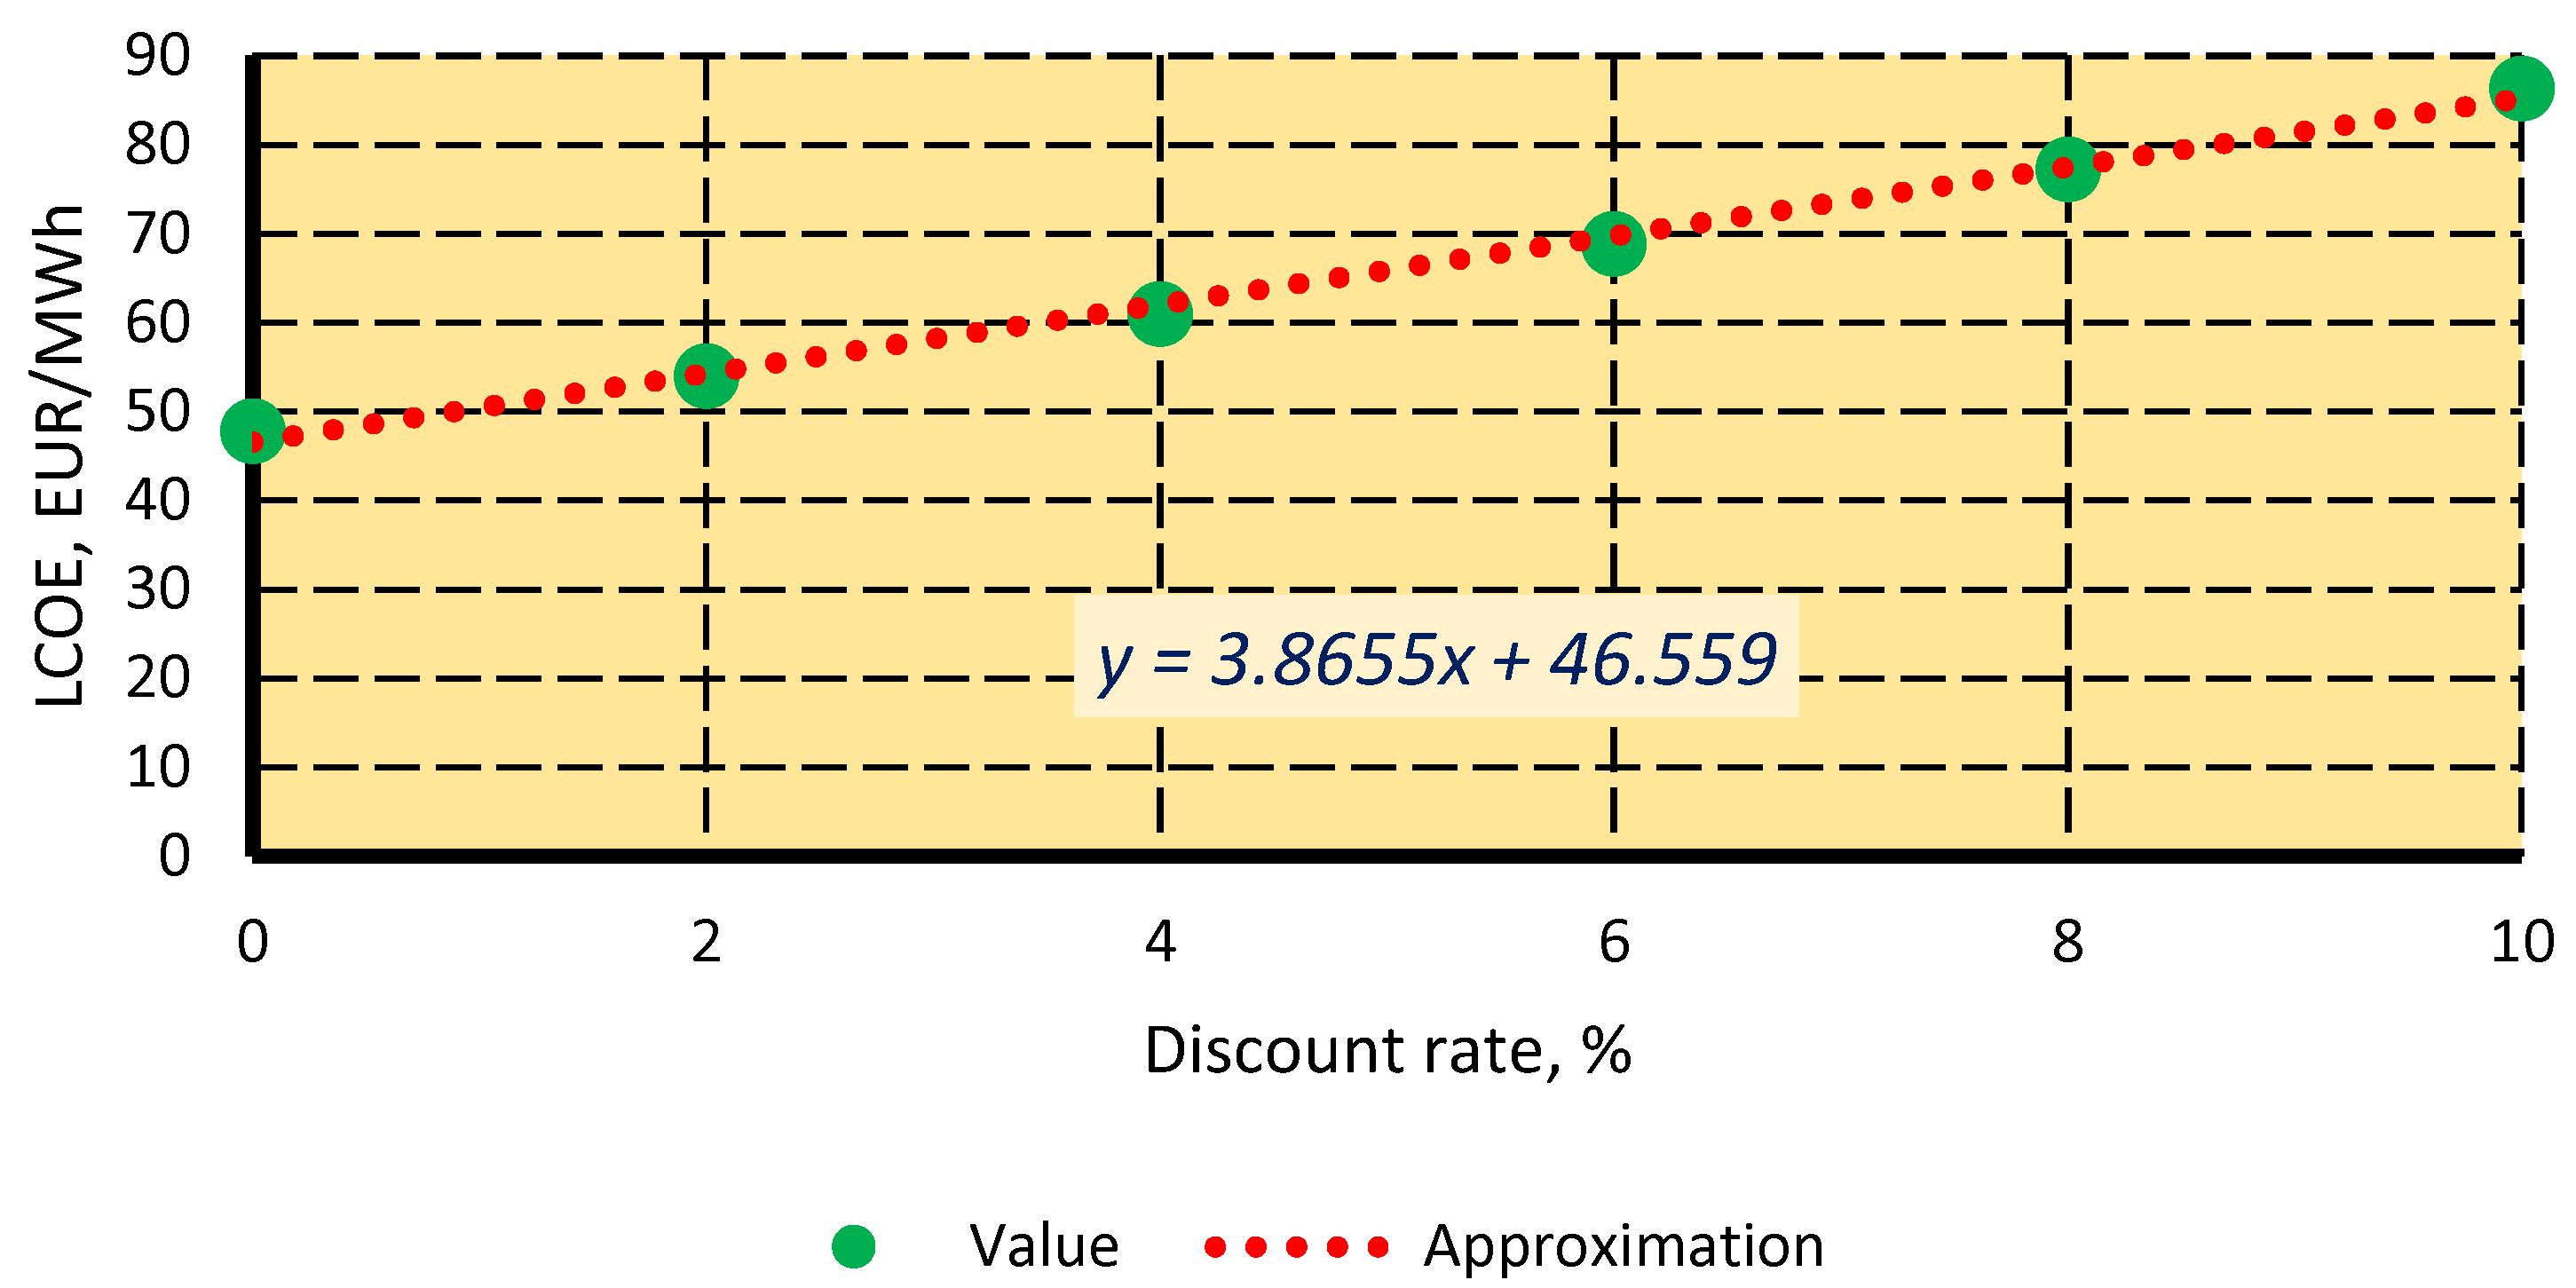
2.3. Levelized Cost of Electricity

In this study, we determined the levelized cost of electricity (LCOE). LCOE is a function of several variables such as investment costs, a discount rate, amount of electricity generated, lifetime, etc. [50]:
L C O E = I o + i = 1 L T A C i ( 1 + 0.01 d ) i i = 1 L T W i ( 1 + 0.01 d ) i ,   EUR / kWh ,
where Wi is the electricity generated by a PV plant in the ith year, kWh; ACi is the costs in the ith year, EUR.
The solar cell efficiency is a function of ambient temperature, the reference temperature, and the cell efficiency at the reference temperature [51]
η = η 0 [ 1 β ( T a T r ) ] ,  
where η0 is the cell efficiency at the reference temperature; β is the solar radiation coefficient; Ta is the ambient temperature, K; Tr is the reference temperature, K.
Annual electricity generation is [52,53]
W i = 0.001 l = 1 365 ( S R l η A P V 24 ) ,   kWh ,
where SRl is the solar irradiation hitting the PV system on the lth day, W/m2; ARV is the area of the PV system, m2.

2.4. Carbon Dioxide Emissions

The substitution of fossil fuels used by conventional power plants results in carbon dioxide savings. They can be calculated by the formula [54,55]:
C D E S = W E F e ,   kg   CO 2 / ha ,
where W is the electricity generated by a PV plant, kWh; EFe is the emission factor of conventional power generation, kg CO2/kWh.

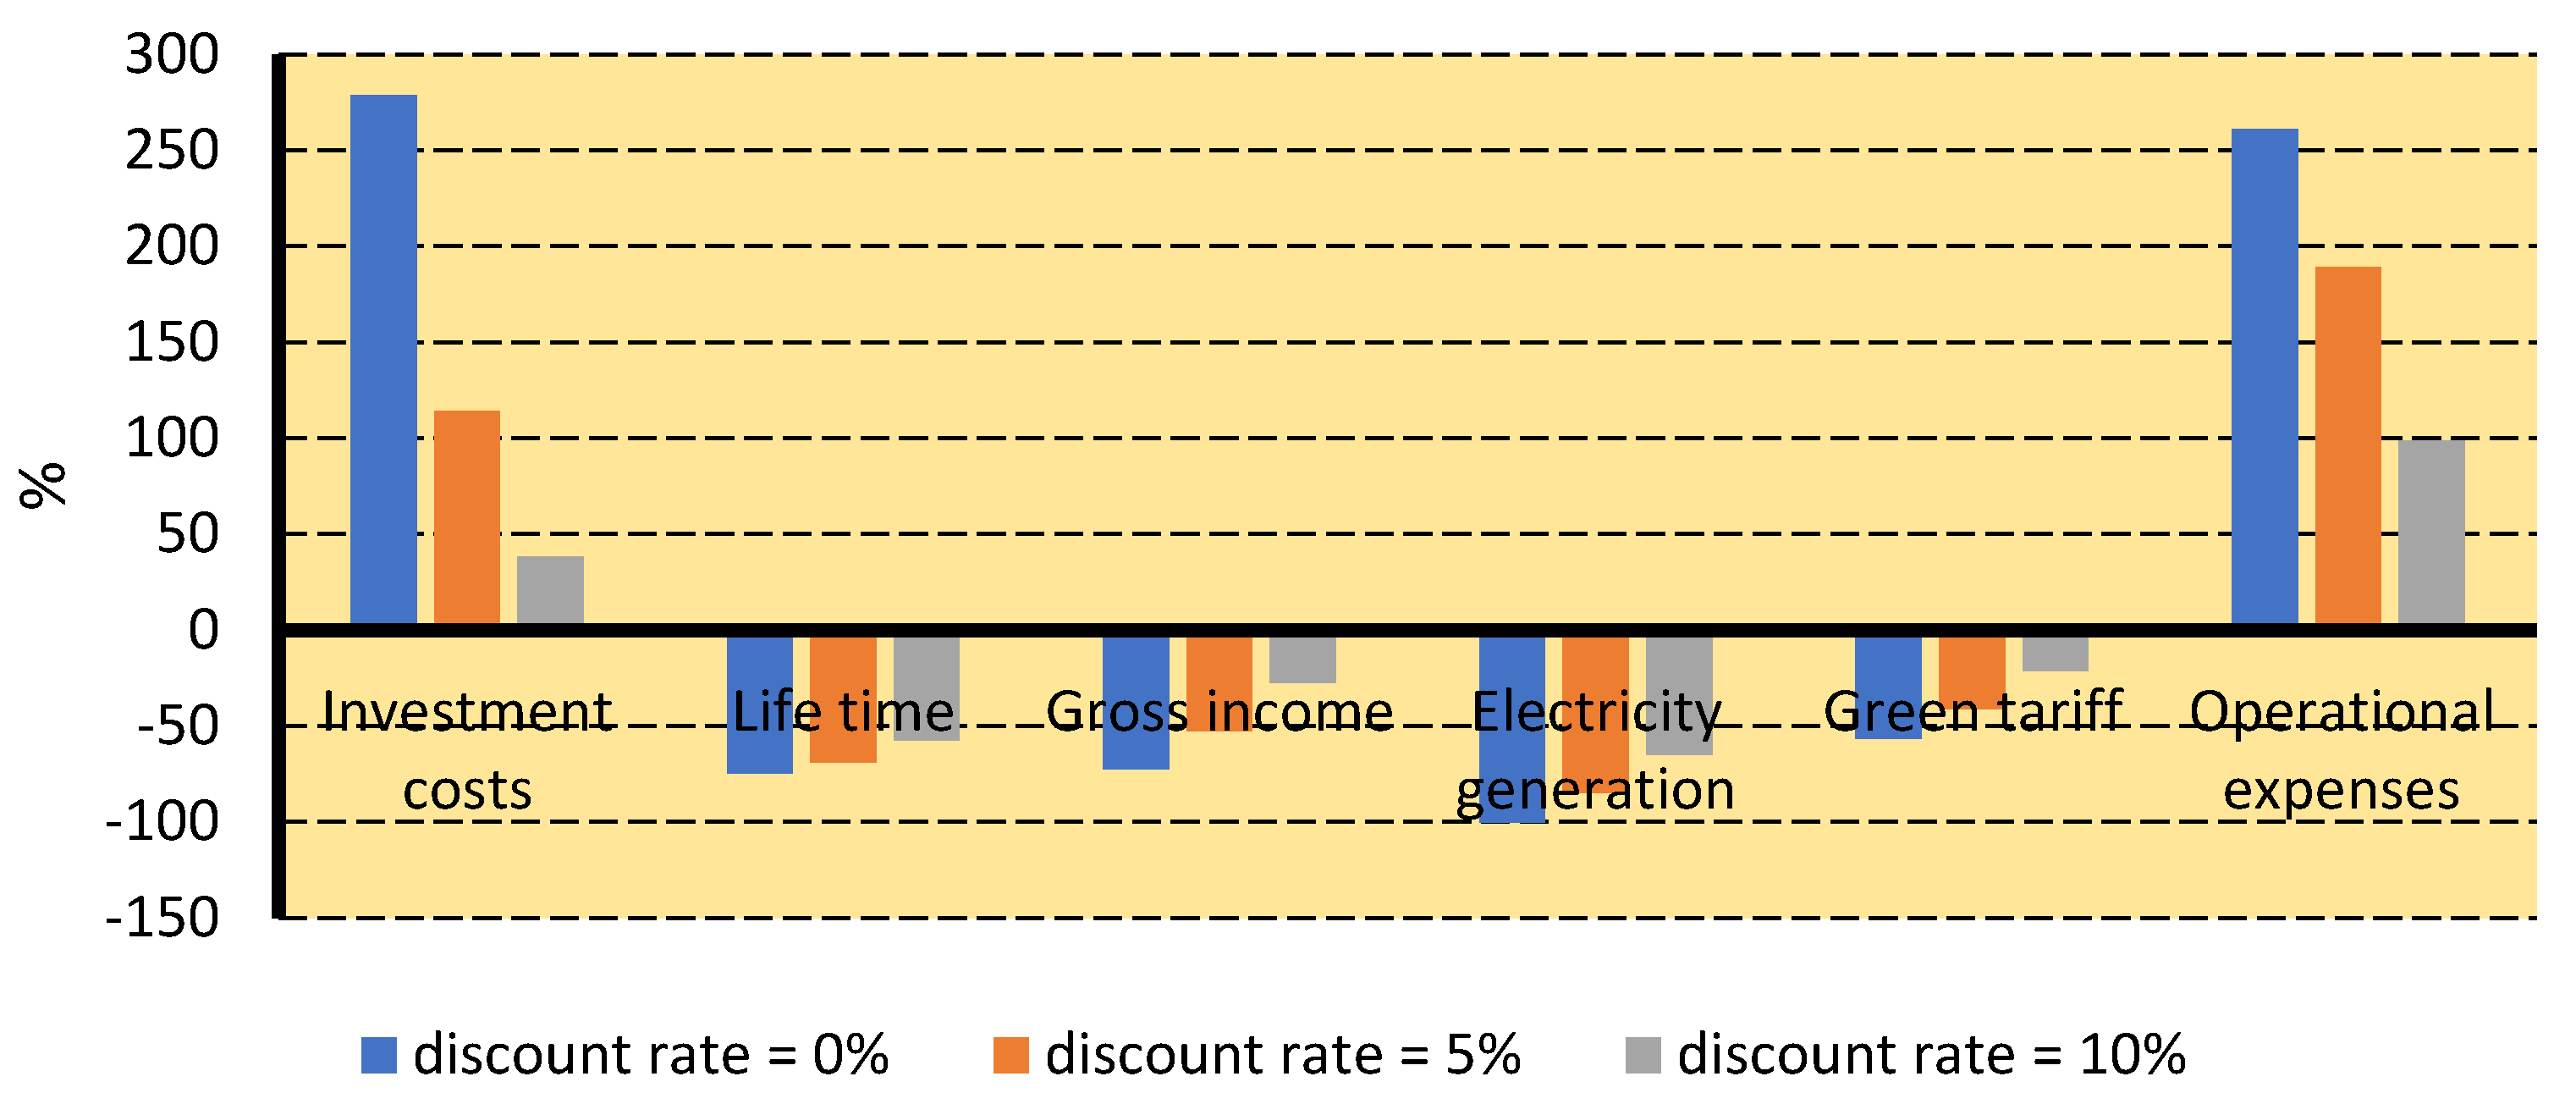
2.5. Sensitivity Analysis

The purpose of sensitivity analysis is to investigate the impact of changes in key variables on the viability of a project. The Profitability Index (PI) is assumed as a financial criterion. The sensitivity analysis procedure comprises the following steps [47,56,57]:
  • The identification of key variables;
  • The determination of their switching values;
  • The identification of crucial variables.
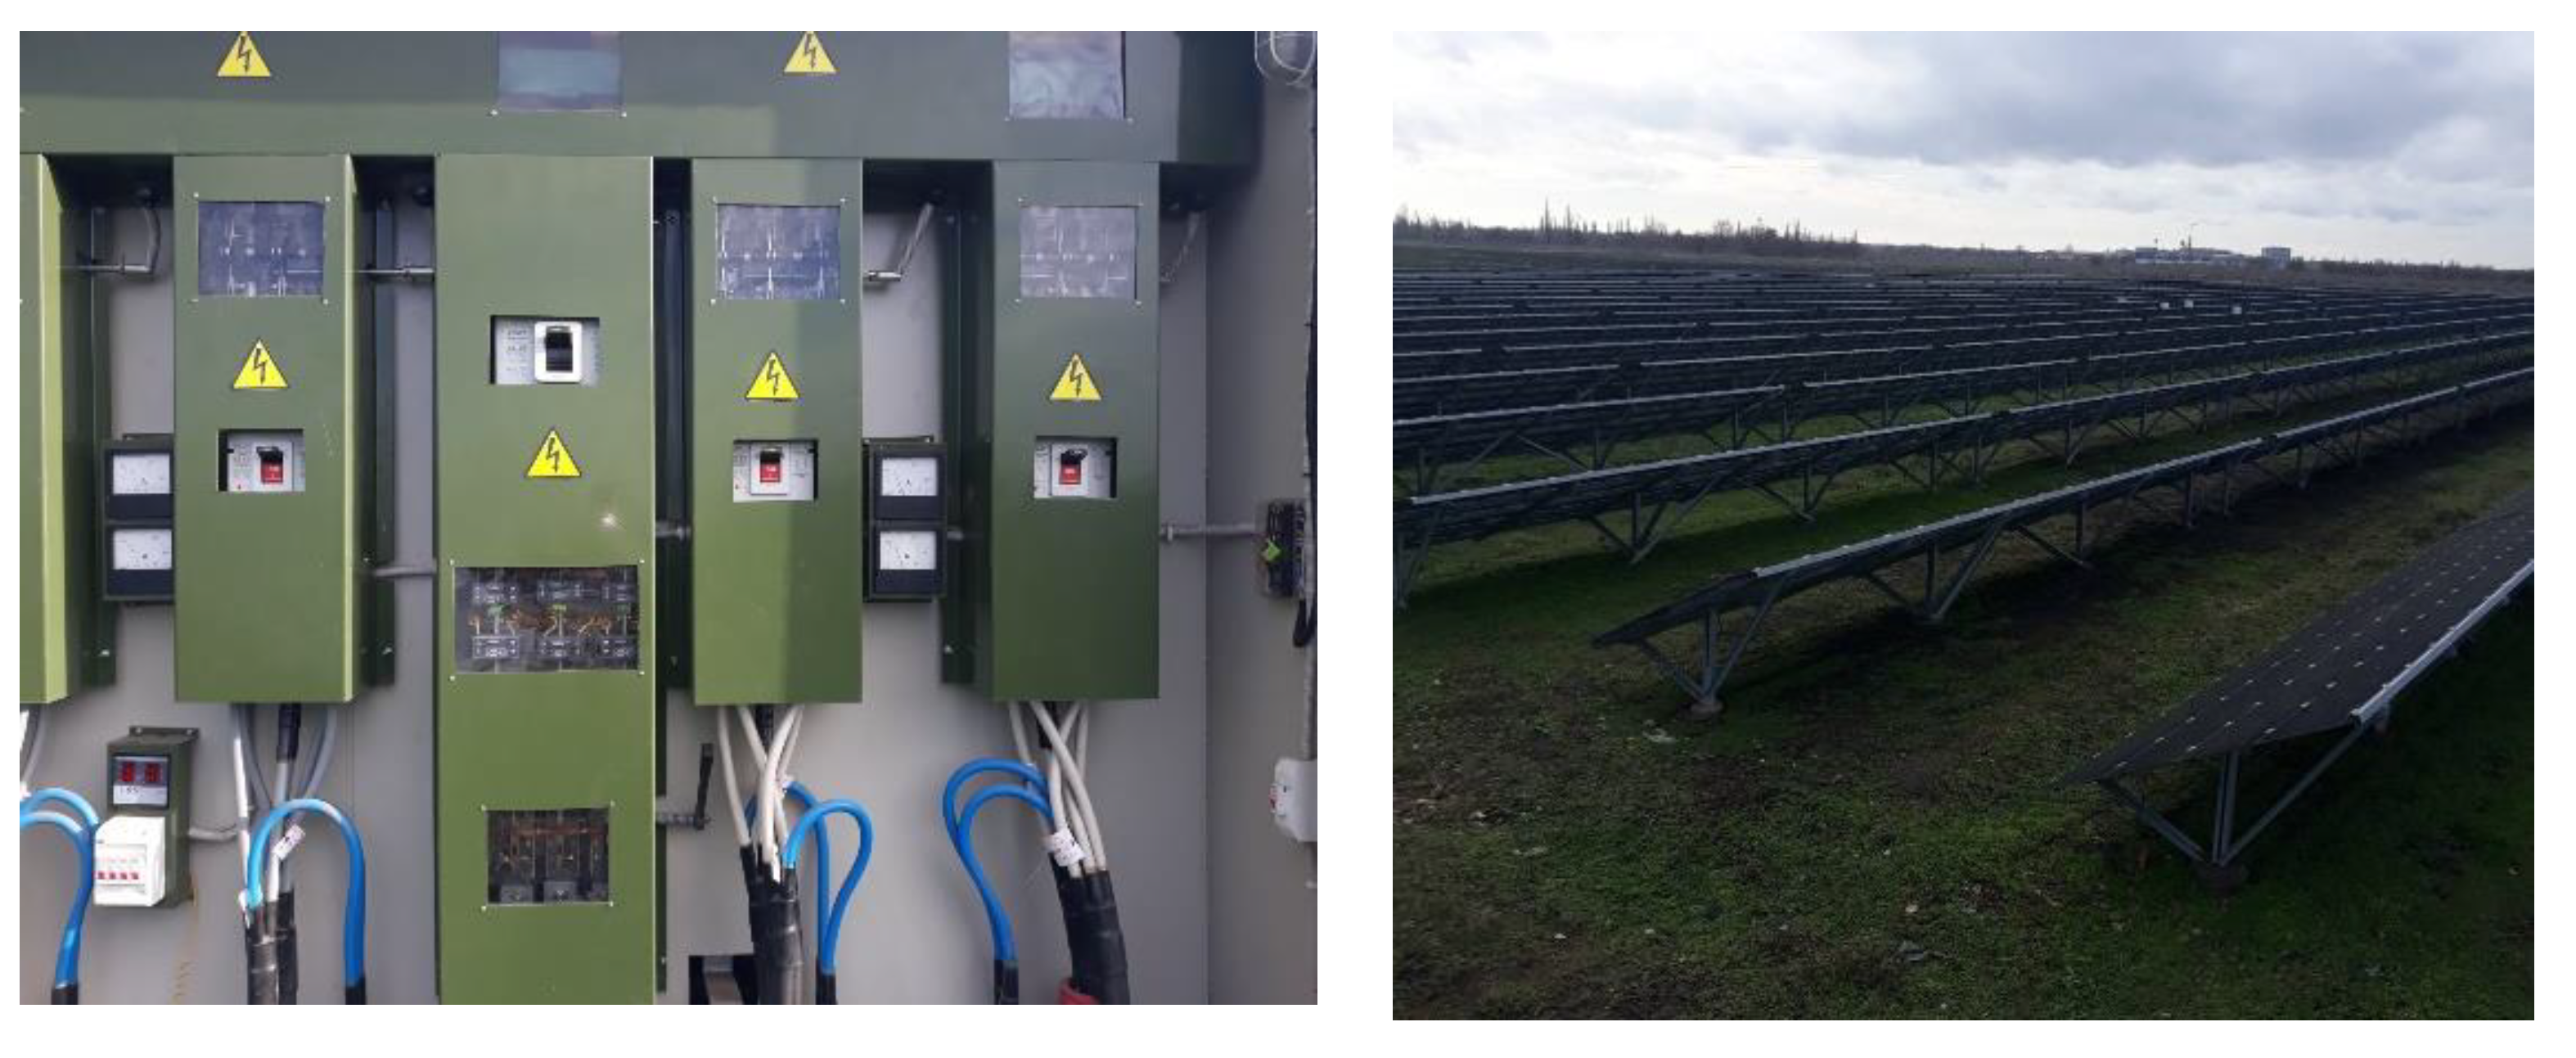
The switching value of any variable turns the PI to 1.2 (a minimum acceptable value for business) or the NPV to 0. Switching values can be shown in natural form and percentage change. The switching value (the percentage change) for the ith variable is calculated by the formula [57]
S V i = 100 V i * V i 0 V i 0 ,   % ,
where V i 0 is the value of ith variable in the base case; V i * is the value of ith variable in the case if NPV = 0 or PI = 1.2.

2.6. Solar Field

We assessed the profitability of crop production and solar power generation. We used data from a PV plant that is mounted nearby the town of Novii Buh, Mykolaiv province (47°41′18″ N, 32°34′33″ E). The examined solar field occupies 2 hectares. The landowner is an agricultural limited liability company. This company owns 2000 hectares of arable land. The solar field is shown in Figure 4.
Reduction of carbon dioxide emissions and diversification of business activity are the primary motives for PV. Since green electricity substitutes fossil fuels, carbon dioxide savings were found. Farmers look for the opportunity for diversification of their business activity. Global warming, an increase in air temperature, and droughts force them to look for alternatives. Solar energy may be an alternative to crop production. Economic indicators for solar power generation and their comparison with crop cultivation were carried out.

3. Results

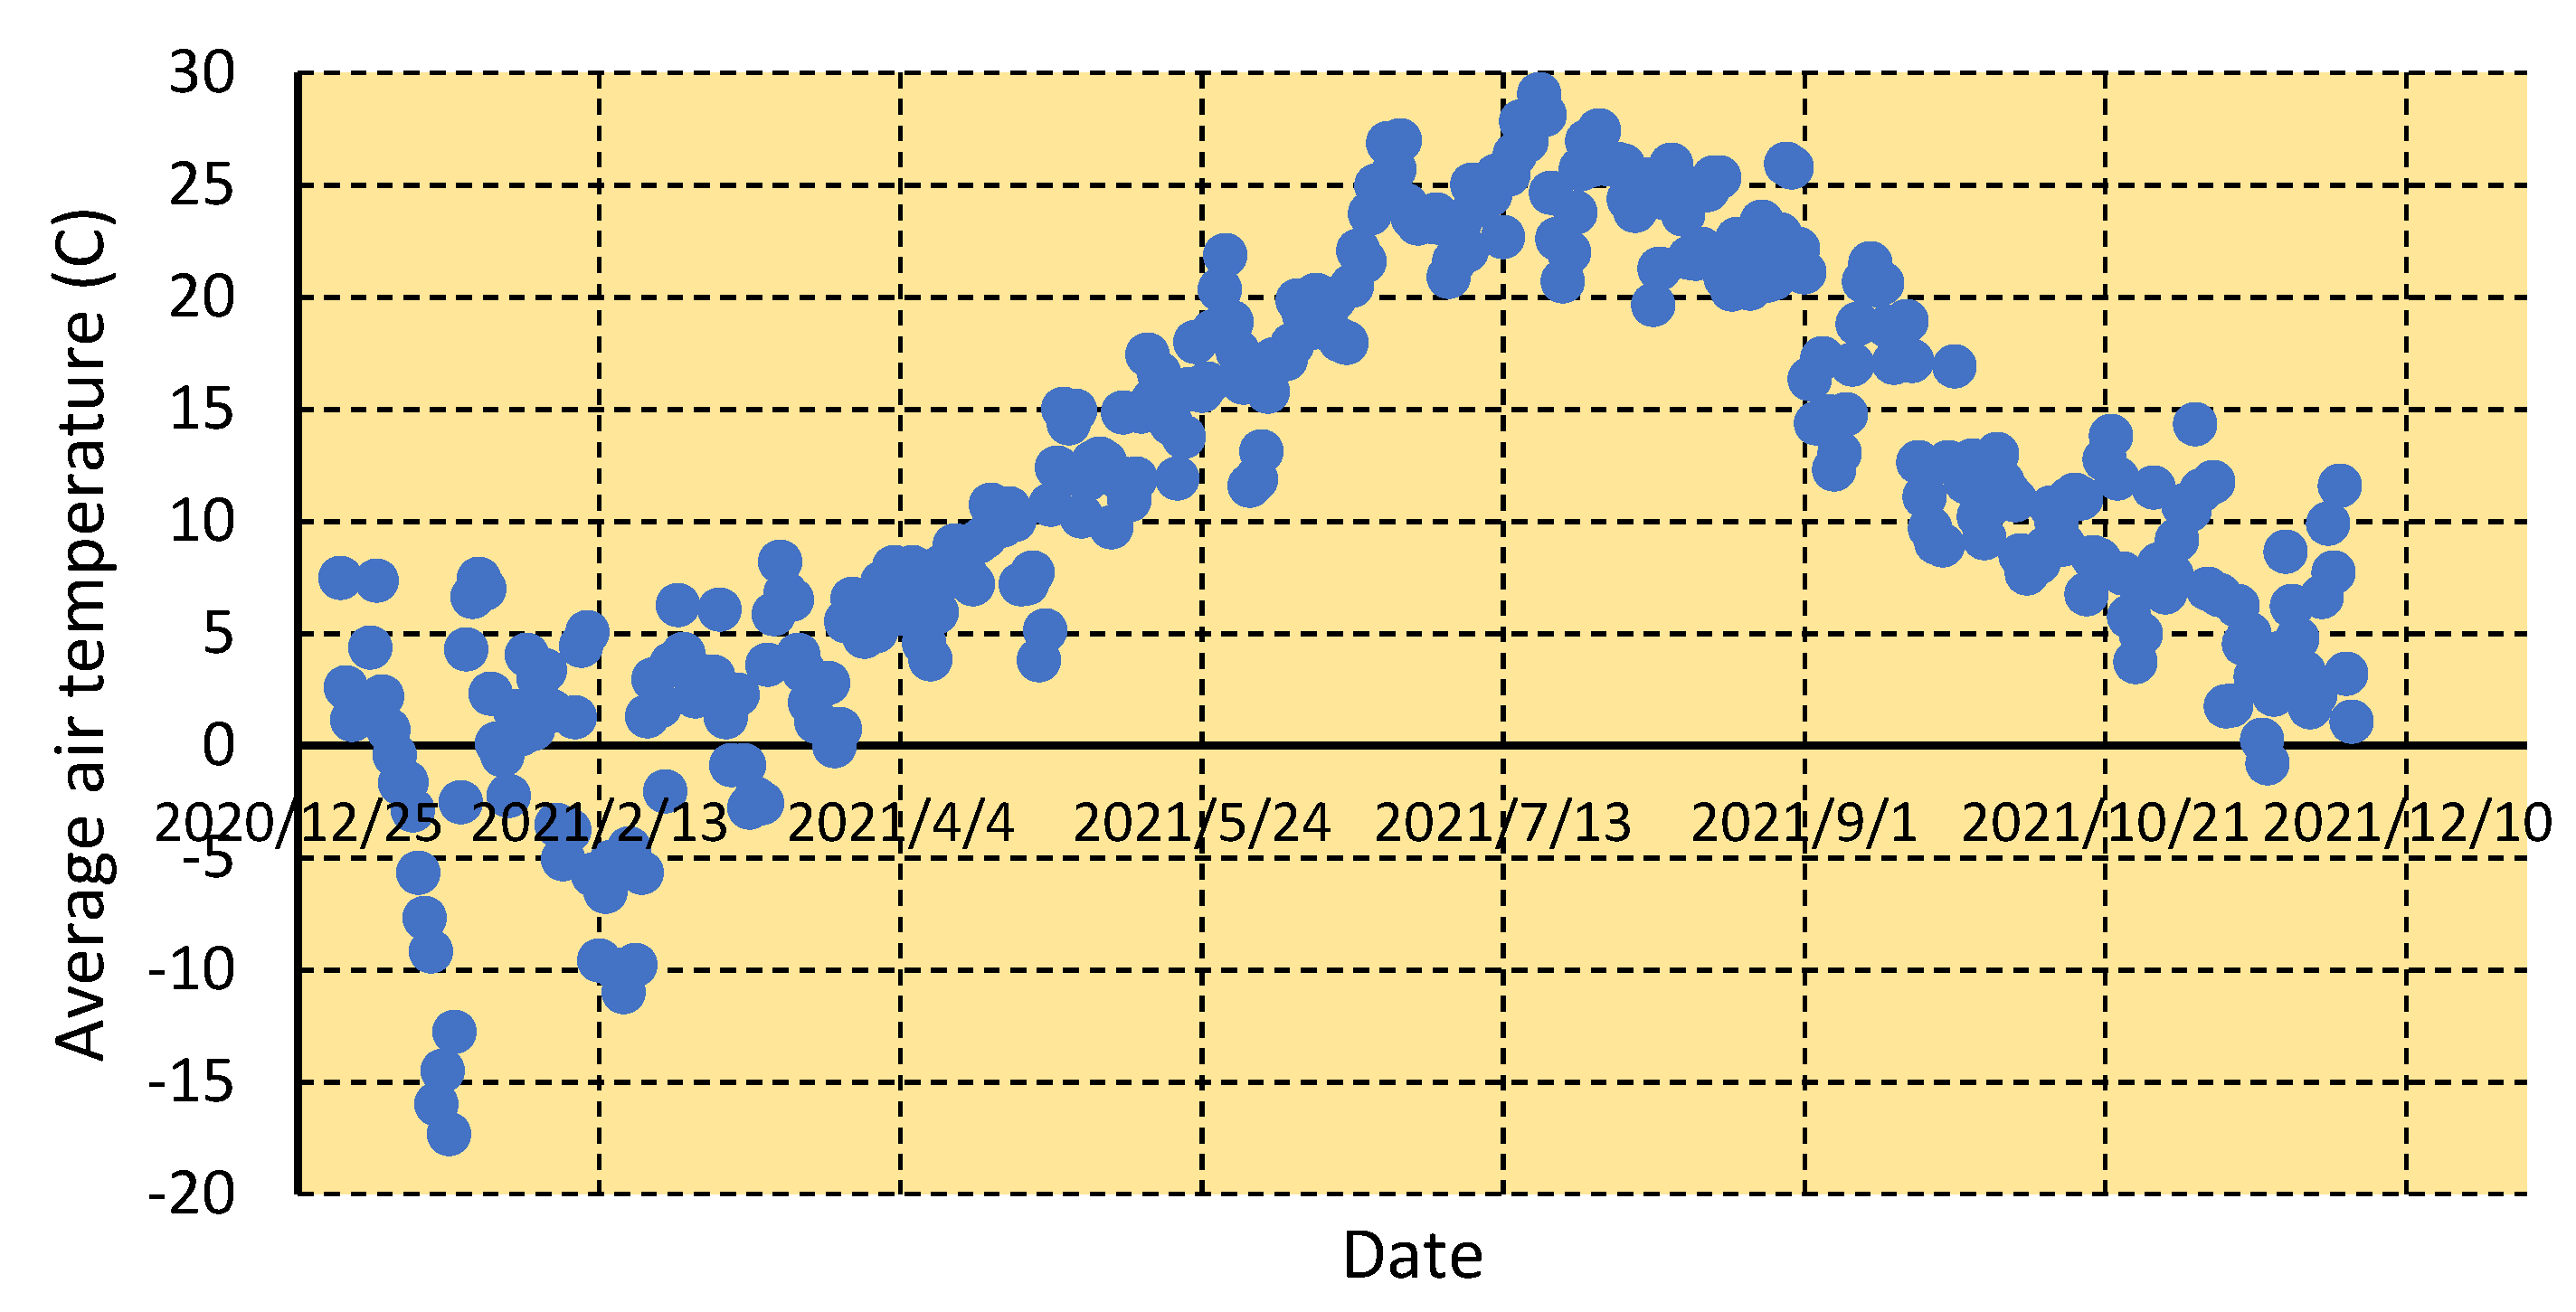
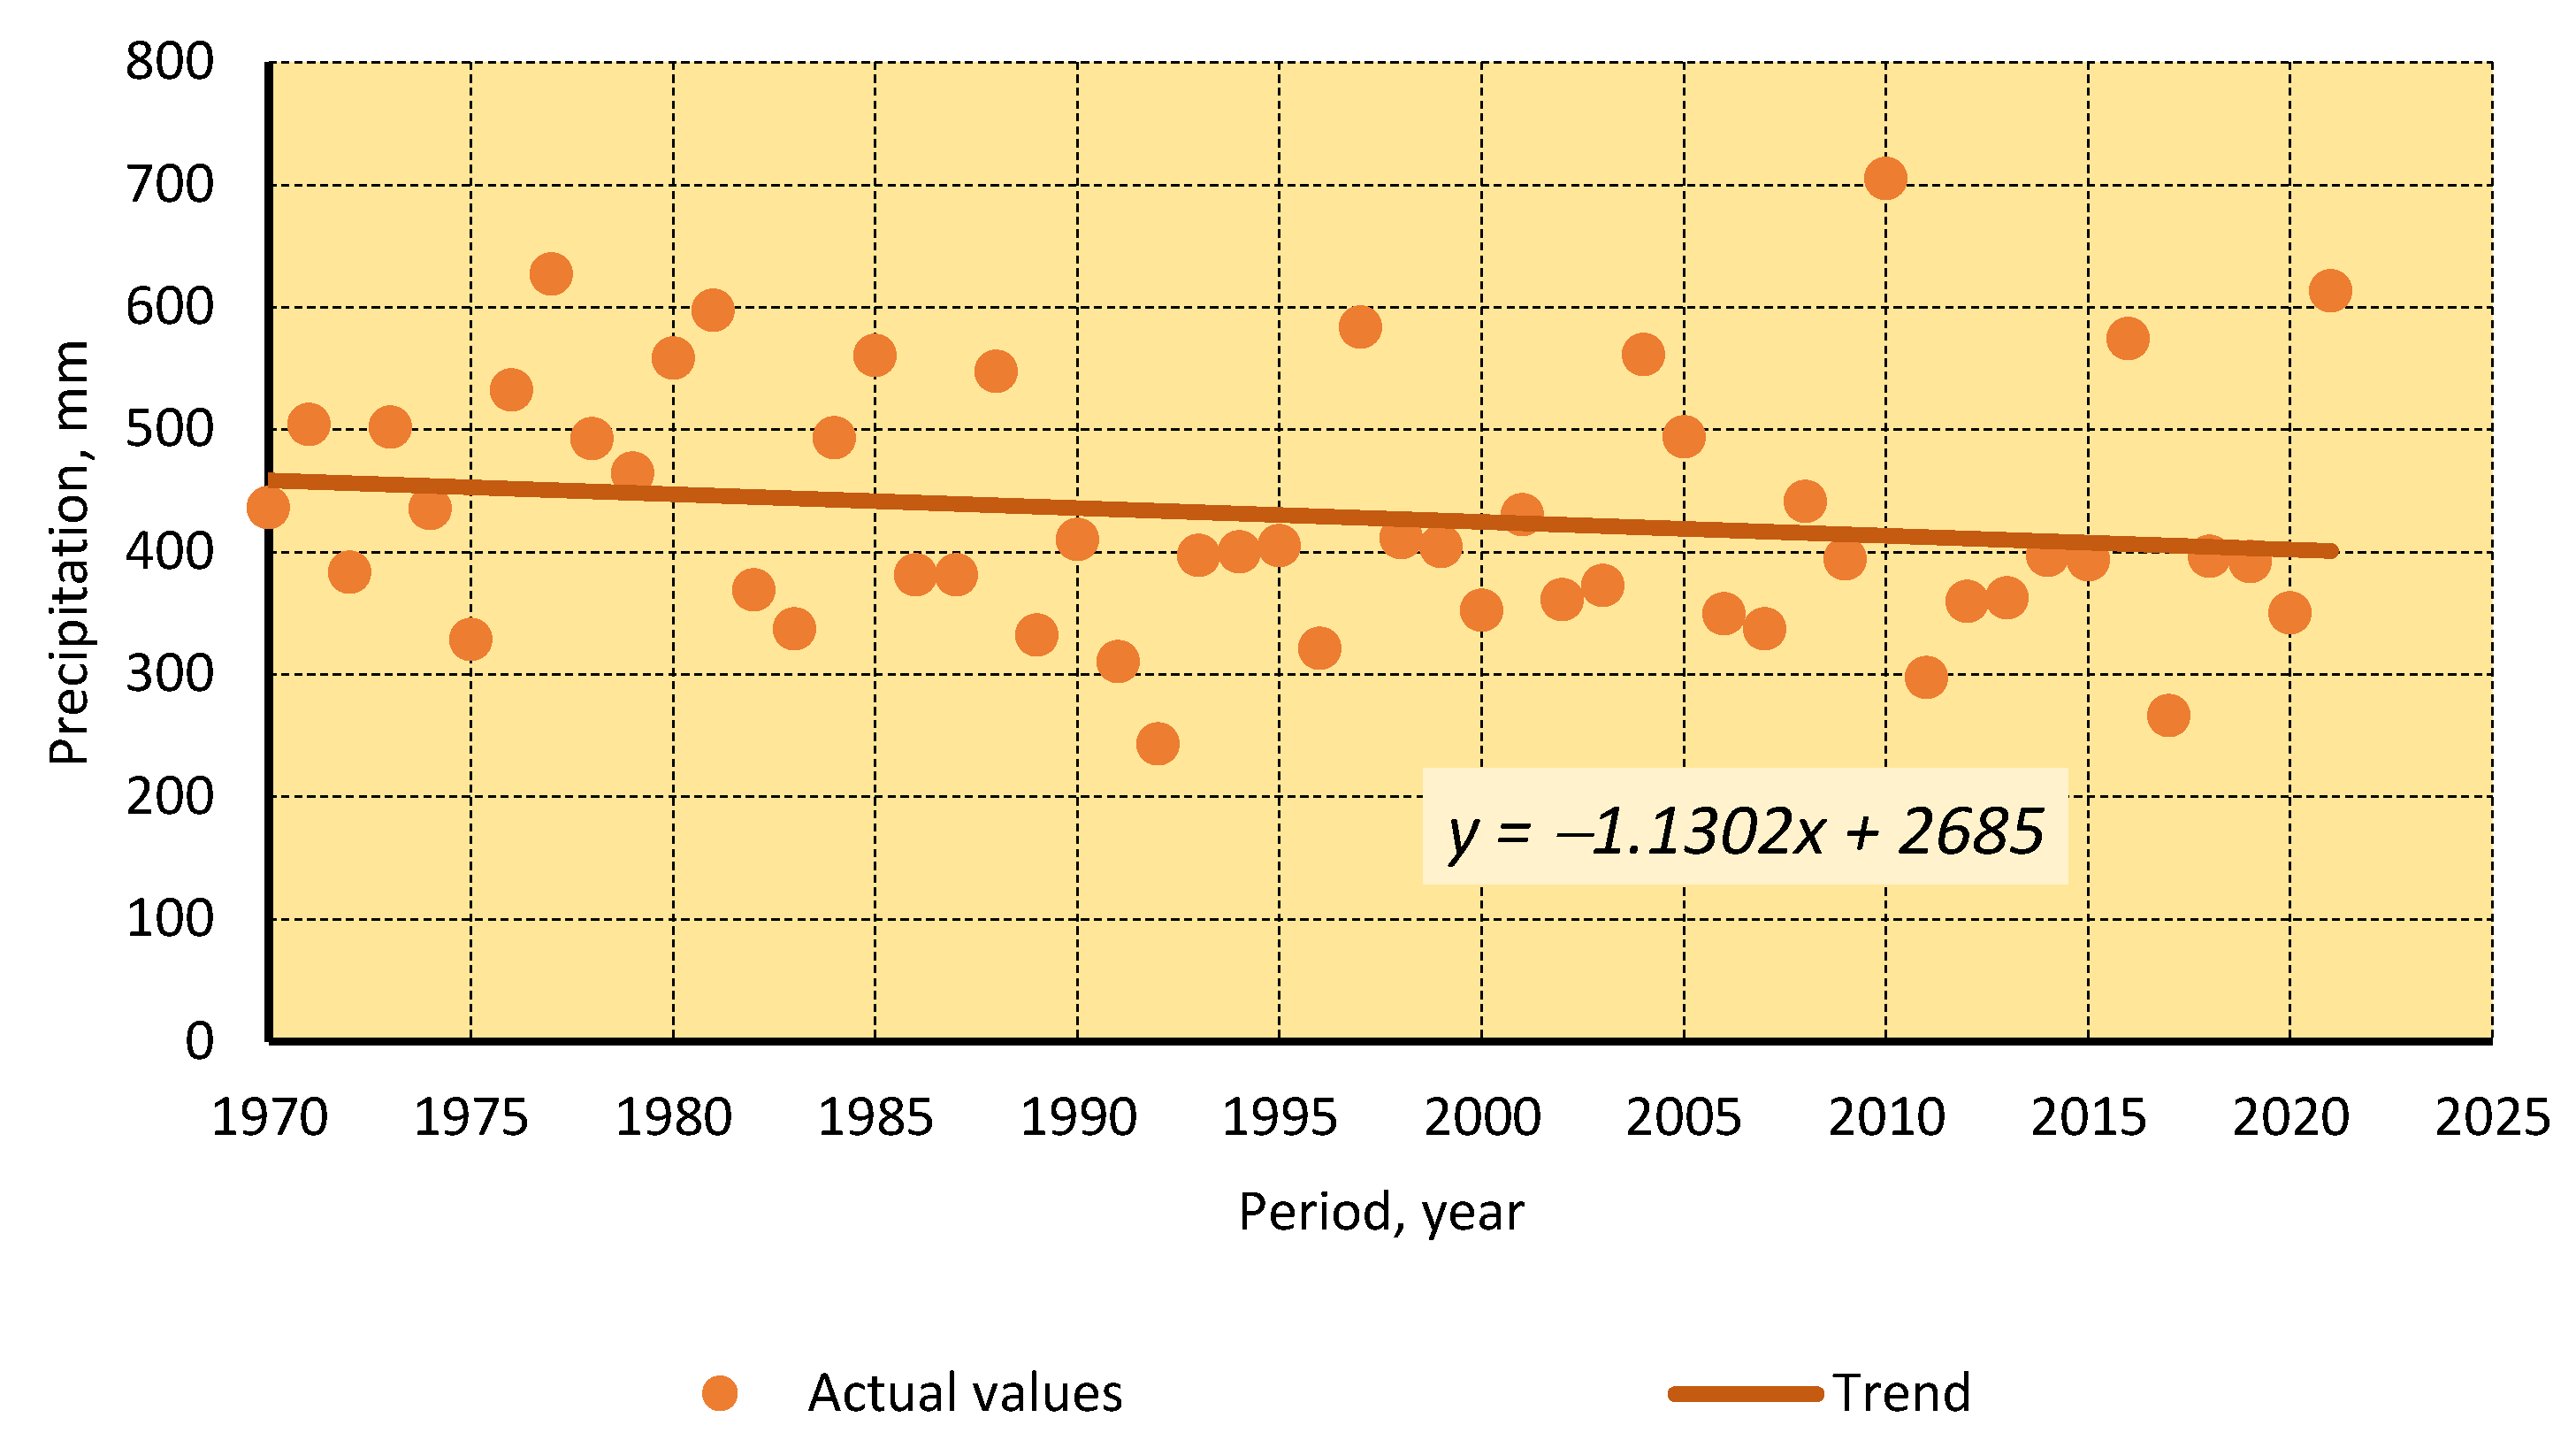
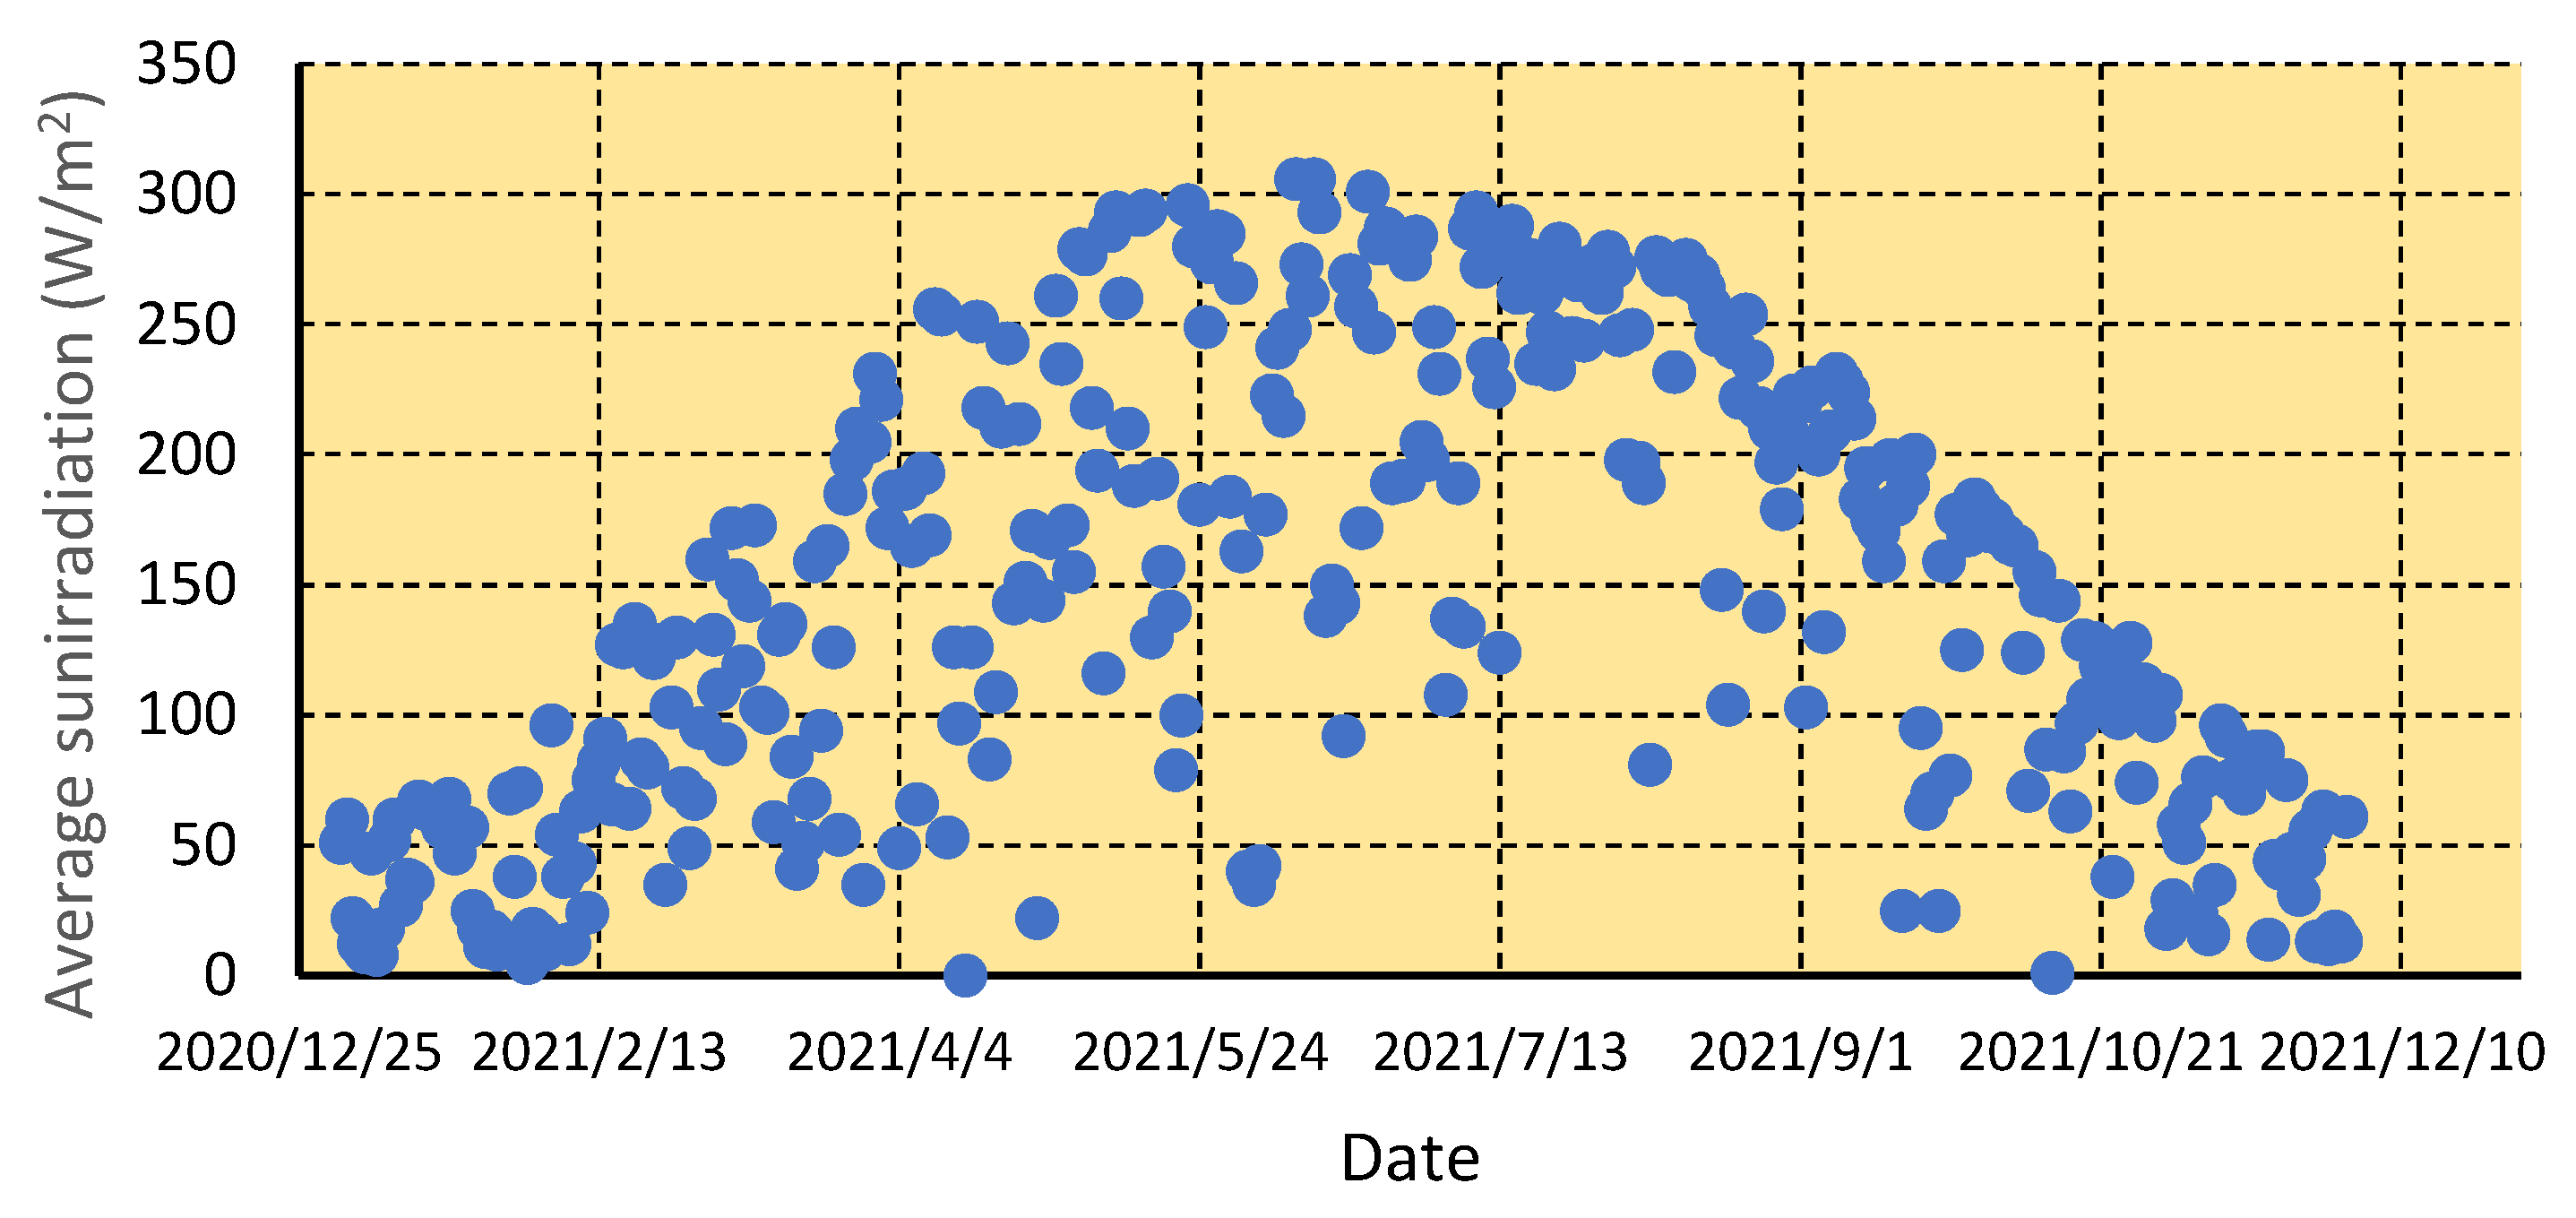
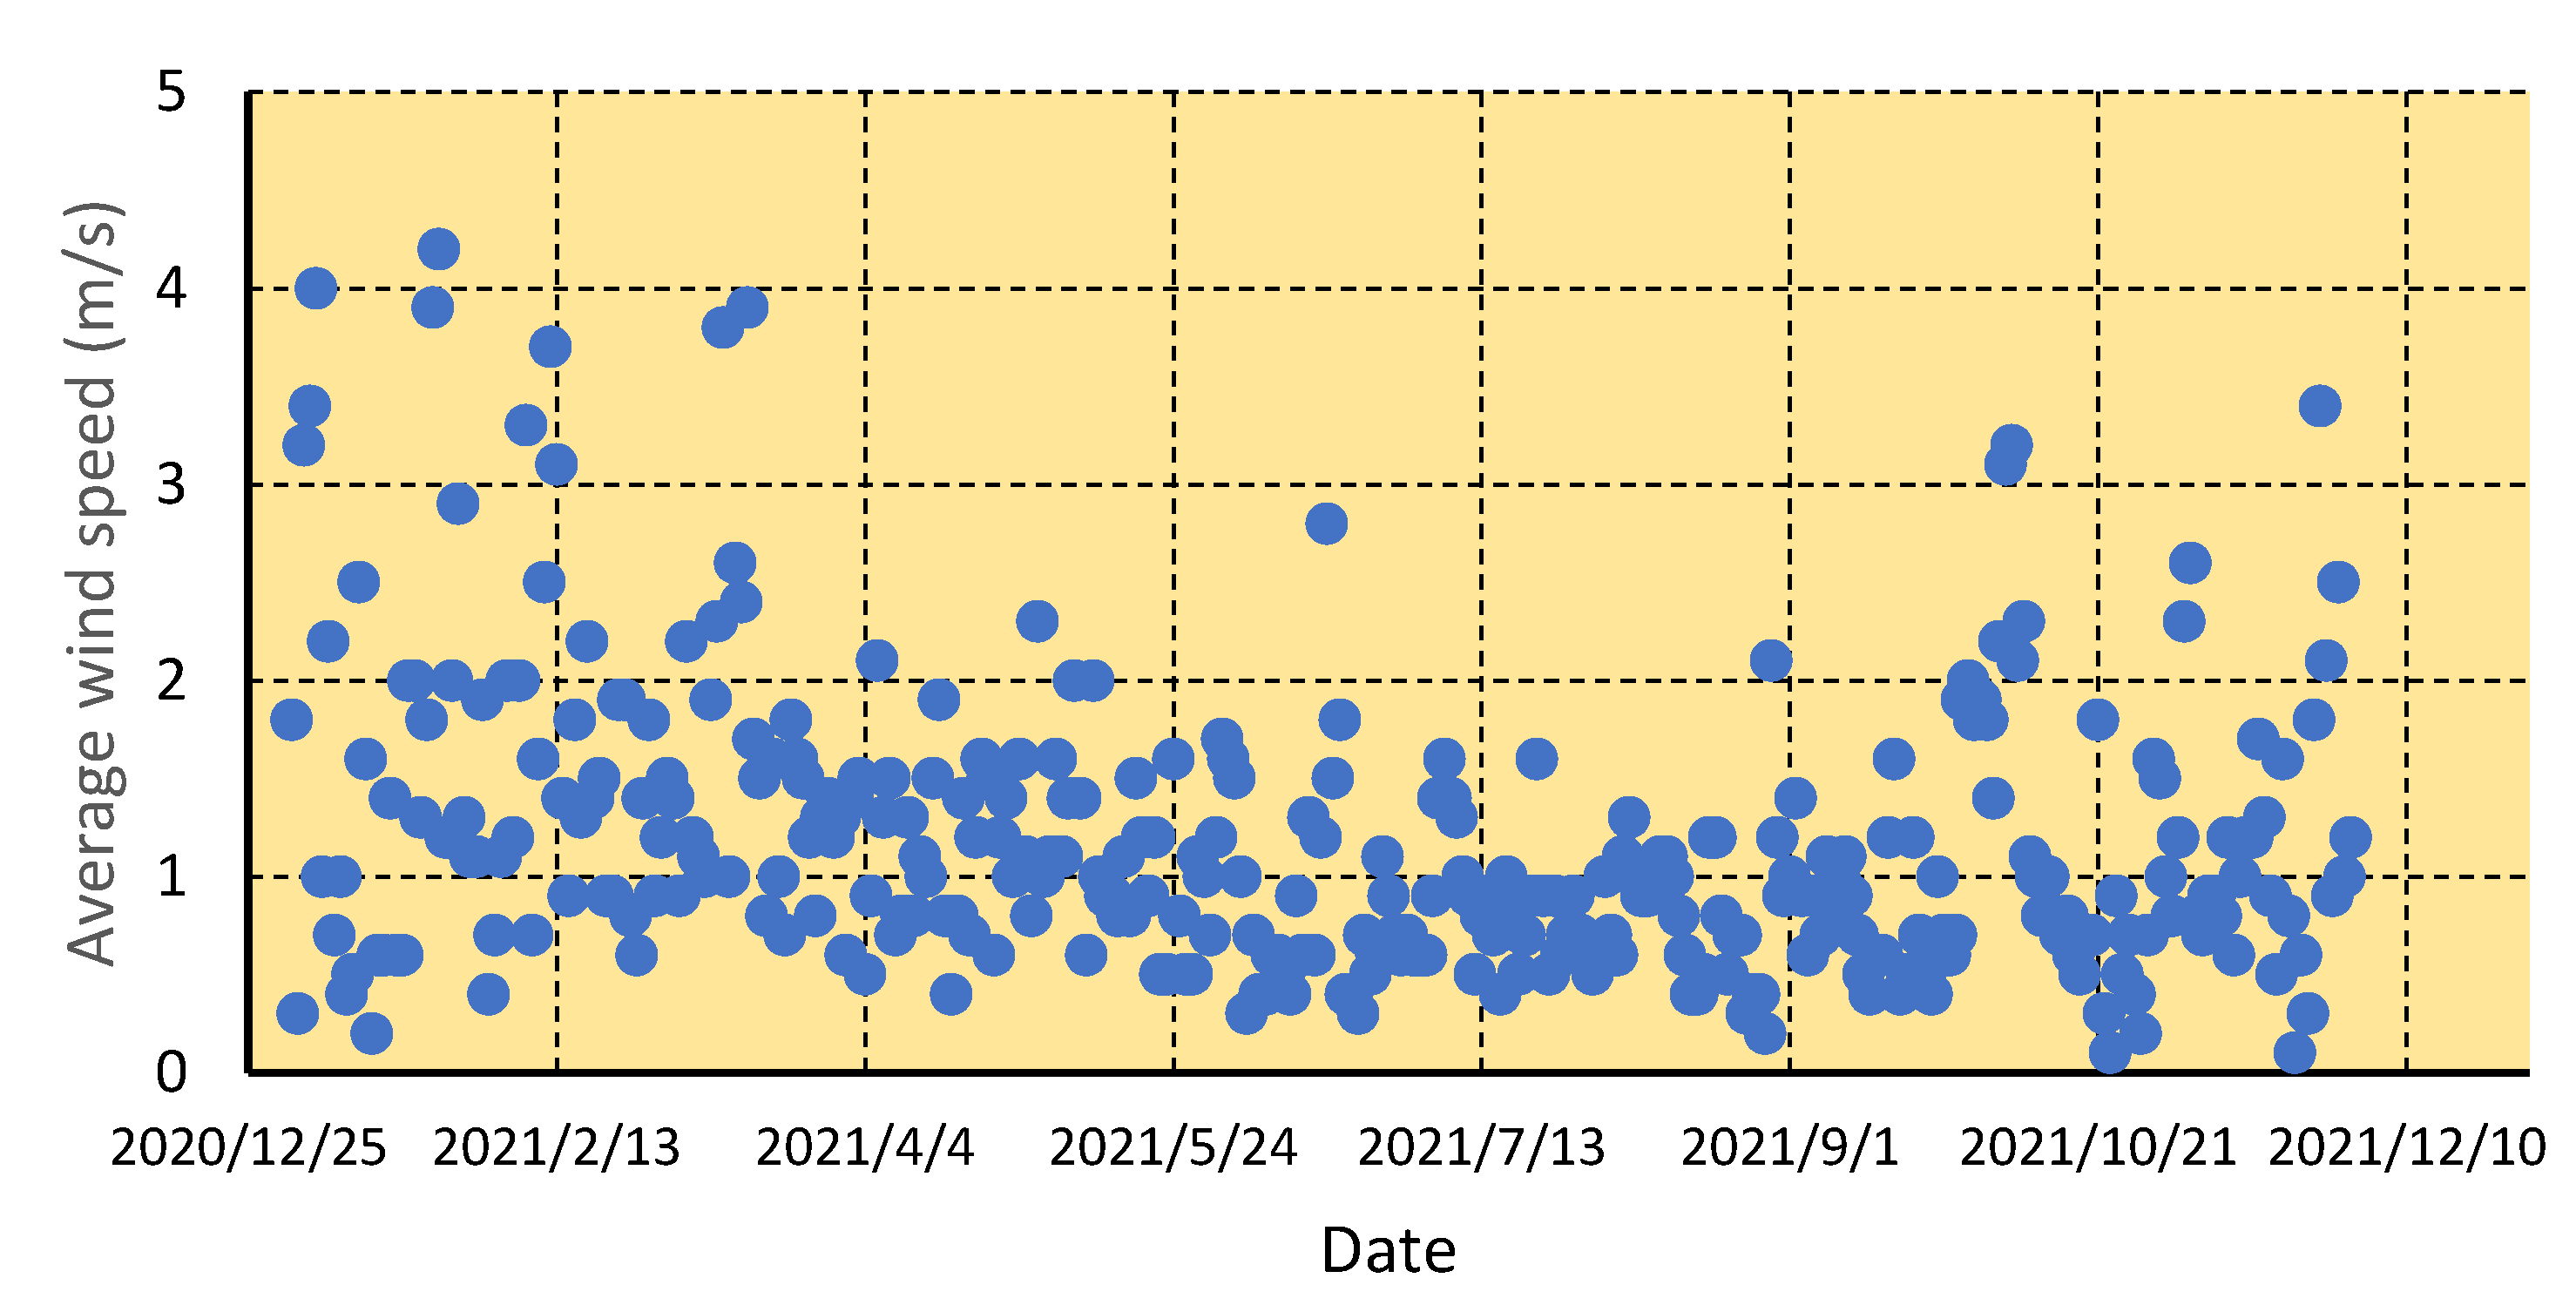
3.1. Climate and Weather Conditions

Experiments were performed in the Mykolaiv province. The weather conditions were as follows. Despite the significant fluctuation (from 240 to 750 mm), there was a drop in annual precipitation (Figure 5) [58]. Since 1970, it has decreased from 450 mm to around 380 mm in 2020 (or 12%). The average atmospheric temperature has increased from 9.6 °C to 11.25 °C (Figure 6) [58]. It constitutes 17%. These facts must be taken into account for PV projects.
In 2021, we observed air temperature, solar irradiation, and wind speed. The results are depicted in Figure 7, Figure 8 and Figure 9. These parameters impact the power generated by PV. In summer, the average daily air temperature did not exceed 30 °C. In winter, it dropped down to −17 °C. As can be seen from Figure 5, there is a significant fluctuation in sun irradiation due to weather conditions. It lowers the amount of power generated by PV. Figure 6 represents wind speed. The graph demonstrates that the average wind speed is less than 4 m/s. Therefore, wind cannot impact PV efficiency.

3.2. Status of Solar Photovoltaic

The global average levelized cost of electricity (LCOE) of PV power plants is decreasing. Since 2010, the average LCOE has decreased from USD 381/MWh to USD 57/MWh in 2020 (Figure 10) [59]. In the same period, the global average LCOE of biomass-based electricity declined from USD 76/MWh in 2010 to USD 66/MWh in 2019. In 2020, India and China had the lowest LCOE (from USD 57/MWh to USD 60/MWh). The most expensive solar electricity is in Europe (USD 87/MWh) and North America USD 97/MWh [59].
In Ukraine (March 2021), the price for households was USD 62/MWh, and the price for businesses was USD 90/MWh. These prices were lower than the average prices in the world (USD 135/MWh and USD 124/MWh, respectively) [60]. The average leverized cost of electricity generated by Ukrainian power plants was as follows, USD/MWh: thermal power plants—79.4; nuclear power plants—21.0; hydropower—26.5 [61,62]. The feed-in tariff for solar power plants is EUR 109.7/MWh (since 2020 for the industry) [63]. In the world, LCOEs for coal plants are in the range from USD 64.7/MWh (India) to USD 148.76/MWh (USA). For nuclear plants, LCOEs vary from USD 27.41/MWh (Russia) to USD 146.06 (Slovak Republic). Levelized costs of electricity for solar power plants ranged from USD 24.39/MWh (France, utility-scale) to USD 302.97/MWh (Italy, residential) [64].
Last year (2021), wholesale electricity prices increased. This was a result of numerous factors, such as a rise in fossil fuel prices (primarily natural gas) and a decrease in wind power generation. Electricity prices were the highest in Germany and Italy. Finland and Sweden had the lowest electricity prices (Figure 11) [65,66]. Since 2008, the average prices in the European Union have increased by around 30% [67]. High wholesale prices made favorable conditions for the development of PV.
Primary energy consumptions are presented in Table 1. Ukraine consumes less renewables and hydroelectricity compared to the world. Global electricity generation by renewables exceeded 12% in 2020. In Europe, the share of renewables and hydroelectricity is around 42% [68]. Electricity generation in the world and Ukraine by fuels is shown in Table 2. The specific production of green electricity in Ukraine is 2.5 times less than the average in the world.
In Ukraine, renewable electricity capacity is 24% of the total electricity capacity or 13,764 MW [69]. The largest part of them (53.26%) is solar energy (Figure 12). The share of PV generation was 29%. This is a result of a relatively low capacity factor. The average capacity factor of PV reached 16.1% in 2020 [59]. Hydroelectricity is ranked first (Figure 13).

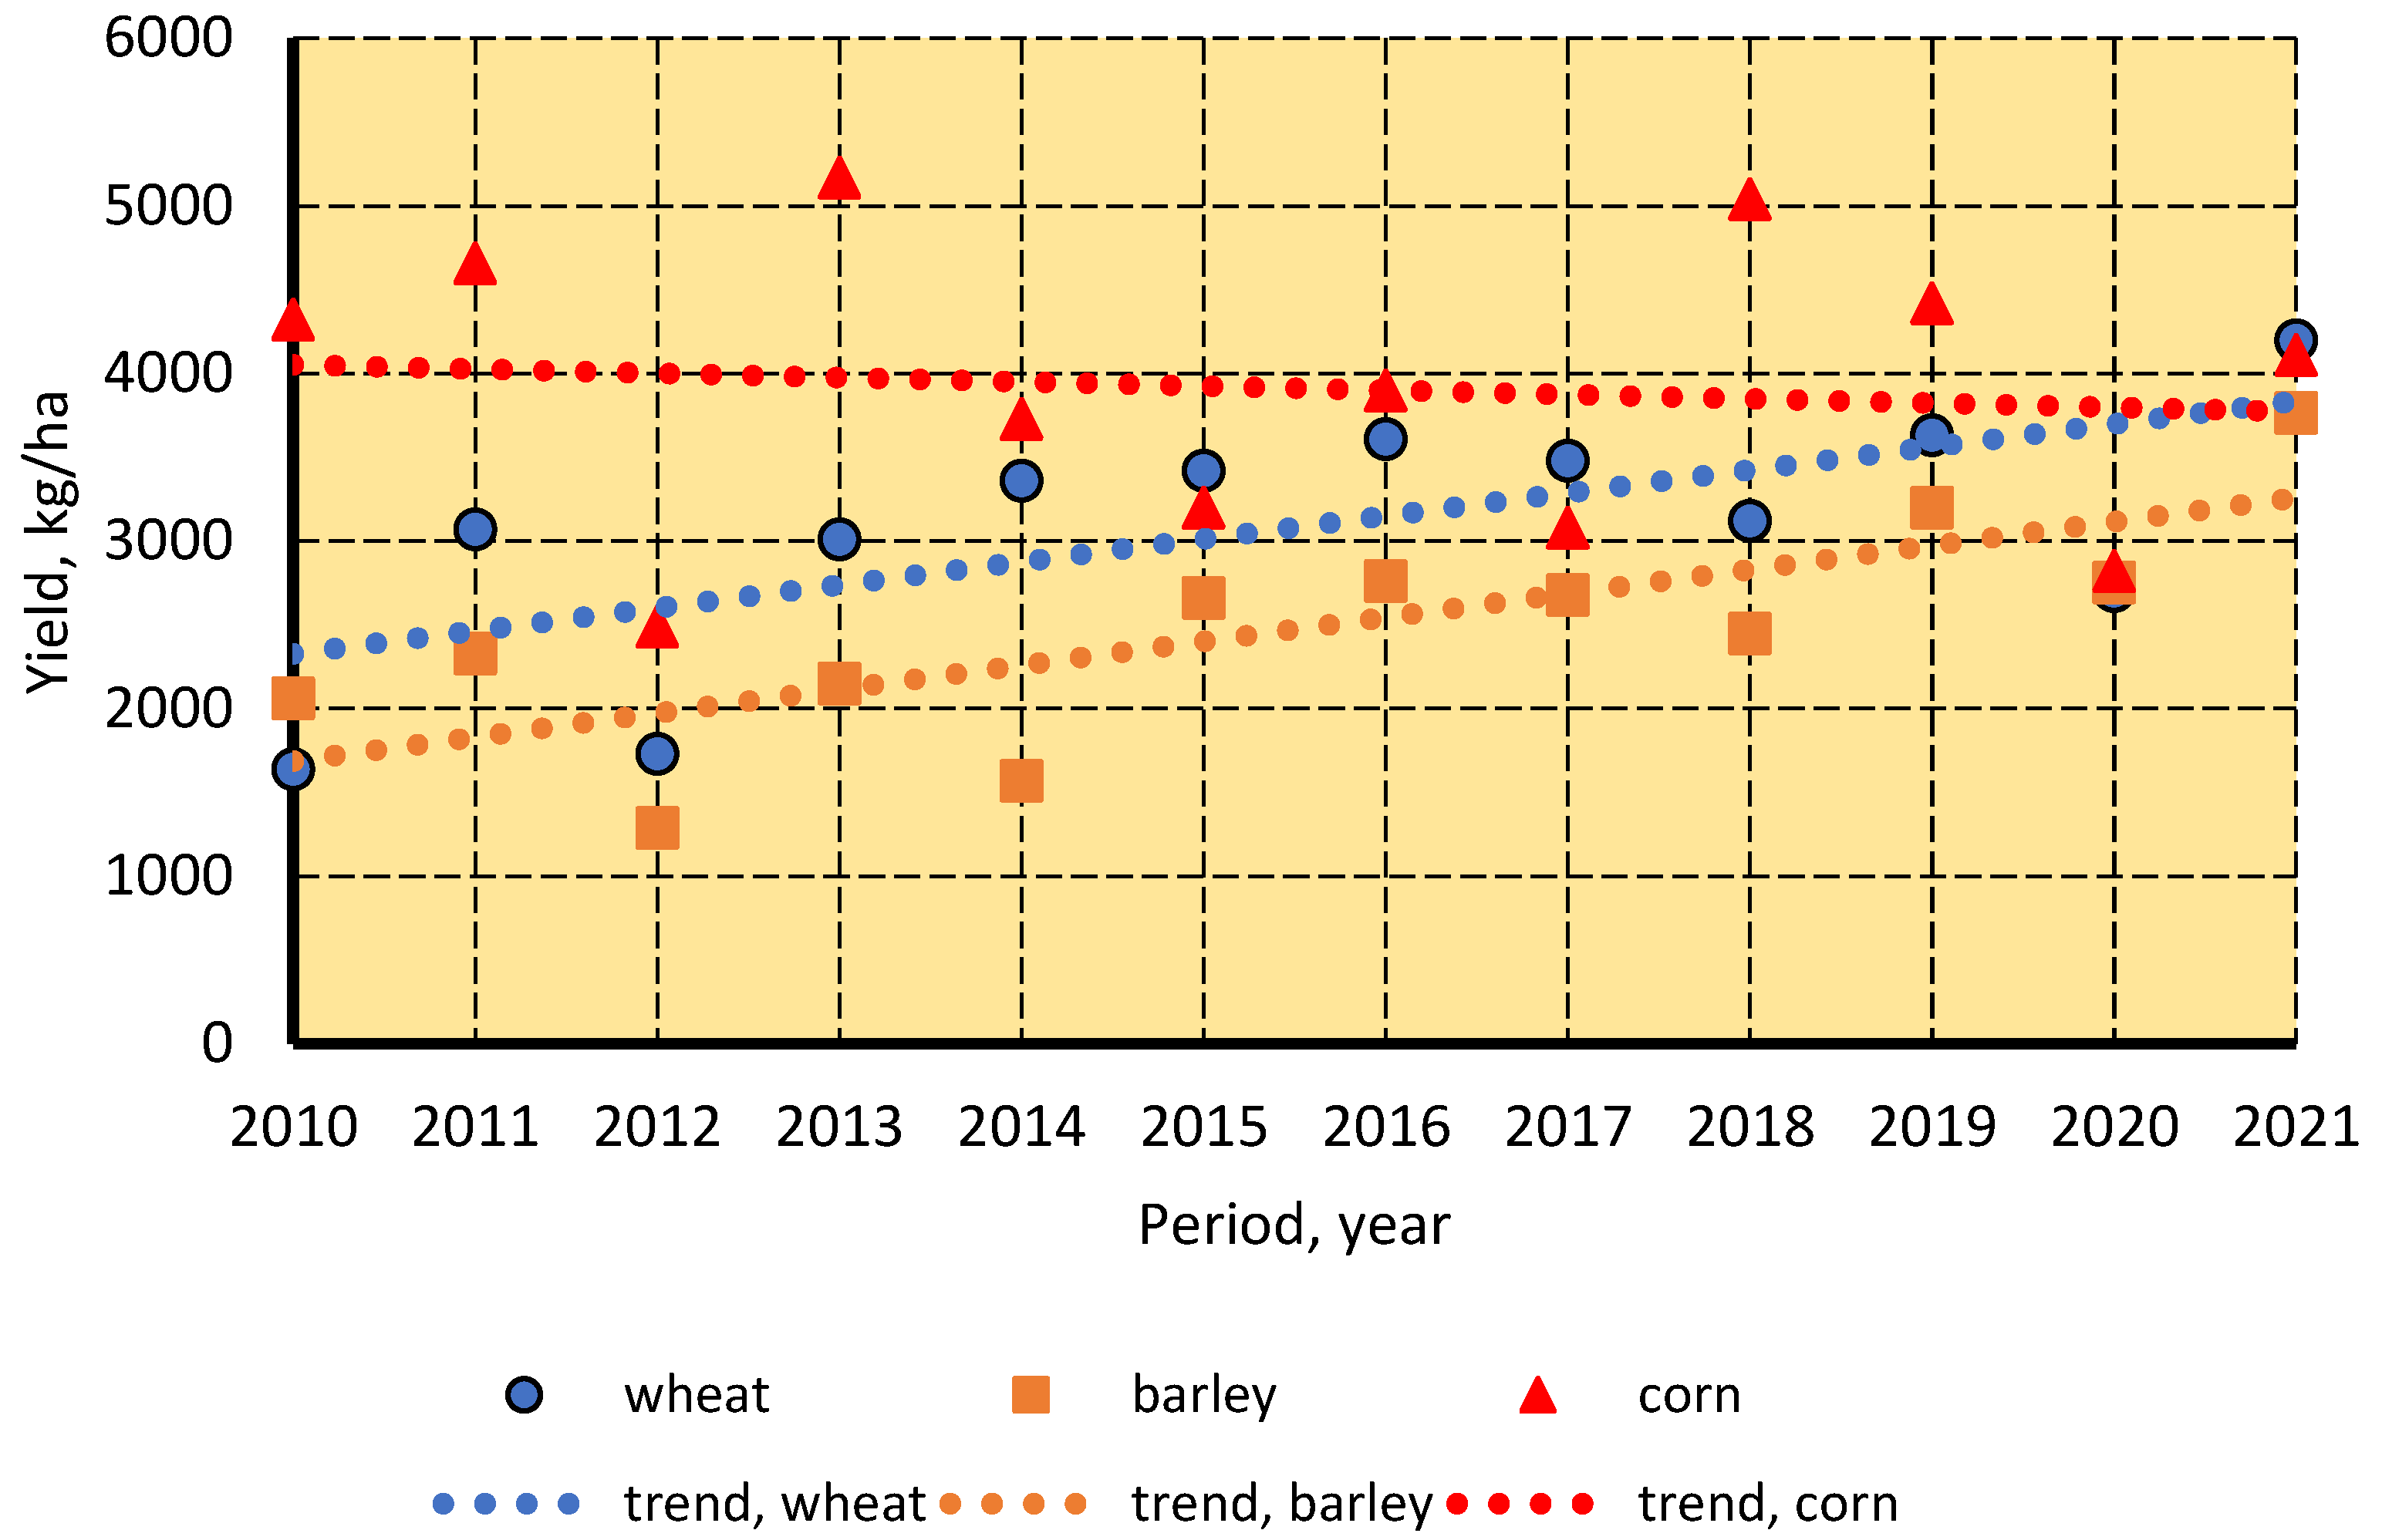
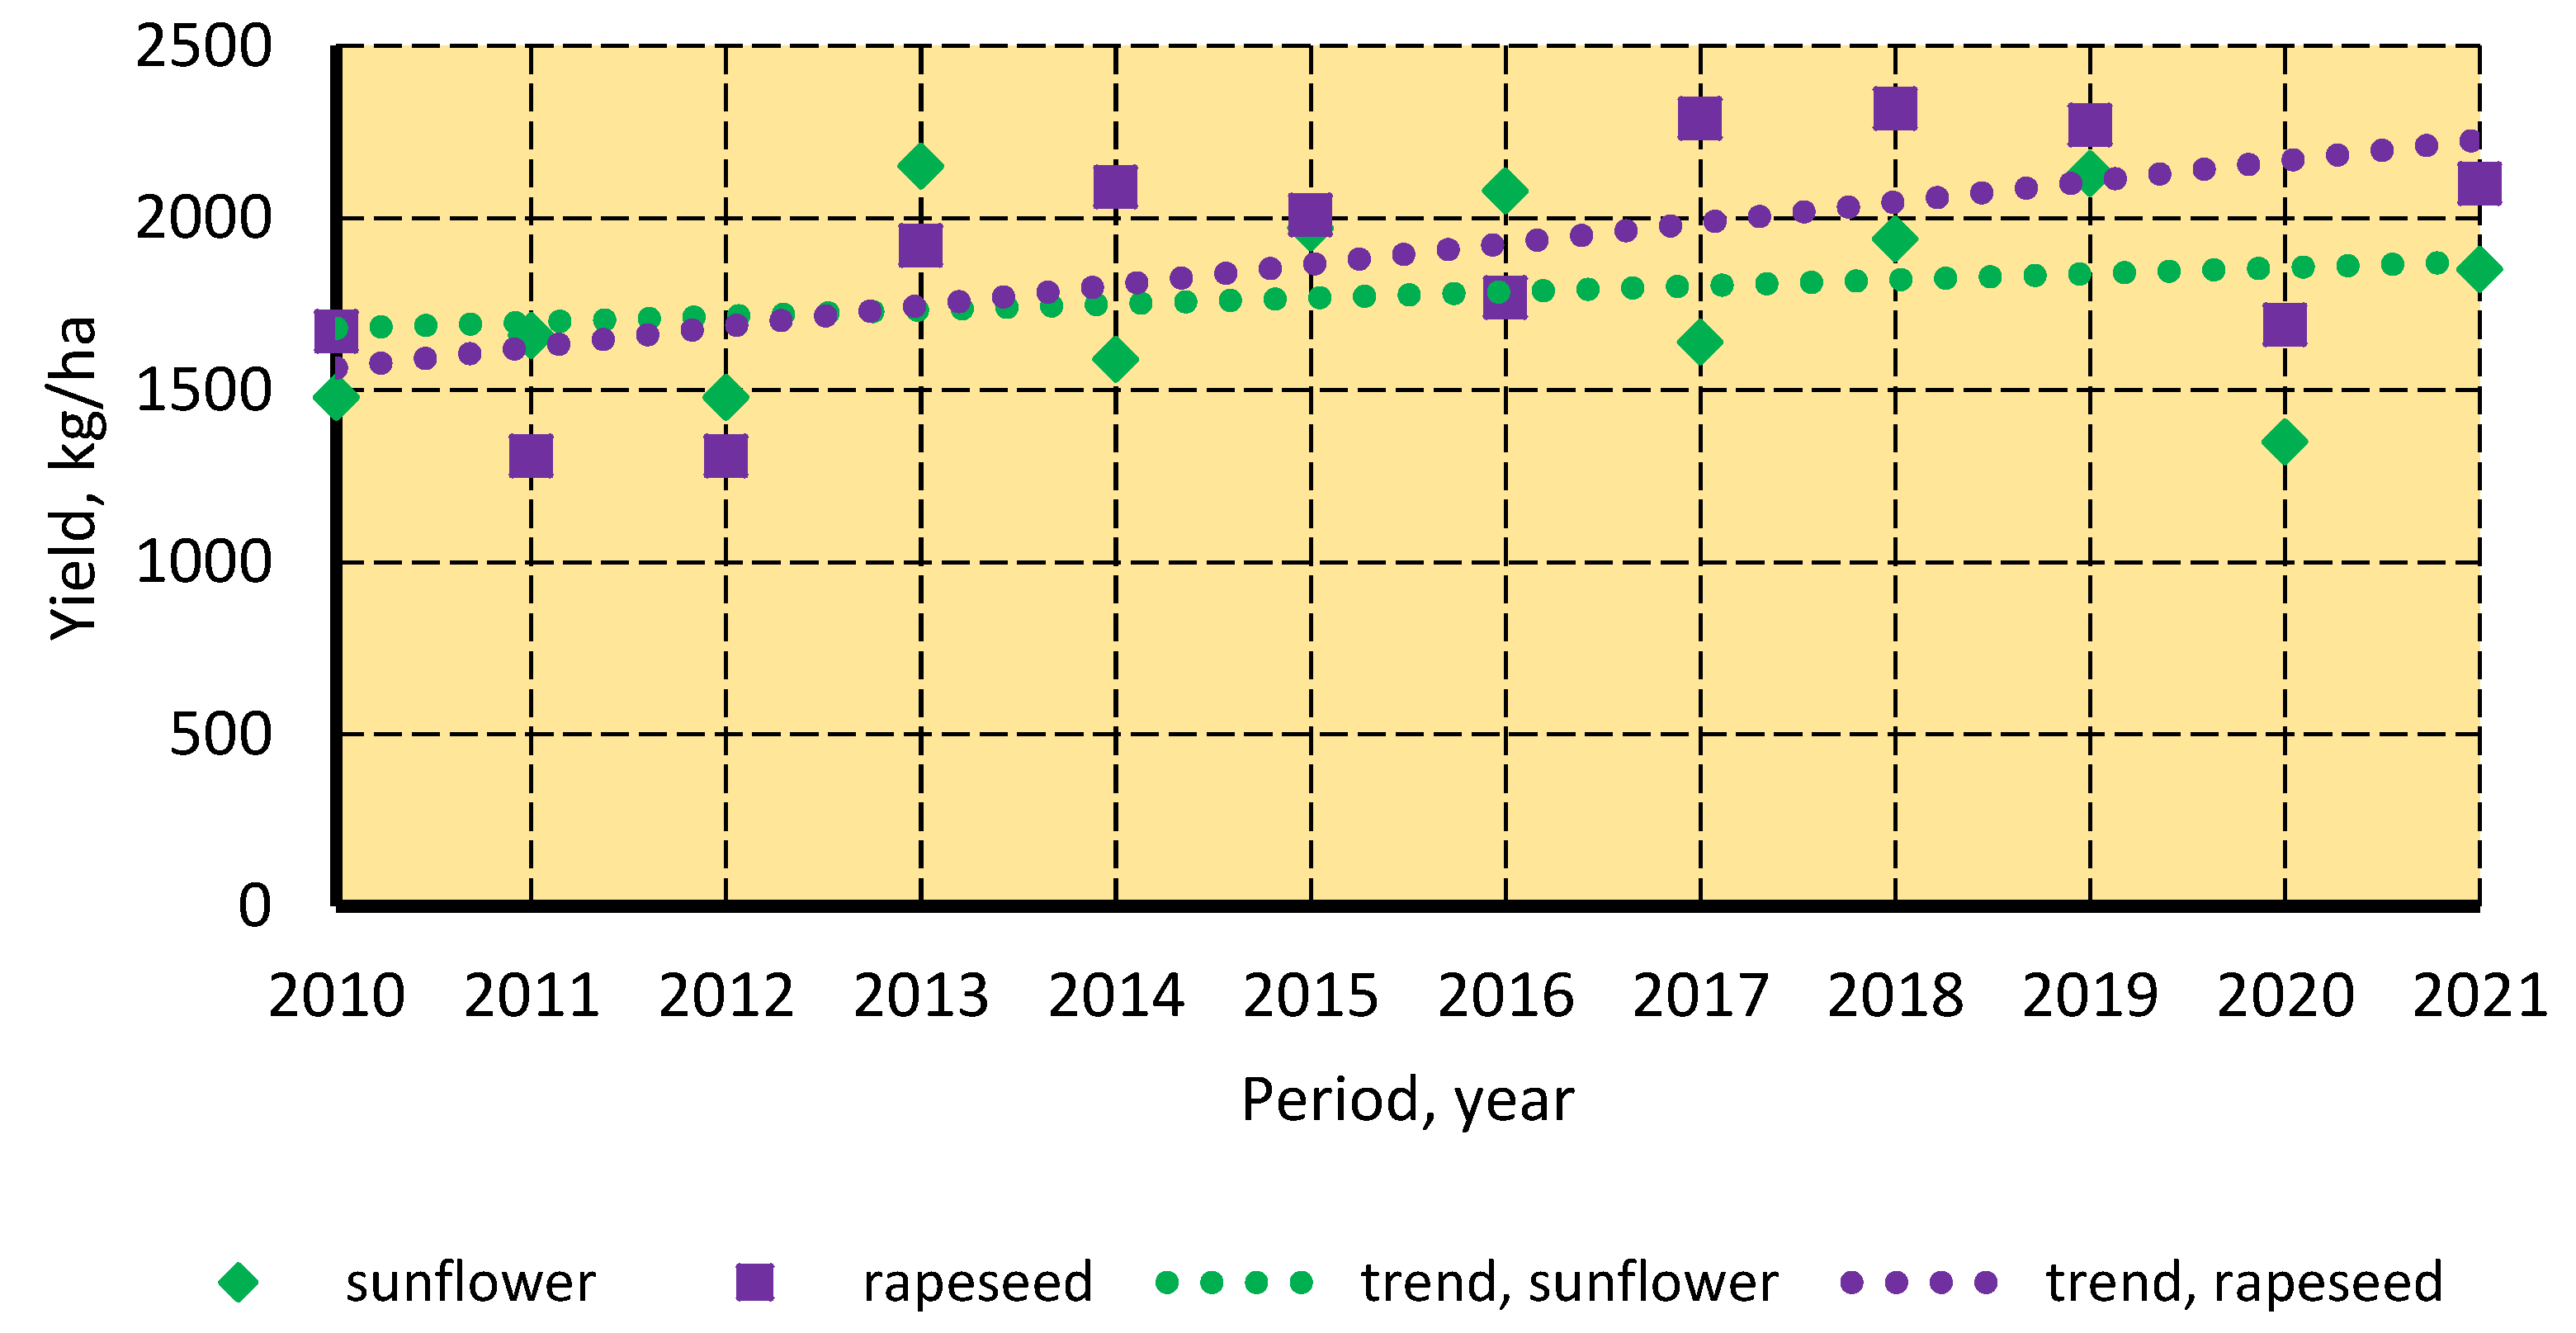
3.3. Efficiency of Crop Production

To evaluate the efficiency of crop production, we suggest introducing a new indicator—the crop rotation factor. This indicator is the ratio of each crop area to the total available farmland. The crop rotation factor for the ith crop is
C R F i = A C A i i = 1 n A C A i ,
where ACAi is the area of ith crop, ha; n is the number of crops.
The crop rotation factors were calculated for the main crops in Mykolaiv province (Table 3). Corn has the highest yield (Figure 14 and Figure 15), and sunflower has the lowest yield (Table 4). Despite the lowest yield, sunflower has the highest crop rotation factor. The primary reason for this fact is the highest profitability of sunflower seed growing. Our calculations are based on statistical data [70,71,72].

3.4. Gross Income and Profit of Crop Production

In December 2021, crop prices were as follows, USD/t: wheat—from 251 to 330; barley—from 256 to 290; corn—from 225 to 294; sunflower—from 580 to 716; rapeseed—from 530 to 710 [73]. The average gross income from hectare is
G I C = i = 1 n ( C R F i Y i M P i ) ,   USD / ha ,
where Yi is the yield of the ith crop, t/ha; MPi is the market price of the ith crop, USD/t.
Crop production gives the following profit
G P = i = 1 n ( C R F i Y i ( M P i P C i ) ) ,   USD / ha ,
where PCi is the production costs of the ith crop, USD/t.
We analyzed gross income and gross profit. Official State Statistical data, reports, and current prices are used to calculate the above [74,75,76,77,78]. The gross annual income from crop production ranges from EUR 506/ha to EUR 1389/ha (Figure 16). It mainly depends on weather conditions and market prices. Thus, droughty weather (annual rainfall was 350 mm) results in lower yields in 2020. As a consequence of this, there was a minimum income per unit area. Favorable weather and market prices resulted in the highest gross income in 2021 (Figure 17). There has been a significant fluctuation in gross income and profit. In a favorable year, the maximum gross profit exceeds the minimum one (in an unfavorable year) by around ten times.

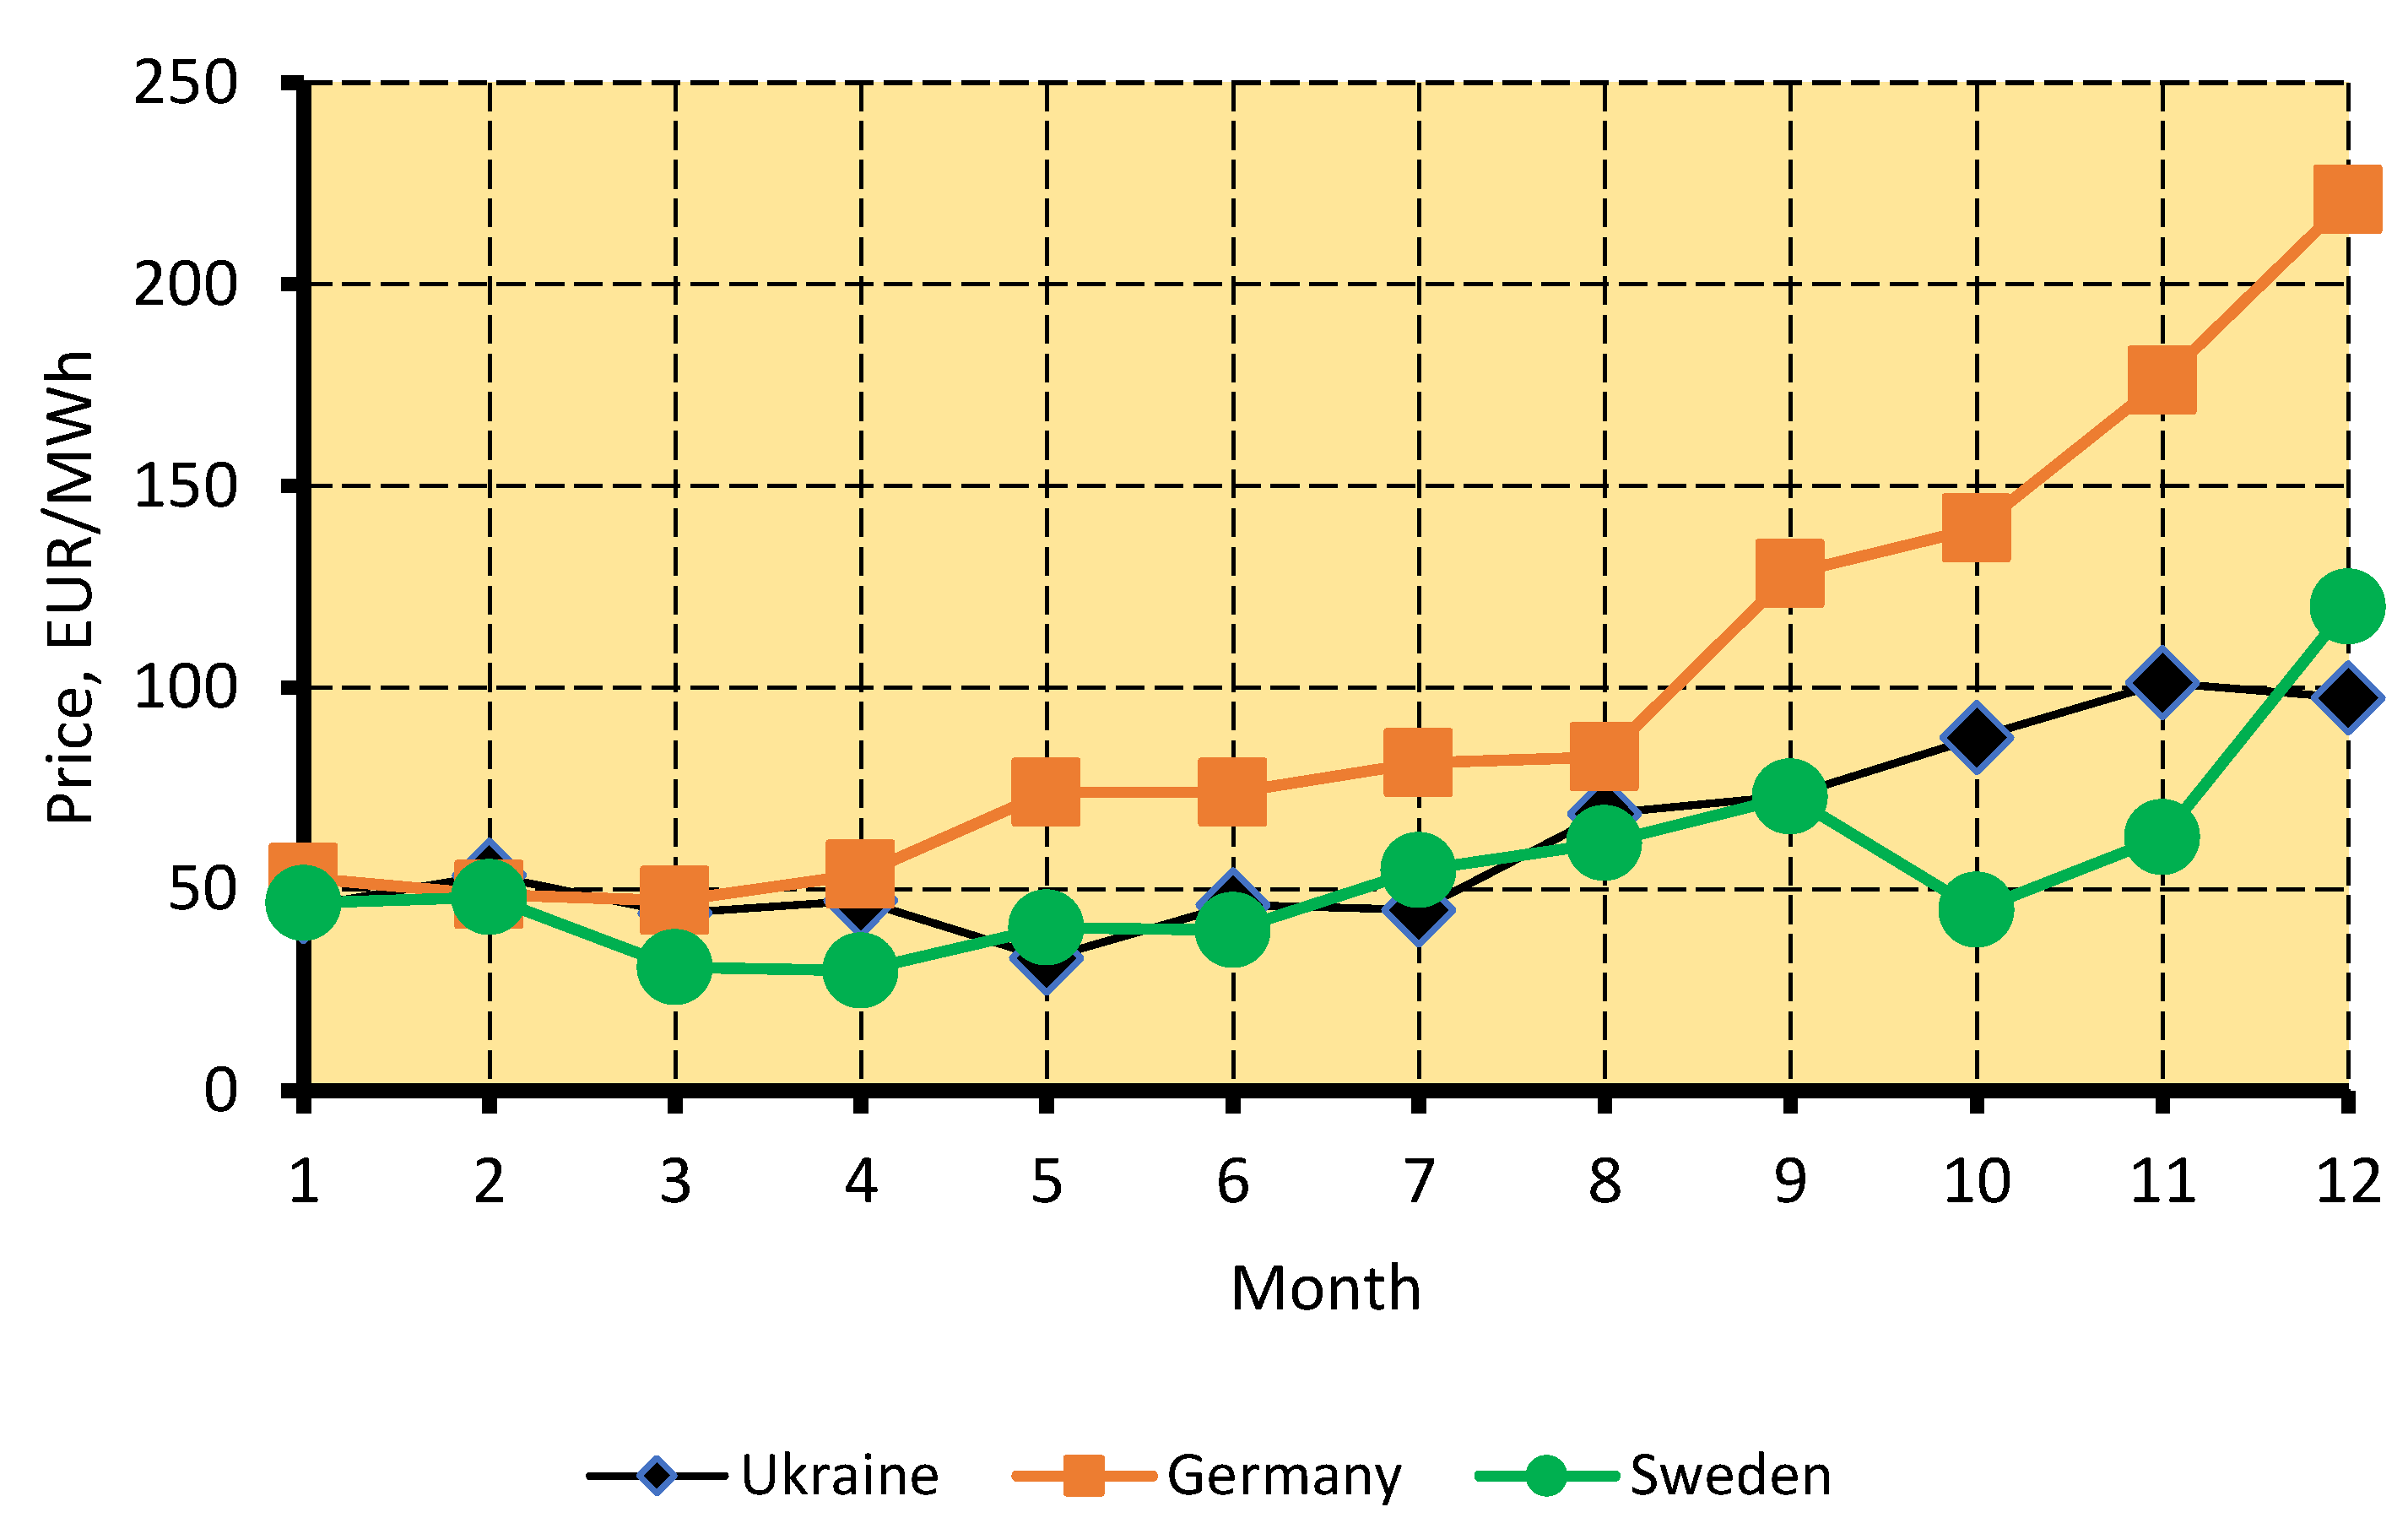
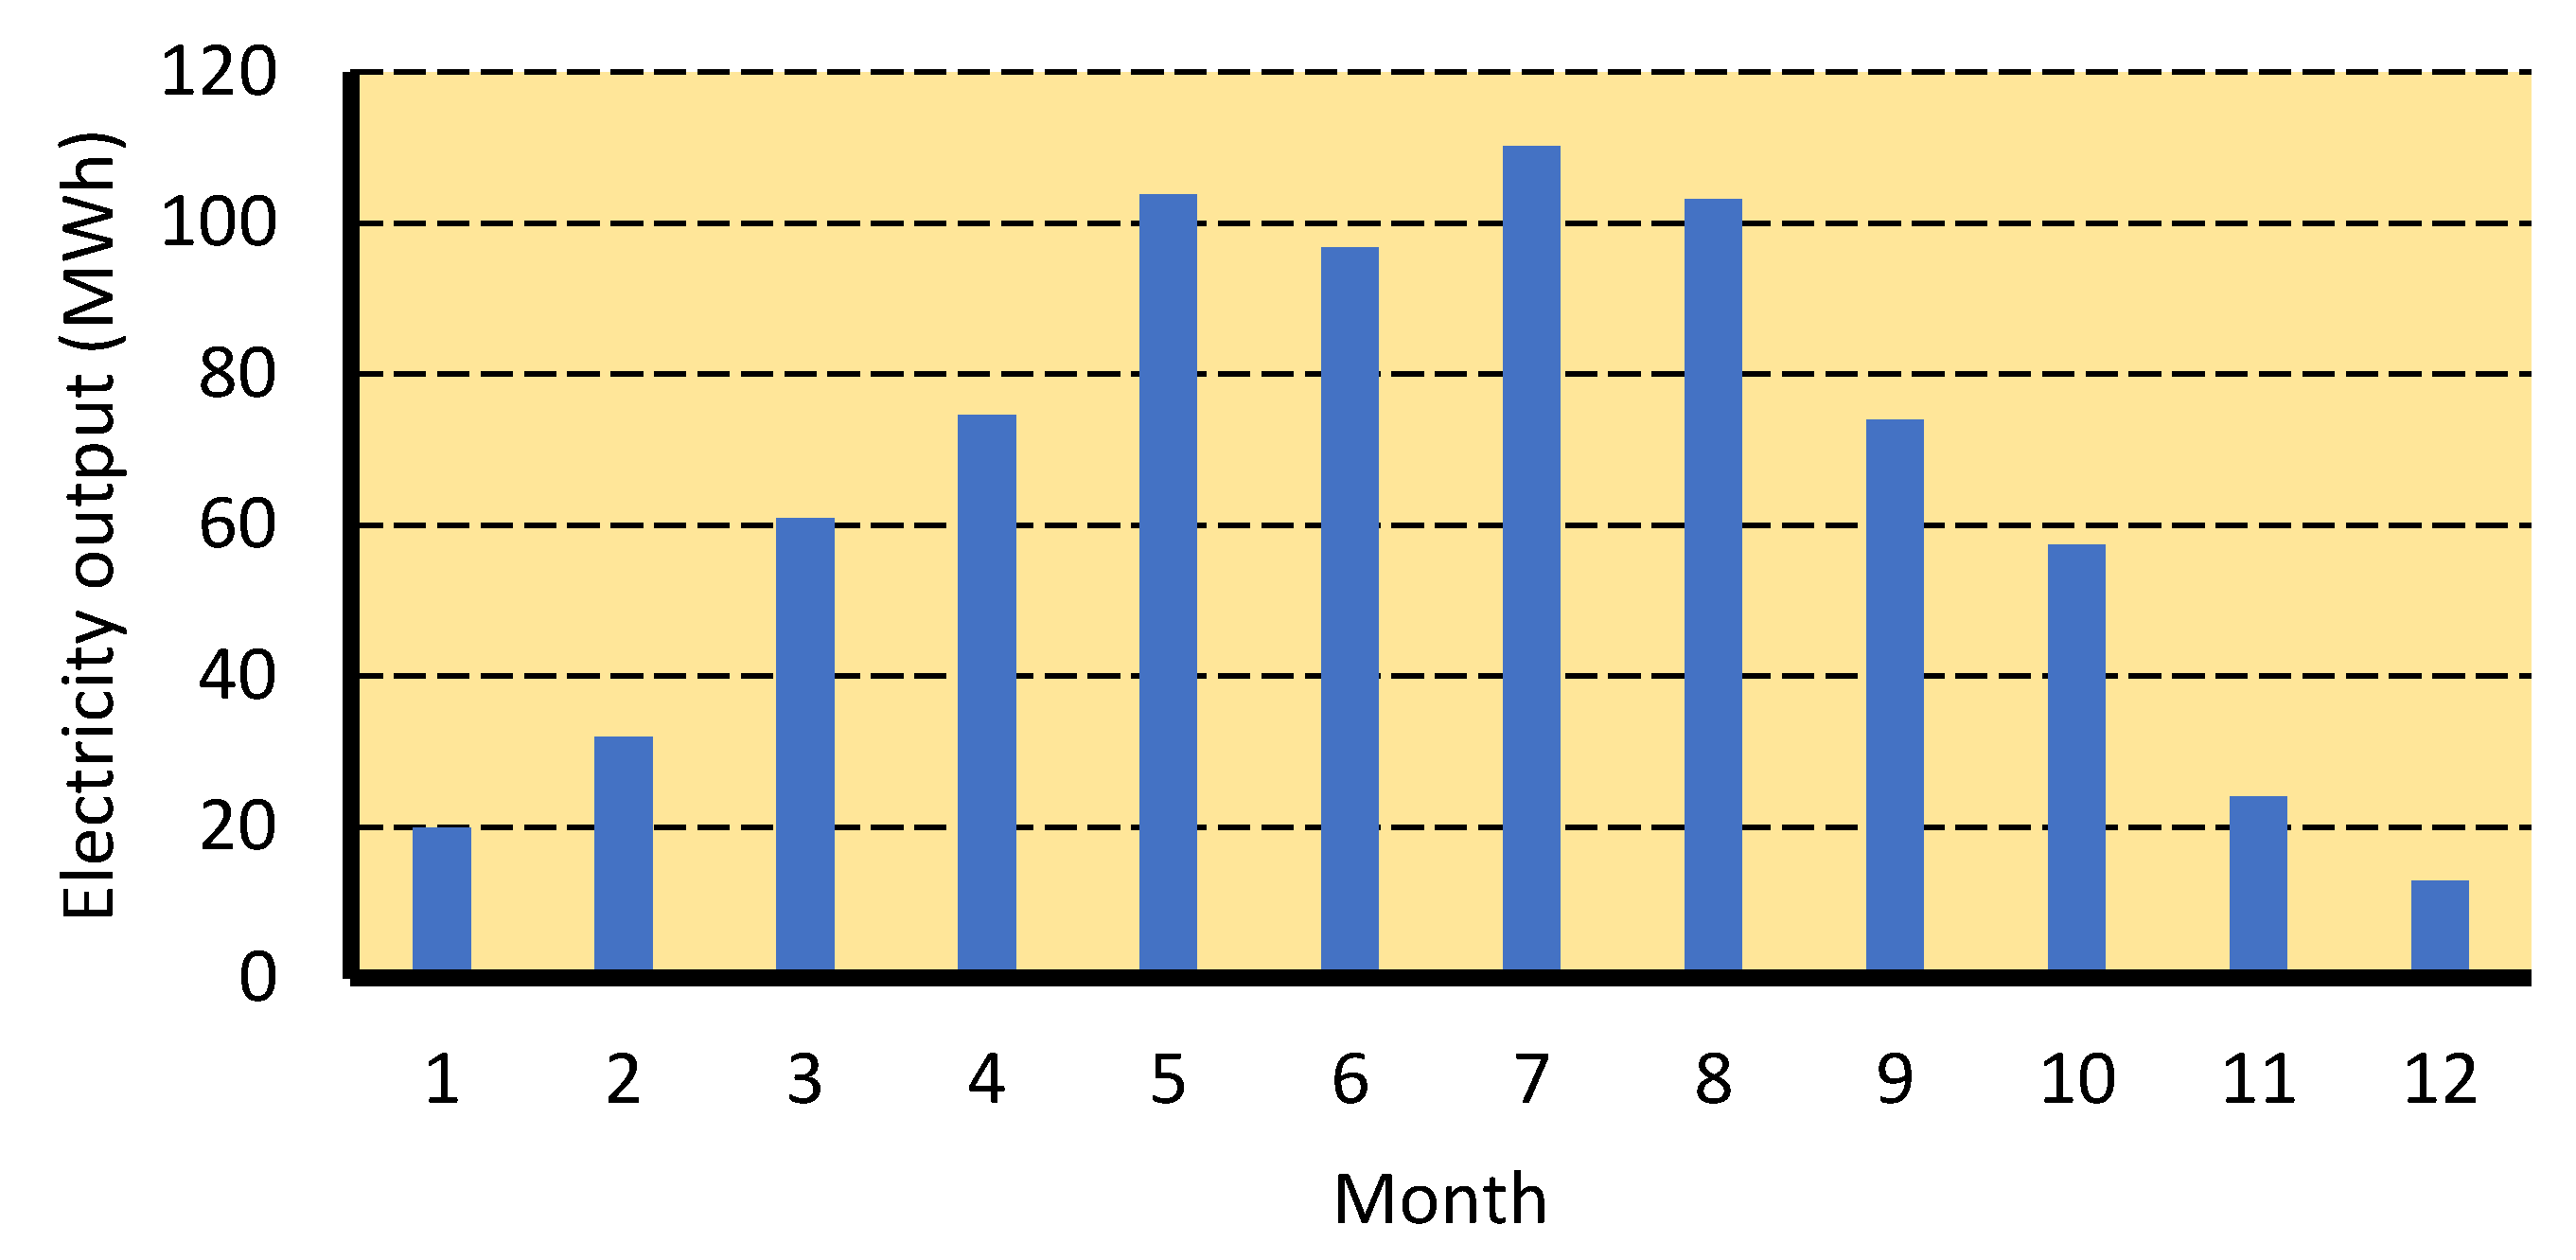
3.5. Power Generation

In Mykolaiv province, the solar field can reach a nominal capacity of 618 kWp/ha. Electricity generation is uneven during the year (Figure 18). The annual generation is around 769.8 MWh. In June 2021, due to cloudy weather, the PV plant generated less than in May 2021. The gross income from PV (82.37 thousand EUR/ha) exceeds one of crop production. Annual gross profit is around 63.8 thousand EUR/ha. However, the payback period exceeds 6 years (Figure 19). Its value has a strong dependence on the discount rate. If the discount rate is 10%, the payback period is more than 15 years. For all cases the profitability index is more than 1.2: discount rate = 0%—PI = 3.24; discount rate = 5%—PI = 1.91; discount rate = 10%—PI = 1.26 (Figure 20). It means that the PV projects are profitable.
The evolution of PV LCOE was analyzed as a function of a discount rate. The discount rate varied between 0% and 10%. The results of the modeling are depicted in Figure 21. Our calculations show that LCOE may be described by a linear dependence on a discount rate. Calculated LCOEs correspond to other research studies. Rodríguez-Martinez and Rodríguez-Monroy [79] modeled photovoltaic systems in Spain. They found that their LCOE ranged from EUR 32/MWh to EUR 62/MWh. Rodriguez-Ossorio et al. [80] reported that LCOE varied from EUR 20/MWh to EUR 40/MWh depending on a discount rate and project lifetime. In 2020 in Europe, utility-scale PV LCOE ranged from EUR 30/MWh in Spain to EUR 50/MWh in Finland. Meanwhile, in Spain and Italy, wholesale electricity prices were lower than PV LCOE [81]. Industrial electricity prices exceeded the PV LCOE. Ukraine had the same situation.
To compare the profitability of PV and crop production, we suggest using an electricity profit to crop production ratio
R P = P V p r o f C p r o f ,
where PVprof is the profit from solar power generation, USD/ha; Cprof is the profit from crop production, USD/ha.
The profit from solar power generation is equal to
P V p r o f = W ( F T P C E ) ,   USD / ha ,
where PCE is the production costs of solar electricity, USD/kWh; FT is the market price of green electricity or feed-in tariff, USD/kWh; W is the solar electricity generated by a PV plant, kWh.
The profit from crop production is
C p r o f = i = 1 n ( C R F i Y i ( M P i P C i ) ) ,   USD / ha .
After substituting Formulas (11) and (12) into Formula (10), we obtain the following expression
R P = W ( F T P C E ) i = 1 n ( C R F i Y i ( M P i P C i ) ) ,   USD / ha .
If the above ratio is more than 1, then electricity generated by land-mounted PV is preferable compared to crop production. PV-to-crop production ratio is depicted in Figure 22. The ratio depends on a discount rate, weather, and market conditions. In any case, its value is not less than 23. Therefore, PV plants have higher profits compared to crop production.

3.6. Carbon Dioxide Emission Saving

The average emission factor of the Ukrainian power generation system is equal to 0.97 kgCO2/kWh [82]. The carbon dioxide emission factor for the Ukrainian coal-fired power plants varies from 0.967 kgCO2/kWh (Zaporizka thermal power plant) to 1.628 kgCO2/kWh (Myronivska thermal power plant). Its average value was 1.105 kgCO2/kWh [83]. Ukrainian nuclear power plants use pressured water reactors. Their carbon dioxide emission factor is in the range of 0.013–0.220 kgCO2/kWh. These values include all life cycle phases such as upstream, operational, and downstream processes [84]. Kadiyala et al. [85] studied the life cycle of carbon dioxide emissions from different hydropower plants. They found that large hydropower plants have a carbon dioxide emission factor in the range of 0.00219–0.237 kgCO2/kWh. Based on the above and a World Nuclear Association report [86], we assume the following carbon dioxide factors, kgCO2/kWh: coal-fired power plants—1.105; nuclear power plants—0.029; hydropower plants—0.026; combined heat and power plants—0.499; wind power plants—0.026.
In 2020, a generation mix was as follows: nuclear power plants—51%; thermal power plants—27%; combined heat and power plants—9%; hydropower plants—5%; renewables—8% [87]. In this case, the average carbon dioxide emission factor is 0.318 kgCO2/kWh. The carbon dioxide intensity of electricity generated in the European Union (average) is 0.407 kgCO2/kWh. Sweden and France have the lowest indicators of 0.025 and 0.092 kgCO2/kWh. Estonia has the worst result (1.152 kgCO2/kWh) [88].
Carbon dioxide emission for PV module production depends on its type. This value ranges from 170 kgCO2/kWp (poly-crystalline) to 360 kgCO2/kWp (mono-crystalline) [47,89]. In any case, the carbon dioxide payback period does not exceed one year (Figure 23). Crop production requires the use of fossil fuels, electricity, fertilizers, chemicals, etc. It results in carbon dioxide emissions. Its value depends on crop cultivar, practice, climate, etc. For most common crops, carbon dioxide emissions range from 500 to 3200 kgCO2/ha (Figure 24) [90,91,92,93,94,95]. The figures reveal that sunflower growing has the smallest carbon dioxide footprint, and corn growing has the highest carbon dioxide emissions. Therefore, PV plants were less carbon dioxide footprints.

3.7. Sensitivity Analysis

The sensitivity analysis examined the possible impact of different variables on the PI. Investment costs, lifetime, annual electricity generation, feed-in tariff, and operational expenses were selected for the sensitivity analysis. The switching value for each variable was calculated. The analysis was carried out for different discount rates (0, 5, and 10%). The base values of variables are summarized in Table 5.
The sensitivity evaluation is presented in Figure 25 and Figure 26. Observation shows that if the discount rate is 0%, then the feed-in tariff has the greatest impact on the PI. Operational expenses have the lowest impact. An increase in the discount rate changes the situation drastically. Operational expenses remain the least sensitive variable. The feed-in tariff also has a significant influence on the PI.

4. Conclusions

There is a trade-off question regarding land allocation between crop cultivation and renewable power generation. Farmers and authorities need to have awareness and tools for decision making. This paper presents an analysis concerning the operating of a PV plant in farmland. This analysis proved that solar power generation reduces the risk to agricultural businesses. The results obtained can be applied to further projects in semi-arid zones. The integrated assessment of economic and carbon dioxide emissions saving for ground-mounted farm PV plants is the novelty of this study.
Climate change results in a rise in air temperature and a decrease in precipitation. Weather conditions make it difficult to get high yields and, therefore, reduce the profitability of an agricultural business. In a recent decade (in Ukraine), there has been a rise in all crop yields, with the exception of corn. In 2021 favorable market prices and weather conditions ensured a high average gross income of USD1244/ha. In less favorable 2020, farmers could get only USD587/ha. Therefore, there is a significant fluctuation in profitability. Similar results were found by Farja and Maciejczak [96].
Solar power generation may be an alternative for farmers. Currently, in Ukraine, a share of renewables and hydroelectricity is 10.7% of the total power generation. Solar power covers 29% of all renewables. Due to advanced technologies, there is a drop in the levelized costs of solar electricity. This fact and the growth of market electricity prices motivate a larger share of renewable power generation, including PV.
In Mykolaiv province, a solar field can have a capacity of 618 kWp and an annual generation of 794.87 MWh. Having sold green electricity (by feed-in tariff), stakeholders can get up to 82.37 thousand EUR/ha. It exceeds revenue from crop cultivation. The profitability index ranges from 1.26 (if a discount rate is 10%) to 3.25 (if a discount rate is 0%). The payback period varies from 6 to 12 years. It depends on the discount rate.
Carbon dioxide footprints of crop production range from 500 to 3200 kgCO2/ha. Corn cultivation has the most emissions. Unlike crop production, PV power plants do not emit greenhouse gases during their operation. However, there are emissions during the manufacturing process. These emissions are in the range of 100–230 tCO2 per hectare of a solar field. Despite the significant value, the carbon dioxide payback period varies from 5 to 10 months. Therefore, life cycle emissions of solar energy are less compared to crop cultivation. The PV systems have proven to be an environmentally friendly energy source. Thus, the results of this study have proved the advanced hypothesis: photovoltaics provides less carbon dioxide emissions and higher profitability than widespread farm practices.
Switching values were calculated for the NPV and PI. The sensitivity analysis indicated that the most significant input variable was a feed-in tariff or electricity price. Operational expenses are the least crucial.
Further research could examine the performance evaluation of hybrid renewable energy sources. Due to Ukrainian farmers’ production being more than 80 million tons of crop residues, we plan to focus on biomass-based combined heat and power plants.

Author Contributions

Conceptualization, V.H. (Valerii Havrysh), V.H. (Vasyl Hruban), E.S., and A.K.; methodology, V.H. (Valerii Havrysh) and A.K.; validation, V.H. (Valerii Havrysh) and A.K.; formal analysis, V.H. (Valerii Havrysh) and A.K.; investigation, V.H. (Valerii Havrysh) and A.K.; resources, V.H. (Valerii Havrysh) and A.K.; data curation, V.H. (Valerii Havrysh), V.H. (Vasyl Hruban), E.S., and A.K.; writing—original draft preparation, V.H. (Valerii Havrysh), V.H. (Vasyl Hruban), E.S., and A.K.; writing—review and editing, V.H. (Valerii Havrysh), V.H. (Vasyl Hruban), E.S., and A.K.; visualization, V.H. (Valerii Havrysh) and A.K.; supervision, V.H. (Valerii Havrysh) and A.K. All authors have read and agreed to the published version of the manuscript.

Funding

This research received no external funding.

Data Availability Statement

The data presented in this study are available on request from the corresponding author.

Conflicts of Interest

The authors declare no conflict of interest.

References

  1. Masson-Delmotte, V.; Zhai, P.; Pörtner, H.O.; Roberts, D.; Skea, J.; Shukla, P.R.; Pirani, A.; Moufouma-Okia, W.; Péan, P.R.; Connors, S.; et al. Global Warming of 1.5 °C. An IPCC Special Report on the Impacts of Global Warming of 1.5 °C Above Pre-Industrial Levels and Related Global Greenhouse Gas Emission Pathways, in the Context of Strengthening the Global Response to the Threat of Climate Change, Sustainable Development, and Efforts to Eradicate Poverty. In Summary for Policymakers; IPCC: Geneva, Switzerland, 2018; Available online: https://www.ipcc.ch/site/assets/uploads/sites/2/2019/05/SR15_SPM_version_report_LR.pdf (accessed on 15 March 2022).
  2. IEA. Global Energy Review 2019. 2020. Available online: https://iea.blob.core.windows.net/assets/dc48c054-9c96-4783-9ef7-462368d24397/Global_Energy_Review_2019.pdf (accessed on 14 March 2022).
  3. IRENA. Global Energy Transformation: A Roadmap to 2050. 2018. Available online: https://www.irena.org/publications/2018/Apr/Global-Energy-Transition-A-Roadmap-to-2050 (accessed on 15 March 2022).
  4. Popp, A.; Calvin, K.; Fujimori, S.; Havlik, P.; Humpenöder, F.; Stehfest, E.; Bodirsky, B.L.; Dietrich, J.P.; Doelmann, J.C.; Gusti, M.; et al. Land-use futures in the shared socio-economic pathways. Glob. Environ. Change 2017, 42, 331–345. [Google Scholar] [CrossRef] [Green Version]
  5. Riahi, K.; van Vuuren, D.P.; Kriegler, E.; Edmonds, J.; O’Neill, B.C.; Fujimori, S.; Bauer, N.; Calvin, K.; Dellink, R.; Fricko, O.; et al. The Shared Socioeconomic Pathways and their energy, land use, and greenhouse gas emissions implications: An overview. Glob. Environ. Change 2017, 42, 153–168. [Google Scholar] [CrossRef] [Green Version]
  6. Rogelj, J.; Popp, A.; Calvin, K.V.; Luderer, G.; Emmerling, J.; Gernaat, D.; Fujimori, S.; Strefler, J.; Hasegawa, T.; Marangoni, G.; et al. Scenarios towards limiting global mean temperature increase below 1.5 °C. Nat. Clim. Change 2018, 8, 325–332. [Google Scholar] [CrossRef]
  7. Smith, P.; Calvin, K.; Nkem, J.; Campbell, D.; Cherubini, F.; Grassi, G.; Korotkov, V.; Le Hoang, A.; Lwasa, S.; McElwee, P.; et al. Which practices co-deliver food security, climate change mitigation and adaptation, and combat land degradation and desertification? Glob. Change Biol. 2020, 26, 1532–1575. [Google Scholar] [CrossRef] [Green Version]
  8. Boysen, L.R.; Lucht, W.; Gerten, D. Trade-offs for food production, nature conservation and climate limit the terrestrial carbon dioxide removal potential. Glob. Change Biol. 2017, 23, 4303–4317. [Google Scholar] [CrossRef]
  9. Kotenko, S.; Nitsenko, V.; Hanzhurenko, I.; Havrysh, V. The Mathematical Modeling Stages of Combining the Carriage of Goods for Indefinite, Fuzzy and Stochastic Parameters. Int. J. Integr. Eng. 2020, 12, 173–180. [Google Scholar] [CrossRef]
  10. Thomas, R.; Reed, M.; Clifton, K.; Appadurai, N.; Mills, A.; Zucca, C.; Kodsi, E.; Sircely, J.; Haddad, F.; Hagen, C.; et al. A framework for scaling sustainable land management options. Land Degrad. Dev. 2018, 29, 3272–3284. [Google Scholar] [CrossRef] [Green Version]
  11. Poggi, F.; Firmino, A.; Amado, M. Planning renewable energy in rural areas: Impacts on occupation and land use. Energy 2018, 155, 630–640. [Google Scholar] [CrossRef]
  12. Aburas, M.M.; Abdullah, S.H.O.; Ramli, M.F.; Asha’ari, Z.H. Land Suitability Analysis of Urban Growth in Seremban Malaysia, Using GIS Based Analytical Hierarchy Process. Procedia Eng. 2017, 198, 1128–1136. [Google Scholar] [CrossRef]
  13. Choi, Y.; Suh, J.; Kim, S.-M. GIS-based solar radiation mapping, site evaluation, and potential assessment: A review. Appl. Sci. 2019, 9, 1960. [Google Scholar] [CrossRef] [Green Version]
  14. Lee, J.; Park, S. Estimation of Biomass Resources Potential. Journal of the Korean Solar Energy Society. Korean Sol. Energy Soc. 2016, 36, 19–26. [Google Scholar] [CrossRef] [Green Version]
  15. Yang, Y.; Hobbie, S.E.; Hernandez, R.R.; Fargione, J.; Grodsky, S.M.; Tilman, D.; Zhu, Y.-G.; Luo, Y.; Smith, T.M.; Jungers, J.M.; et al. Restoring abandoned farmland to mitigate climate change on a full earth. One Earth 2020, 3, 176–186. [Google Scholar] [CrossRef]
  16. Goodrich, A.; James, T.; Woodhouse, M. Residential, Commercial, and Utility-Scale Photovoltaic (PV) System Prices in the United States: Current Drivers and Cost-Reduction Opportunities. Photovolt. Costs U.S. Anal. Prices Trends. 2012. Available online: https://www.nrel.gov/docs/fy12osti/53347.pdf (accessed on 15 March 2022).
  17. International Renewable Energy Agency IRENA, Future of Solar Photovoltaic: Deployment, Investment, Technology, Grid Integration and Socio-Economic Aspects. 2019. Available online: https://www.irena.org/-/media/Files/IRENA/Agency/Publication/2019/Oct/IRENA_Future_of_wind_2019.pdf (accessed on 15 March 2022).
  18. Dijkman, T.J.; Benders, R.M.J. Comparison of renewable fuels based on their land use using energy densities. Renew. Sustain. Energy Rev. 2010, 14, 3148–3155. [Google Scholar] [CrossRef]
  19. Pillot, B.; Al-Kurdi, N.; Gervet, C.; Linguet, L. An integrated GIS and robust optimization framework for solar PV plant planning scenarios at utility scale. Appl. Energy 2020, 260, 114257. [Google Scholar] [CrossRef] [Green Version]
  20. Hertwich, E.G.; Gibon, T.; Bouman, E.A.; Arvesen, A.; Suh, S.; Heath, G.A.; Bergesen, J.D.; Ramirez, A.; Vega, M.I.; Shi, L. Integrated life-cycle assessment of electricity-supply scenarios confirms global environmental benefit of low-carbon technologies. Proc. Natl. Acad. Sci. USA 2015, 112, 6277–6282. [Google Scholar] [CrossRef] [Green Version]
  21. Moscatelli, M.C.; Marabottini, R.; Massaccesi, L.; Marinari, S. Soil properties changes after seven years of ground mounted photovoltaic panels in Central Italy coastal area. Geoderma Reg. 2022, 29, e00500. [Google Scholar] [CrossRef]
  22. Charabi, Y.; Gastli, A. PV site suitability analysis using GIS-based spatial fuzzy multi-criteria evaluation. Renew. Energy 2011, 36, 2554–2561. [Google Scholar] [CrossRef]
  23. Kienast, F.; Huber, N.; Hergert, R.; Bolliger, J.; Moran, L.S.L.S.; Hersperger, A.M.A.M. Conflicts between decentralized renewable electricity production and landscape services—A spatially-explicit quantitative assessment for Switzerland. Renew. Sustain. Energy Rev. 2017, 67, 397–407. [Google Scholar] [CrossRef]
  24. Breyer, C.; Bogdanov, D.; Gulagi, A.; Aghahosseini, A.; Barbosa, L.S.N.S.; Koskinen, O.; Barasa, M.; Caldera, U.; Afanasyeva, S.; Child, M.; et al. On the role of solar photovoltaics in global energy transition scenarios. Prog. Photovolt. Res. Appl. 2017, 25, 727–745. [Google Scholar] [CrossRef]
  25. Jacobson, M.Z.; Delucchi, M.A.; Bauer, Z.A.F.; Goodman, S.C.; Chapman, W.E.; Cameron, M.A.; Bozonnat, C.; Chobadi, L.; Clonts, H.A.; Enevoldsen, P.; et al. 100% clean and renewable wind, water, and sunlight all-sector energy roadmaps for 139 countries of the world. Joule 2017, 1, 108–121. [Google Scholar] [CrossRef] [Green Version]
  26. van de Ven, D.J.; Capellan-Peréz, I.; Arto, I.; Cazcarro, I.; de Castro, C.; Patel, P.; Gonzalez-Eguino, M. The potential land requirements and related land use change emissions of solar energy. Sci. Rep. 2021, 11, 2907. [Google Scholar] [CrossRef] [PubMed]
  27. Elshout, P.; van Zelm, R.; Balkovic, J.; Obersteiner, M.; Schmid, E.; Skalsky, R.; Van Der Velde, M.; Huijbregts, M.A.J. Greenhouse-gas payback times for crop-based biofuels. Nat. Clim. Change 2015, 5, 604–610. [Google Scholar] [CrossRef]
  28. Kalinichenko, A.; Havrysh, V. Feasibility study of biogas project development: Technology maturity, feedstock, and utilization pathway. Arch. Environ. Prot. 2019, 45, 68–83. [Google Scholar] [CrossRef]
  29. Hall, C.; Balogh, S.; Murphy, D. What Is the Minimum EROI That a Sustainable Society Must Have? Energies 2009, 2, 25–47. [Google Scholar] [CrossRef]
  30. Capellán-Pérez, I.; de Castro, C.; Miguel González, L.J. Dynamic Energy Return on Energy Investment (EROI) and Material Requirements in Scenarios of Global Transition to Renewable Energies. Energy Strategy Rev. 2019, 26, 100399. [Google Scholar] [CrossRef]
  31. Fizaine, F.; Court, V. Energy Expenditure, Economic Growth, and the Minimum EROI of Society. Energy Policy 2016, 95, 172–186. [Google Scholar] [CrossRef]
  32. Lambert, J.G.; Hall, C.A.S.; Balogh, S.; Gupta, A.; Arnold, M. Energy, EROI and Quality of Life. Energy Policy 2014, 64, 153–167. [Google Scholar] [CrossRef] [Green Version]
  33. Bhandari, K.P.; Collier, J.M.; Ellingson, R.J.; Apul, D.S. Energy Payback Time (EPBT) and Energy Return on Energy Invested (EROI) of Solar Photovoltaic Systems: A Systematic Review and Meta-Analysis. Renew. Sustain. Energy Rev. 2015, 47, 133–141. [Google Scholar] [CrossRef]
  34. Prananta, W.; Kubiszewski, I. Assessment of Indonesia’s Future Renewable Energy Plan: A Meta-Analysis of Biofuel Energy Return on Investment (EROI). Energies 2021, 14, 2803. [Google Scholar] [CrossRef]
  35. Jäger-Waldau, A. Snapshot of Photovoltaics—February 2020. Energies 2020, 13, 930. [Google Scholar] [CrossRef] [Green Version]
  36. Hoffacker, M.K.; Allen, M.F.; Hernandez, R.R. Land-Sparing Opportunities for Solar Energy Development in Agricultural Landscapes: A Case Study of the Great Central Valley, CA, United States. Environ. Sci. Technol. 2017, 51, 14472–14482. [Google Scholar] [CrossRef] [PubMed] [Green Version]
  37. Cialdea, D.; Maccarone, A. The Energy Networks Landscape. Impacts on Rural Land in the Molise Region. TeMA-J. Land Use Mobil. Environ. 2014, 14, 223–234. [Google Scholar] [CrossRef]
  38. Roy, S.; Ghosh, B. Land utilization performance of ground mounted photovoltaic power plants: A case study. Renew. Energy 2017, 114, 1238–1246. [Google Scholar] [CrossRef]
  39. Maye, D. The New Food Insecurity. In Routledge Handbook of Landscape and Food; Zeunert, J., Waterman, T., Eds.; Routledge: London, UK, 2014; pp. 380–390. Available online: https://www.routledgehandbooks.com/doi/10.4324/9781315647692-26 (accessed on 15 March 2022).
  40. Sacchelli, S.; Garegnani, G.; Geri, F.; Grilli, G.; Paletto, A.; Zambelli, P.; Ciolli, M.; Vettorato, D. Trade-off between photovoltaic systems installation and agricultural practices on arable lands: An environmental and socio-economic impact analysis for Italy. Land Use Policy 2016, 56, 90–99. [Google Scholar] [CrossRef] [Green Version]
  41. Turconi, R.; Boldrin, A.; Astrup, T. Life cycle assessment (LCA) of electricitygeneration technologies: Overview, comparability and limitations. Renew. Sust. Energ. Rev. 2013, 28, 555–565. [Google Scholar] [CrossRef] [Green Version]
  42. Dubey, S.; Jadhav, N.Y.; Zakirova, B. Socio-economic and environmental impacts of silicon based photovoltaic (PV) technologies. Energy Procedia 2013, 33, 322–334. [Google Scholar] [CrossRef] [Green Version]
  43. Hastik, R.; Basso, S.; Geitner, C.; Haida, C.; Poljanec, A.; Portaccio, A.; Vrščcaj, B.; Walzer, C. Renewable energies and ecosystem service impacts. Renew. Sust. Energ. Rev. 2015, 48, 608–623. [Google Scholar] [CrossRef]
  44. Sliz-Szkliniarz, V.B. Assessment of the renewable energy-mix and land usetrade-off at a regional level: A case study for the Kujawsko–Pomorskie. Land Use Policy 2013, 35, 257–270. [Google Scholar] [CrossRef]
  45. Calvert, K.; Mabee, W. More solar farms or more bioenergy crops? Mapping and assessing potential land-use conflicts among renewable energy technologies in eastern Ontario, Canada. Appl. Geogr. 2015, 56, 209–221. [Google Scholar] [CrossRef]
  46. Dupraz, C.; Marrou, H.; Talbot, G.; Dufour, L.; Nogier, A.; Ferard, Y. Combining solar photovoltaic panels and food crops for optimising land use: Towards new agrivoltaic schemes. Renew. Energ. 2011, 36, 2725–2732. [Google Scholar] [CrossRef]
  47. Hammad, M.; Ebaid, M.S.Y. Comparative economic viability and environmental impact of PV, diesel and grid systems for large underground water pumping application (55 wells) in Jordan. Renewables 2015, 2, 12. [Google Scholar] [CrossRef] [Green Version]
  48. Kalinichenko, A.; Havrysh, V.; Perebyynis, V. Sensitivity analysis in investment project of biogas plant. Appl. Ecol. Env. Res. 2017, 15, 969–985. [Google Scholar] [CrossRef]
  49. Brzozowska, A.; Bubel, D.; Kalinichenko, A.; Nekrasenko, L. Transformation of the agricultural financial system in the age of globalisation. Agric. Econ. 2017, 63, 548–558. [Google Scholar] [CrossRef] [Green Version]
  50. International Renewable Energy Agency. Session 3: Economic Assessment of PV and Wind for Energy Planning. Available online: https://www.irena.org/-/media/Files/IRENA/Agency/Events/2014/Jul/15/15_Economic_assessment_of_PV_and_wind_for_energy_planning_Arusha_Tanzania.pdf?la=en&hash=ED061A535145DD86023F615866220C220B601FFC (accessed on 15 March 2022).
  51. Dubey, S.; Sarvaiya, J.N.; Seshadri, B. Temperature Dependent Photovoltaic (PV) Efficiency and Its Effect on PV Production in the World A Review. Energy Procedia 2013, 33, 311–321. [Google Scholar] [CrossRef] [Green Version]
  52. Oladigbolu, J.O.; Al-Turki, Y.A.; Olatomiwa, L. Comparative study and sensitivity analysis of a standalone hybrid energy system for electrification of rural healthcare facility in Nigeria. Alex. Engineer. J. 2021, 60, 5547–5565. [Google Scholar] [CrossRef]
  53. Nacer, T.; Hamidat, A.; Nadjemi, O.; Bey, M. Feasibility study of grid connected photovoltaic system in family farms for electricity generation in rural areas. Renew. Energy 2016, 96, 305–318. [Google Scholar] [CrossRef]
  54. Havrysh, V.; Kalinichenko, A.; Mentel, G.; Mentel, U.; Vasbieva, D.G. Husk Energy Supply Systems for Sunflower Oil Mills. Energies 2020, 13, 361. [Google Scholar] [CrossRef] [Green Version]
  55. Havrysh, V.; Hruban, V.; Sadovoy, O.; Kalinichenko, A.; Taikhrib, K. Sustainable Energy Supply Based on Sunflower Seed Husk for Oil Mills. In Proceedings of the International Conference on Modern Electrical and Energy Systems (MEES), Kremenchuk, Ukraine, 23–25 September 2019. [Google Scholar] [CrossRef]
  56. Jakhrani, A.Q.; Othman, A.; Rigit, A.R.H.; Samo, S.R.; Kamboh, S.A. Sensitivity Analysis of a Standalone Photovoltaic System Model Parameters. J. Appl. Sci. 2013, 13, 220–231. [Google Scholar] [CrossRef]
  57. Iloiu, M.; Csiminga, D. Project Risk Evaluation Methods-Sensitivity Analysis. Ann. Univ. Petrosani Econ. 2009, 9, 33–38. Available online: https://ideas.repec.org/a/pet/annals/v9i2y2009p33-38.html (accessed on 15 March 2022).
  58. Monthly and Annual Precipitation in Nikolaev. 2021. Available online: http://www.pogodaiklimat.ru/history/33846_2.htm (accessed on 5 December 2021).
  59. IRENA. Renewable Power Generation Costs in 2020; International Renewable Energy Agency: Abu Dhabi, United Arab Emirates, 2021; Available online: https://www.irena.org/publications/2021/Jun/Renewable-Power-Costs-in-2020 (accessed on 26 December 2021).
  60. Global Petrol Prices. Ukraine Electricity Prices. Available online: https://www.globalpetrolprices.com/Ukraine/electricity_prices/ (accessed on 26 December 2021).
  61. Liga.Biznes. Ukraine Again Faced a Shortage of Coal at Power Plants. Available online: https://biz.liga.net/ekonomika/tek/cards/ukraina-vnov-stolknulas-s-nehvatkoy-uglya-na-elektrostantsiyah-nastupit-blekaut-razbor (accessed on 26 December 2021).
  62. The Cost of Electricity Produced by Ukrainian Thermal Power Plants Grew by 16% over the Month to a New Record. Available online: https://hromadske.ua/ru/amp/posts/stoymost-elektroenerhyy-proyzvedennoi-ukraynskymy-tes-za-mesiats-vyrosla-na-16-do-novoho-rekorda-nashy-denhy (accessed on 26 December 2021).
  63. Feed-in Tariff: New Rats. Available online: https://home.kpmg/ua/en/home/insights/2020/08/fit.html (accessed on 26 December 2021).
  64. International Energy Agency; Nuclear Energy Agency. Fuel Report—December 2020. In Projected Costs of Generating Electricity; 2020 edition; Available online: https://www.oecd-nea.org/upload/docs/application/pdf/2020-12/egc-2020_2020-12-09_18-26-46_781.pdf (accessed on 26 December 2021).
  65. Average Monthly Electricity Wholesale Prices in Selected Countries in the European Union (EU) from January 2020 to January 2022. Available online: https://www.statista.com/statistics/1267500/eu-monthly-wholesale-electricity-price-country/ (accessed on 15 March 2022).
  66. Purchase Prices on the Day-Ahead Market for Group b Consumers in 2021. Available online: https://tek.energy/electricity/prices (accessed on 20 December 2021).
  67. Electricity Prices for Non-Household Consumers. Available online: https://ec.europa.eu/eurostat/statistics-explained/index.php?title=Electricity_price_statistics#Electricity_prices_for_non-household_consumers (accessed on 20 December 2021).
  68. BP Statistical Review of World Energy. 2021. Available online: https://www.bp.com/content/dam/bp/business-sites/en/global/corporate/pdfs/energy-economics/statistical-review/bp-stats-review-2021-full-report.pdf (accessed on 26 December 2021).
  69. IRENA. Energy Profile of Ukraine. 2021. Available online: https://www.irena.org/IRENADocuments/Statistical_Profiles/Europe/Ukraine_Europe_RE_SP.pdf (accessed on 26 December 2021).
  70. State Statistics Service of Ukraine. Plant Growing in Ukraine 2020. Kyiv; 2021. Available online: http://www.ukrstat.gov.ua/druk/publicat/kat_u/2021/zb/05/zb_rosl_2020.pdf (accessed on 15 December 2021).
  71. Agriculture of Ukraine. Statistical Yearbook 2020. Kyiv; 2021. Available online: http://www.ukrstat.gov.ua/druk/publicat/kat_u/2019/zb/09/Zb_sg_2020.pdf (accessed on 15 December 2021).
  72. Crop Production of Ukraine 2019. Statistical Yearbook. Kyiv; 2020. Available online: http://www.ukrstat.gov.ua/druk/publicat/kat_u/2020/zb/04/zb_rosl_2019.pdf (accessed on 15 December 2021).
  73. Agrotender. Available online: https://agrotender.com.ua/traders/region_ukraine/yachmen (accessed on 15 December 2021).
  74. Equator of the Grain Season-2019/20 in Ukraine: Success & Challenges. Available online: https://www.apk-inform.com/ru/exclusive/topic/1507460 (accessed on 29 December 2021).
  75. Ukraine: Average Demand Prices for Grains and Oilseeds (13.06–20.06.2019). Available online: https://www.apk-inform.com/ru/news/price/1500863 (accessed on 29 December 2021).
  76. United States Department of Agriculture, Foreign Agricultural Service. Grain and Feed Annual. Ukraine. UP2021-0017; 2021. Available online: https://apps.fas.usda.gov/newgainapi/api/Report/DownloadReportByFileName?fileName=Grain%20and%20Feed%20Annual_Kyiv_Ukraine_04-15-2021 (accessed on 15 March 2022).
  77. United States Department of Agriculture, Foreign Agricultural Service. Oilseeds and Products Annual. Ukraine. UP2021-0016; 2021. Available online: https://apps.fas.usda.gov/newgainapi/api/Report/DownloadReportByFileName?fileName=Oilseeds%20and%20Products%20Annual_Kyiv_Ukraine_04-15-2021 (accessed on 15 March 2022).
  78. Costs of Agricultural Production in Enterprises in 2020. Available online: http://www.ukrstat.gov.ua/operativ/operativ2018/sg/vytr_na%20ver_sg_prod/arch_vytr_na%20ver_sg_prod_u.htm (accessed on 29 December 2021).
  79. Rodríguez-Martinez, Á.; Rodríguez-Monroy, C. Economic Analysis and Modelling of Rooftop Photovoltaic Systems in Spain for Industrial Self-Consumption. Energies 2021, 14, 7307. [Google Scholar] [CrossRef]
  80. Rodríguez-Ossorio, R.-J.; González-Martínez, A.; de Simón-Martín, M.; Diez-Suárez, A.-M.; Colmenar-Santos, A.; Rosales-Asensio, E. Levelized cost of electricity for the deployment of solar photovoltaic plants: The region of León (Spain) as case study. Energy Rep. 2021, 7, 199–203. [Google Scholar] [CrossRef]
  81. SolarPower Europe. EU Market Outlook for Solar Power 2020–2024. Report 2020. Available online: https://www.solarpowereurope.org/european-market-outlook-for-solar-power-2020-2024/ (accessed on 20 December 2021).
  82. Zachmann, G. Reaching Ukraine’s Energy and Climate Targets; Berlin Economics: Berlin, Germany; Available online: https://www.lowcarbonukraine.com/wp-content/uploads/LCU_Reaching-Ukraines-energy-and-climate-targets.pdf (accessed on 29 December 2021).
  83. Shlapak, M. Carbon Emission Factor for Ukrainian Electricity Grid. 2017. Available online: https://www.linkedin.com/pulse/carbon-emission-factor-ukrainian-electricity-grid-mykola-shlapak/?articleId=6324279390976962560 (accessed on 29 December 2021).
  84. Warner, E.S.; Heath, G.A. Life Cycle Greenhouse Gas Emissions of Nuclear Electricity Generation. J. Ind. Ecol. 2012, 16 (Suppl. 1), 73–92. [Google Scholar] [CrossRef]
  85. Kadiyala, A.; Kommalapati, R.; Huque, Z. Evaluation of the Life Cycle Greenhouse Gas Emissions from Hydroelectricity Generation Systems. Sustainability 2016, 8, 539. [Google Scholar] [CrossRef] [Green Version]
  86. World Nuclear Association Report. Comparison of Lifecycle Greenhouse Gas Emissions of Various Electricity Generation Sources. July 2011. Available online: http://www.world-nuclear.org/uploadedFiles/org/WNA/Publications/Working_Group_Reports/comparison_of_lifecycle.pdf (accessed on 29 December 2021).
  87. Ukrenergo. In 2020, the Installed Capacity of WPPs and SPPs Increased by 41% and Their Share in the Generation Mix Doubled. Available online: https://ua.energy/general-news/in-2020-the-installed-capacity-of-wpps-and-spps-increased-by-41-and-their-share-in-the-generation-mix-doubled/ (accessed on 29 December 2021).
  88. Moro, A.; Lonza, L. Electricity carbon intensity in European Member States: Impacts on GHG emissions of electric vehicles. Transp. Res. Part D 2018, 64, 5–14. [Google Scholar] [CrossRef]
  89. Hou, G.; Sun, H.; Jiang, Z.; Pan, Z.; Wang, Y.; Zhang, X.; Zhao, Y.; Yao, Q. Life cycle assessment of grid-connected photovoltaic power generation from crystalline silicon solar modules in China. Appl. Energy 2016, 164, 882–890. [Google Scholar] [CrossRef]
  90. Holka, M.; Bieńkowski, J. Carbon Footprint and Life-Cycle Costs of Maize Production in Conventional and Non-Inversion Tillage Systems. Agronomy 2020, 10, 1877. [Google Scholar] [CrossRef]
  91. O’Neill, M.; Lanigan, G.J.; Forristal, P.D.; Osborne, B.A. Greenhouse Gas Emissions and Crop Yields From Winter Oilseed Rape Cropping Systems are Unaffected by Management Practices. Front. Environ. Sci. 2021, 9, 716636. [Google Scholar] [CrossRef]
  92. Debaeke, P.; Casadebaig, P.; Flenet, F.; Langlade, N. Sunflower crop and climate change: Vulnerability, adaptation, and mitigation potential from case-studies in Europe. OCL 2017, 24, D102. [Google Scholar] [CrossRef] [Green Version]
  93. Rajaniemi, M.; Mikkola, H.J.; Ahokas, J. Greenhouse Gas Emissions from Oats, Barley, Wheat and Rye Production. Agron. Res. 2011, 9, 189–194. Available online: https://agronomy.emu.ee/vol09Spec1/p09s123.pdf (accessed on 20 December 2021).
  94. Gan, Y.; Liang, C.; Chai, Q.; Lemke, R.L.; Campbell, C.A.; Zentner, R.P. Improving farming practices reduces the carbon footprint of spring wheat production. Nat. Commun. 2014, 5, 5012. [Google Scholar] [CrossRef] [Green Version]
  95. Gan, Y.; Liang, C.; May, W.E.; Malhi, S.S.; Niu, J.; Wang, X. Carbon footprint of spring barley in relation to preceding oilseeds and N fertilization. Int. J. Life Cycle Assess. 2012, 17, 635–645. [Google Scholar] [CrossRef]
  96. Farja, Y.; Maciejczak, M. Economic Implications of Agricultural Land Conversion to Solar Power Production. Energies 2021, 14, 6063. [Google Scholar] [CrossRef]
Figure 1. Steps of the research methodology.
Sustainability 14 05099 g001
Figure 2. The system boundaries for crop production.
Sustainability 14 05099 g002
Figure 3. The system boundaries for photovoltaics.
Sustainability 14 05099 g003
Figure 4. The solar PV power field (Mykolaiv province).
Sustainability 14 05099 g004
Figure 5. Precipitation for the Mykolaiv province (the South of Ukraine, 1970–2020).
Sustainability 14 05099 g005
Figure 6. Average annual air temperature in the Mykolaiv province.
Sustainability 14 05099 g006
Figure 7. Air temperature during 2021.
Sustainability 14 05099 g007
Figure 8. Sun irradiation during 2021.
Sustainability 14 05099 g008
Figure 9. Average wind speed during 2021.
Sustainability 14 05099 g009
Figure 10. Levelized cost of electricity.
Sustainability 14 05099 g010
Figure 11. The evolution of wholesale electricity price in Ukraine and selected EU countries in 2021.
Sustainability 14 05099 g011
Figure 12. Shares of renewables.
Sustainability 14 05099 g012
Figure 13. Shares of renewable generation.
Sustainability 14 05099 g013
Figure 14. Yield history of cereal crops.
Sustainability 14 05099 g014
Figure 15. Yield history of oil crops.
Sustainability 14 05099 g015
Figure 16. Gross income from crop production.
Sustainability 14 05099 g016
Figure 17. Gross profit from crop production.
Sustainability 14 05099 g017
Figure 18. Electricity output by month (2021).
Sustainability 14 05099 g018
Figure 19. Net present value.
Sustainability 14 05099 g019
Figure 20. Profitability index.
Sustainability 14 05099 g020
Figure 21. LCOE versus a discount rate.
Sustainability 14 05099 g021
Figure 22. PV-to-crop production ratio versus a discount rate.
Sustainability 14 05099 g022
Figure 23. Carbon dioxide emission savings.
Sustainability 14 05099 g023
Figure 24. Carbon dioxide footprints of crop cultivation.
Sustainability 14 05099 g024
Figure 25. Sensitivity analysis (NPV).
Sustainability 14 05099 g025
Figure 26. Sensitivity analysis (PI).
Sustainability 14 05099 g026
Table 1. Primary energy consumption.
IndicatorUnitWorldUkraine
TotalExajoules556.633.31
HydroelectricityExajoules38.160.06
RenewablesExajoules31.710.09
Total hydroelectricity and renewablesExajoules69.870.15
Share of hydroelectricity and renewables%12.554.53
Table 2. Electricity generation.
IndicatorUnitWorldUkraine
TotalTWh26,823.2149.0
HydroelectricityTWh4296.86.3
RenewablesTWh3147.09.7
Total hydroelectricity and renewablesTWh7443.816.0
Share of hydroelectricity and renewables%27.810.7
Table 3. Crop rotation factors.
CropMinimumMaximumAverage
Wheat0.2480.3060.290
Barley0.1940.3270.237
Corn0.0400.1030.082
Sunflower0.3030.4120.356
Rapeseed0.0070.0600.035
Table 4. Crops yields, t/ha.
CropMinimumMaximumAverage
Wheat1.6404.1993.081
Barley1.2903.7662.556
Corn2.4905.1703.912
Sunflower1.3502.1701.803
Rapeseed1.3102.5761.936
Table 5. Sensitivity variables and their base value.
ParameterUnitValue
Investment costsThousand EUR432.85
LifetimeYear25
Gross income Thousand EUR82.37
Annual electricity generation MWh794.87
Feed-in tariffEUR/MWh107.00
Operational expensesThousand EUR18.50
Publisher’s Note: MDPI stays neutral with regard to jurisdictional claims in published maps and institutional affiliations.

