Abstract
Renewable energy policies, such as feed-in-tariffs (FiTs) and subsidy policies, have been reported effective in enhancing the social acceptability to install solar photovoltaic (PV) systems. Nevertheless, a quantitative assessment approach is still needed to measure the extent to which these policies can achieve the clean energy goals and support the decision-making process. This study, therefore, develops system dynamics models to assess the impacts of PV policies on the social acceptability to install PV systems, energy security, and CO2 emission reduction in the small-scale sector in Jordan. Simulation was then conducted from the period 2016 to 2050. The results for the FiTs (subsidy) policies showed that the predicted accumulated PV installations, power generated, and CO2 emission reductions will reach 67.125 (88.38) Gigawatt (GW), 115.853 (152.588) Terra Wh (TWh), and 74.49 (98.114) million tons CO2, respectively. To achieve these goals, the required cumulative FiTs and subsidy policy costs are 2.2 and 7.59 billion USD, respectively. Sensitivity analyses followed to determine the optimal FiTs price and subsidy proportion that optimize PV goals under uncertainty. In conclusion, the developed models are found valuable tools for measuring the impacts of energy policies on PV goals and thereby provide great input information to the decision-making processes when selecting the appropriate energy policies and actions. In the end, adopting FiTs and/or subsidy policies, Jordan is expected to achieve a high level of clean energy security by 2050, which enhances energy capabilities and mitigates global warming. Future research will examine the factors that affect social acceptability for PV systems.
1. Introduction
Rapid economic development and growth of the world have led to continued rise in energy demand and thereby resulted in excessive depletion of natural resources, which now threaten global energy security. Therefore, saving energy, environmental awareness, and cleaner energy production are among the highest priorities and can be viewed as the critical challenges facing the world [1]. As a result, all countries have become convinced of the importance of addressing environmental problems by adopting renewable energy technologies that reduce pressure on the environment and use rates of fossil energy. The electricity generation sector has been considered as one of the largest contributors to global greenhouse gas emissions due to its great reliance on fossil fuels. The shift towards solar energy; or so-called photovoltaic (PV) system, continues and has been strengthened with technological innovations that have lower production costs, improved storage options, and reduced harmful emissions to the environment.
In Jordan, the energy sector is among the highest in the world in dependency on foreign energy sources, with 94% of the country’s energy needs in 2018 coming from imported oil and natural gas, 10% of the country’s gross domestic product [2,3]. Specifically, Jordan faces challenges in the energy sector because of the increasing energy demand that is from the result of population growth, increased per capita consumption and electricity tariffs, and cross-subsidies due to countries with limited resources. Studies [4,5] showed that 6% of Jordan’s primary energy sources in 2025 will be generated from renewable energy. The forecasted electrical energy demand is 27.285 Terra Wh (TWh) in 2025, while it is 33,832 Giga Wh (GWh) in 2030. The growth percentage in the needed electrical energy is about 3.1%. Finally, the household consumed about 46% of the electrical energy consumption. As a result, Jordan’s top priority is achieving energy supply security, eliminating its dependence on imports while meeting the growing demand for primary energy [6]. Further, the high consumption of fossil fuels increases carbon dioxide emissions and consequently causes global warming and climate change. Fortunately, the energy sector in Jordan is endowed with an abundance of solar energy, which is evident from the annual daily average solar irradiance on a horizontal surface range of between 5–7 kWh/m2, one of the highest figures in the world. Jordan is on pace to exceed 20% of generated electricity from renewable sources by 2020 [7,8]. Recently, solar energy applications have gained more attention to substitute depletion of fossil fuel, reduce dependency on imported energy, and improve social and environmental benefits. For example, Jabera and Abul Hawa [9] conducted feasibility and reliability analyses of a PV grid-connected system and life cycle cost and payback period criterion to determine the optimal design of a PV system in a passive residential building in a Mediterranean climate. Hussein [10] examined the greenhouse gas emissions reduction potential of Jordan’s utility scale wind and solar projects. The study revealed that the solar and wind project will result in a significant reduction of the country’s projected greenhouse gas emissions of 1.93–3.21 mega tons of CO2 emissions annually. Alawneh et al. [11] overviewed the off-grid PV installations and presented the present status of PV market in Jordan after activating the Renewable Energy and Efficiency Law in Jordan in year 2014. The results showed that the total PV installed capacity in Jordan exceeded 300 MW distributed in large-, medium-, and small-scale projects, according to the kind of installation, whether it is energy net metering, power wheeling, or power purchase agreement.
Further, PV energy policies can be adopted to enhance the social acceptability of installing PV systems. Nevertheless, a quantitative assessment of the impacts of PV energy policies on energy security and CO2 emission reduction is still needed to support the decision-making process. This paper, therefore, utilizes a system dynamics approach for assessing the impacts of FiTs and subsidy policies on PV energy goals for CO2 emission reduction and energy security in the small-scale sector in Jordan. This research develops a valuable assessment tool that assists energy decision-makers in evaluating the impacts of the deployed energy policies and evaluating their effectiveness in promoting PV installations. This study, including the introduction, is outlined as follows. Section 2 reviews relevant previous studies. Section 3 builds a system dynamics model that relates the key model factors. Section 4 conducts simulation and optimization for the proposed model and discusses research results. Section 5 summarizes conclusions and suggests recommendations for future improvements and future research.
2. Literature Review
Recently, studies on renewable energy have received significant research attention. For example, Trappey et al. [12] developed a cost-benefit methodology based on modeling system dynamics to promote renewable energy and reduce carbon emissions in Taiwan. Their study examined the impacts of adopting solar energy policies. Hsu [13] developed an assessment system dynamics model for simulating solar PV installations and CO2 emission reduction in Taiwan, to evaluate the ability of FiTs and capital subsidies policies to promote solar PV applications. Tziogas and Georgiadis [1] investigated the causalities of cleaner and affordable electricity production mix, proposed a system dynamic approach for examining the interrelations, and identified six key areas for policy interventions affecting the social acceptability with different scenarios. Movilla et al. [14] described a simulation model of the photovoltaic energy sector in Spain. The model analyzed dynamic behavior of the PV sector under different scenarios. Jeon and Shin [15] combined system dynamics with Monte Carlo simulation to evaluate the long-term technology method for renewable energy technologies. Aslani et al. [16] discussed the role of diversification on the dependency and security of energy supply using a system dynamics model of renewable energy recourses in Finland. They analyzed and evaluated three scenarios of renewable energy policies. Aslani and Wong [17] constructed a system dynamic model to evaluate different costs of renewable energy promotion and operation and analyzed the effectiveness of renewable energy policies on increasing the security of energy supply, minimization of the total policies cost, and maximizing the number of renewable energy recourses systems in the United States. Ahmad et al. [18] constructed a system dynamics model that investigates the role of feed-in tariff policy and examined various scenarios project solar PV technology in Malaysia till 2050. They suggested insights related to capacity, finances, and environmental savings. Radomes and Arango [19] used the classic Bass diffusion theory to analyze the diffusion of a PV system in Colombia. The model incorporated both subsidy and FiT policies and analyzed the effects of policy mix tree with the breakeven analysis and cost benefit analysis. Ye et al. [20] analyzed the impacts of FiTs policies for photovoltaics in China from 2011 to 2016. Alrwashdeh [21] designed and implemented a PV system for covering the electricity required of the school of engineering at Mutah University in Jordan. Milanés-Montero et al. [22] assessed the impacts of FiT on the profitability of European PV Companies in the period 2008–2012, using a static linear panel data model. The results showed that FITs had a significant positive influence on the economic profitability of PV companies. In addition, photovoltaic companies with the highest leverage ratios were those with the largest return on investment and encouraged the adoption of PV technology. Smit et al. [23] investigated the issues that affect energy fuel choice, energy bias, and energy switching and energy access as related to the introduction of a renewable energy solution in the Enkanini informal settlement. Lan et al. [24] provided an overview of the current situation of the resources used to generate electricity in Vietnam and the proportions accounted for by sustainable resources, as well as reviewing the existing FITs policies. Some lessons were proposed for Vietnam to encourage renewable energy resource development in the future. Kumar et al. [25] presented significant achievements, prospects, projections, generation of electricity, as well as challenges and investment and employment opportunities due to the development of renewable energy in India. They also identified the various obstacles faced by the renewable sector. Azzuni et al. [26] proposed an energy transition pathway towards a 100% RE system in Jordan by 2050 and analyzed how the energy security can be enhanced. They also investigated the relationship between the decarbonization of the energy system and energy security in a qualitative approach based on a comprehensive framework. Levenda et al. [27] summarized the documented environmental impacts associated with renewable energy technologies included in many renewable energy policies globally. They provided a systematic review of the literature assessing renewable energy technologies from the perspective of distributive, procedural, recognition, and capability interpretations of environmental justice. Nair et al. [28] examined the impact of renewable energy in the energy mix for total primary energy supply and electricity generation on Malaysia’s short and long-term energy security using system dynamics approach. Three key dimensions of the energy security were considered to extract the indicators and their causal relations with each other. The study conclude that the energy policy structure needs to incline more towards diversification of energy sources to ensure that RE holds a major share in the energy mix as per the current energy policy objectives. Le et al. [29] reviewed the FiTs deployed in different regions of Vietnam for grid-connected solar PV applications and investigated the costs of electricity production from PV systems. The results revealed that the gap between the levelized cost of electricity and the FiTs for solar PV electricity was relatively high, particularly in regions with a lower irradiation potential. Zahedi et al. [30] investigated the environmental effects of using a hybrid wind turbine system, electrolysis system, and solid oxide fuel cell in Qazvin hybrid wind turbine-fuel cell power plant. Zahedi et al. [31] studied the importance of addressing strategic issues in the field of general policies adopted and strategies for the development of renewable energy in Iran. They introduced the types of renewable energy and general principles.
This research proposes an extension to ongoing research by developing a system dynamics model for a quantitative assessment of the impacts of FiTs and subsidy policies on the social acceptability to install PV systems, CO2 emission reduction, and energy security in the small-scale sector in Jordan.
3. Research Methodology and Development of Dynamic Model
3.1. Research Methodology
System dynamics is a powerful social system, modeling, and computer-aided approach to policy analysis and design [32]. It produces a comprehensive representation of complex social, managerial, economic, and ecological systems, and provides interaction of nonlinear behavior of complex systems over time, information feedback, and circular causality loops. The main elements of the system dynamics method are variables in mathematical equations, presenting stocks and flows as well as causal relations, which are represented using causal feedback loops. Computer simulations follow to examine the real impacts of the social system on a policy in the laboratory to understand the implied causal feedback in the system [13,33]. The research, therefore, utilizes a system dynamics approach to analyze the impacts of renewable energy policies on CO2 emissions reduction and energy security. The research methodology is depicted in Figure 1.
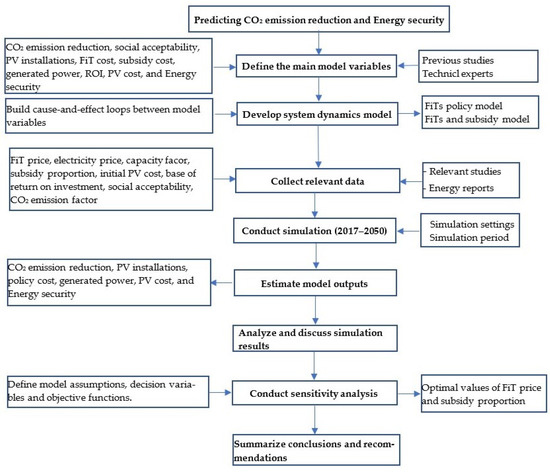
Figure 1.
Framework of the research methodology.
Previous studies and technical reports are used to identify the relevant factors in the PV model, including CO2 emission reduction, social acceptability, PV installations, FiT cost, subsidy cost, generated power, ROI, PV cost, and energy security. Figure 2 represents the overall causal feedback of the proposed PV model. In this figure, as the electricity and FiT price increase, the Return of Investment (ROI) ratio increases, which will consequently enhance the willingness of the public to install PV systems. In return, PV manufacturers will produce and install more solar PV systems and thereby increases the annual power generated and leads to significant mitigation of CO2 emission.
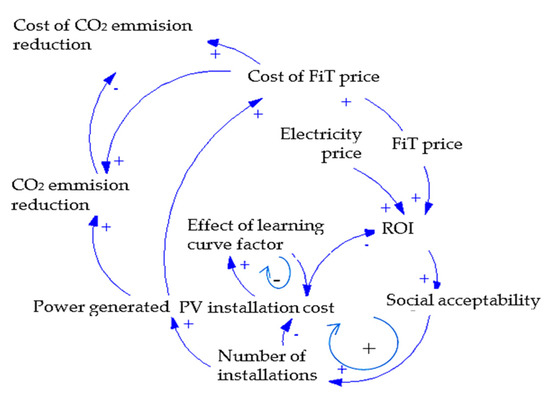
Figure 2.
Causal feedback diagram for solar PV system installations.
3.2. Model Development
3.2.1. ROI, Social Acceptability of PV Installations, and FiTs Policy
Developing a strategic plan is necessary to increase local manufacture of PV technologies with the aim of creating a competitive local market, reducing the initial cost of solar power stations through appropriate tax policies, and reducing customs duties on their requirements in the future. Concurrently, it is essential to consider the social aspects that influence social acceptability to install renewable energy technology [34]. As a result, as the social acceptability (SA) to install PV systems increases, the number of PV installations will increase. This leads to manufacturing more PV systems, thereby lowering PV system cost. The annual PV installations is obtained using Equation (1).
Annual PV installation = SA × PV installations in the previous year
As a step to enhancing the social acceptability move towards PV installations, governments allow consumers who wish to own renewable energy generation systems on a net measurement basis to cover their consumption by submitting applications directly to the electricity distribution company. Annual FiT costs are paid by the governments to consumers for their surplus generated electricity that was transferred into the grid. It is directly proportional to the amount of surplus from the power generated and FiT price, which is the money paid by the government to electricity supplier for every unit of electricity produced to the grid. As the FiT price increases, the ROI for the public improves, which leads to generate more profits due to increasing the annual PV system installations. Generally, the capacity factor (CF) is the annual daily average time for full loading per KW of a solar PV system. Then, the annual ROI is the multiplication of CF, a proportion of FiT price plus electricity price, and the number of days per year divided by the cost of PV system. The exact value of the base value of the ROI is unknown. Mathematically,
ROI = CF × (FiT price × 0.1 + electricity price) × 360 × 6.6/Cost of PV system
Figure 3 displays the system dynamics model generated using Powersim Studio 2005 (Service release 6, Powersim Software AS, Nyborg, Norway) that relates social acceptability, FiT price, and PV installations. In this figure, all processes can be characterized in terms of three elements: stocks (rectangular box, accumulated number of installation), information link (curved arrow), and flow (pipe). The difference between stock and flow is that stock is an accumulation of something and a flow is the movement. Stock and flow diagram use to show relationships among variables, which have the potential to change over time. Other symbols are also used; a variable (circle, ROI changes over time) and a constant (electricity price). It is obvious that the ROI is the driver for the growth of PV installations. However, to avoid unaffordable policy costs due to increasing PV installation and continual drop in the cost of the PV system, the ROI is assigned an upper limit.
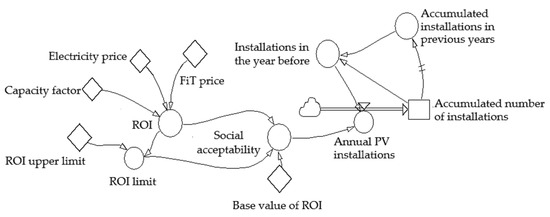
Figure 3.
System dynamics of social acceptability and PV installations.
Further, net metering is a billing mechanism that credits costumers for excess self-generated electricity they feedback into the grid. Each month the consumers pay the utility the net difference, on a kWh basis, between what they consumed and what they fed back into the grid. If what they produced exceeds what they consumed, the excess is rolled over to the next month on a kWh basis. The generated electricity goes for direct consumption. If the consumption is more than the electricity generated by the PV system, the utility grid supplies the shortage; however, if the consumption is less than the amount generated, the difference is delivered back to the utility grid and an extra credit of energy will be saved for the customer for the next month until the year ends, then the customer can make a financial settlement with FiT price for each kWh generated, which is called net metering. The annual net metering (ANM) is then calculated using Equation (3).
ANM credit (kW/year) = 0.1 × Annual PV installations × CF
Finally, the implemented FiT policy for encouraging the social acceptability to install PV systems will cost the government. The annual FiT cost is the ANM credit multiplied by the FiT price (USD/kWh). The FiT cost increases directly when the FiT price increases. Therefore, the annual FiT cost is estimated as:
Annual FIT cost (USD/year) = ANM × FIT price
3.2.2. Annual PV Installations, Power Generated and CO2 Emissions
Worldwide, the generated power by PV installations provides affordable electricity and can help stabilize energy prices in the future. Renewable power generation capacity is measured as the maximum net generating capacity of power plants and other installations that use renewable energy sources to produce electricity [35]. Figure 4 depicts the relationships between the annual PV installations, power generated, and CO2 emissions. The number of PV installations represents the total capacity of PV systems that have been installed in (KW), which increases according to the annual PV installations. The annual power generated (APG) then is the amount of power (kWh) that is generated only by the calculated number of installed PV systems through the previous year. APG can be calculated using Equation (5).
APG = Annual PV installations × CF
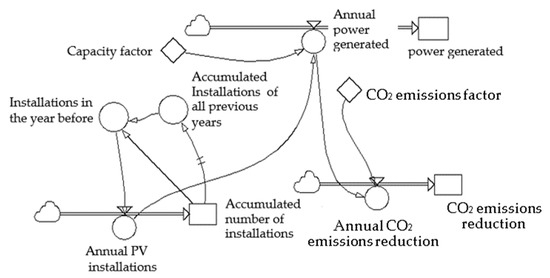
Figure 4.
System dynamics of power generated and CO2 emissions.
In addition to achieving energy security, governments are promoting PV applications to reduce CO2 emissions resulted from electricity generation. Renewable energy technology is playing a vital role in reducing the quantities of CO2 emissions released into the atmosphere, and in doing so contributing to a reduction of the greenhouse effect. It is clean and has a much smaller impact on the environment in comparison to conventional energy technologies. The Jordanian government aims to achieve 14% CO2 emission reduction by 2030. The annual CO2 emission reduction is directly proportional to CO2 emissions factor (kgCO2/kWh) and power generated (kWh) by solar PV installations. The CO2 emissions factor indicates how much CO2 produced for every one kWh of electricity generated. Typically, when the power generated by PV installations increases, the total power generated from fossil fuel burning decreases and consequently CO2 emission reduction increases. Mathematically,
Annual CO2 emission reduction = CO2 emissions factor × APG
3.2.3. Cost of PV System
The cost of PV (CPV) system (USD/kW) includes the cost of the module, invertors, and cables. Figure 5 shows the causal model for CPV causal relations. The accumulated cost reduction is the sum of the annual cost reductions (ACR). In this research, the cost of the PV system is then estimated as the initial PV cost minus the accumulated cost reduction; assuming that the maintenance costs for the PV system are negligible. It was reported that PV cells are significantly more suitable for realizing industry-wide learning to reduce forecasted energy technology costs. Given the annual PV installation and the accumulated number of PV installations (APV), the ACR is then calculated as follows [13]:
ACR = CPV × ((Annual PV installations + APV)/APV)^−3.32193
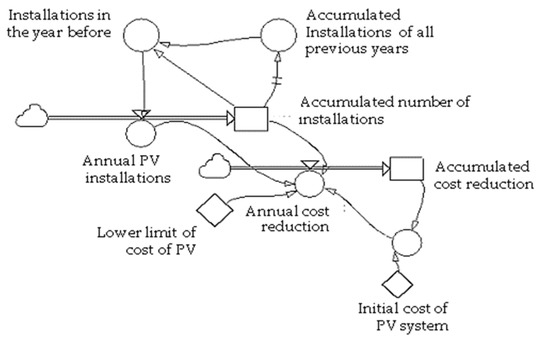
Figure 5.
System dynamics model for cost of PV system.
The FiTs policy impacts on energy goals will be analyzed by integrating the presented models. The relevant formulas and parameters of this model for the PV systems in Jordan are summarized in Table 1.

Table 1.
The relevant formula of the developed PV model.
4. Model Simulation and Research Results
Small-scale sectors include hospitals, residential buildings, universities, commercial and industrial enterprises, schools, and banks. The most applicable PV system configurations for small-scale sectors in Jordan is on-grid systems, which are connected to the grid via inverters; thus, they do not require batteries. Residential buildings consume energy through their life cycle, including planning, design, construction, and mostly in the building. The demand for electricity has increased in the household sector due to the increased population, high temperatures in summer, and the expansion in using air conditioning units.
In the developed PV model, it is assumed that the social acceptability to install PV systems is directly proportional to the ratio between annual ROI and the base value of ROI, where the upper limit of ROI value is calculated from the historical data and found to be 0.8724 according to the higher willingness that can be achieved. Moreover, the exact value of the base value of ROI is unknown. Hence, the suitable value of this variable is established according to annual ROI. The ROI base value (=0.73) has been decided as the average for the prices shown in Table 2.

Table 2.
Electricity prices and ROI base values for small sectors.
Further, the capacity factor (=20%) of PV system represents the daily average time for a solar PV system with 1 kW of capacity to reach full loading in one year, it depends on location, position, and method of installation. Furthermore, there are many factors that determine electricity price, such as, the price of power generation, government subsidies, and the infrastructure for its transmission and distribution. The pricing differs not only according to the type of energy generated, but also according to the type of consumer (household, commercial, and industrial). In Jordan, the average of electricity price of 0.268 USD/kwh is considered. Finally, government spending is required to implement the FiT mechanism. The FiT price (=0.19 USD/kWh), and the FiT cost is paid by the government is the sum of the annual FiT cost. It is found that the initial cost of a PV system is 1129 (USD/kW) [2]. According to global studies, the cost of PV system installation will be reduced globally by 40–60% in 2025, so the lower limit for cost of PV systems $600 allocated to be around half of its initial cost, even if the applicable policy mechanism led to higher reduction rate. Accumulated cost reduction gives the output of the extra decrease in cost that is being calculated each simulation year, to compute the cost of a PV system in the current year. When the number of installations increases, it will cause limited reduction in cost of PV installations by the learning curve factor. The initial value of the accumulated PV installation is set to 80,000 kW.
4.1. Impact of FiT Policy on Energy Goals
Simulation of the complete model (Figure 5) was performed using Powersim Studio 5 to examine the FiTs policy on energy goals in the period ranging from 1 January 2016 to 1 January 2050. The obtained simulation results at the FiT price of (=0.19 USD/kWh) showed that:
- -
- The expected accumulated number of installations (Figure 6) increases exponentially through the period until reaching 874 Megawatt (MW) and 5.484 Gigawatt (GW) by the end of years 2025 and 2035, respectively. However, it will reach 67.125 GW at the beginning of year 2050.
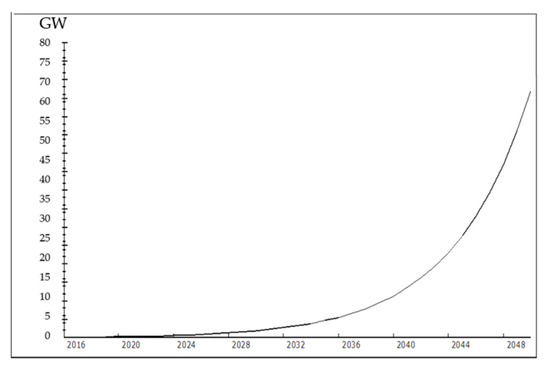 Figure 6. Accumulated number of installations versus time (FiTs policy).
- -
- The expected accumulated power generated as depicted in Figure 7 increases as the accumulated number of PV installations increases. It is assumed that the accumulated power generated initially is zero. The accumulated power generated will reach 1.371 and 9.338 Terawatt hour (TWh) by the end of years 2025 and 2035, respectively. While the power generated by the beginning of year 2050 reaches 115.853 TWh.
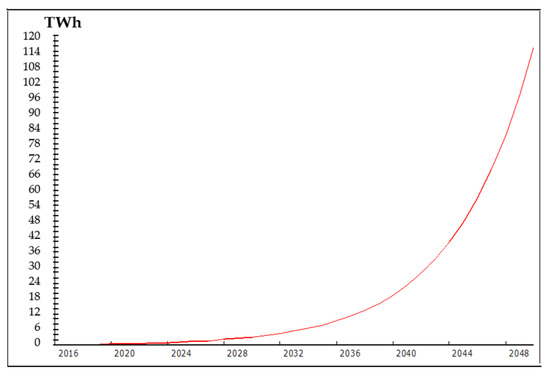 Figure 7. The cumulative power generated versus time (FiTs policy).
- -
- In Jordan, an average value of the CO2 emission factor is 0.643 Kg CO2/kWh [4]. The accumulated CO2 emissions reduction, as displayed in Figure 8, increases as the accumulated number of installations increases. Assuming that the initial CO2 emission reduction is initially zero, the accumulated CO2 emissions reduction will reach 0.882 and 6.0 million tons of CO2 by the end of years 2025 and 2035, respectively. The accumulated CO2 emission reduction will reach 74.49 million tons CO2 at the beginning of 2050.
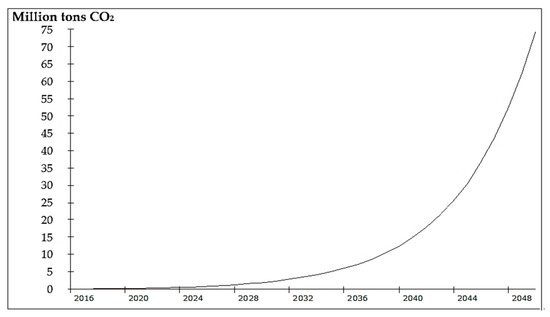 Figure 8. The CO2 emissions reduction versus time (FiTs policy).
- -
- The cost of a PV system decreases from its initial value of 1129.46 USD/KW till reaching the minimum cost of a PV system, which is 505.5 USD/KW. That is, the PV cost will be reduced to less than half of the initial cost, starting from the beginning of year 2019.
- -
- The social acceptability increased from 0.6 in 2016 to 1.2 starting at the beginning of 2018 and remains constant till 2050. Similarly, the ROI increased from 0.44 in 2016 to 0.98 in 2018 and remains the same till 2050.
- -
- The accumulated FiT cost increases as shown in Figure 9 to $26.05 and $177.4 million by the end of 2025 and 2035, respectively, while the accumulated FiT cost is expected to reach $2.2 billion at the beginning of 2050.
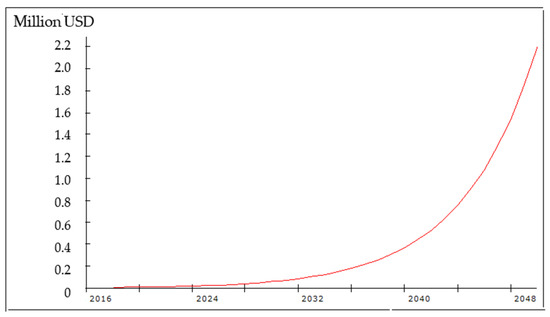 Figure 9. The FiT cost versus time.
4.2. Impacts of Ombination of FiT and Subsidy Policies on Energy Goals
Generally, the subsidy cost is grants and rebates paid by the government to cover a proportion of the investment in PV technologies to reduce the cost of PV installations. This cost is paid to consumers to promote PV installations and is implied at the beginning of each installation as a proportion of the installation cost (PV cost). Figure 10 depicts subsidy and maintenance cost relations with PV cost. The subsidy cost equals the proportion of subsidy multiplied by PV cost. In this research, a subsidy proportion is equal to 15%. The percentage of 15% was chosen after a study of the effect on different common proportions of subsidy on CO2 emissions reduction and polices cost, which are the key factors influencing the choice of proper subsidy proportion. The lower PV price is assumed to be 550 USD. The accumulated subsidy cost is the cumulative annual subsidy cost (ASC) through the simulation period paid by the government. The ASC equals the subsidy cost multiplied to the total number of PV installations. Finally, the total of policies costs is the summation of the FiTs and subsidy policy costs. Mathematically,
Subsidy cost = PV cost × subsidy proportion × annual number of PV installations
ASC = PV cost × subsidy proportion × annual number of PV installations
Annual policies cost = ASC + Annual FiTs cost
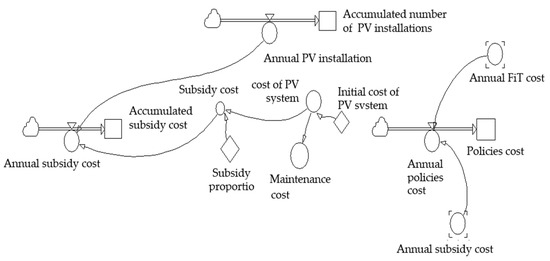
Figure 10.
Subsidy and maintenance cost relations.
The main part of the PV system is the inverter, which is replaced within the 25-year life of the system. This study assumes that each solar PV system has an operational lifetime of 25 years, and the maintenance cost is 0.06 of the cost of solar PV system. When the combination of subsidy and FiTs policies are applied, the total number of solar PV installations grows and thereby the total of policy costs of promoting solar PV installation increases in a huge manner. As a result, a tremendous increase in the ROI will be generated to the public. The ROI under both policies is calculated as:
ROI = CF × (FiT price × 0.1 + electricity price) × 360 × 6.6/(PV cost − subsidy cost)
Further, applying the combination of subsidy policy results in larger reductions in CO2 emissions and achieves better goals in energy dependency than FiTs policy. Similar simulation was run for the system dynamics model of the combination of subsidy and FiTs policies and the obtained results showed that:
- -
- The accumulated number of installations versus time is shown in Figure 11, which reveals that about 1.12 and 7.19 GW are expected to be installed by the end of 2025 and 2035, respectively. While the accumulated number of installations will reach 88.38 GW at the beginning of year 2050.
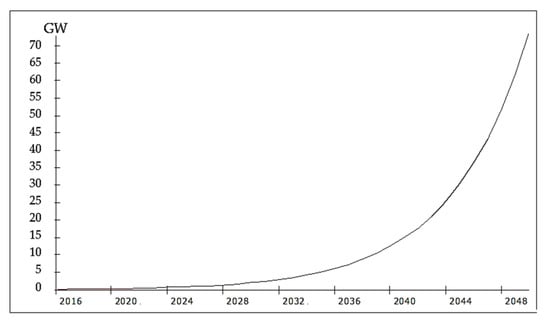 Figure 11. Accumulated number of installations versus time for combined policies.
- -
- Figure 12 depicts the accumulated generated power versus time, where it is noted that the accumulated generated power (GW) increases nonlinearly by time passes. For example, the accumulated power generated reaches 1.794 and 12.288 TWh by the end of 2025 and 2035, respectively. While the accumulated generated power reaches 152.588 TWh at the beginning of 2050.
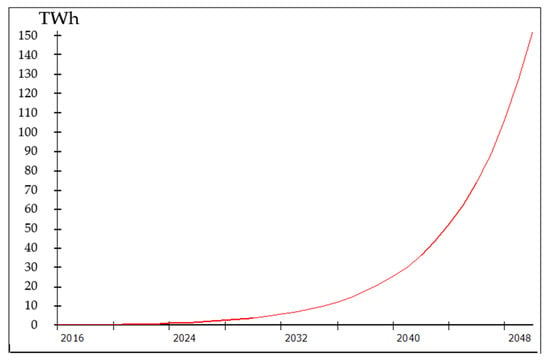 Figure 12. The cumulative power generated versus time for combined policies.
- -
- The accumulated CO2 emissions reduction is illustrated in Figure 13, which shows that the accumulated CO2 emissions reduction increases by time. It is expected that the accumulated CO2 emissions reduction by the end of 2025 and 2035 will reach 1.53 and 7.90 million tons, respectively. While the accumulated CO2 emission reduction reaches 98.114 million tons CO2 at the beginning of 2050.
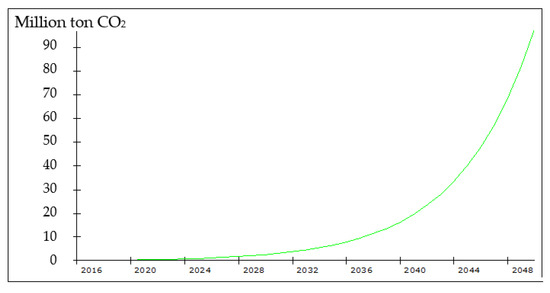 Figure 13. The CO2 emissions reduction versus time for combined policies.
- -
- The cost of a PV system under the combination of subsidy and FiTs policies decreases from its initial value of 1129.46 USD/KW till reaching the minimum cost of a PV system (=353.23 USD/KW) in 2019, and then it remains constant till 2050.
- -
- The social acceptability to install PV systems increased from 0.71 in 2016 to 1.2 starting at the beginning of 2018 and then remains constant till 2050. Similarly, the ROI increased from 0.52 in 2016 to 1.65 in 2019 and then remains at a value of 1.65 till 2050.
- -
- The accumulated total of policy costs is displayed in Figure 14, where it is noted that the total of policy costs increases by time. For example, about $102.011 and $623.148 million $ will be incurred by the end of 2025 and 2035, respectively. While the accumulated total cost reaches $7.590 billion at the beginning of 2050.
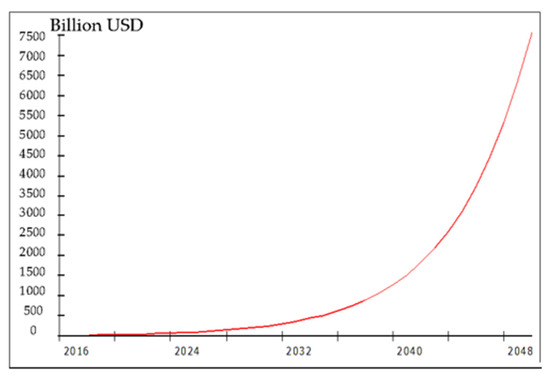 Figure 14. The cumulative policies cost versus time for combined policies.
4.3. Ecological Footprint and Energy Security
Further analyses were conducted to measure the ecological footprint and energy security policy. The obtained results are discussed as follows.
4.3.1. Ecological Footprint
Figure 15 shows the ecological footprint model. This study assumes that each installation of a PV system produces three small quantities including waste from PV energy consumption, PV installations, and PV energy operation and maintenance. Typically, the increase in the number of PV installations leads to an increase in the total volume of waste and thereby directly increases the ecological footprint. When using a clean solar energy source, however, less carbon emissions will be released into the atmosphere, which consequently decreases the ecological footprint. Simulation was then run to estimate the predicted energy waste, and the results for the energy waste and ecological footprint are depicted in Figure 16 and Figure 17, respectively.
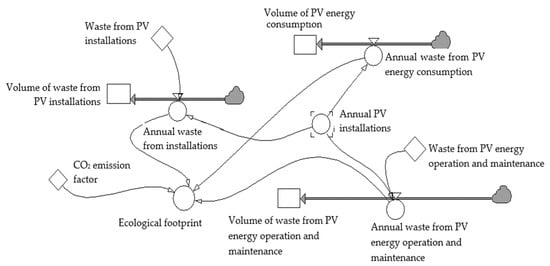
Figure 15.
Ecological footprints and CO2 emissions relations.
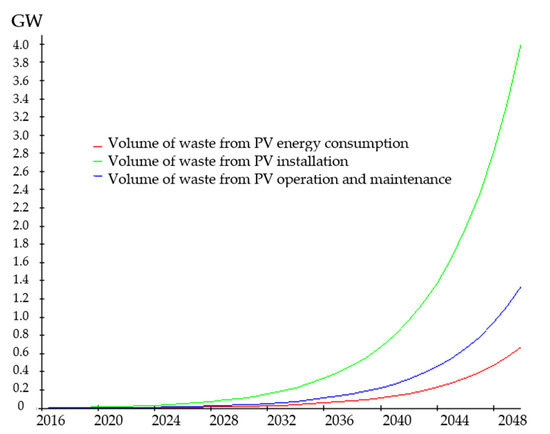
Figure 16.
Energy waste versus time.
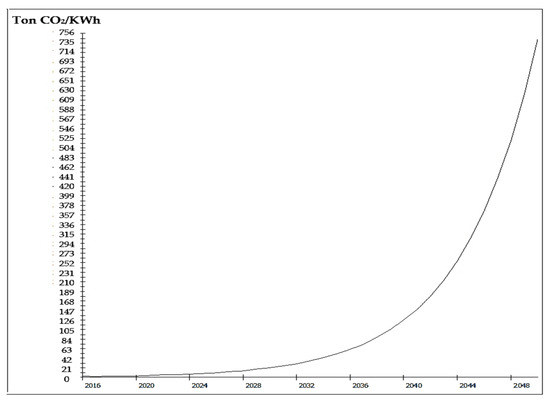
Figure 17.
Ecological footprint versus time.
In Figure 16, the cumulative volume of PV energy consumption increases by time. The cumulative waste volumes are 10,368 and 61,603 KW by the end of 2025 and 2035, respectively. While it reaches 746,622 KW at the beginning of 2050. The cumulative waste from installation increases as time increases to 47.604 and 324.23 MW by the end of 2025 and 2035, respectively, while this cumulative waste reaches 4.023 GW at the beginning of 2050. Finally, the cumulative waste from PV energy operation and maintenance increases to 15.868 and 1.08 GW by the end of 2025 and 2035, respectively. The cumulative amount of this waste reaches 1.34 GW at the beginning of 2050.
In Figure 17, the ecological footprint increases as time increases, where it is expected to reach about 10.37 and 61.60-ton CO2/KWh by the end of 2025 and 2035, respectively. This waste reaches 746.62 ton CO2/KWh at the beginning of 2050.
4.3.2. Energy Security Analysis
Energy security is defined as the availability of natural resources to consume energy throughout the year. Energy security analysis is a strong tool for policymakers. Energy reports revealed that the annual electricity demand increased from 19,390 to 23,063 GWh for the years 2016 and 2020, respectively. Jordan’s demand for energy is growing at a rate of 3% annually [3,4,5]. The total amount of PV electricity that was generated in the year 2020 amounts to around 2250 GWh, which covered around 10% of the total electricity demand of Jordan at the said year. Small-scale sectors represent the largest percentage of sectorial consumption of electricity during 2012 to 2016 of about 60%, with an annual electricity demand growth of 7.4% [3,4,5]. The solar photovoltaic has a share of 92% of renewable electricity generation (when the cost of PV is US$1129.5 per kW and global solar radiation is 0.643 kg CO2/kWh).
Figure 18 displays the relations between the level of energy security, power generated, and electricity demand. The annual electricity demand refers to the maximum amount of electrical energy that has been consumed at a given time. In this study, the level of energy security is calculated by subtracting the electricity demand from the power generated capacity at each year. When the power generated by the PV system increases each year, the level of energy security increases directly and the energy reserve become larger; unlike the electricity demand, which reduces the level of energy security as the demand increases. Table 3 lists the level of energy security under both energy policies.
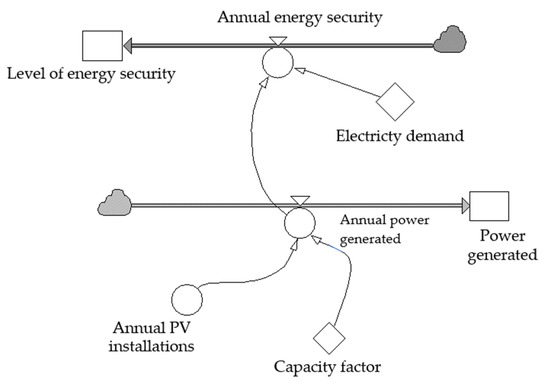
Figure 18.
Developed model for level of energy security, power generated, and electricity demand.

Table 3.
The estimated energy security levels.
In Table 3, the expected energy surpluses in 2050 are 14.25 and 50.99 KWh under FiTs and subsidy policies, respectively. This surplus can be utilized to fulfill the demand for renewable energy in other sectors, such as transport. This leads to the conclusion that Jordan can achieve a 100% solar PV system in 2050 by implementing the FiTs and/or subsidy policies to increase the public acceptability to install PV system, and such a transition will positively enhance the level of energy security and significantly prevent the negative impacts of CO2 emissions on the environment.
4.4. Sensitivity Analysis
Sensitivity analyses were conducted to analyze the possible uncertainties in developed model parameters for FiTs and subsidy polices. For the FiTs model, it is assumed that the capacity factor (mean = 0.2 and standard deviation = 0.02), electricity price (mean = $0.27 and standard deviation = 0.03), and lower limit of PV system cost (mean = $600/KWh and standard deviation = 60) are normally distributed. The decision variables are the FiT price (value ranges between 0.17 to 0.21) and subsidy proportion. Similar sensitivity analysis was conducted to determine the optimal subsidy proportion. It is assumed that the capacity factor (mean = 0.2 and standard deviation = 0.02), electricity price (mean = $0.27 and standard deviation = 0.03), and the lower limit of PV system cost (mean = $550/KWh and standard deviation = 50) and the decision variables are the FiT price (value ranges between 0.17 to 0.21) and the subsidy proportion (value ranges between 0.14 to 0.17). It is found that the optimal FiT price is $0.21, at which the FiTs policy, the accumulated PV installations, CO2 emissions reduction, and power generated are 71.8 GW, 82.5 million ton CO2, and 128.3 TWh, respectively. On the other hand, for the combined policies, FiTs and subsidy policies, the results showed that the optimal FiT price subsidy proportions are $0.21 and 17%, respectively. At these optimal values, the accumulated PV installations, CO2 emissions reduction, and power generated are 97.8 GW, 112.4 million tons CO2, and 174.8 TWh, respectively. It is clear that applying the combined FiT and subsidy policies results in more PV installations, energy generated, and CO2 emissions reduction. Nevertheless, the FiT policy results in securing future energy at a significantly lower policy cost (=2.68 billion USD) compared to the cost of combined policies (=10.63 billion USD). Decision-makers can utilize these results to decide the applicable policy to be adopted in promoting PV installations depending on the available budget.
5. Conclusions
This research developed a valuable quantitative assessment approach to examine the impacts of PV policies on social acceptability, number of PV installations, power generated, and CO2 emission reduction in the small-scale sector in Jordan. A system dynamics simulation was conducted for the time span 2016 to 2050, which revealed that under the FiTs and combined policies, the accumulated number of installations (cumulative power generated) could reach 67.125 (115.853 TWh) and 88.38 GW 115.853 (152.588 TWh), respectively. Further, the cost of a PV system decreases from its initial value of 1129.46 USD/KW till reaching 505.5 and 353.23 USD/KW, respectively. The expected cumulative CO2 emission reductions reach 74.49 and 98.114 million tons CO2 under the FiTs and subsidy policies, respectively. Finally, the cumulative FiTs and combined policies cost 2.2 and 7.590 billion USD, respectively, while ROI increases to 0.8 and 1.65, respectively. Sensitivity analyses followed to determine the optimal FiT price and subsidy proportion, where the obtained optimal FiT price and subsidy proportion were 0.21 and 17%, respectively. In conclusion, under the stated assumptions implementing PV models, adoption of renewable energy policies in Jordan will result in a high level of energy security in 2050. Policy makers in the energy sector can utilize the proposed PV models as a valuable assessment tool for deciding the applicable energy policies and determining the amount of investment that will be required to achieve economic sustainable growth in the energy sector. Future research may consider developing an interpretive structural model to identify the factors that affect social acceptability and the barriers to use PV installations.
Author Contributions
A.A.-R. conceived the study and was responsible for data collection and analysis, system dynamics model development, simulation results under FiT and subsidy policies, and results interpretation. N.L. was responsible for review of the presented literature, data analysis. All authors have read and agreed to the published version of the manuscript.
Funding
This research was supported by the University of Jordan, Research No. 2471.
Informed Consent Statement
Not applicable.
Data Availability Statement
Not applicable.
Conflicts of Interest
The authors declare no conflict of interest.
References
- Tziogas, C.; Georgiadis, P. Investigating the causalities for cleaner and affordable electricity production mix: A System dynamics methodological approach. Chem. Eng. Trans. 2013, 35, 461–541. [Google Scholar]
- Abu Hamed, T.; Bressler, L. Energy security in Israel and Jordan: The role of renewable energy sources. Renew. Energy 2019, 135, 378–389. [Google Scholar] [CrossRef]
- Ministry of Energy and Mineral Resources (MEMR). Annual Report 2018; MEMR: Amman, Jordan, 2018. Available online: https://www.memr.gov.jo/ebv4.0/root_storage/ar/eb_list_page/56dcb683-2146-4dfd-8a15-b0ce6904f501.pdf (accessed on 10 June 2020).
- Ministry of Energy and Mineral Resources (MEMR). Energy 2019—Facts & Figures; MEMR: Amman, Jordan, 2019. Available online: https://www.memr.gov.jo/ebv4.0/root_storage/en/eb_list_page/bruchure_2019.pdf (accessed on 10 June 2020).
- National Electric Power Company (NEPCO), Annual Reports, Amman, Jordan. 2018. Available online: https://www.nepco.com.jo/store/docs/web/2018_en.pdf (accessed on 10 June 2020).
- Abu-Rumman, G.; Khdair, A.I.; Khdair, S.I. Current status and future investment potential in renewable energy in Jordan: An overview. Heliyon 2020, 6, e03346. [Google Scholar] [CrossRef] [PubMed]
- International Renewable Energy Agency (IRENA). Renewable Capacity Statistics 2021. Available online: https://www.irena.org/publications/2021/March/Renewable-Capacity-Statistics-2021 (accessed on 10 June 2020).
- International Renewable Energy Agency Report; International Renewable Energy Agency: Bangkok, Thailand, 2016.
- Jabera, S.; Abul Hawa, A. Optimal Design of PV System in Passive Residential Building in Mediterranean Climate. Jordan J. Mech. Ind. Eng. 2016, 10, 39–49. [Google Scholar]
- Hussein, N. Greenhouse Gas Emissions Reduction Potential of Jordan’s Utility Scale Wind and Solar Projects. Jordan J. Mech. Ind. Eng. 2016, 10, 199–203. [Google Scholar]
- Alawneh, F.; Albatayneh, A.; Al-Addous, M.; Al-Khasawneh, Y.; Dalalah, Z. Solar Photovoltaic (PV) Power Systems in Jordan: The Past, the Present and the Future? Adv. Sci. Technol. Innov. 2019, 155–159. [Google Scholar] [CrossRef]
- Trappey, A.J.C.; Trappey, C.V.; Lin, G.Y.P.; Chang, Y.-S. The analysis of renewable energy policies for the Taiwan Penghu island administrative region. Renew. Sustain. Energy Rev. 2012, 16, 958–965. [Google Scholar] [CrossRef]
- Hsu, C.-W. Using a system dynamics model to assess the effects of capital subsidies and feed-in tariffs on solar PV installations. Appl. Energy 2012, 100, 205–217. [Google Scholar] [CrossRef]
- Movilla, S.; Miguel, L.J.; Blázquez, L.F. A system dynamics approach for the photovoltaic energy market in Spain. Energy Policy 2013, 60, 142–154. [Google Scholar] [CrossRef]
- Jeon, C.; Shin, J. Long-term renewable energy technology valuation using system dynamics and Monte Carlo simulation: Photovoltaic technology case. Energy 2014, 66, 447–457. [Google Scholar] [CrossRef]
- Aslani, A.; Helo, P.; Naaranoja, M. Role of renewable energy policies in energy dependency in Finland: System dynamics approach. Appl. Energy 2014, 113, 758–765. [Google Scholar] [CrossRef]
- Aslani, A.; Wong, K.-F.V. Analysis of renewable energy development to power generation in the United States. Renew. Energy 2014, 63, 153–161. [Google Scholar] [CrossRef]
- Ahmad, S.; Tahar, R.; Muhammad-Sukki, M.F.; Munir, A.B.; Abdul Rahim, R. Role of feed-in tariff policy in promoting solar photovoltaic investments in Malaysia: A system dynamics approach. Energy 2015, 84, 808–815. [Google Scholar] [CrossRef] [Green Version]
- Radomes, A.A., Jr.; Arango, S. Renewable energy technology diffusion: An analysis of photovoltaic-system support schemes in Medellín, Colombia. J. Clean. Prod. 2015, 92, 152–161. [Google Scholar] [CrossRef]
- Ye, L.C.; Rodrigues, J.F.; Lin, H.X. Analysis of feed-in tariff policies for solar photovoltaic in China 2011–2016. Appl. Energy 2017, 203, 496–505. [Google Scholar] [CrossRef]
- Alrwashdeh, S. Assessment of the energy production from PV racks based on using different Solar canopy form factors in Amman-Jordan. Int. J. Eng. Res. Technol. 2018, 11, 1595–1603. [Google Scholar]
- Milanés-Montero, P.; Arroyo-Farrona, A.; Pérez-Calderón, E. Assessment of the influence of feed-in tariffs on the profitability of European photovoltaic companies. Sustainability 2018, 10, 3427. [Google Scholar] [CrossRef] [Green Version]
- Smit, S.; Musango, J.K.; Brent, A.C. Understanding electricity legitimacy dynamics in an urban informal settlement in South Africa: A Community Based system dynamics approach. Energy Sustain. Dev. 2019, 49, 39–52. [Google Scholar] [CrossRef] [Green Version]
- Lan, T.T.; Techato, K.; Jirakiattikul, S. The Challenge of Feed-In-Tariff (FIT) Policies Applied to the Development of Electricity from Sustainable Resources–Lessons for Vietnam. Int. Energy J. 2019, 19, 199–212. [Google Scholar]
- Kumar, J.C.R.; Majid, M.A. Renewable energy for sustainable development in India: Current status, future prospects, challenges, employment, and investment opportunities. Energy Sustain. Soc. 2020, 10, 1–36. [Google Scholar] [CrossRef]
- Azzuni, A.; Aghahosseini, A.; Ram, M.; Bogdanov, D.; Caldera, U.; Breyer, C. Energy Security Analysis for a 100% Renewable Energy Transition in Jordan by 2050. Sustainability 2020, 12, 4921. [Google Scholar] [CrossRef]
- Levenda, A.M.; Behrsin, I.; Disano, F. Renewable energy for whom? A global systematic review of the environmental justice implications of renewable energy technologies. Energy Res. Soc. Sci. 2021, 71, 101837. [Google Scholar] [CrossRef]
- Nair, K.; Shadman, S.; Chin, C.M.M.; Sakundarini, N.; Yap, E.H.; Koyande, A. Developing a system dynamics model to study the impact of renewable energy in the short- and long-term energy security. Mater. Sci. Energy Technol. 2021, 4, 391–397. [Google Scholar] [CrossRef]
- Le, H.T.-T.; Sanseverino, E.R.; Nguyen, D.-Q.; Di Silvestre, M.L.; Favuzza, S.; Pham, M.-H. Critical Assessment of Feed-In Tariffs and Solar Photovoltaic Development in Vietnam. Energies 2022, 15, 556. [Google Scholar] [CrossRef]
- Zahedi, R.; Ahmadi, A.; Sadeh, M. Investigation of the load management and environmental impact of the hybrid cogeneration of the wind power plant and fuel cell. Energy Rep. 2021, 7, 2930–2939. [Google Scholar] [CrossRef]
- Zahedi, R.; Zahedi, A.; Ahmadi, A. Strategic Study for Renewable Energy Policy, Optimizations and Sustainability in Iran. Sustainability 2022, 14, 2418. [Google Scholar] [CrossRef]
- Daneshgar, S.; Zahedi, R. Investigating the hydropower plants production and profitability using system dynamics approach. J. Energy Storage 2022, 46, 103919. [Google Scholar] [CrossRef]
- Al-Refaie, A.; Abdelrahim, D.Y. A system dynamics model for green logistics in a supply chain of multiple suppliers, retailers and markets. Int. J. Bus. Perform. Supply Chain Model. 2021, 12, 259–281. [Google Scholar] [CrossRef]
- Moula, M.M.E.; Maula, J.; Hamdy, M.; Fang, T.; Jung, N.; Lahdelma, R. Researching social acceptability of renewable energy technologies in Finland. Int. J. Sustain. Built Environ. 2013, 2, 89–98. [Google Scholar] [CrossRef]
- Hou, G.; Sun, H.; Jiang, Z.; Pan, Z.; Wang, Y.; Zhang, X.; Zhao, Y.; Yao, Q. Life cycle assessment of grid-connected photovoltaic power generation from crystalline silicon solar modules in China. Appl. Energy 2016, 164, 882–890. [Google Scholar] [CrossRef]
Publisher’s Note: MDPI stays neutral with regard to jurisdictional claims in published maps and institutional affiliations. |
© 2022 by the authors. Licensee MDPI, Basel, Switzerland. This article is an open access article distributed under the terms and conditions of the Creative Commons Attribution (CC BY) license (https://creativecommons.org/licenses/by/4.0/).