Abstract
In this study, we focus on the innovation resistance that has appeared in the process of accepting changed information technology services after the COVID-19 pandemic. Based on a survey of property technology (PropTech) service users in Korea, this study proposes an extended technology acceptance model that considers the antecedent variables of the information systems success model to implement a standard PropTech service platform, and analyzes the influence of the selected parameters. Service quality was applied as the antecedent variable to define system quality and service standards, considering the establishment of the service standards process suggested by the company. The selected parameters were the demand for the personalization of the service and the resistance to innovation, which implies the degree to which consumers refuse to accept new technologies. To this end, we conducted a questionnaire survey of 524 PropTech users from 11 October 2021 to 15 November 2021. This study analyzes the factors affecting consumers’ continued use intention in order to derive the service standardization of PropTech operations, and presents the mediating effects of innovation resistance and personalization to derive the implications for service standardization. The implications of this study are as follows: first, the possibility of innovation resistance in the PropTech service sector and its mechanisms are presented. Second, the necessity of redefining the quality dimension is proposed. Finally, we identify that additional research on innovation resistance to PropTech services is needed.
1. Introduction
Owing to the COVID-19 pandemic, the use of information systems in purchasing activities has become widespread. In the early stage of Amazon’s e-commerce business, books that were low-involvement products were selected as trading products. As consumers have become accustomed to purchasing products online, the role of e-commerce has expanded, reaching even to the selection of several high-involvement products, such as insurance, jewelry, medical services, and real estate. Low-involvement products with relatively low anxiety levels vis à vis purchase results can be sold continuously through marketing methods with repetitive exposure. However, many factors influence the selection process of the consumer when making purchase decisions regarding high-involvement products with high consumer interest and high perceived risk [1]. Thus, consumers’ innovation resistance (IR) to the purchasing decision-making process increases for high-involvement products. Considering that failure to make good purchasing decisions for high-involvement products causes great losses, it is natural for consumers to engage in progressive information searching activities. In addition, the consumers of high-involvement products tend to research the product in detail; thus, they educate themselves with detailed explanations of the product or recommendations from experts [2,3].
Service standards are a set of guidelines that reflect different situations in customer management and help to reduce the errors caused by individual customers [4]. Setting this guideline is effective in achieving consistency in service quality. When a customer purchases a service, the potential risk associated with the purchase may be higher than expected. This discrepancy can be attributed to the characteristics of service as a purchase. Service quality is highly dependent on people; therefore, the accompanying risks when providing services should be minimized through service production quality. Moreover, service standardization facilitates communication by providing a clear outline of the roles and responsibilities of an organization. Standardization encourages the better performance of both management of employees and, by maintaining service quality, it helps to acquire customers’ trust. Therefore, it is imperative to conceptualize an effective and systematic service quality standardization method [5].
This study focuses on the IR to information technology (IT) service acceptance, which has changed since the onset of the COVID-19 pandemic. In addition, personalization has been considered as another variable that contrasts with IR. Considering both system and service quality as antecedent factors that influence IR and personalization, a research model on the continuous intention to use IT services for high-involvement products has been suggested. Accordingly, we collected samples of people who use property technology services to acquire property.
This study proposes an extended technology acceptance model (TAM) that considers the preceding variables of the information systems (IS) success model to implement the standard platform for services. We believe that data analysis based on service users can verify the mediating effects of the proposed variables (i.e., IR and personalization). This study particularly observes system quality, the establishment of service standards processes proposed by companies, and service quality-defining standards. The demand for the personalization of services and IR, which is the degree to which consumers refuse to accept new technologies, have been proposed as mediating variables. In this study, we discuss innovation in a traditional service wherein IT is not internalized. Therefore, we focus on the situation wherein users who are familiar with the conventional service must be accommodated to the new service. In this respect, it can be understood that IR increases against system quality improvement. Considering that traditional real estate brokerage services center on real estate property, rather than on stakeholders, we believe that personalized services could be a differentiating factor moving in a different direction to innovation. This is because personalized services that offer user-centered information sharing, e.g., providing customized information to buyers and sellers, are important for sales.
This study explores three questions:
- (1)
- What are the influencing factors of the standardization of service platforms for high-involvement products (i.e., real estate) on continuous intention to use?
- (2)
- What is the mediating effect of innovation resistance on service platforms?
- (3)
- What is the mediating effect of personalization on service platforms?
This study aims to identify the factors that influence the standardization of service platforms for high-involvement products in connection with the continuous intention to use IT services. The remainder of this paper is organized as follows: Section 2 explores the existing literature to build hypotheses anchored on previous studies, and Section 3 presents the research model and methods. Section 4 presents the results analyzed via partial least squares structural equation modeling (PLS-SEM) and, in Section 5, conclusions and implications based on the study are presented.
2. Literature Review and Hypotheses
2.1. Service Standardization
Service innovation is achieved by organizing innovation as a systematic process [6]. A systematic process is required to ensure sustainable service quality. Furthermore, various recent technology approaches are required, such as IT. More importantly, customers should accept new services and the disruption should propagate. It is imperative that sustainable innovation is achieved so that both the customer and service provider can accept the innovative infrastructure [7].
The use of digital technology is not only innovative but also the most efficient and reliable method of managing risk. Turning a product into a service requires the use of digital technology. Sklyar et al. [8] analyzed the effects of digital services on the manufacturing industry and found that, at a macroscopic level, efforts to maximize the utility of digital technology in line with service application strategies are important. Sklyar et al. [9] analyzed the effect of the digitization of services on the participants of the service network. Immonen et al. [10] proposed scenario-based service requirements engineered to establish the sustainability of digital services. Digitizing services reduces inefficiency in the market and enables environment optimization for both service providers and customers.
The standardization of services enables a detailed comparison and contrast of services, thus providing a structural and realizable service framework [11]. A visible service platform adequately reflects the application of IT in addition to environmental changes. Smedlund [12] classified service platforms as business models, provided a categorization of such service platforms, and proposed a sustainable service construction plan. Löfberg and Åkesson [13] also analyzed the groundwork of successful service platforms and proposed a service framework comprising a service module, the integration of resources, and value creation. Not only do firms participate in service platforms, but service providers, consumers, and all related personnel also work together to create value in the process. Aulkemeier et al. [14] conducted research to establish service platforms on the Internet. They suggest the importance of an e-service platform that integrates both physical and intangible services. Moreover, they emphasized the specialization and division of work through extended research in the e-service supply chain field.
2.2. Service Platforms
Several methods should be considered for a service platform using IT. Some studies have focused on the application of IT to service platforms [15] or online-to-offline e-commerce service platforms that consider standardization in an online business platform [16]. Further studies on service standardization have led to reappraisals of service quality. Service standardization needed for service quality enhancement identifies the rate of satisfaction, and is utilized as a resource for establishing a sustainable business ecosystem [17]. Finally, the service platform is evaluated by customers, and satisfied customers remain loyal to the service platform [18]. It is important to identify the factors that satisfy customers in a standardized service platform and reflect such changes in the process. The service platform, in particular, simultaneously needs to meet both the customer’s and service provider’s needs.
Based on the extended TAM, we aim to analyze the specificities of the system and ascertain service quality. System quality reflects the standardized platform provided by the producer, and it aims to quantify the level of service that the customer individually recognizes. When the producer proposes innovation, the model selects certain parameters, such as the rate of customers’ resistance to new technology and customers’ personalization needs, in order to frame an efficient service platform. This research takes the TAM as a baseline model, (1) adds a leading variable to propose an extended TAM, and (2) analyzes the effect of the subordinate parameters. The leading variable is derived from the IS success model, and system quality and service quality are chosen as extra parameters.
2.3. TAM
The TAM, proposed by Davis [19], explains the process of customers’ acceptance of new technology based on the rational theory of action. The TAM takes recognized utility and recognized accessibility as independent parameters, and analyzes their effects on behavioral intent. This study considers the complexity of the model and selects the leading variable. After further reviewing the factors in the previous literature, system quality adopts security and data co-ownership, while service quality elects IR and efficiency as contributing factors.
Delone and Mclean’s [20] IS success model recognizes service, system, and information quality as the preceding variables. The IS success model is currently being applied in various research fields, particularly as the mobile environment expands [21]. This model is used to evaluate the effect of mobile commerce on consumer satisfaction by analyzing the service process [22,23] and its effect on user satisfaction by improving the education service system [24] to enhance the IT service quality of the enterprise [25].
A simplified model was constructed with two variables (i.e., system quality and service quality) including the information quality of system and service quality and, based on this model, an integrated relationship was derived [26]. Focusing on system quality and service quality is useful for enhancing the understanding of service processes and performing systematic analysis. Xu et al. [27] analyzed the effects between e-service variables and the causes of intention to use, while Pratiwi and Mujadilah [28] analyzed user satisfaction with banking services in mobile environments. Thus, this study identified the system quality and service quality for the standardization of service providers as antecedent variables; subsequently, we derive the following hypotheses:
Hypothesis 1 (H1).
System quality influences perceived usefulness.
Hypothesis 1a (H1a).
Security influences perceived usefulness.
Hypothesis 1b (H1b).
Information sharing influences perceived usefulness.
Hypothesis 2 (H2).
System quality influences perceived ease of use.
Hypothesis 2a (H2a).
Security influences perceived ease of use.
Hypothesis 2b (H2b).
Information sharing influences perceived ease of use.
Hypothesis 3 (H3).
Service quality influences perceived usefulness.
Hypothesis 3a (H3a).
Innovativeness influences perceived usefulness.
Hypothesis 3b (H3b).
Efficiency influences perceived usefulness.
Hypothesis 4 (H4).
Service quality influences perceived ease of use.
Hypothesis 4a (H4a).
Innovativeness influences perceived ease of use.
Hypothesis 4b (H4b).
Efficiency influences perceived ease of use.
2.4. Extended TAM
The TAM has been studied extensively and is evolving in several areas. To enforce changes in corporate work processes through the adoption of IT, research on the TAM has been widely conducted. The TAM is used by organizations to analyze the impact of changes made to improve the efficiency of e-procurement [29,30] and derive strategies to improve consumer satisfaction with e-commerce and increase revisits [31]. This model has also been applied to understand the use of mobile applications to attain service process efficiency [32] and to comprehend the digital behavior of various consumers in relation to the spread of financial technology services [33,34].
The TAM has been extended and utilized in various forms. Through extended studies on the propensity and characteristics of individual students in e-learning services, researchers have attempted to derive an efficient educational method for introducing new technologies [35,36].
The extended TAM has been studied in various service fields; it has been suggested, for example [37], to help adopt and utilize social media consumers, and to create an extended model [38] considering the characteristics of the service field for virtual reality. Researchers have conducted research on telemedicine, including additional variables considering the characteristics of the medical service [39], and have attempted to introduce mobile-based monetary services in developing countries [40]. In this study, the TAM is used as a basic model to extend system quality and service quality and analyze the influence of mediators. Therefore, the following hypotheses have been established:
Hypothesis 5 (H5).
Perceived usefulness influences continuous intentions of use.
Hypothesis 6 (H6).
Perceived ease of use influences continuous intentions of use.
2.5. Mediating Variables
In this study, two variables that were expected to have opposite effects were considered as mediators (i.e., personalization (hereafter, PER) and innovation resistance (hereafter, IR)). Notably, IR is a personal reaction to consumer services and arises from various causes, such as the type of product, environment, and individual tendencies. Furthermore, IR affects an individuals’ rational choice, regardless of satisfaction in the context of consumer service acceptance [41]. Individual differences occur in tendencies to resist innovation, and service providers must consider the individuals who adopt new services [42]. In particular, the spread of new services based on new IT has a significant influence on the market entry of companies. Considering that there is a need to induce the rapid introduction of services to consumers, it is very important to consider how to tackle IR.
Lukkanen et al. [43] analyzed the differences in opinions according to the age of consumers using mobile banking. They suggested that the perception of the value of new technology was independent of consumers’ age, but that the acceptance of information on new technology differs according to age. Matsuo et al. [44] studied consumers’ IR to Internet banking services, showing that consumer experiences can reduce IR. Kaur et al. [45] analyzed the reasons why consumers do not adopt services even when there are many benefits, such as the convenience of mobile payment solutions.
Recently, new services in the digital environment have been widely introduced, and research is being actively conducted to analyze the barriers to new businesses owing to consumer IR. Tang and Chen [46] conducted a study on the obstacles to new market opportunities of resale commerce. Some studies that have identified IR as a barrier to the spread of new services suggest the adoption of massive open online courses [47], the acceptance of users’ online shopping in e-commerce [48], and the provision of food delivery applications [49] as potential solutions.
Therefore, we expect that IR as a mediator will have a negative effect on the introduction of new services.
Hypothesis 7 (H7).
Innovation resistance will mediate the relationship between system quality/service quality and perceived usefulness/perceived ease of use.
Hypothesis 7a-(1) (H7a-(1)).
Security influences innovation resistance.
Hypothesis 7a-(2) (H7a-(2)).
Information sharing influences innovation resistance.
Hypothesis 7b-(1) (H7b-(1)).
Innovativeness influences innovation resistance.
Hypothesis 7b-(2) (H7b-(2)).
Efficiency influences innovation resistance.
Hypothesis 7c (H7c).
Innovation resistance influences perceived usefulness.
Hypothesis 7d (H7d).
Innovation resistance influences perceived ease of use.
In contrast to IR, PER is a mediator that is expected to have a positive effect on the introduction of new services. Notably, PER increases consumer service satisfaction and delivers greater value to consumers. [2]. The personalization of services is a powerful way to retain customers by increasing customer loyalty [50]. The advent of Internet-based services has enabled the use of various types of personalized services, such as online shopping activities [51] and the personalization of services in the field of Internet banking [3]. Recently, research has been conducted on the personalization of services in the smart environment of mobile technology [52], including mobile banking [53] and online retail convenience facilities [54] that offer extended personalization services. With the development of IT, personalized services are being provided in various data-based mobile environments. However, previous studies on this topic lack an analysis of the level and degree of personalization, and do not reflect the characteristics of individual service users. Personalization can be a powerful tool to satisfy consumers, but it cannot solve every issue; thus, various environments, factors, and consumer characteristics must be considered [55]. The hypotheses that consider personalization as a mediator are listed as follows:
Hypothesis 8 (H8).
Personalization will mediate the relationship between system quality/service quality and perceived usefulness/perceived ease of use.
Hypothesis 8a-(1) (H8a-(1)).
Security influences personalization.
Hypothesis 8a-(2) (H8a-(2)).
Information sharing influences personalization.
Hypothesis 8b-(1) (H8b-(1)).
Innovativeness influences personalization.
Hypothesis 8b-(2) (H8b-(2)).
Efficiency influences personalization.
Hypothesis 8c (H8c).
Personalization influences perceived usefulness.
Hypothesis 8d (H8d).
Personalization influences perceived ease of use.
Figure 1 shows the proposed conceptual model and eight hypothesized relationships. Figure 1 also represents an integrated conceptual model constructed to evaluate the relationships between the constructs and mediation effects.
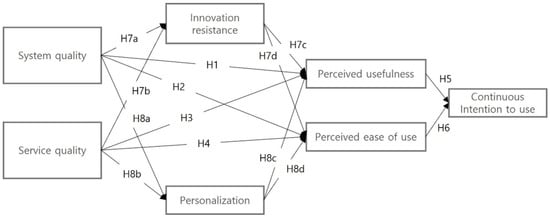
Figure 1.
Research model.
3. Research Methodology
3.1. Research Design
In this study, a structural equation model was used to determine the effect between variables through statistical analysis. Structural equation models are generally useful for examining the influence between several variables. In this study, the standardization factors of the service platform were derived and the effect of the mediating variables affecting the consumer’s acceptance of new services was confirmed.
This study was designed using PLS-SEM platform for the standardization of services. Based on the extended TAM, the variables of the IS success model were used to explain the relationships between the variables, and the effects of the mediating variables were analyzed. The study procedure was as follows: first, we checked the preliminary considerations such as latent variables, the path of the model, and the number of samples required. Second, we evaluated the reflective measurement models such as the indicator loadings, internal consistency reliability, and discriminant validity. Third, we evaluated formative measurement models such as convergence validity, indicator collinearity, statistical significance, and relevance of the indicator weights. Finally, the structural models and robustness levels were checked.
3.2. Case Study
In Korea, PropTech services have emerged since 2018, and more than 300 service providers currently deliver services to customers. PropTech services combine advanced technology and real estate, and their use has increased as a result of the extensive implementation of social distancing [56]. PropTech services, originating from a platform that provides real estate information, have diversified from real estate development to building design and construction, and the numbers of service providers and investments in this area are also rapidly increasing [57]. Although PropTech has not yet reached the level of developed countries, many people know and have experience in using PropTech services [58]. Since the PropTech service platform can provide personalized services [59] based on a standardized system, it was considered the most suitable field for the purpose of this study.
3.3. Sample and Research Instruments
In order to determine the minimum sample size, the inverse square root method proposed by Kock and Hadaya [60] was used.
According to the formula for the minimum sample size proposed by Kock and Hadaya [60], the minimum number of samples required would be 155 considering a significance level of 5% and a minimum path coefficient of 0.2.
In order to derive a more accurate sample number, we used the software G*power 3.1.9.7 (Jochen Grommisch, Düsseldorf, Germany) to calculate sample size [61]. The minimum sample size is provided with the following settings: F^2 = 0.15; a = 0.05; number of predictors = 4; and power set to 80% [62]. The sample size required to test this model was found to be 85. In the PLS-SEM, 524 respondents satisfied the minimum sample size for the survey [63,64].
Based on the expanded TAM, the model was expanded by adding the variables of the IS success model, and the effect of the mediating variables of innovation resistance and personalization on the acceptance of new services was analyzed. There are few empirical studies surrounding PropTech and, therefore, this study proposed an extended model to analyze the effect on the continuous intentions of use by analyzing the path coefficient to derive the standardization factors of the service platform. In addition, the mediating variables were added and studied to analyze the impact on the acceptance of service platforms using new technologies.
The survey was based on the related previous literature [65,66,67]. Some of the phrases were edited and amended according to the PropTech service. Specifically, the study tried to refine the survey tool by eliminating questionnaires with low correlation. The final survey comprised topics on security (four items), information sharing (six items), innovativeness (four items), efficiency (eight items), innovation resistance (four items), personalization (three items), perceived usefulness (six items), perceived ease of use (six items), and continuous intention to use (seven items) (Table 1).

Table 1.
Questionnaire source and number of items.
To achieve the most accurate response, a pilot study was carried out on 38 academic personnel and PropTech service experts. The pilot group completed the survey and suggested a slight modification to the survey language used. After integrating the proposed modifications, we finalized the survey with a 7-point Likert scale and decided to use closed answers. Moreover, we found that the respondents had already used PropTech services in the past, which contributed to a better alignment of the survey.
3.4. Analysis
After explaining the characteristics of the respondents via descriptive statistics, we analyzed the survey using the recently introduced PLS-SEM approach. Notably, PLS-SEM is a powerful tool that has minimum requirements for estimation parameters, and it is effective in modeling latent parameters in a non-normal distribution [68]. PLS-SEM is a suitable research method for path analysis with variables that are indirectly measured through other variables. Indirectly measured variables are common latent variables, and this approach uses latent variables for path coefficient analysis [59,69].
In PLS-SEM, we substantiated the validity of the model and implemented a non-recursive least squares method to retrieve the external weights and structural model relations. Finally, we used bootstrap resampling to evaluate the statistical significance. The collected data were programmed in SPSS 20 before PLS-SEM. To verify the hypotheses we used SMART PLS 3.0, an SEM tool. Using SmartPLS 3.0, this study tested the model with a path weight scheme. We evaluated model fit and reliability, and the heterotrait/monotrait ratio of correlations (HTMT) to confirm discriminant validity. Finally, we were able to provide the results of the structural model.
4. Results
The model developed in this study is a tool for analyzing customers using PropTech services. Between 11 October 2021 and 15 November 2021, the mobile survey application registered 992 responses in total. After thoroughly examining the survey, we screened 524 valid and usable samples and calculated a 58.94% response rate. Table 2 lists the demographic information of the 524 respondents.
Table 2.
Demographic information.
To test the model, we used SmartPLS 3.0 with a path weight scheme. The bootstrap procedure drew 524 cases and 5000 samples using the unsigned option. When evaluating and reporting results [64,78], the measurement model was evaluated before the structural model.
SmartPLS uses SRMR and GOF to evaluate model fit. The GOF is obtained by multiplying the average value of R2 by the average value of the average variance extracted (AVE) and taking the square root again. The GOF value of this research model was 0.694, which constitutes a good goodness of fit [68,79]. The SRMR value is calculated based on standardized residuals [80]. When the model’s goodness of fit is complete, SRMR becomes 0, and if it is less than 0.08, it is judged that the model’s goodness of fit is good. It can be judged that the SRMR of this research model had a high goodness of fit of 0.051. In addition, an RMS_theta value of 0.116 indicates that the model is appropriate, with higher values indicating lower levels of appropriateness [81].
Table 3 shows the results of the reliability and definitive factor analysis. In general, an item can be considered valid if its standard loading value is 0.5 or greater. If the mean AVE value is also greater than or equal to 0.5, the grouping factor can be considered as a reliability valid [78] composite, as was the case for the five reflectively measured constructs in our study ranging from 0.93 to 0.96, as these exceeded the minimum requirement of 0.70.
Table 3.
Validity and reliability of measures.
In this study, the variance inflation factor (VIF) was identified as a potential factor proposed by Knock [82] to investigate the common method variance (CMV) that may occur in PLS-SEM. As a result of checking for multicollinearity in the path between latent variables, the VIF did not exceed the threshold of 5, with minimum and maximum values of 1.442 and 3.456, respectively. The CMV was not an issue in the present study. In addition, the possibility of the CMV was low because the correlation coefficient between the variables was not high [69].
The Fornell and Larcker [83] criterion showed that all the AVE values for the specular construct were higher than the squared cross-construct correlation, indicating discriminant validity. Similarly, all the indicator loadings were higher than their respective cross-loadings, thus providing further evidence of discriminant validity. Table 4 shows the diagonal AVE values and the diagonal squared cross-composition correlations.
Table 4.
Discriminant validity results.
To confirm discriminant validity, the heterotrait/monotrait ratio of correlations (HTMT) was evaluated, as suggested by Henseler et al. [84] (Table 5). Discriminant validity was established if the HTMT value was less than 0.90. In this study, the HTMT value was found to be between 0.144 and 0.891, thereby confirming the safety of the discriminant validity.
Table 5.
Heterotrait/monotrait ratio of correlations.
The structural model of the results is shown in Figure 2. R-squares were also used to judge the path coefficients of the endogenous latent variables. Most of the path coefficients with significance were found to be related at a level of p ≤ 0.01. The path coefficient of p ≤ 0.05 (ease of use -> user satisfaction and information quality -> intention to use) and the path coefficient of p ≤ 0.10 (system quality -> intention to use and service quality -> intention to use) showed a statistical relationship and indicated that meaningful analysis was possible. Table 6 lists all of the calculated values.
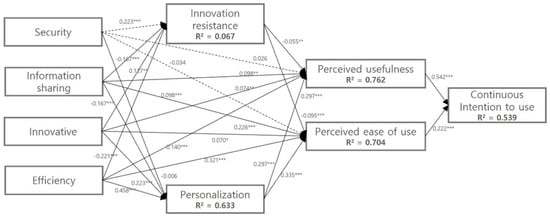
Figure 2.
Structural equation model. Notes: *** p ≤ 0.01; ** p ≤ 0.05; and * p ≤ 0.10. Dashed lines represent non-significant relationships.
Table 6.
Hypothesis testing results.
In Smart PLS, one can substantiate the effect of specific individual effects; the resulting analysis is as follows.
As shown in Table 7, “Security -> Innovation resistance” describes the situation wherein system quality enhancement calls for resistance. Security-related aspects entail not only product quality but also social quality; thus, quality enhancement before ensuring perfect security might undermine a consumer’s trust in service quality. Information sharing has a negative effect on IR and a positive effect on PER. When asking questions about information sharing with security, personal information security is excluded, and only the effect of information sharing is evaluated. Therefore, to enhance convenience, information sharing reduces IR, but could positively contribute to PER.
Table 7.
Mediation test results.
PropTech innovation is addressed before IT is implemented across the traditional services. Therefore, IR is enhanced, and users are required to adapt to the new service, which has a positive effect on PER. In traditional real estate-related services, the valuation of properties and the provision of information on the surrounding areas are the primary activities. However, PropTech can supply personalized information about the surroundings and provide a personalized service experience.
Efficiency is a key PropTech service feature that provides a new interface for data searching and transactions. Therefore, IR becomes more important when one needs to accept a new IT service; however, PER is positively affected.
Innovation resistance (efficiency) acts as a partial parameter in information sharing (perceived usefulness and perceived ease of use). It can be concluded that information sharing and efficiency contribute positively towards enhancing perceived usefulness and perceived ease of use by reducing innovation resistance. However, it has been shown that, by increasing IR, complementation and innovation may negatively affect perceived usefulness and perceived ease of use. Innovation has a direct positive effect on perceived usefulness and perceived ease of use; however, it has a negative effect in relation to some factors.
For PER, all independent variables except security showed positive partial factor effects between utility and accessibility.
Regarding the analysis of the parameters, the obtained results are as follows: (1) security takes IR as a parameter and reduces customer use intention through perceived usefulness and perceived ease of use; (2) information sharing takes PER as a factor and increases the users’ use intentions despite IR; however, its effects are limited; (3) innovation resistance takes PER as a factor and positively contributes towards enhancing the continuous intention to use. This does not exhibit a negative effect on IR. In particular, PER takes perceived usefulness and perceived ease of use as parameters; (4) innovation resistance affects the customers’ continuous intention to use the product without perceived usefulness, and a relationship exists between IR and perceived ease of use, but disruption does not accompany perceived ease of use; (5) efficiency shows a general positive effect via PER, as well as a negative effect via IR; and finally, in general (6), IR unfolds the most efficient process for aligned positive effects and does not exhibit a negative effect. Even with information sharing, the IR effect is limited. Any procedure to enhance security has been shown to have a negative effect on CIU (continuous intention to use), which is the ultimate goal of this study.
5. Discussion
This study focuses on the IR shown during the adoption process of a newly introduced IT service and considers PER as a contrasting feature. Considering these two features of product quality as system and service quality factors, we aimed to investigate the effects of such product quality components on IR and PER during the adoption process. As demonstrated by the results of our study, the results of IR during the adoption process of high-involvement products were similar to those previously seen when assessing low-involvement products [41,42].
For the study, we selected the PropTech service. This service is gaining prominence as a high-involvement real-estate IT platform service. We suggested three implications for the product quality adoption process. First, we identified how the PropTech service could be met with IR and described the underlying mechanisms of such a process [26,27]. The real estate properties that are evaluated and traded on PropTech services are high-involvement products, and it has been suggested that if more information on such products is supplied at an accessible level, a more detailed valuation of such products would be provided. In this study, we demonstrate that the IR shown during the valuation of low-involvement products is similar to that exhibited towards PropTech services, which process the information of high-involvement products.
Furthermore, IR has been demonstrated to have negative effects on service platforms [41]. The previous research of Matsuo et al. [44] demonstrated a similar discovery that, when a customer accepts a new service, he or she focuses more on rationality than on the satisfaction that follows from the service. Here, we note the need to reconsider the definition of product quality dimensions. To select the independent variables, we divided system quality and service quality, and suggested two product quality factors. In the real output, we discovered that data sharing and efficiency demonstrated consistent effects [25], while security and innovation contributed positively to IR [47,49]. This suggests the need for a better strategy regarding product quality dimensions than that used by traditional frameworks considering product quality versus process product quality.
Lastly, we discovered that personalization is an important parameter that has a very positive impact on the adoption of a new service, in contrast to IR [2]. Previous research has also demonstrated that personalization is an important factor in service satisfaction and user retention, proving that it is an important factor for high-quality products [52,53]. In our results, we discovered that the components of data sharing and efficiency had a consistent effect on high-involvement products [55], while security contributed positively to innovation resistance [47]. This signifies that better strategies are needed to maintain product quality than the traditional methods. The effect of PER (0.223) was higher than that of IR (0.127), and the explanatory variable of IR was lower, signifying that it is important to address the side effects caused higher IR after adopting innovation [45]. Lastly, the product quality effect of security is not singular, but should address the hygiene factor of product quality; if this dimension is prematurely recognized before reaching perfection, it may be met with the disruptive resistance of the user.
This study was limited to the PropTech service platform, and thus further research into high-involvement products is needed.
6. Conclusions
In this study, based on a survey of service platform users, we proposed an extended technology acceptance model that implemented a standardized service platform by considering the variables of the information system success model and analyzing the effects of the selected parameters. The effect of innovation resistance in the process of accepting information technology services was analyzed.
We discovered the need for additional research into the IR of PropTech services. While the suggested independent variables explained 63.3% of PER, they explained only 6.7% of IR. This highlights the need for research into the driving factors that affect IR in PropTech services.
The operational implications of this study are as follows: first, we believe that our efforts regarding product quality enhancement with DS and efficiency are consistent and reliable. Two quality dimension factors reduce IR and enhance PER, producing a positive effect on utility and extensibility. Second, it is imperative to consider the double-sided effect when introducing innovation into a situation. Innovation or disruptive changes have a simultaneous positive effect on PER and IR, resulting in conflicting effects on utility and extensibility.
Notwithstanding the contributions above, this study has some limitations that should be addressed in future research. First, although this study analyzed IR and the analysis of contrasting PER comprised an adequate approach, the interpretation of the empirical results explains more about PER than IR. As illustrated, the effect of IR was less explainable, thus giving rise to the need for further research into the leading variables IR. Second, while this research evaluated system and service quality, it did not properly identify the specificities of PropTech services. As PropTech services are integrated into various ISs, transactions, and qualitative information strategies, different results may ensue depending on the services used.
In future studies, a specific PropTech service should be adopted to evaluate the identified service. Lastly, we did not consider the fact that PropTech services may be used rather sporadically. While traditional information services are gradually integrated into the system, data on real estate properties on PropTech services are intermittent and occur less frequently. This reduces customers’ familiarity with the service, and system enhancement during the same period could require a new interface, which may result in the customer becoming unfamiliar with the existing service. Such characteristics of PropTech services should be amended so that the customer base can be extended and transaction efficiency can be continuously sustained.
Author Contributions
Project administration, J.K. (Jaeyoung Kim); Writing—original draft, J.K. (Jinmin Kim); Writing—review & editing, J.K. (Jinmin Kim), A.C. All authors have read and agreed to the published version of the manuscript.
Funding
This research was supported by the BK21 FOUR (Fostering Outstanding Universities for Research) funded by the Ministry of Education (MOE, Korea) and National Research Foundation of Korea (NRF).
Conflicts of Interest
The authors declare no conflict of interest.
References
- Gu, B.; Park, J.; Konana, P. Research note—The impact of external word-of-mouth sources on retailer sales of high-involvement products. Inf. Syst. Res. 2012, 3, 182–196. [Google Scholar] [CrossRef]
- Vesanen, J. What is personalization? A conceptual framework. Eur. J. Mark. 2007, 41, 409–418. [Google Scholar] [CrossRef]
- Tong, C.; Wong, S.K.S.; Lui, K.P.H. The influences of service personalization, customer satisfaction and switching costs on e-loyalty. Int. J. Econ. Financ. 2012, 4, 105–114. [Google Scholar] [CrossRef] [Green Version]
- Lynn Shostack, G. How to Design a Service. Eur. J. Mark. 1982, 16, 49–63. [Google Scholar] [CrossRef]
- Kim, J.; Kim, J. An Integrated Analysis of Value-Based Adoption Model and Information Systems Success Model for PropTech Service Platform. Sustainability 2021, 13, 12974. [Google Scholar] [CrossRef]
- Chandler, J.D.; Danatzis, I.; Wernicke, C.; Akaka, M.A.; Reynolds, D. How does innovation emerge in a service ecosystem? J. Serv. Res. 2019, 22, 75–89. [Google Scholar] [CrossRef] [Green Version]
- Trischler, J.; Johnson, M.; Kristensson, P. A service ecosystem perspective on the diffusion of sustainability-oriented user innovations. J. Bus. Res. 2020, 116, 552–560. [Google Scholar] [CrossRef]
- Sklyar, A.; Kowalkowski, C.; Tronvoll, B.; Sörhammar, D. Organizing for digital servitization: A service ecosystem perspective. J. Bus. Res. 2019, 104, 450–460. [Google Scholar] [CrossRef]
- Sklyar, A.; Kowalkowski, C.; Sörhammar, D.; Tronvoll, B. Resource integration through digitalisation: A service ecosystem perspective. J. Mark. Manag. 2019, 35, 974–991. [Google Scholar] [CrossRef] [Green Version]
- Immonen, A.; Ovaska, E.; Kalaoja, J.; Pakkala, D. A service requirements engineering method for a digital service ecosystem. Serv. Oriented Comput. Appl. 2016, 10, 151–172. [Google Scholar] [CrossRef] [Green Version]
- Hein, A.; Scheiber, M.; Böhm, M.; Weking, J.; Krcmar, H. Towards a Design Framework for Service Platform Ecosystems. In Proceedings of the Twenty-Sixth European Conference on Information Systems (ECIS 2018), Portsmouth, UK, 23–28 June 2018; p. 132. [Google Scholar]
- Smedlund, A. Value cocreation in service platform business models. Serv. Sci. 2012, 4, 79–88. [Google Scholar] [CrossRef]
- Löfberg, N.; Åkesson, M. Creating a service platform–how to co-create value in a remote service context. J. Bus. Ind. Mark. 2018, 33, 768–780. [Google Scholar] [CrossRef] [Green Version]
- Aulkemeier, F.; Paramartha, M.A.; Iacob, M.E.; van Hillegersberg, J. A pluggable service platform architecture for e-commerce. Inf. Syst. e-Bus. Manag. 2016, 14, 469–489. [Google Scholar] [CrossRef]
- Rath, M.; Pattanayak, B.K. MAQ: A mobile agent based quality of service platform for MANETs. Int. J. Bus. Data Commun. Netw. 2017, 13, 1–8. [Google Scholar] [CrossRef]
- Du, Y.; Tang, Y. Study on the Development of O2O E-commerce Platform of China from the Perspective of Offline Service Quality. Int. J. Bus. Soc. Sci. 2014, 5, 308–312. [Google Scholar]
- Xiao, Q. Managing e-commerce platform quality and its performance implication: A multiple-group structural model comparison. J. Internet Commer. 2016, 15, 142–162. [Google Scholar] [CrossRef]
- Kim, J. Platform quality factors influencing content providers’ loyalty. J. Retail. Consum. Serv. 2021, 60, 102510. [Google Scholar] [CrossRef]
- Davis, F.D. Perceived usefulness, perceived ease of use, and user acceptance of information technology. MIS Q. 1989, 13, 319–340. [Google Scholar] [CrossRef] [Green Version]
- DeLone, W.H.; McLean, E.R. Information systems success: The quest for the dependent variable. Inf. Syst. Res. 1992, 3, 60–95. [Google Scholar] [CrossRef] [Green Version]
- Phuong, N.N.D.; Dai Trang, T.T. Repurchase intention: The effect of service quality, system quality, information quality, and customer satisfaction as mediating role: A PLS approach of m-commerce ride hailing service in Vietnam. Mark. Branding Res. 2018, 5, 78. [Google Scholar] [CrossRef] [Green Version]
- Mohammad Salameh, A.A.; Ahmad, H.; Zulhumadi, F.; Abubakar, F.M. Relationships between system quality, service quality, and customer satisfaction. J. Syst. Inf. Technol. 2018, 20, 73–102. [Google Scholar] [CrossRef]
- AlSondos, I.; Salameh, A. The effect of system quality and service quality toward using m-commerce service, based on consumer perspective. Manag. Sci. Lett. 2020, 10, 2589–2596. [Google Scholar] [CrossRef]
- Widiastuti, R.; Haryono, B.S.; Said, A. Influence of system quality, information quality, service quality on user acceptance and satisfaction and Its impact on net benefits (study of information system users lecturer performance load (BKD) in Malang State University). HOLISTICA–J. Bus. Public Adm. 2019, 10, 111–132. [Google Scholar] [CrossRef] [Green Version]
- Gorla, N.; Somers, T.M.; Wong, B. Organizational impact of system quality, information quality, and service quality. J. Strateg. Inf. Syst. 2010, 19, 207–228. [Google Scholar] [CrossRef]
- Chang, C.S.; Chen, S.Y.; Lan, Y.T. Motivating medical information system performance by system quality, service quality, and job satisfaction for evidence-based practice. BMC Med. Inform. Decis. Mak. 2012, 12, 135. [Google Scholar] [CrossRef] [PubMed] [Green Version]
- Xu, J.; Benbasat, I.; Cenfetelli, R.T. Integrating service quality with system and information quality: An empirical test in the e-service context. MIS Q. 2013, 37, 777–794. [Google Scholar] [CrossRef]
- Pratiwi, W.; Mujadilah, N. Effect of Accounting Information Systems, System Quality and Service Quality on User Satisfaction of Mobile Banking-Based Applications. J. Econ. Financ. Manag. Stud. 2021, 4, 383–396. [Google Scholar] [CrossRef]
- Brandon-Jones, A.; Kauppi, K. Examining the antecedents of the technology acceptance model within e-procurement. Int. J. Oper. Prod. Manag. 2018, 38, 22–42. [Google Scholar] [CrossRef]
- Ramkumar, M.; Schoenherr, T.; Wagner, S.M.; Jenamani, M. Q-TAM: A quality technology acceptance model for predicting organizational buyers’ continuance intentions for e-procurement services. Int. J. Prod. Econ. 2019, 216, 333–348. [Google Scholar] [CrossRef]
- Fedorko, I.; Bacik, R.; Gavurova, B. Technology acceptance model in e-commerce segment. Manag. Mark. 2018, 13, 1242–1256. [Google Scholar] [CrossRef]
- Rafique, H.; Almagrabi, A.O.; Shamim, A.; Anwar, F.; Bashir, A.K. Investigating the acceptance of mobile library applications with an extended technology acceptance model (TAM). Comput. Educ. 2020, 145, 103732. [Google Scholar] [CrossRef]
- Hu, Z.; Ding, S.; Li, S.; Chen, L.; Yang, S. Adoption intention of fintech services for bank users: An empirical examination with an extended technology acceptance model. Symmetry 2019, 11, 340. [Google Scholar] [CrossRef] [Green Version]
- Singh, S.; Sahni, M.M.; Kovid, R.K. What drives FinTech adoption? A multi-method evaluation using an adapted technology acceptance model. Manag. Decis. 2020, 58, 1675–1697. [Google Scholar] [CrossRef]
- Estriegana, R.; Medina-Merodio, J.A.; Barchino, R. Student acceptance of virtual laboratory and practical work: An extension of the technology acceptance model. Comput. Educ. 2019, 135, 1–14. [Google Scholar] [CrossRef]
- Salloum, S.A.; Alhamad, A.Q.M.; Al-Emran, M.; Monem, A.A.; Shaalan, K. Exploring students’ acceptance of e-learning through the development of a comprehensive technology acceptance model. IEEE Access 2019, 7, 128445–128462. [Google Scholar] [CrossRef]
- Al-Qaysi, N.; Mohamad-Nordin, N.; Al-Emran, M. Employing the technology acceptance model in social media: A systematic review. Educ. Inf. Technol. 2020, 25, 4961–5002. [Google Scholar] [CrossRef]
- Manis, K.T.; Choi, D. The virtual reality hardware acceptance model (VR-HAM): Extending and individuating the technology acceptance model (TAM) for virtual reality hardware. J. Bus. Res. 2019, 100, 503–513. [Google Scholar] [CrossRef]
- Kamal, S.A.; Shafiq, M.; Kakria, P. Investigating acceptance of telemedicine services through an extended technology acceptance model (TAM). Technol. Soc. 2020, 60, 101212. [Google Scholar] [CrossRef]
- Gbongli, K.; Xu, Y.; Amedjonekou, K.M. Extended technology acceptance model to predict mobile-based money acceptance and sustainability: A multi-analytical structural equation modeling and neural network approach. Sustainability 2019, 11, 3639. [Google Scholar] [CrossRef] [Green Version]
- Szmigin, I.; Foxall, G. Three forms of innovation resistance: The case of retail payment methods. Technovation 1998, 18, 459–468. [Google Scholar] [CrossRef]
- Heidenreich, S.; Handrich, M. What about passive innovation resistance? Investigating adoption-related behavior from a resistance perspective. J. Prod. Innov. Manag. 2015, 32, 878–903. [Google Scholar] [CrossRef]
- Laukkanen, T.; Sinkkonen, S.; Kivijärvi, M.; Laukkanen, P. Innovation resistance among mature consumers. J. Consum. Mark. 2007, 24, 419–427. [Google Scholar] [CrossRef]
- Matsuo, M.; Minami, C.; Matsuyama, T. Social influence on innovation resistance in internet banking services. J. Retail. Consum. Serv. 2018, 45, 42–51. [Google Scholar] [CrossRef]
- Kaur, P.; Dhir, A.; Singh, N.; Sahu, G.; Almotairi, M. An innovation resistance theory perspective on mobile payment solutions. J. Retail. Consum. Serv. 2020, 55, 102059. [Google Scholar] [CrossRef]
- Tang, Z.; Chen, L. Understanding Seller Resistance to Digital Device Recycling Platform: An Innovation Resistance Perspective. Electron. Commer. Res. Appl. 2021, 51, 101114. [Google Scholar] [CrossRef]
- Ma, L.; Lee, C.S. Understanding the barriers to the use of MOOCs in a developing country: An innovation resistance perspective. J. Educ. Comput. Res. 2019, 57, 571–590. [Google Scholar] [CrossRef]
- Lian, J.W.; Liu, H.M.; Liu, I.L. Applying innovation resistance theory to understand user acceptance of online shopping: The moderating effect of different product types. Comput. Technol. Appl. 2012, 3, 188–193. [Google Scholar]
- Kaur, P.; Dhir, A.; Ray, A.; Bala, P.K.; Khalil, A. Innovation resistance theory perspective on the use of food delivery applications. J. Enterp. Inf. Manag. 2021, 34, 1746–1768. [Google Scholar] [CrossRef]
- Ball, D.; Coelho, P.S.; Vilares, M.J. Service personalization and loyalty. J. Serv. Mark. 2006, 20, 391–403. [Google Scholar] [CrossRef] [Green Version]
- Lee, E.J.; Park, J.K. Online service personalization for apparel shopping. J. Retail. Consum. Serv. 2009, 16, 83–91. [Google Scholar] [CrossRef]
- Marsa-Maestre, I.; Lopez-Carmona, M.A.; Velasco, J.R.; Navarro, A. Mobile Agents for Service Personalization in Smart Environments. J. Netw. 2008, 3, 30–41. [Google Scholar] [CrossRef]
- Albashrawi, M.; Motiwalla, L. Privacy and personalization in continued usage intention of mobile banking: An integrative perspective. Inf. Syst. Front. 2019, 21, 1031–1043. [Google Scholar] [CrossRef]
- Riegger, A.S.; Klein, J.F.; Merfeld, K.; Henkel, S. Technology-enabled personalization in retail stores: Understanding drivers and barriers. J. Bus. Res. 2021, 123, 140–155. [Google Scholar] [CrossRef]
- Shen, A.; Dwayne Ball, A. Is personalization of services always a good thing? Exploring the role of technology-mediated personalization (TMP) in service relationships. J. Serv. Mark. 2009, 23, 79–91. [Google Scholar] [CrossRef] [Green Version]
- Braesemann, F.; Baum, A. PropTech: Turning Real Estate into a Data-Driven Market? 2020. Available online: https://www.semanticscholar.org/paper/PropTech%3A-Turning-Real-Estate-Into-a-Data-Driven-Braesemann-Baum/f6de9b4e3f9 (accessed on 5 March 2022).
- Siniak, N.; Kauko, T.; Shavrov, S.; Marina, N. The impact of PropTech on real estate industry growth. In IOP Conference Series: Materials Science and Engineering; IOP Publishing: Hanoi, Vietnam, 2020; Volume 869, p. 062041. [Google Scholar]
- Saiz, A. Bricks, mortar, and PropTech: The economics of IT in brokerage, space utilization and commercial real estate finance. J. Prop. Investig. Financ. 2020, 38, 327–347. [Google Scholar] [CrossRef]
- Starr, C.W.; Saginor, J.; Worzala, E. The rise of PropTech: Emerging industrial technologies and their impact on real estate. J. Prop. Investig. Financ. 2020, 39, 157–169. [Google Scholar] [CrossRef]
- Kock, N.; Hadaya, P. Minimum sample size estimation in PLS-SEM: The inverse square root and gamma-exponential methods. Inf. Syst. J. 2018, 28, 227–261. [Google Scholar] [CrossRef]
- Faul, F.; Erdfelder, E.; Buchner, A.; Lang, A.-G. Statistical power analyses using G*Power 3.1: Tests for correlation and regression analyses. Behav. Res. Methods 2009, 41, 1149–1160. [Google Scholar] [CrossRef] [Green Version]
- Gefen, D.; Rigdon, E.E.; Straub, D. Editor’s comments: An update and extension to SEM guidelines for administrative and social science research. MIS Q. 2011, 35, 3–14. [Google Scholar] [CrossRef]
- Cohen, J. Statistical Power Analysis for the Behavioral Sciences, 2nd ed.; Routledge: London, UK, 1988. [Google Scholar]
- Hair, J.F.; Ringle, C.M.; Sarstedt, M. PLS-SEM: Indeed a silver bullet. J. Mark. Theory Pract. 2011, 19, 139–152. [Google Scholar] [CrossRef]
- Petter, S.; DeLone, W.; McLean, E. Measuring information systems success: Models, dimensions, measures, and interrelationships. Eur. J. Inf. Syst. 2008, 17, 236–263. [Google Scholar] [CrossRef]
- Kim, S.H.; Bae, J.H.; Jeon, H.M. Continuous intention on accommodation apps: Integrated value-based adoption and expectation–confirmation model analysis. Sustainability 2019, 11, 1578. [Google Scholar] [CrossRef] [Green Version]
- Lau, C.K.H.; Chui, C.F.R.; Au, N. Examination of the adoption of augmented reality: A VAM approach. Asia Pac. J. Tour. Res. 2019, 24, 1005–1020. [Google Scholar] [CrossRef]
- Tenenhaus, M.; Vinzi, V.E.; Chatelin, Y.M.; Lauro, C. PLS path modeling. Comput. Stat. Data Anal. 2005, 48, 159–205. [Google Scholar] [CrossRef]
- Malhotra, N.K.; Kim, S.S.; Patil, A. Common Method Variance in IS Research: A Comparison of Alternative Approaches and a reanalysis of Past Research. Manag. Sci. 2005, 52, 1865–1883. [Google Scholar] [CrossRef]
- Fang, Y.H.; Chiu, C.M.; Wang, E.T. Understanding Customers’ Satisfaction and Repurchase Intentions: An Integration of IS Success Model. Trust. Justice Internet Res. 2011, 21, 479–503. [Google Scholar] [CrossRef]
- Zaied, A.N.H. An integrated success model for evaluating information system in public sectors. J. Emerg. Trends Comput. Inf. Sci. 2012, 3, 814–825. [Google Scholar]
- Pradeep, S.; Shawyun, T. Determinants of intention to use websites. AU J. Manag. 2008, 6, 46–59. [Google Scholar]
- Kang, J.-W.; Namkung, Y. The role of personalization on continuance intention in food service mobile apps: A privacy calculus perspective. Int. J. Contemp. Hosp. Manag. 2019, 31, 734–752. [Google Scholar] [CrossRef]
- Sohn, K.; Kwon, O. Technology acceptance theories and factors influencing artificial intelligence-based intelligent products. Telemat. Inform. 2020, 47, 101324. [Google Scholar] [CrossRef]
- Do Nam Hung, J.T.; Azam, S.F.; Khatibi, A.A. An empirical analysis of perceived transaction convenience, performance expectancy, effort expectancy and behavior intention to mobile payment of Cambodian users. Int. J. Mark. Stud. 2019, 11, 77–90. [Google Scholar] [CrossRef] [Green Version]
- Lim, J.S.; Oh, J.I. A study on the effect of the introduction characteristics of cloud computing services on the performance expectancy and the intention to use: From the perspective of the innovation diffusion theory. Asia Pac. J. Inf. Syst. 2012, 22, 9–124. [Google Scholar]
- Shaikh, A.A.; Glavee-Geo, R.; Karjaluoto, H. How relevant are risk perceptions, effort, and performance expectancy in mobile banking adoption? Int. J. E-Bus. Res. 2018, 14, 692–716. [Google Scholar] [CrossRef]
- Hair, J.F.; Sarstedt, M.; Ringle, C.M.; Mena, J.A. An assessment of the use of partial least squares structural equation modeling in marketing research. J. Acad. Mark. Sci. 2012, 40, 414–433. [Google Scholar] [CrossRef]
- Wetzels, M.; Odekerken-Schröder, G.; Van Oppen, C. Using PLS path modeling for assessing hierarchical construct models: Guidelines and empirical illustration. MIS Q. 2009, 33, 177–195. [Google Scholar] [CrossRef]
- Benitez, J.; Henseler, J.; Castillo, A.; Schuberth, F. How to perform and report an impactful analysis using partial least squares: Guidelines for confirmatory and explanatory. IS Res. Inf. Manag. 2020, 57, 103168. [Google Scholar] [CrossRef]
- Henseler, J.; Dijkstra, T.K.; Sarstedt, M.; Ringle, C.M.; Diamantopoulos, A.; Straub, D.W.; Ketchen, D.J.; Hair, J.F.; Hult, G.T.M.; Calantone, R.J. Common beliefs and reality about partial least squares. Organ. Res. Methods 2014, 17, 182–209. [Google Scholar] [CrossRef] [Green Version]
- Kock, N. Common method bias in PLS-SEM: A full collinearity assessment approach. Int. J. E-Collab. 2015, 11, 1–10. [Google Scholar] [CrossRef] [Green Version]
- Fornell, C.; Larcker, D.F. Evaluating structural equation models with unobservable variables and measurement error. J. Mark. Res. 1981, 18, 39–50. [Google Scholar] [CrossRef]
- Henseler, J.; Ringle, C.M.; Sarstedt, M. A new criterion for assessing discriminant validity in variance-based structural equation modeling. J. Acad. Mark. Sci. 2015, 43, 115–135. [Google Scholar] [CrossRef] [Green Version]
Publisher’s Note: MDPI stays neutral with regard to jurisdictional claims in published maps and institutional affiliations. |
© 2022 by the authors. Licensee MDPI, Basel, Switzerland. This article is an open access article distributed under the terms and conditions of the Creative Commons Attribution (CC BY) license (https://creativecommons.org/licenses/by/4.0/).