
Investigation on Subjects’ Seasonal Perception and Adaptive Actions in Naturally Ventilated Hostel Dormitories in the Composite Climate Zone of India

 ,
,  ,
,  , and
, and
Abstract
:1. Introduction
2. Methodology
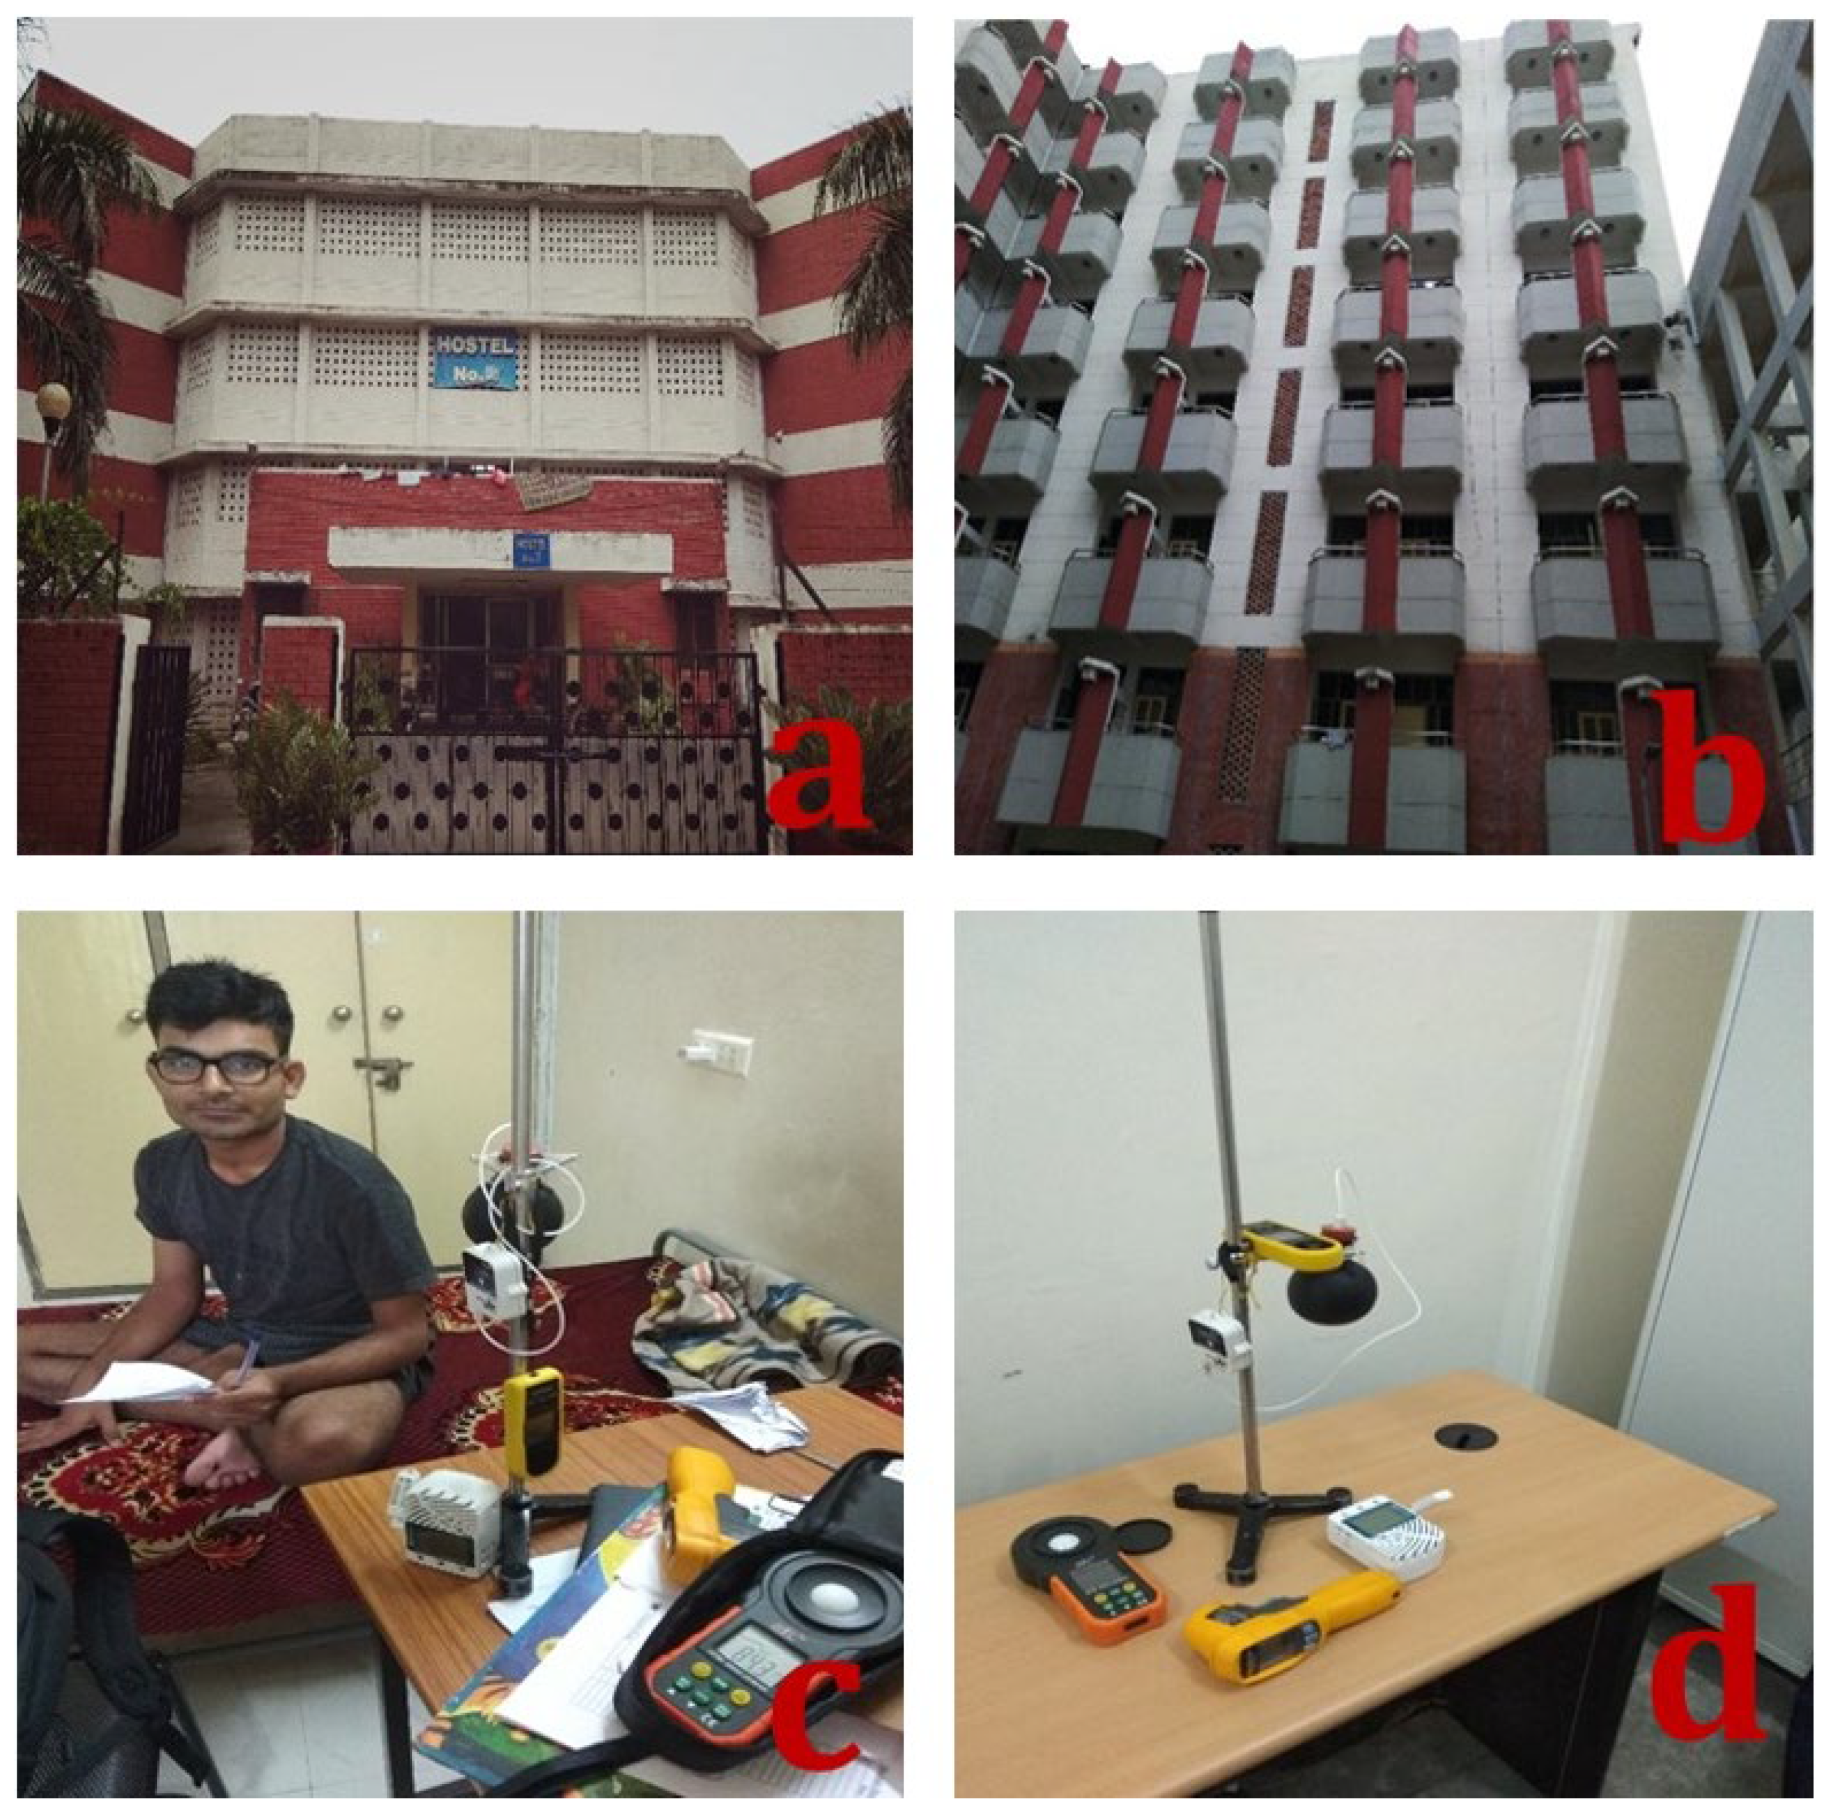
2.1. Location and the Selected Hostel Buildings
2.2. Sample Size Description
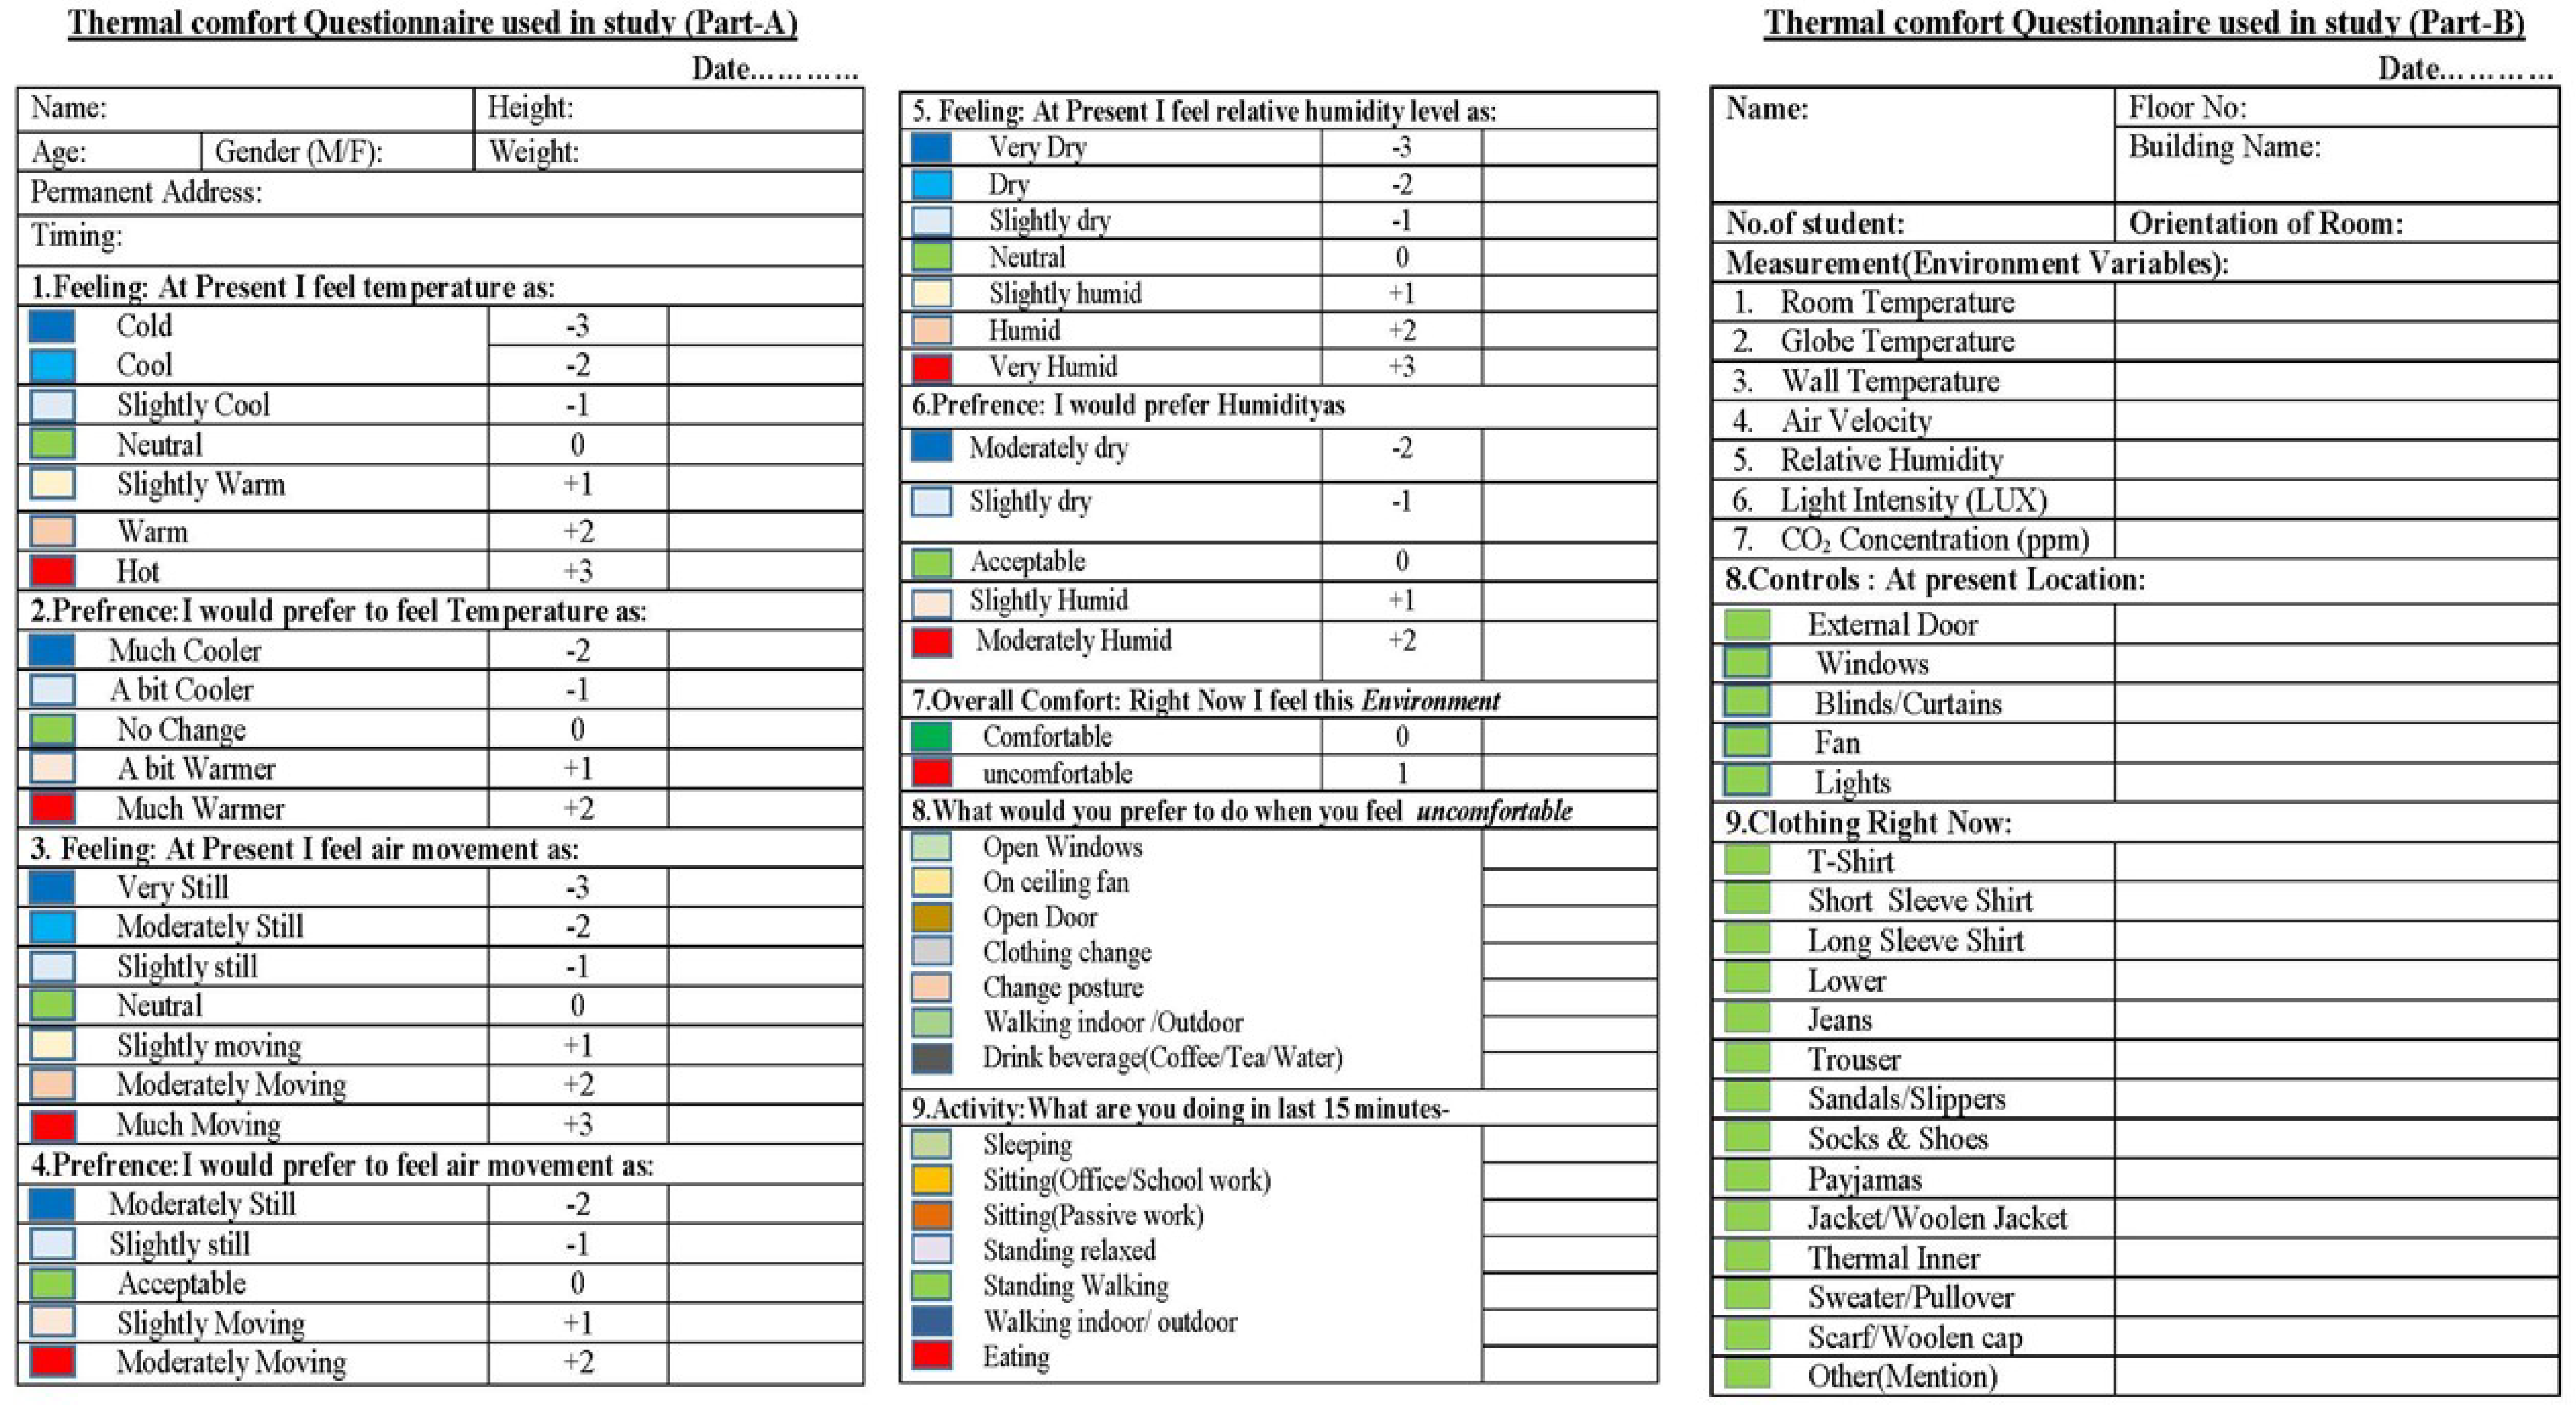
2.3. Field Study and Survey Protocols
3. Results and Discussion
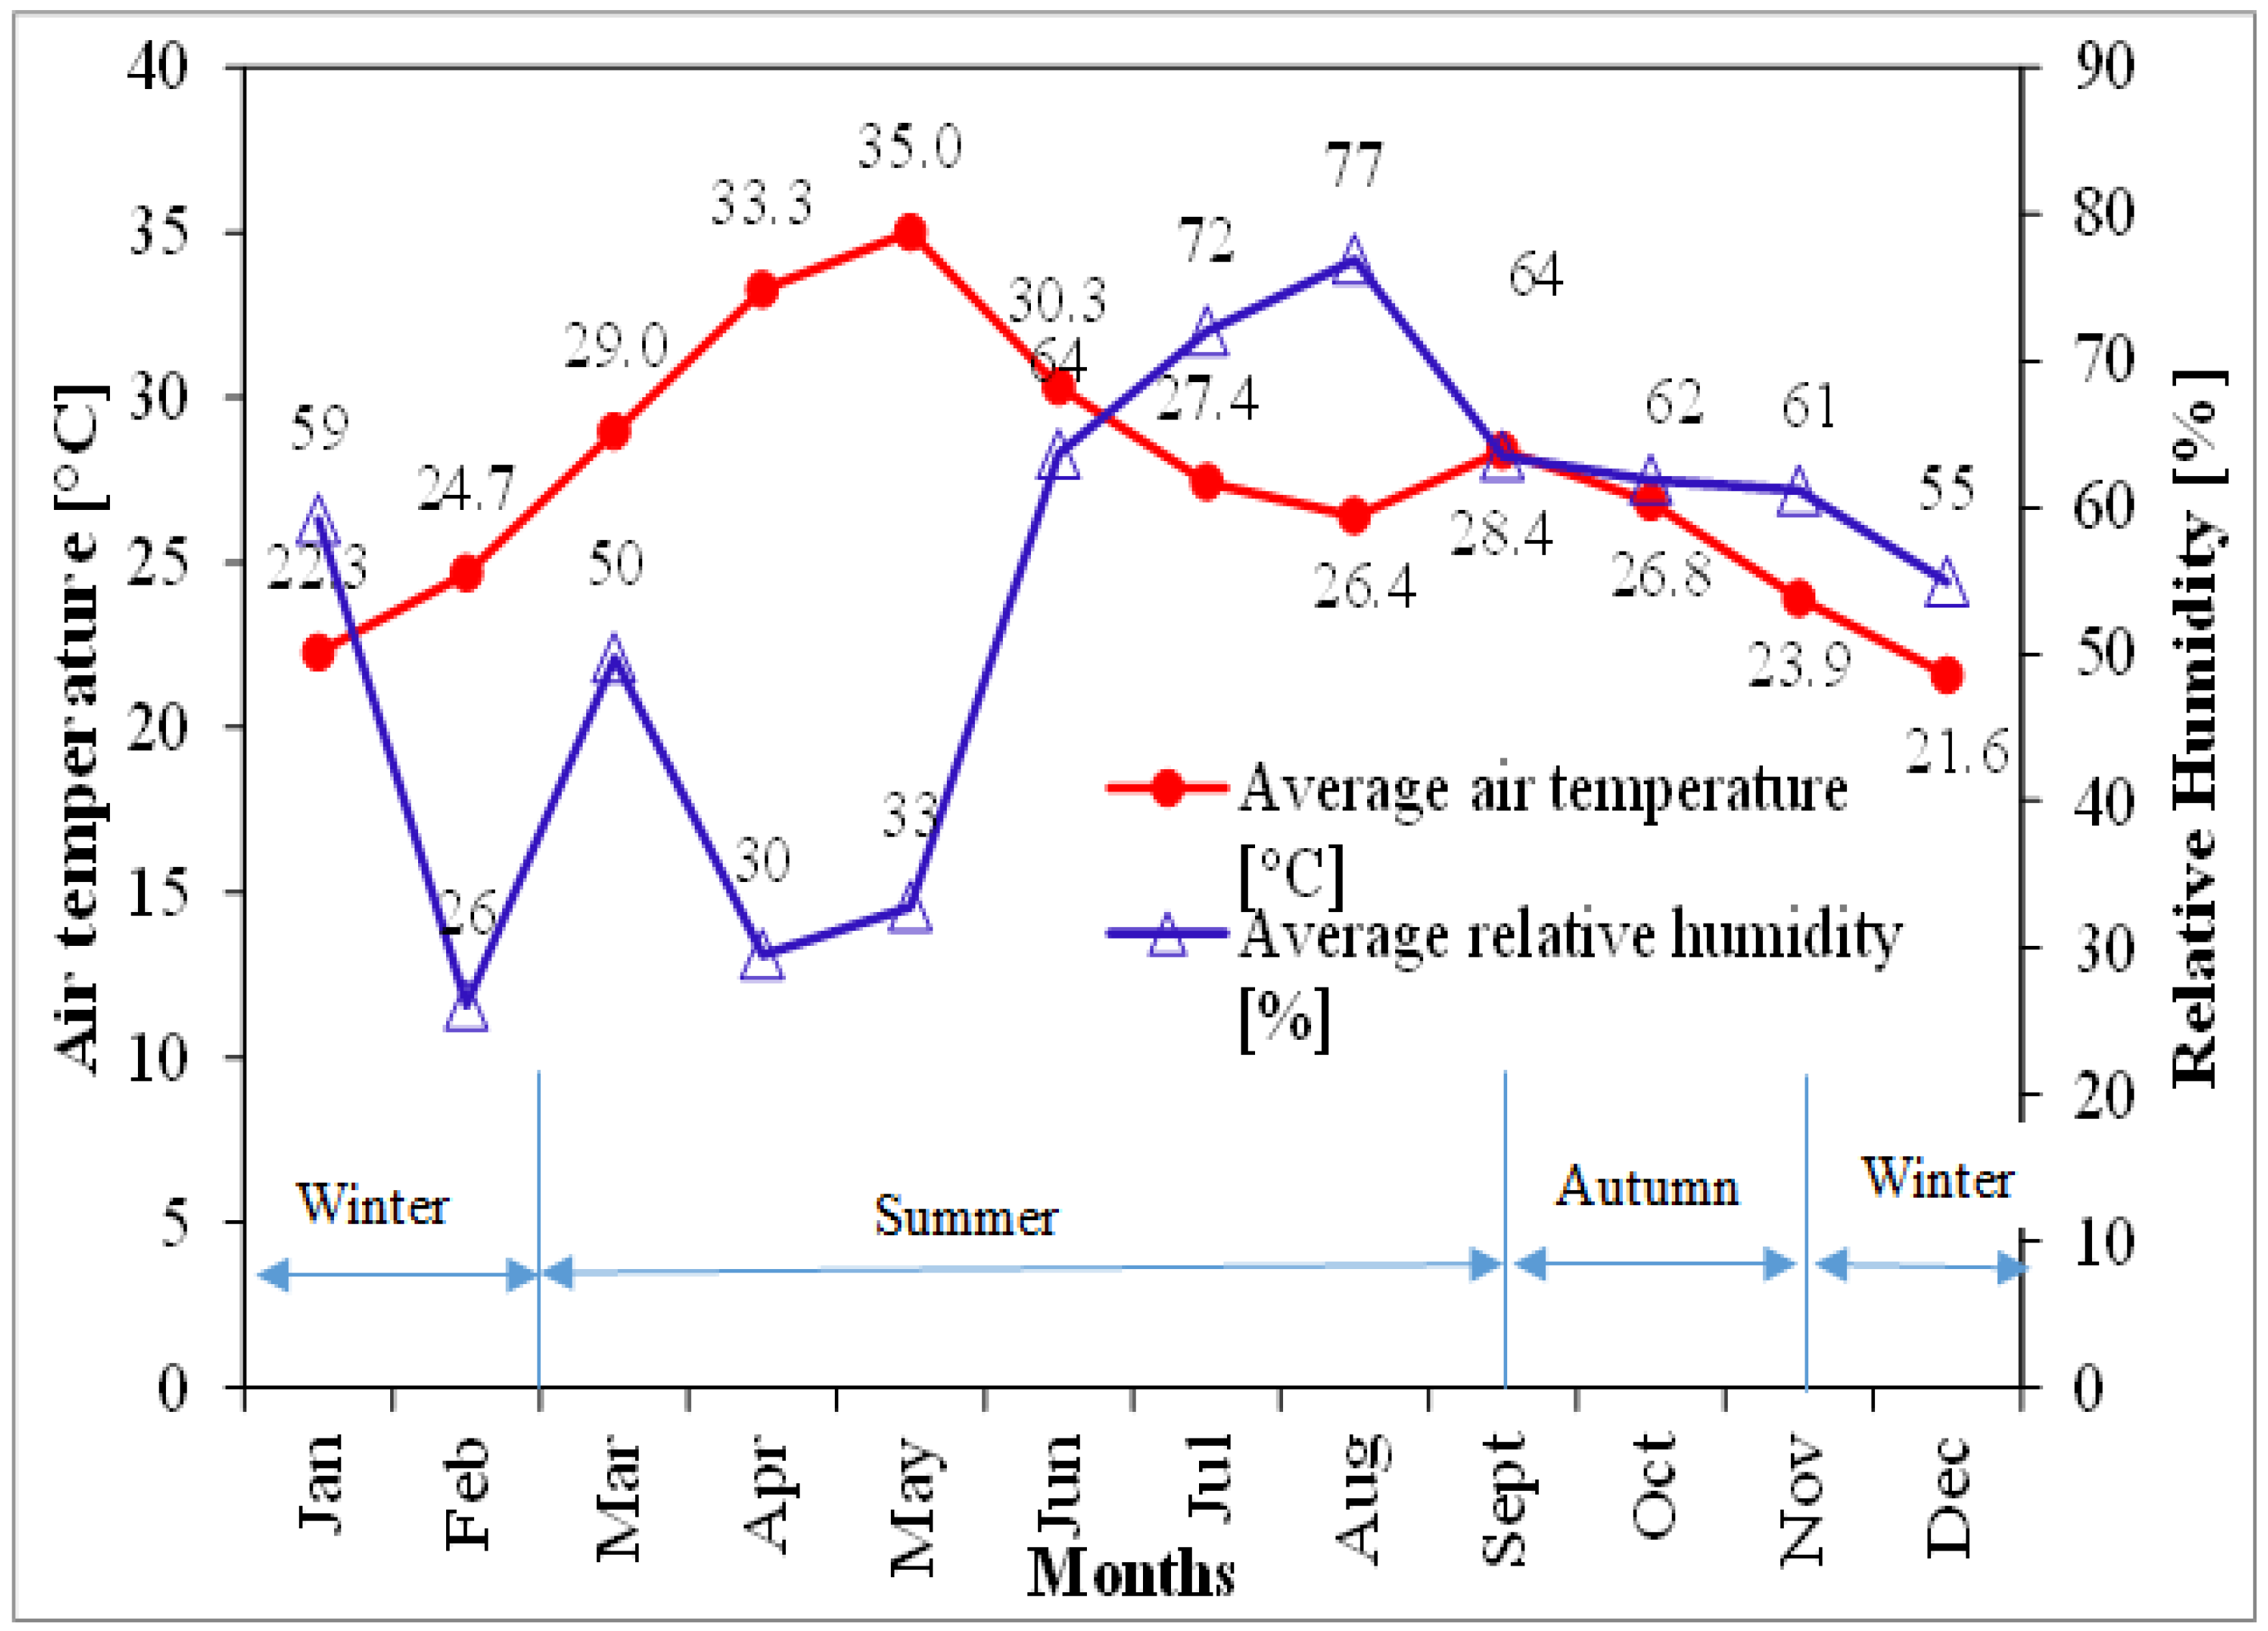
3.1. Indoor and Outdoor Thermal Environmental Conditions
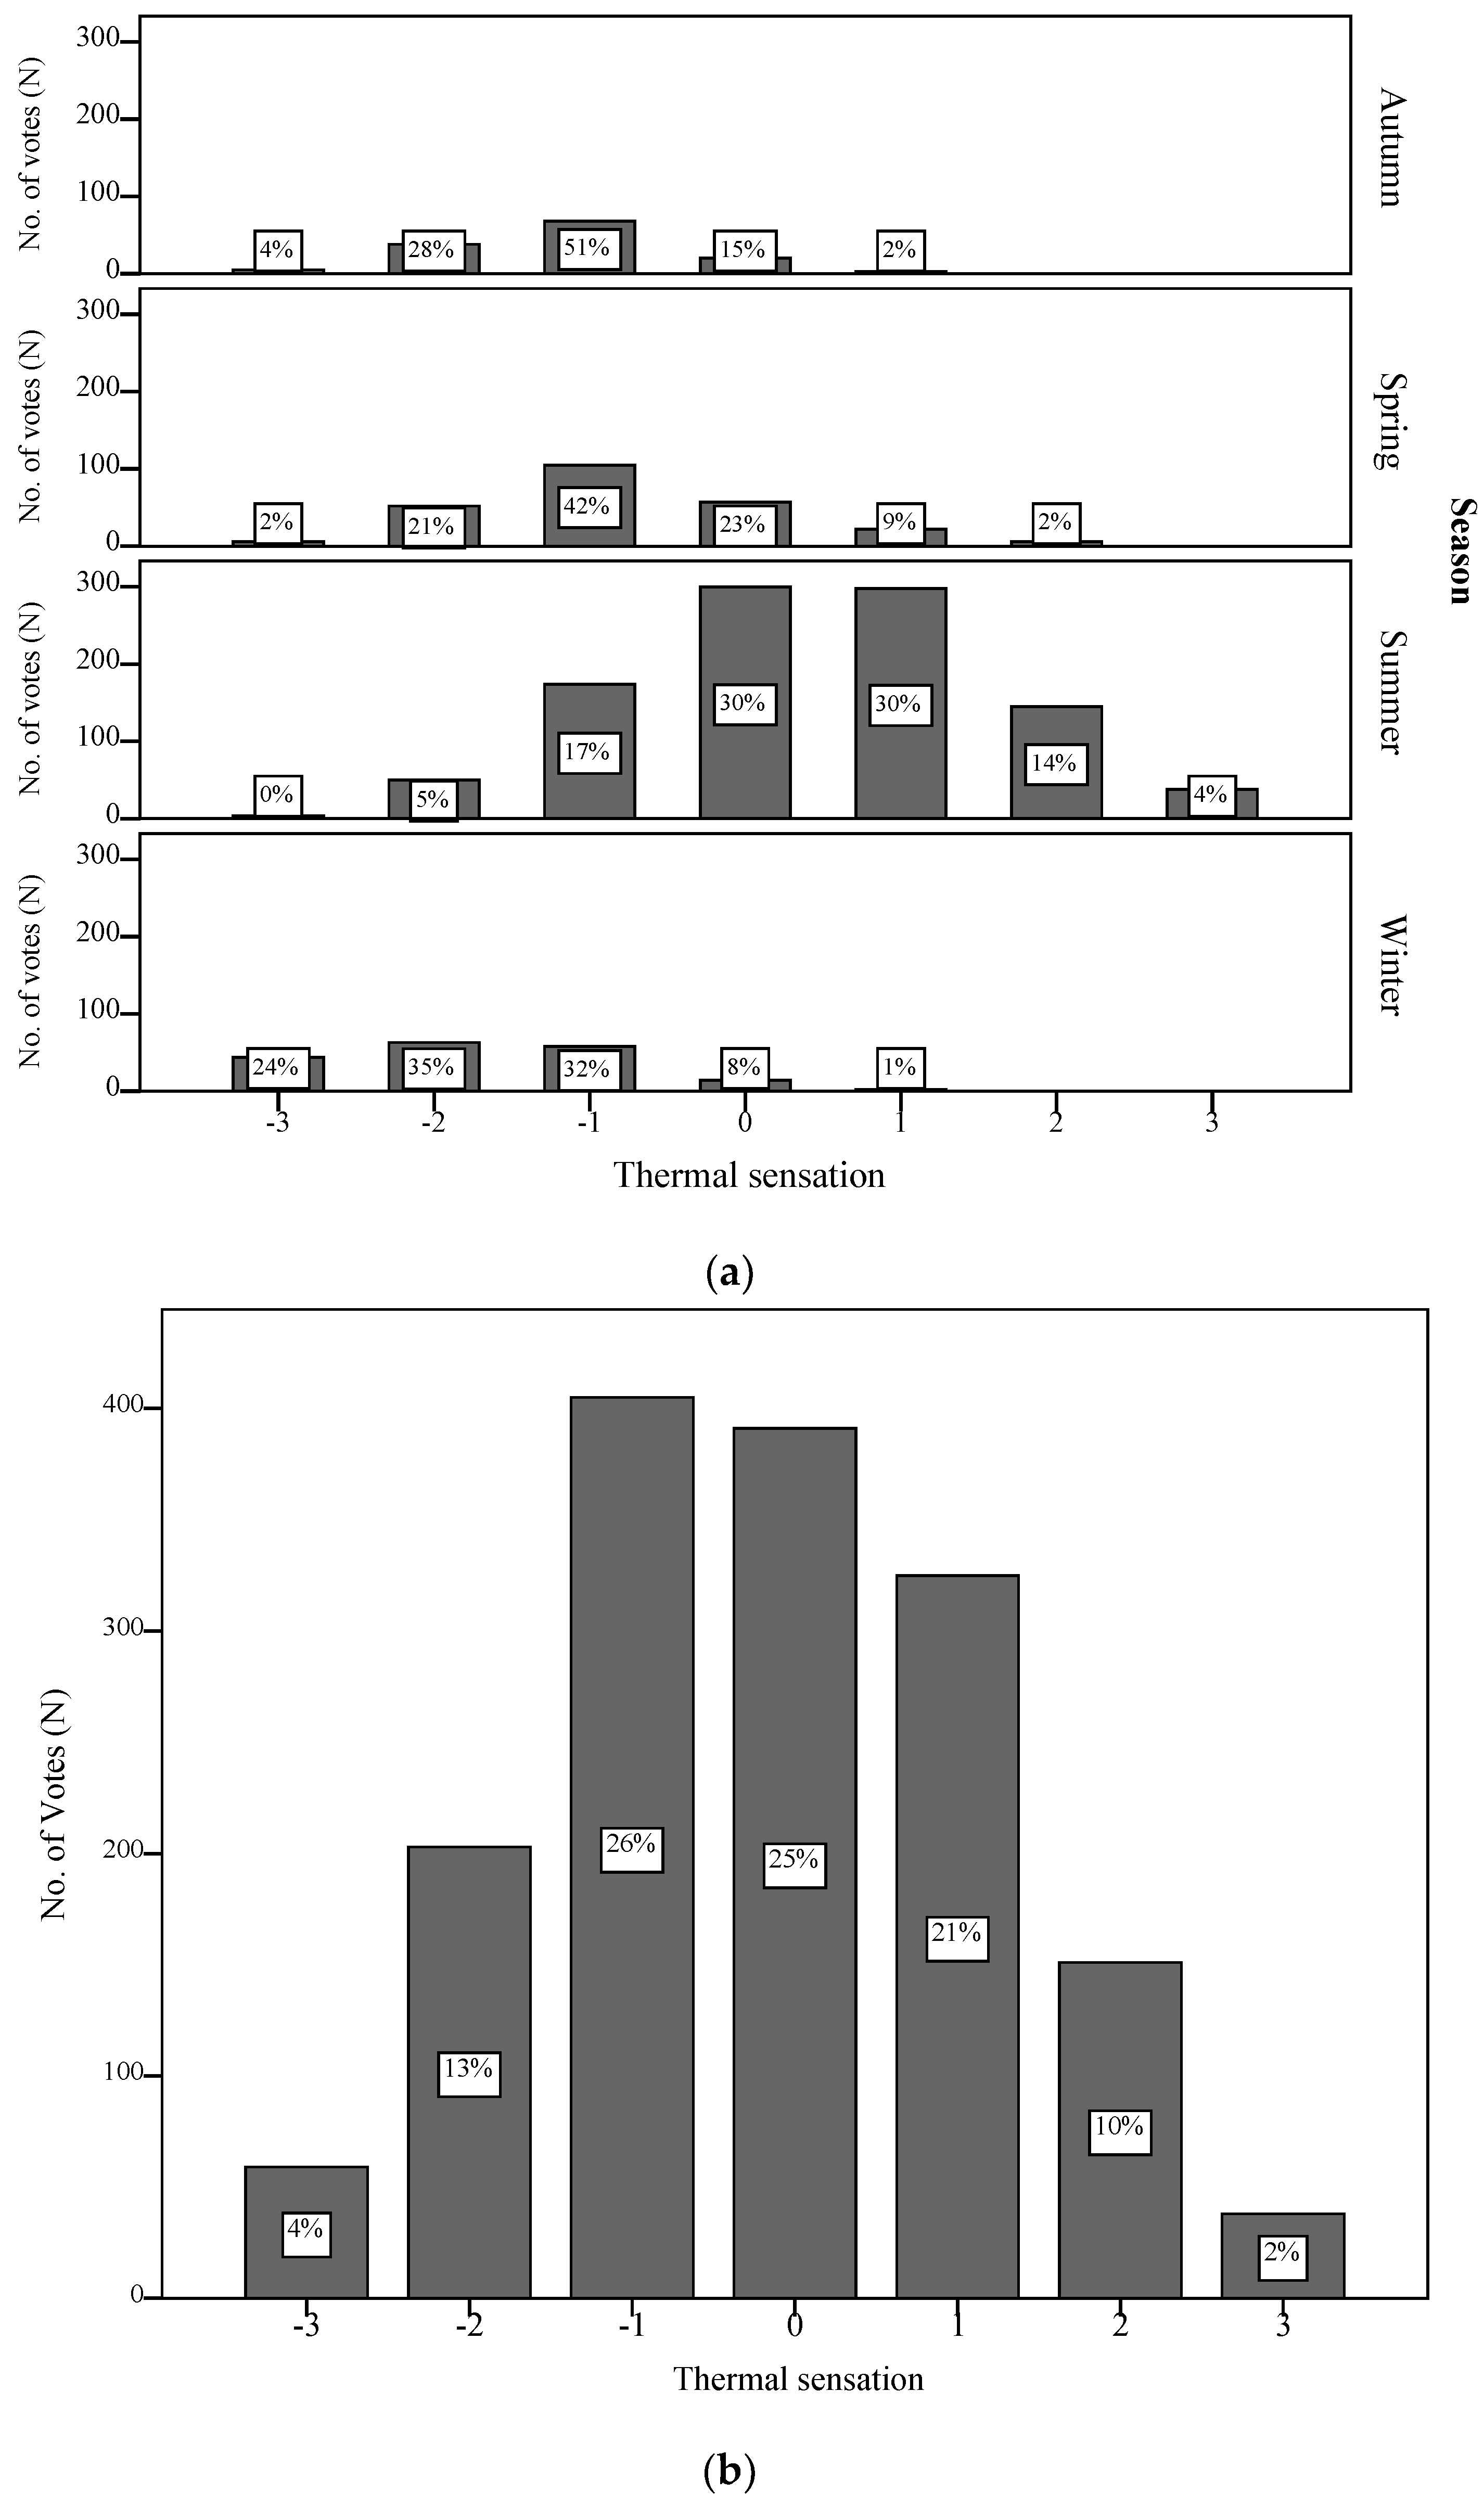
3.2. Analysis of Seasonal Thermal Sensation Votes and Preference Votes
4. Characteristics of Seasonal Comfort
4.1. Linear Regression and PMV−PPD Model Analysis
4.2. Mean Comfort Temperature (Tcomf): Griffiths Approach
5. Investigation of Thermal Adaptation Behavior of Residents
5.1. Clothing Adjustments
5.2. Impact of Controls and Exercised Controls on Comfort
6. Summary of Work and Conclusions
- 1.
- The mean thermal sensations for the students in the dormitory were recorded as “slightly cool”, “cold”, “slightly cool”, and “slightly warm” during the autumn, winter, spring, and summer seasons. The subject’s mean thermal sensation was skewed towards “slightly cool” (mean TS = −0.15; sd = ±1.37) for the combined dataset.
- 2.
- A total of 39.5%, 19.9%, 25.5%, and 40.5% of subjects in the hostel dormitories voted for “no change” in the persisting indoor thermal environment during the autumn, winter, spring, and summer seasons. However, 39.2%, 65%, and 31.2% of subjects preferred a warm thermal environment in the autumn, winter, and spring seasons, respectively. In comparison, about 13% of students preferred a cooler thermal environment in the combined dataset.
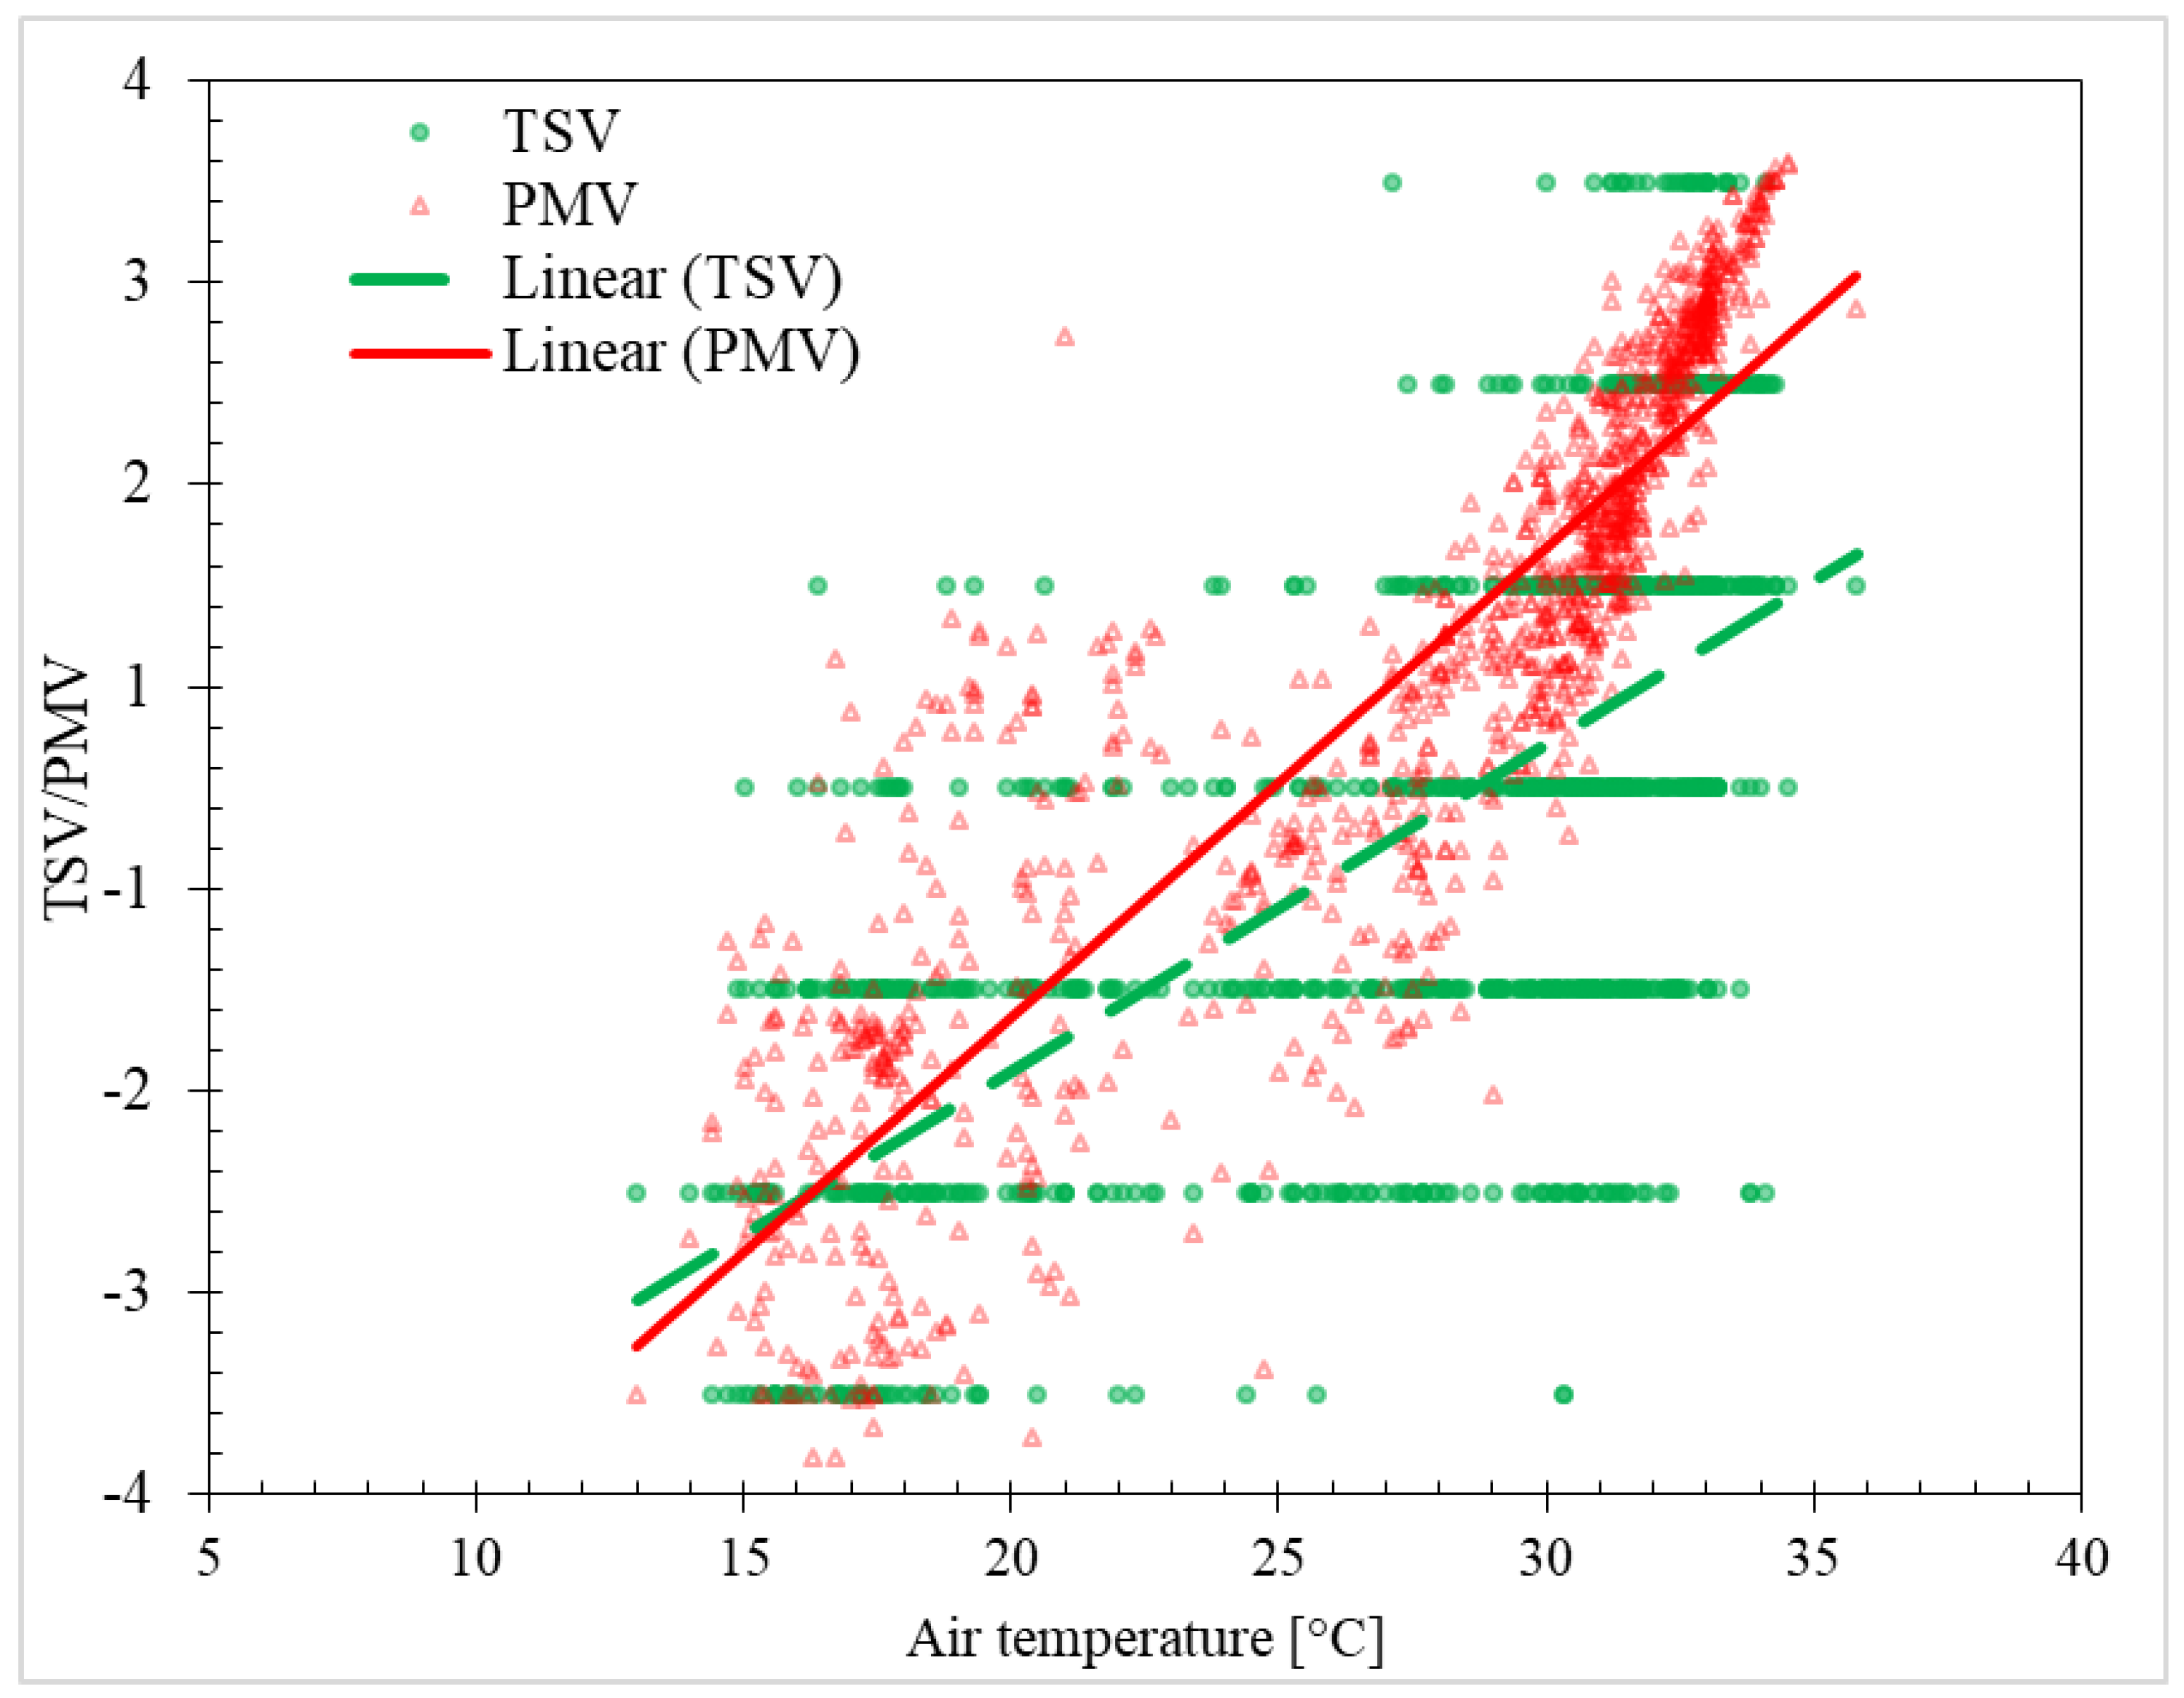
- 3.
- The PMV−PPD model overestimated and underestimated the actual thermal sensations in the summer and winter seasons.
- 4.
- The mean was about 26.9 ± 2.68 °C, 19.9 ± 2.11 °C, 22.4 ± 3.2 °C, and 29.5 ± 2.6 °C for the autumn, winter, spring, and summer seasons, respectively.
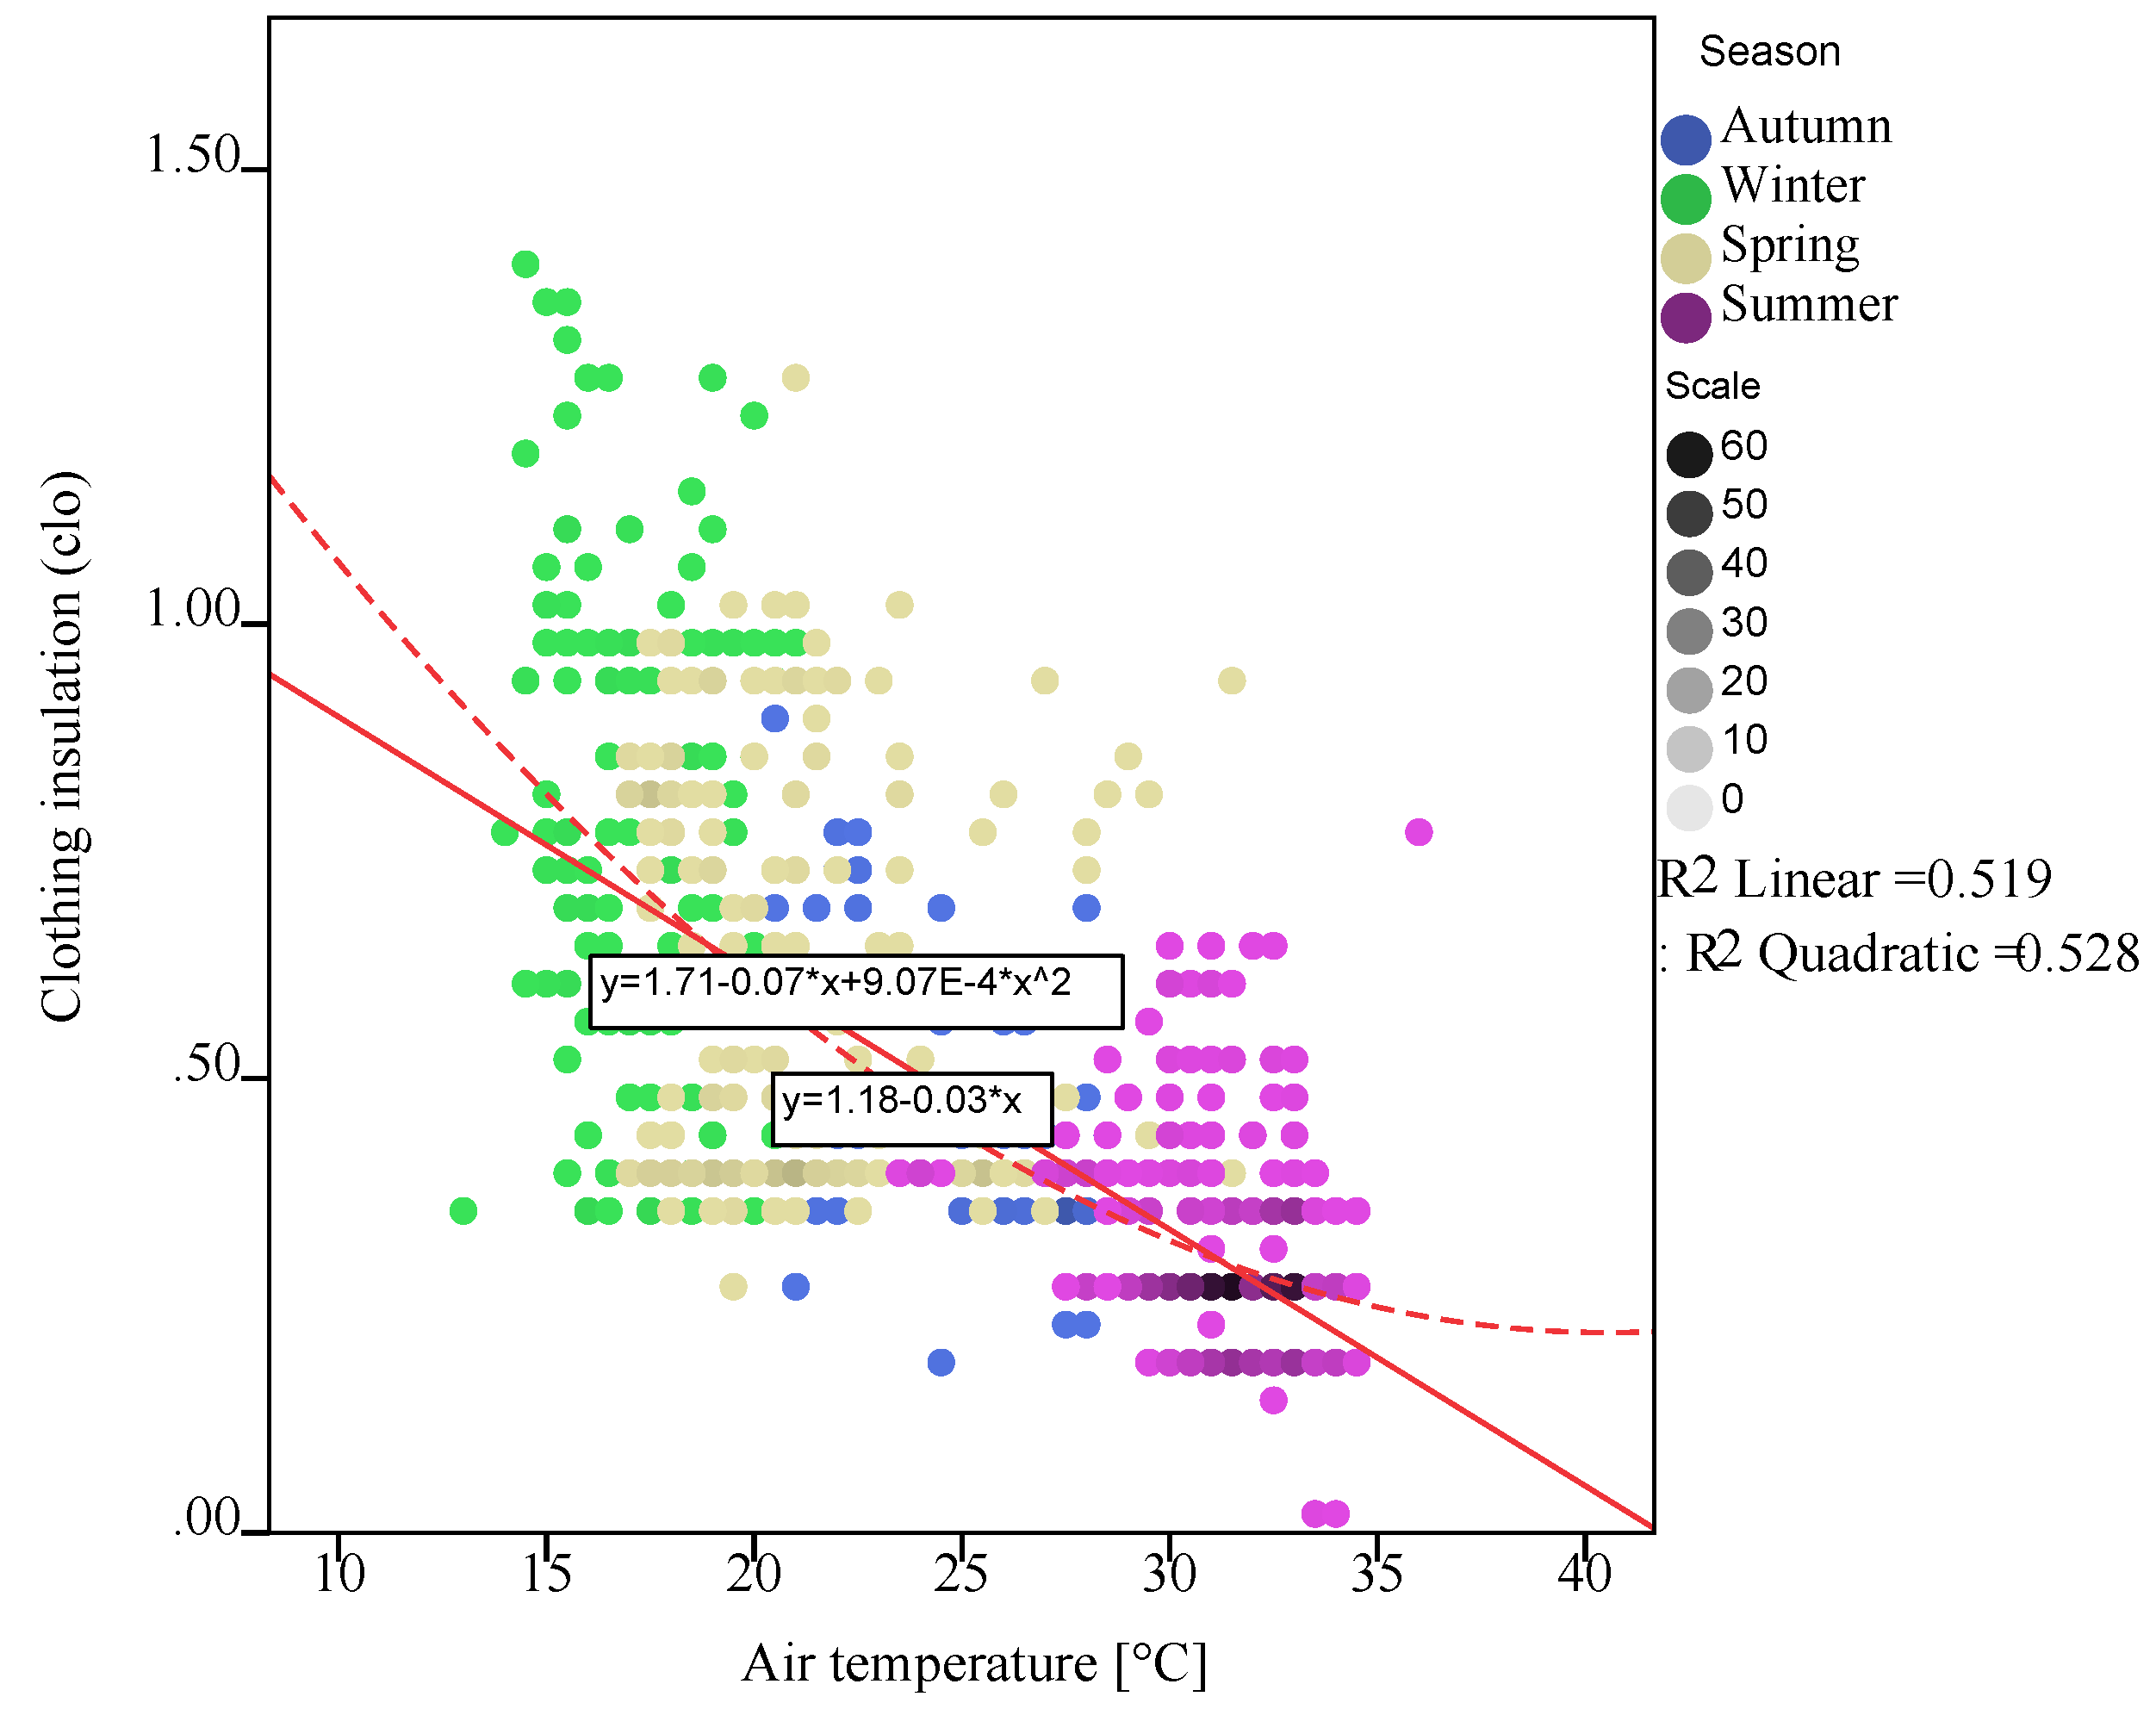
- 5.
- Mean clo values of 0.57 (±0.25) clo, 0.98 (±0.12) clo, 0.45 (±0.27) clo, and 0.36 (±0.11) were recorded in the autumn, winter, spring and summer seasons, respectively. An average clothing value of about 0.49 ((±0.31) clo was recorded for the pooled dataset, closely matching with the ASHRAE Standard 55 recommended clo value for the summer season.
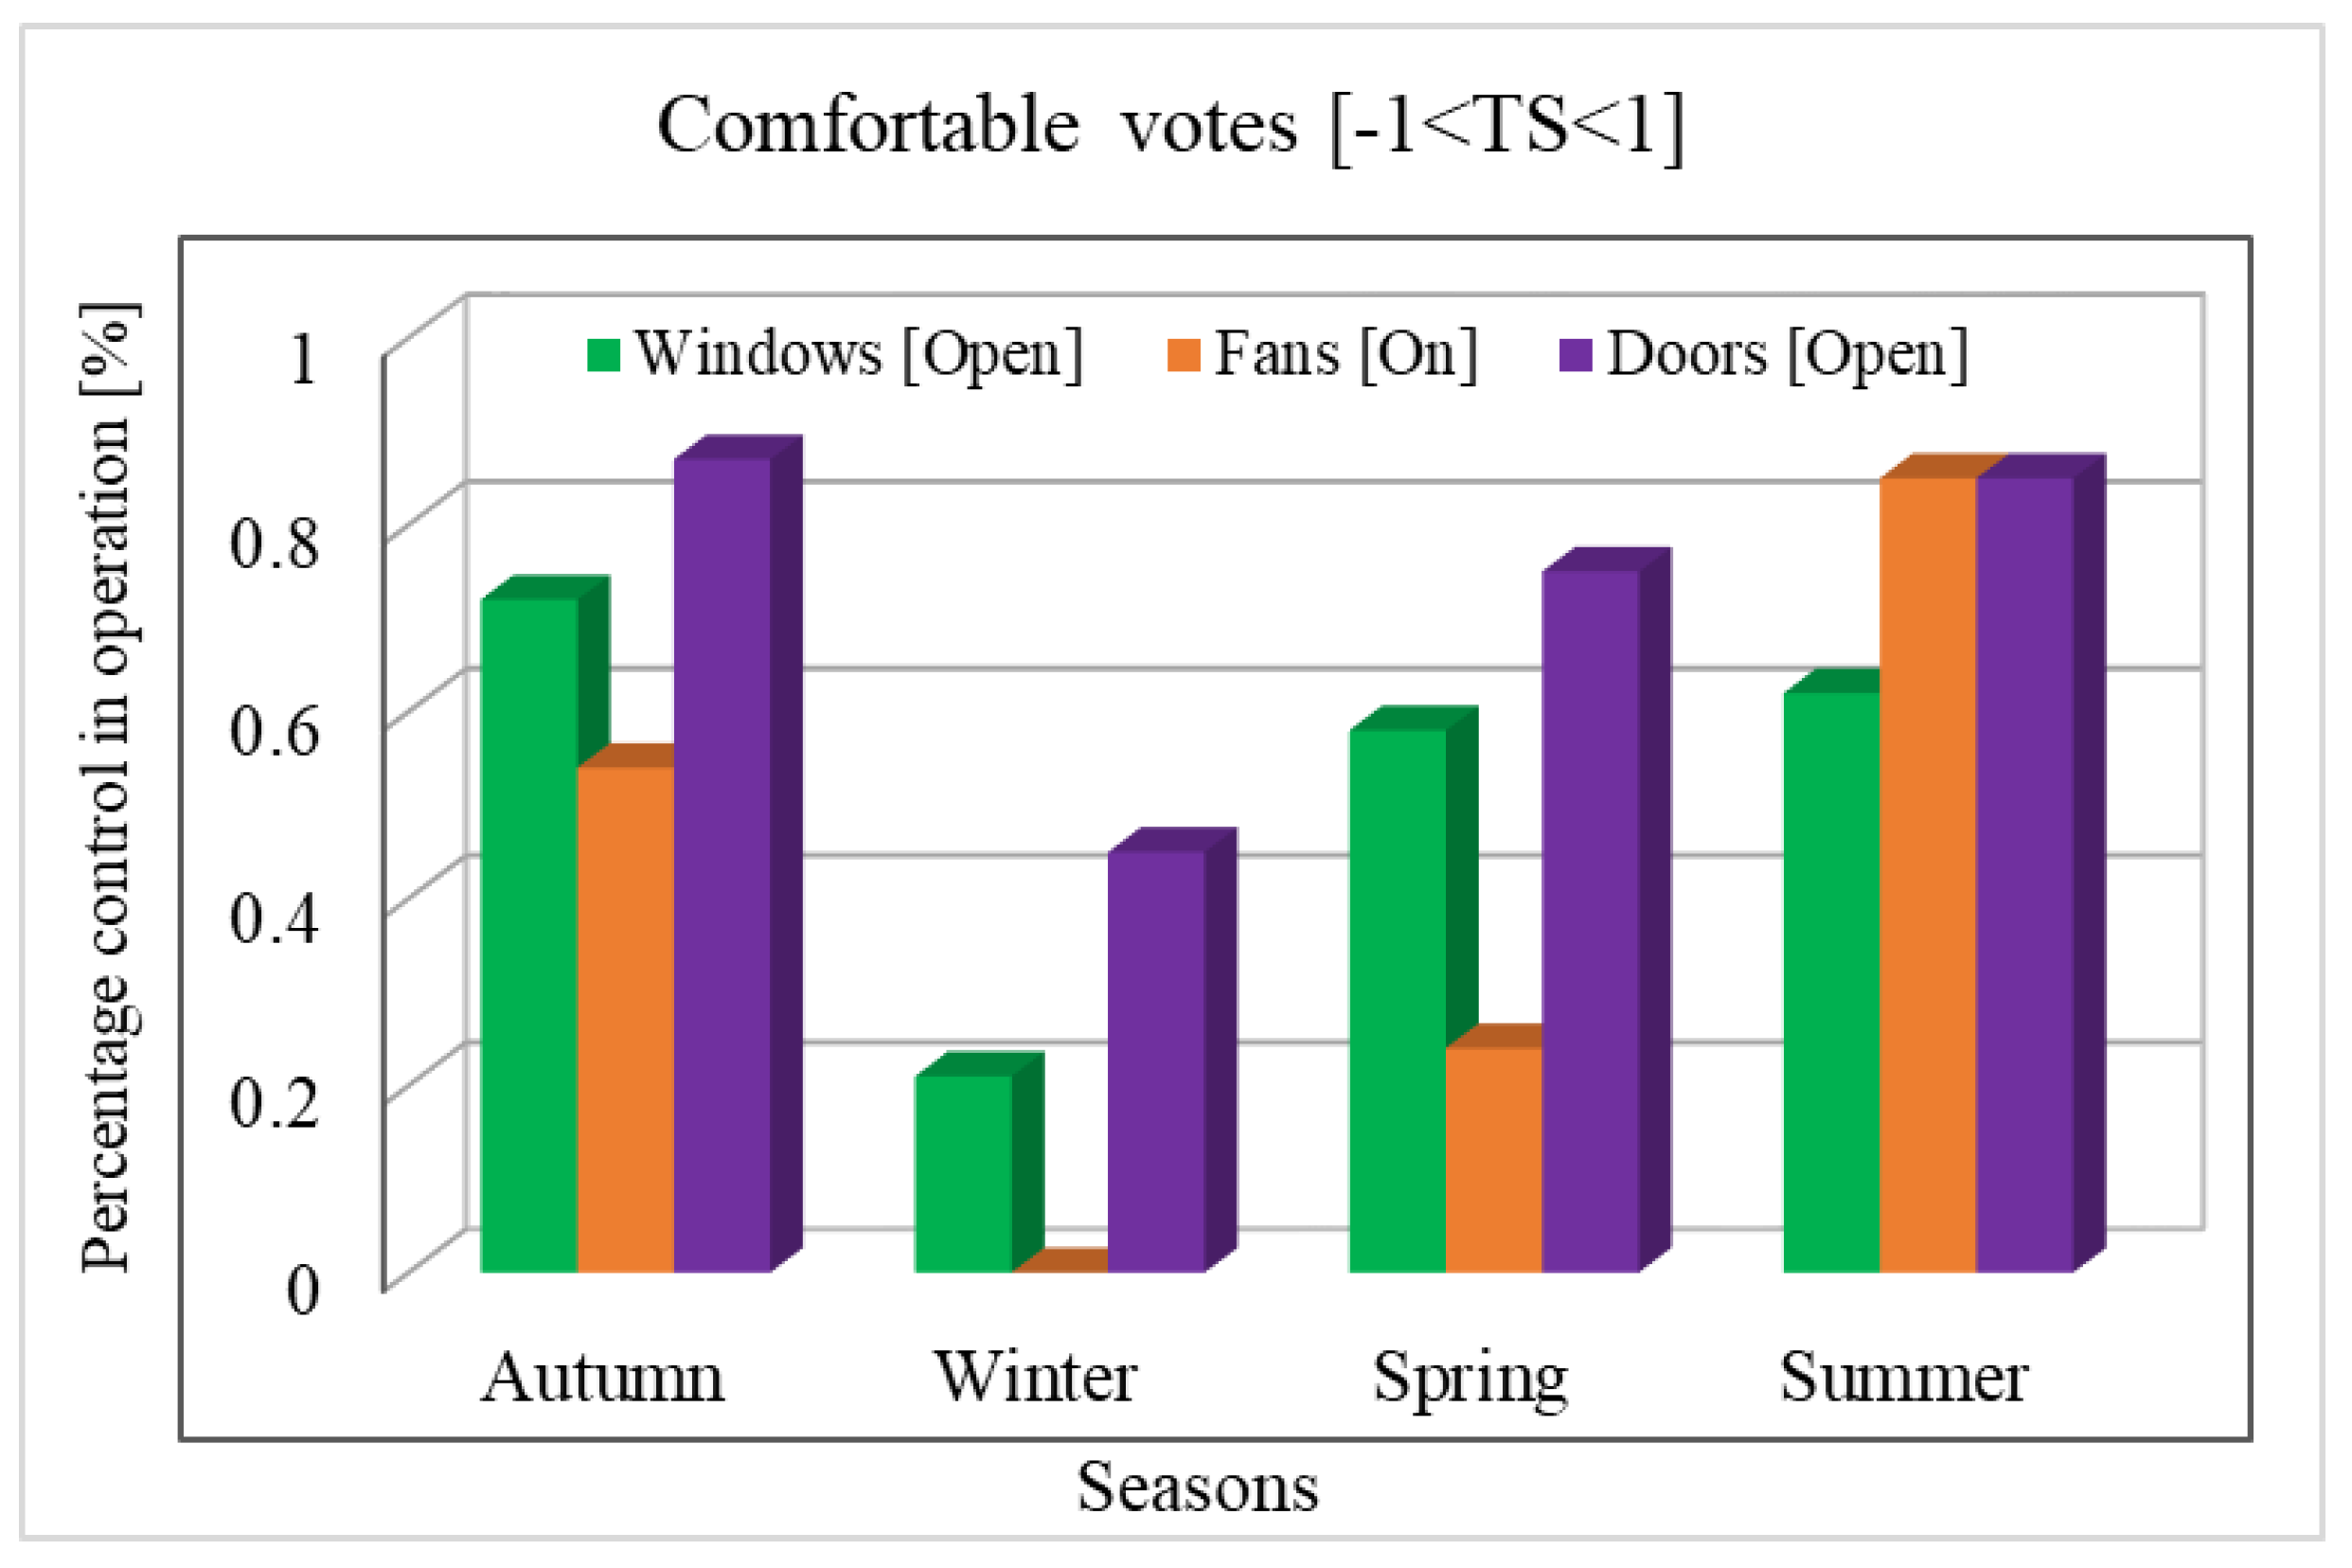
- 6.
- More than 80% of subjects responded that they were comfortable when ceiling fans were operating. In contrast, only 60% of the subjects voted being comfortable when the windows were open at the survey time.
Author Contributions
Funding
Institutional Review Board Statement
Informed Consent Statement
Data Availability Statement
Acknowledgments
Conflicts of Interest
Appendix A
References
- Abergel, T.; Dean, B.; Dulac, J. Towards Zero-Emission, Efficient and Resilient Buildings and Construction Sector: Global Status Report 2017. Paris: Global Alliance for Buildings and Construction, United Nations Environment Programme (UNEP) and International Energy Agency (IEA). Available online: https://www.globalabc.org/uploads/media/default/0001/01/ (accessed on 12 March 2022).
- Shukla, Y.; Rawal, R.; Shnapp, S. Residential Buildings in India: Energy Use Projections and Savings Potentials; GBPN: Paris, France, 2014. [Google Scholar]
- Singh, M.K.; Ooka, R.; Rijal, H.B.; Kumar, S.; Kumar, A.; Mahapatra, S. Progress in thermal comfort studies in classrooms over last 50 years and way forward. Energy Build. 2019, 188–189, 149–174. [Google Scholar] [CrossRef]
- Thermal Environmental Conditions for Human Occupancy; ASHRAE 55-2020; American Society of Heating, Refrigerating and Air-conditioning Engineers Inc.: Atlanta, GA, USA, 2020.
- ISO 7730; Ergonomics of the Thermal Environment—Analytical Determination and Interpretation of Thermal Comfort Using Calculation of the PMV and PPD Indices and Local Thermal Comfort Criteria. International Organization for Standardization: Geneva, Switzerland, 2005.
- Fanger, P.O. Thermal comfort. In Analysis and Application in Environment Engineering; Danish Technology Press: Copenhagen, Denmark, 1970. [Google Scholar]
- Brager, G.S.; de Dear, R. Developing an Adaptive Model of Thermal Comfort and Preferences, Final Report, ASHRAE RP-884; ASHRAE: Atlanta, GA, USA, 1998. [Google Scholar]
- Kumar, S.; Mathur, J.; Mathur, S.; Singh, M.K.; Loftness, V. An adaptive approach to define thermal comfort zones on psychrometric chart for naturally ventilated buildings in composite climate of India. Build. Environ. 2016, 109, 135–153. [Google Scholar] [CrossRef] [Green Version]
- Singh, M.K.; Mahapatra, S.; Atreya, S.K. Adaptive thermal comfort model for different climatic zones of North-East India. Appl. Energy 2011, 88, 2420–2428. [Google Scholar] [CrossRef]
- Yao, R.; Li, B.; Liu, J. A theoretical adaptive model of thermal comfort—Adaptive Predicted Mean Vote (aPMV). Build. Environ. 2009, 44, 2089–2096. [Google Scholar] [CrossRef]
- Al-Tamimi, N.A.; Fadzil, S.F.S. Energy-efficient envelope design for high-rise residential buildings in Malaysia. Archit. Sci. Rev. 2012, 55, 119–127. [Google Scholar] [CrossRef]
- Al-Tamimi, N.A. Toward Sustainable Building Design: Improving Thermal Performance by Applying Natural Ventilation in Hot–Humid Climate. Indian J. Sci. Technol. 2015, 8, IPL0662. [Google Scholar] [CrossRef]
- Hellwig, T.R.; Teli, D.; Schweiker, M.; Choi, J.; Lee, M.C.J.; Mora, R.; Rawal, R.; Wang, Z.; Al-Atrash, F. A framework for adopting adaptive thermal comfort principles, in design and operation of buildings. Energy Build. 2019, 205, 109476. [Google Scholar] [CrossRef]
- Mishra, A.K.; Ramgopal, M. Field studies on human thermal comfort—An overview. Build. Environ. 2012, 64, 94–106. [Google Scholar] [CrossRef]
- Halawa, E.; Van Hoof, J. The adaptive approach to thermal comfort: A critical overview. Energy Build. 2012, 51, 101–110. [Google Scholar] [CrossRef]
- Rupp, R.F.; Vásquez, N.G.; Lamberts, R. A review of human thermal comfort in the built environment. Energy Build. 2015, 105, 178–205. [Google Scholar] [CrossRef]
- Lamberti, G.; Salvadori, G.; Leccese, F.; Fantozzi, F.; Bluyssen, P.M. Advancement on Thermal Comfort in Educational Buildings: Current Issues and Way Forward. Sustainability 2021, 13, 10315. [Google Scholar] [CrossRef]
- Ličina, F.; Cheung, T.; Zhang, H.; de Dear, R.; Parkinson, T.; Arens, E.; Chungyoon, C.; Schiavon, S.; Luo, M.; Brager, G.; et al. Development of the ASHRAE global thermal comfort database II. Build. Environ. 2018, 142, 502–512. [Google Scholar] [CrossRef] [Green Version]
- Parkinson, T.R.; de Dear, G. Brager Nudging the adaptive thermal comfort model. Energy Build. 2020, 260, 109559. [Google Scholar] [CrossRef]
- Kumar, S. Subject’s thermal adaptation in different built environments: An analysis of updated metadata-base of thermal comfort data in India. J. Build. Eng. 2022, 46, 103844. [Google Scholar] [CrossRef]
- Nicol, J.F. An analysis of some observations of thermal comfort in Roorkie, India, and Baghadad, Iraq. Ann. Hum. Biol. 1974, 1, 411–426. [Google Scholar] [CrossRef]
- Sharma, M.R.; Ali, S. Tropical summer index—A study of thermal comfort of Indian subjects. Build. Environ. 1986, 21, 11–24. [Google Scholar] [CrossRef]
- Indraganti, M. Using the adaptive model of thermal comfort for obtaining indoor neutral temperature: Findings from a field study in Hyderabad, India. Build. Environ. 2010, 45, 519–536. [Google Scholar] [CrossRef]
- Indraganti, M. Adaptive use of natural ventilation for thermal comfort in Indian apartments. Build. Environ. 2010, 45, 1490–1507. [Google Scholar] [CrossRef]
- Singh, M.K.; Mahapatra, S.; Atreya, S.K. Thermal performance study and comfort temperature in vernacular buildings of North–East India. Build. Environ. 2010, 45, 320–329. [Google Scholar] [CrossRef]
- Bureau of Indian Standards (BIS). National Building Code of India; Bureau of Indian Standards: Delhi, India, 2016. [Google Scholar]
- Manu, S.; Shukla, Y.; Rawal, R.; Thomas, L.E.; de Dear, R. Field studies of thermal comfort across multiple climate zones for the subcontinent: India model for adaptive comfort (IMAC). Build. Environ. 2016, 98, 55–70. [Google Scholar] [CrossRef] [Green Version]
- Singh, M.K.; Kumar, S.; Ooka, R.; Rijal, H.B.; Gupta, G.; Kumar, A. Status of thermal comfort in naturally ventilated classrooms during the summer season in the composite climate of India. Build. Environ. 2018, 128, 287–304. [Google Scholar] [CrossRef]
- Kumar, S.; Singh, M.K.; Mathur, A.; Mathur, J.; Mathur, S. Evaluation of comfort preferences and insights into behavioural adaptation of students in naturally conditioned classrooms in a tropical country, India. Build. Environ. 2018, 143, 532–547. [Google Scholar] [CrossRef]
- Mishra, A.K.; Ramgopal, M. Thermal Comfort Field Study in Undergraduate Laboratories–An Analysis of Occupant Perceptions. Build. Environ. 2014, 76, 62–72. [Google Scholar] [CrossRef]
- Kumar, S.; Singh, M.K.; Loftness, V.; Mathur, J.; Mathur, S. Thermal comfort assessment and characteristics of occupant’s behavior in naturally ventilated buildings in composite climate of India. Energy Sustain. Dev. 2016, 33, 108–121. [Google Scholar] [CrossRef] [Green Version]
- Tewari, P.; Mathur, S.; Mathur, J.; Kumar, S.; Loftness, V. Field study on indoor thermal comfort of office buildings using evaporative cooling in the composite climate of India. Energy Build. 2019, 199, 145–163. [Google Scholar] [CrossRef]
- Dhaka, S.; Mathur, J.; Wagner, A.; Agarwal, G.; Garg, V. Evaluation of thermal environmental conditions and thermal perception at naturally ventilated hostels of undergraduate students in composite climate. Build. Environ. 2013, 66, 42–53. [Google Scholar] [CrossRef]
- Kumar, S.; Singh, M.K.; Kukreja, R.; Chaurasiya, S.; Gupta, V. Comparative study of thermal comfort and adaptive actions for modern and traditional multi-storey naturally ventilated hostel buildings during monsoon season in India. J. Build. Eng. 2019, 23, 90–106. [Google Scholar] [CrossRef]
- Kumar, S.; Singh, M.K. Field investigation on occupant’s thermal comfort and preferences in naturally ventilated multi-storey hostel buildings over two seasons in India. Build. Environ. 2019, 163, 106309. [Google Scholar] [CrossRef]
- Kumar, S.; Singh, M.K.; Mathur, A.; Kosir, M. Occupant’s thermal comfort expectations in naturally ventilated engineering workshop building: A case study at high metabolic rates. Energy Build. 2020, 217, 109970. [Google Scholar] [CrossRef]
- Dahlan, N.D.; Jone, P.J.; Alexander, D.K. Operative temperature and thermal sensation assessments in non-air-conditioned multi-storey hostels in Malaysia. Build. Environ. 2011, 46, 457–467. [Google Scholar] [CrossRef]
- Lai, J.H.K. Gap theory-based analysis of user expectation and satisfaction: The case of a hostel building. Build. Environ. 2013, 69, 183–193. [Google Scholar] [CrossRef]
- Rijal, H.B.; Tuohy, P.; Humphreys, M.A.; Nicol, J.F.; Samuel, A.; Clarke, J. Using results from field surveys to predict the effect of open windows on thermal comfort and energy use in buildings. Energy Build. 2007, 39, 823–836. [Google Scholar] [CrossRef] [Green Version]
- Nicol, F.; Humphreys, M.; Roaf, S. Adaptive Thermal Comfort Principles and Practice; Routledge: London, UK, 2012. [Google Scholar]
- Griffiths, I.D. Thermal Comfort in Buildings with Passive Solar Features: Field Studies; EN3S-090; Report to the Commission of the European Communities: London, UK, 1990. [Google Scholar]
- Indraganti, M.; Ooka, R.; Rijal, H.B.; Brager, G.S. Occupant behavior and obstacles in operating the openings in offices in India. In Proceedings of the 8th Windsor Conference, Windsor, UK, 10–13 April 2014. [Google Scholar]
- Sanyogita, M.; Shukla, Y.; Rawal, R.; Thomas, L.E.; de Dear, R.; Dave, M.; Vakharia, M. Assessment of air velocity preferences and satisfaction for naturally ventilated office buildings in India. In Proceedings of the Passive and Low Energy Architecture (PLEA) Annual International Conference, Geneva, Switzerland, 6–8 September 2014. [Google Scholar]
- Singh, M.K.; Ooka, R.; Rijal, H.B.; Takasu, M. Adaptive thermal comfort in the offices of North-East India in autumn season. Build. Environ. 2017, 124, 14–30. [Google Scholar] [CrossRef]


| City | Location | Season | No of Samples |
|---|---|---|---|
| Jalandhar, India | Latitude—31.33° N, Longitude—75.58° E, Altitude—228 m | Autumn | 135 |
| Winter | 181 | ||
| Spring | 248 | ||
| Summer | 898 |
| Scale Values | Thermal Sensation | Thermal Preference | Overall Comfort |
|---|---|---|---|
| +3 | Hot | ||
| +2 | Warm | ||
| +1 | Slightly warm | Cooler | Uncomfortable |
| 0 | Neutral | No change | Comfortable |
| −1 | Slightly cool | Warmer | |
| −2 | Cool | ||
| −3 | Cold |
| Description | Make of Instruments | Parameter Used | Range | Accuracy |
|---|---|---|---|---|
| Thermo-hygro CO2 meter | TR—76Ui | Air temperature | 0–55 °C | ±0.5 °C |
| Relative humidity | 10–95% RH | ±5% RH | ||
| CO2 level | 0–9999 ppm | ±50 ppm ± 5% | ||
| Globe thermometer | Tr-52i, globe (dia. 75 mm) | Globe temperature | −60–155 °C | ±0.3 °C |
| Infrared thermometer | Fluke 61 | Surface temperature | −18–275 °C | ±2 °C |
| Thermal anemometer | Testo-405 | Air velocity Air temperature | 0.01–10.00 m/s −20–50 °C | 0.01 m/s ±0.1 °C |
| Parameters | Autumn | Winter | Spring | Summer | All Season Data | |||||
|---|---|---|---|---|---|---|---|---|---|---|
| Mean | sd | Mean | sd | Mean | sd | Mean | sd | Mean | sd | |
| Ta | 25.6 | 2.52 | 17.3 | 1.8 | 21.5 | 3.5 | 30.8 | 2.9 | 27.3 | 5.6 |
| Tg | 24.6 | 2.69 | 16.6 | 1.6 | 20.8 | 3.5 | 30.3 | 2.5 | 26.7 | 5.7 |
| Tout | 28.7 | 3.45 | 14.5 | 2.8 | 24.5 | 2.8 | 35.4 | 3.7 | 29.4 | 6.4 |
| Rhi | 48.9 | 6.5 | 61.5 | 8.8 | 54.1 | 10.7 | 61.1 | 16.0 | 59.1 | 15.4 |
| AS | 0.29 | 0.47 | 0.13 | 0.28 | 0.18 | 0.30 | 1.06 | 0.72 | 0.71 | 0.69 |
| Season | Thermal Sensation (TS) | Thermal Preference (TP) | Overall Comfort (°C) | |||
|---|---|---|---|---|---|---|
| Mean | sd | Mean | sd | Mean | sd | |
| Autumn | −1.16 | 0.81 | 0.98 | 0.78 | 0.11 | 0.32 |
| Winter | −1.73 | 0.95 | 0.87 | 0.72 | 0.24 | 0.43 |
| Spring | −0.78 | 1.03 | 0.01 | 0.87 | 0.08 | 0.17 |
| Summer | 0.51 | 1.20 | −0.72 | 0.75 | 0.24 | 0.41 |
| All seasons combined | −0.15 | 1.37 | −0.38 | 0.91 | 0.20 | 0.40 |
| Case | N | Regression Models * | R2 | Tn (°C) | Mean Tcomf ± sd (°C) |
|---|---|---|---|---|---|
| All Season data | 1462 | TSV = 0.12 Ta − 3.12 | 0.11 | 26 | 27.1 0 ± 4.6 |
| PMV = 0.12 Ta − 3.24 | 0.21 | 27 | |||
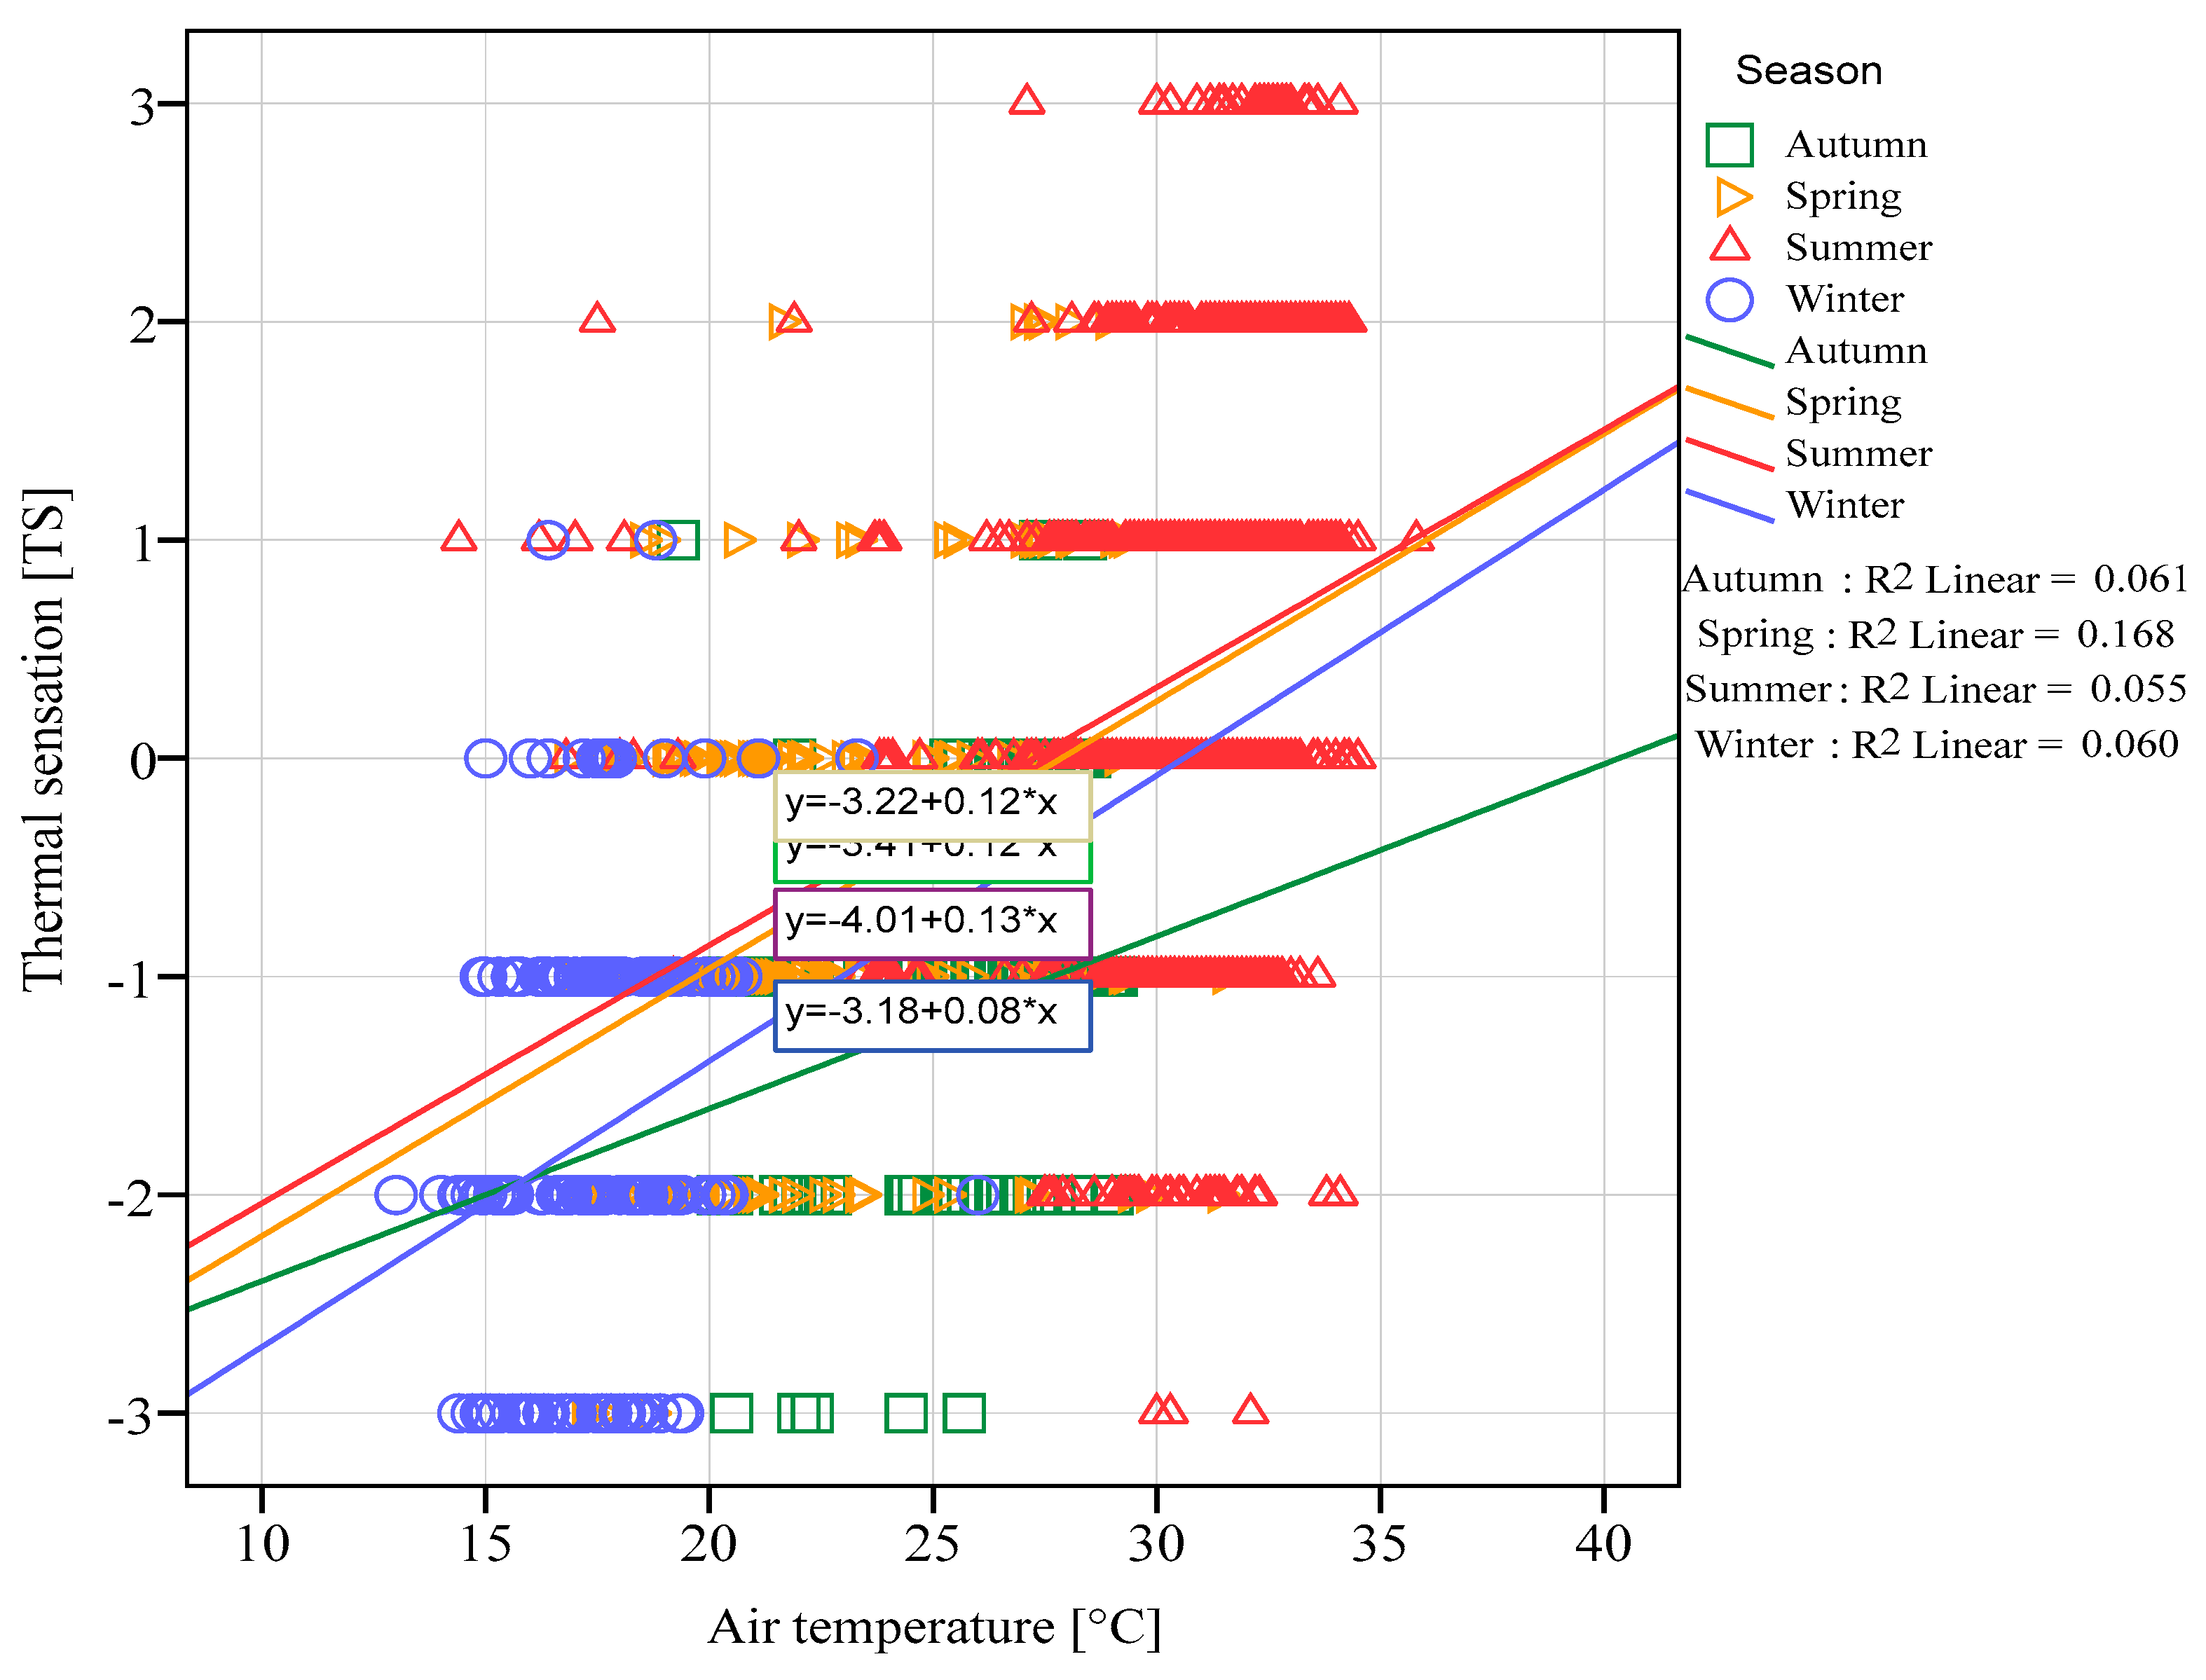
| Autumn | 135 | TSV = 0.08 Ta − 3.18 | 0.06 | 39.7 | 26.9 ± 2.68 |
| PMV = 0.07 Ta − 3.12 | 0.09 | 44.5 | |||
| Winter | 181 | TSV = 0.13 Ta − 4.01 | 0.06 | 30.8 | 19.9 ± 2.11 |
| PMV = 0.14 Ta − 3.96 | 0.13 | 28.3 | |||
| Spring | 248 | TSV = 0.12 Ta − 3.41 | 0.17 | 28.4 | 22.4 ± 3.2 |
| PMV = 0.12 Ta − 3.38 | 0.22 | 28.2 | |||
| Summer | 898 | TSV = 0.12 Ta − 3.22 | 0.05 | 26.8 | 29.5 ± 2.6 |
| PMV = 0.12 Ta − 3.54 | 0.11 | 29.5 |
Publisher’s Note: MDPI stays neutral with regard to jurisdictional claims in published maps and institutional affiliations. |
© 2022 by the authors. Licensee MDPI, Basel, Switzerland. This article is an open access article distributed under the terms and conditions of the Creative Commons Attribution (CC BY) license (https://creativecommons.org/licenses/by/4.0/).
Share and Cite
Kumar, S.; Singh, M.K.; Al-Tamimi, N.; Alotaibi, B.S.; Abuhussain, M.A. Investigation on Subjects’ Seasonal Perception and Adaptive Actions in Naturally Ventilated Hostel Dormitories in the Composite Climate Zone of India. Sustainability 2022, 14, 4997. https://doi.org/10.3390/su14094997
Kumar S, Singh MK, Al-Tamimi N, Alotaibi BS, Abuhussain MA. Investigation on Subjects’ Seasonal Perception and Adaptive Actions in Naturally Ventilated Hostel Dormitories in the Composite Climate Zone of India. Sustainability. 2022; 14(9):4997. https://doi.org/10.3390/su14094997
Chicago/Turabian StyleKumar, Sanjay, Manoj Kumar Singh, Nedhal Al-Tamimi, Badr S. Alotaibi, and Mohammed Awad Abuhussain. 2022. "Investigation on Subjects’ Seasonal Perception and Adaptive Actions in Naturally Ventilated Hostel Dormitories in the Composite Climate Zone of India" Sustainability 14, no. 9: 4997. https://doi.org/10.3390/su14094997
APA StyleKumar, S., Singh, M. K., Al-Tamimi, N., Alotaibi, B. S., & Abuhussain, M. A. (2022). Investigation on Subjects’ Seasonal Perception and Adaptive Actions in Naturally Ventilated Hostel Dormitories in the Composite Climate Zone of India. Sustainability, 14(9), 4997. https://doi.org/10.3390/su14094997