
Experimental Assessment of the Reflection of Solar Radiation from Façades of Tall Buildings to the Pedestrian Level


 ,
, 
 ,
, 
Abstract
:1. Introduction and State of the Art
- (i)
- quantify the solar concentration (expressed in units of sun or suns) at the pedestrian level in front of archetypes of tall buildings with diffuse and specular reflective facades;
- (ii)
- identify the archetypes at risk of causing excessive solar concentration and harming pedestrians; and
- (iii)
- devise a measurement protocol that can be used to quantify shortwave radiative impacts (and solar concentrations) in real buildings, to assist in the identification of the need for façade retrofits and dispute resolution.
2. Methodology
- Vertical planar façade;
- Planar façade with 10% of vertical tilt;
- Curved concave façade (with a curvature radius of 60 meters, rescaled then at model scale).
2.1. The On-Site Measurements
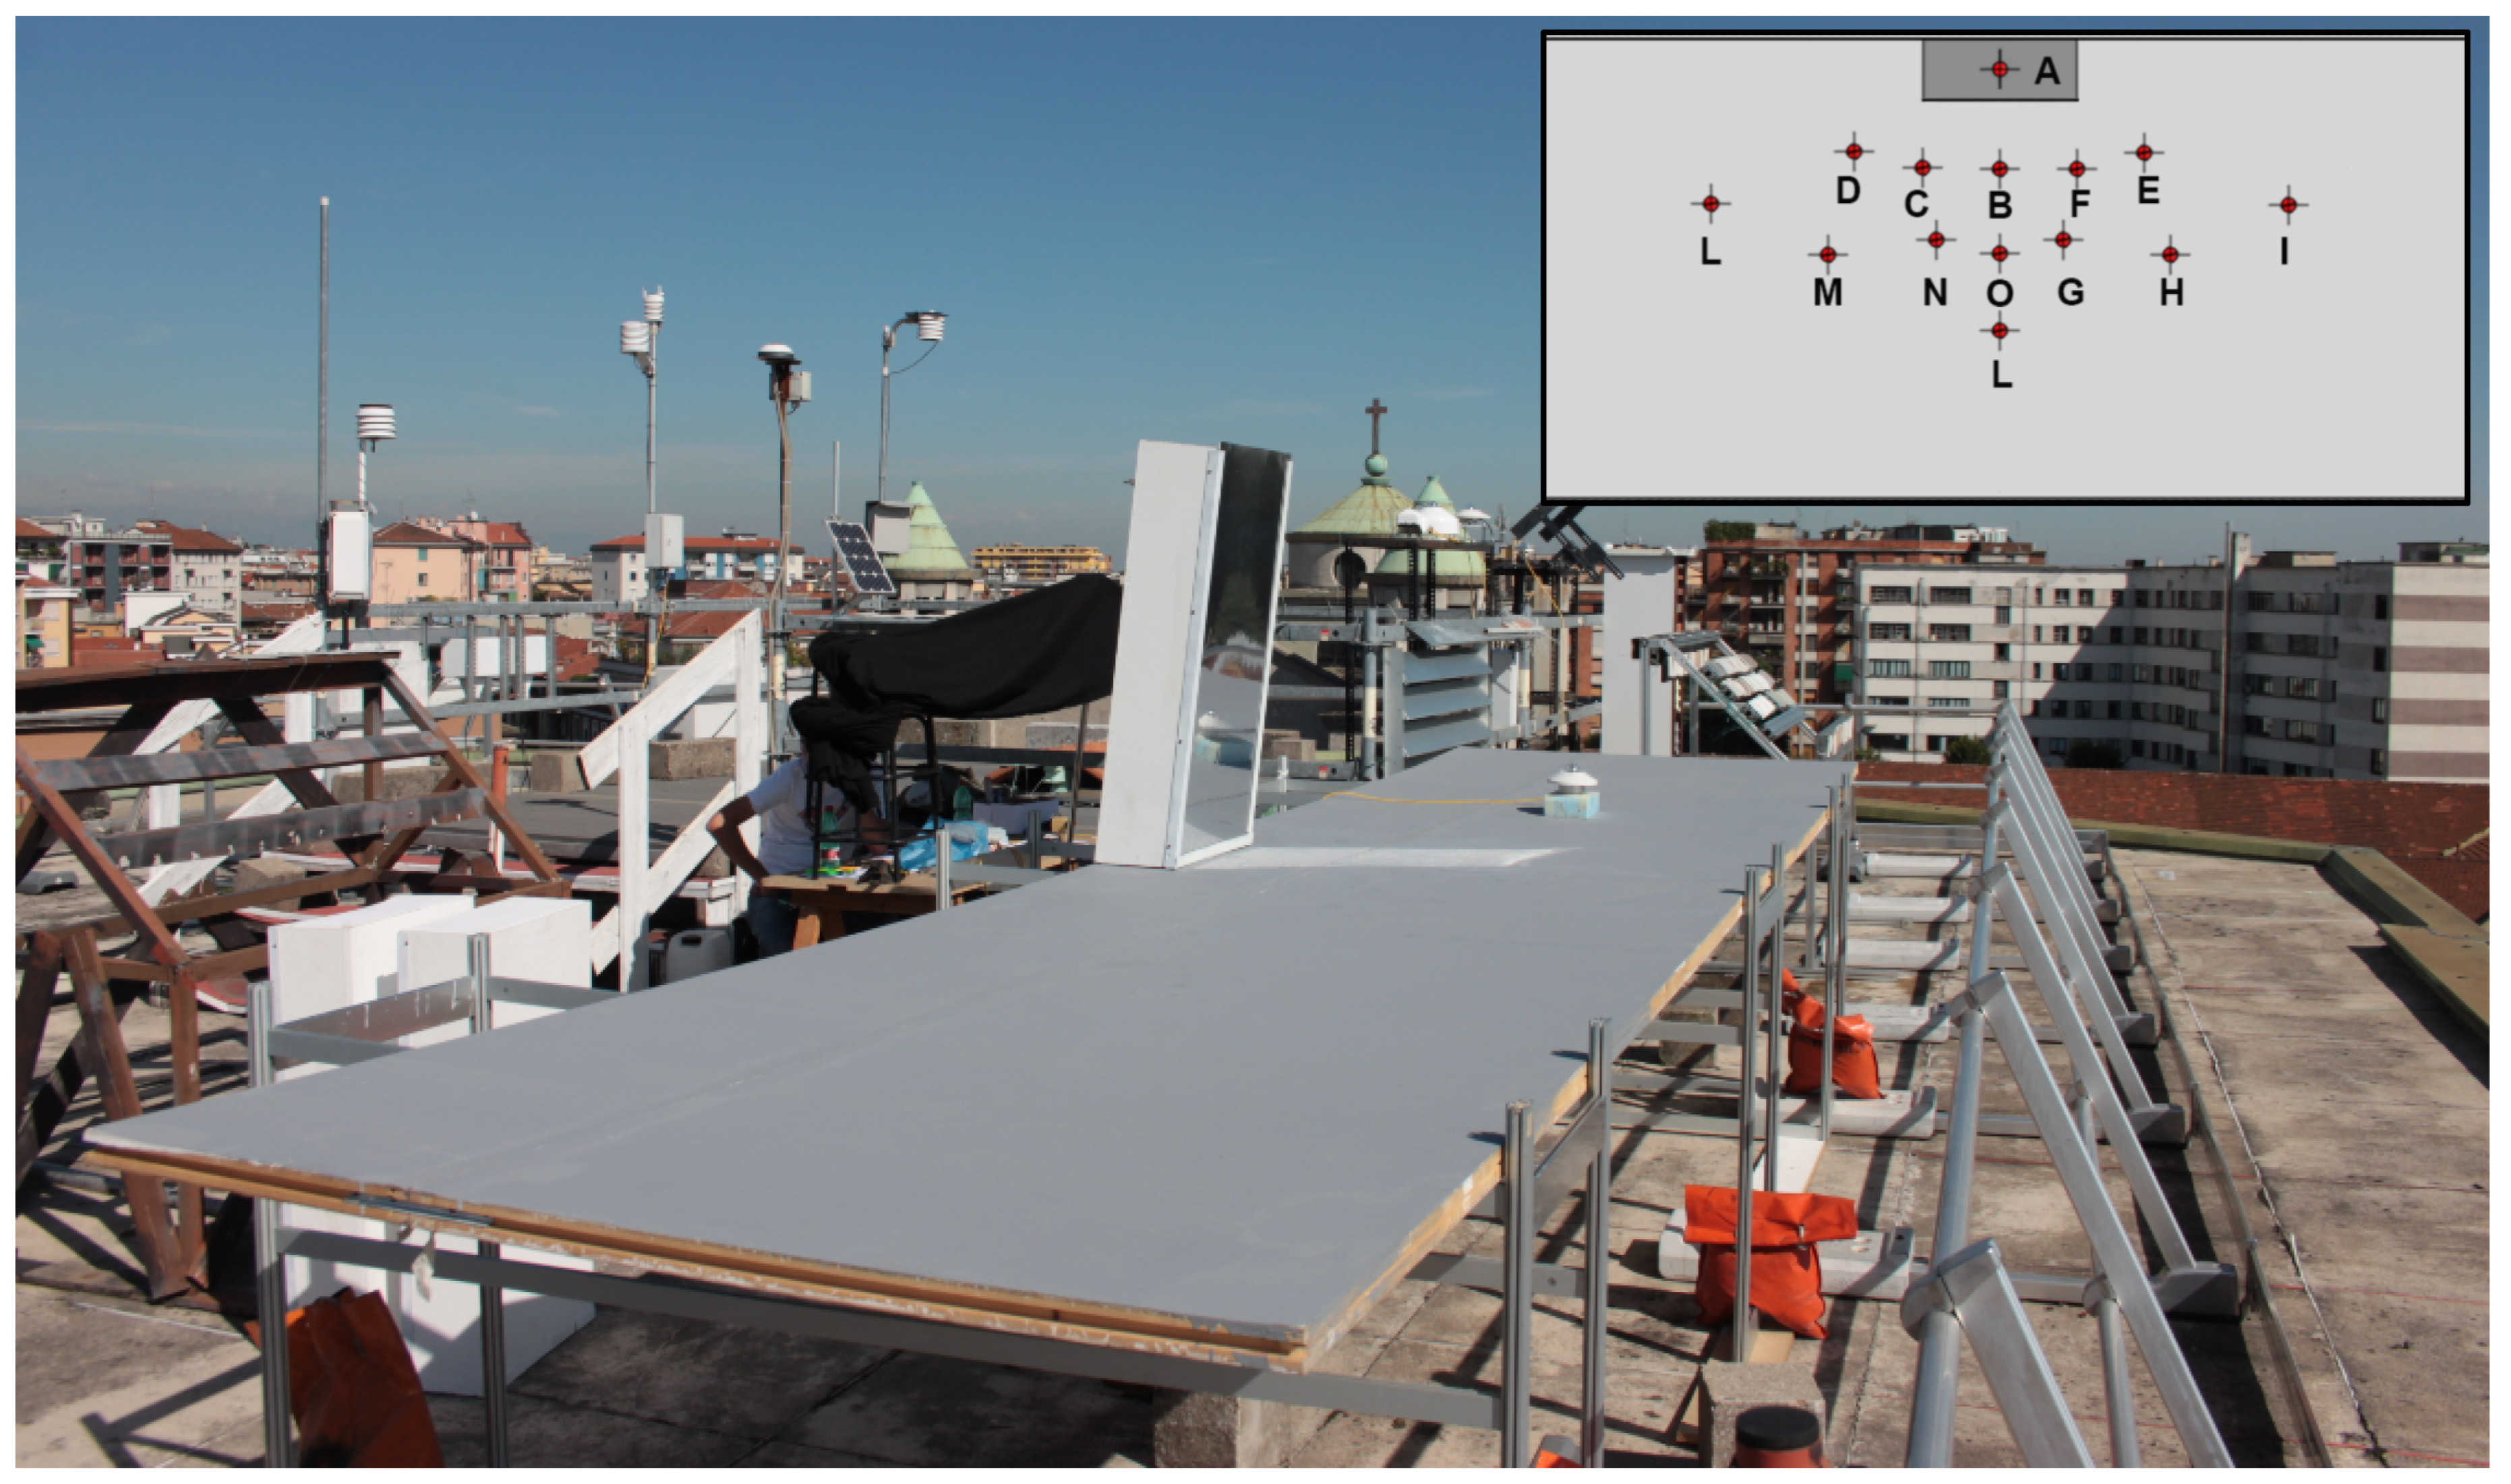
2.1.1. Experimental Scenario
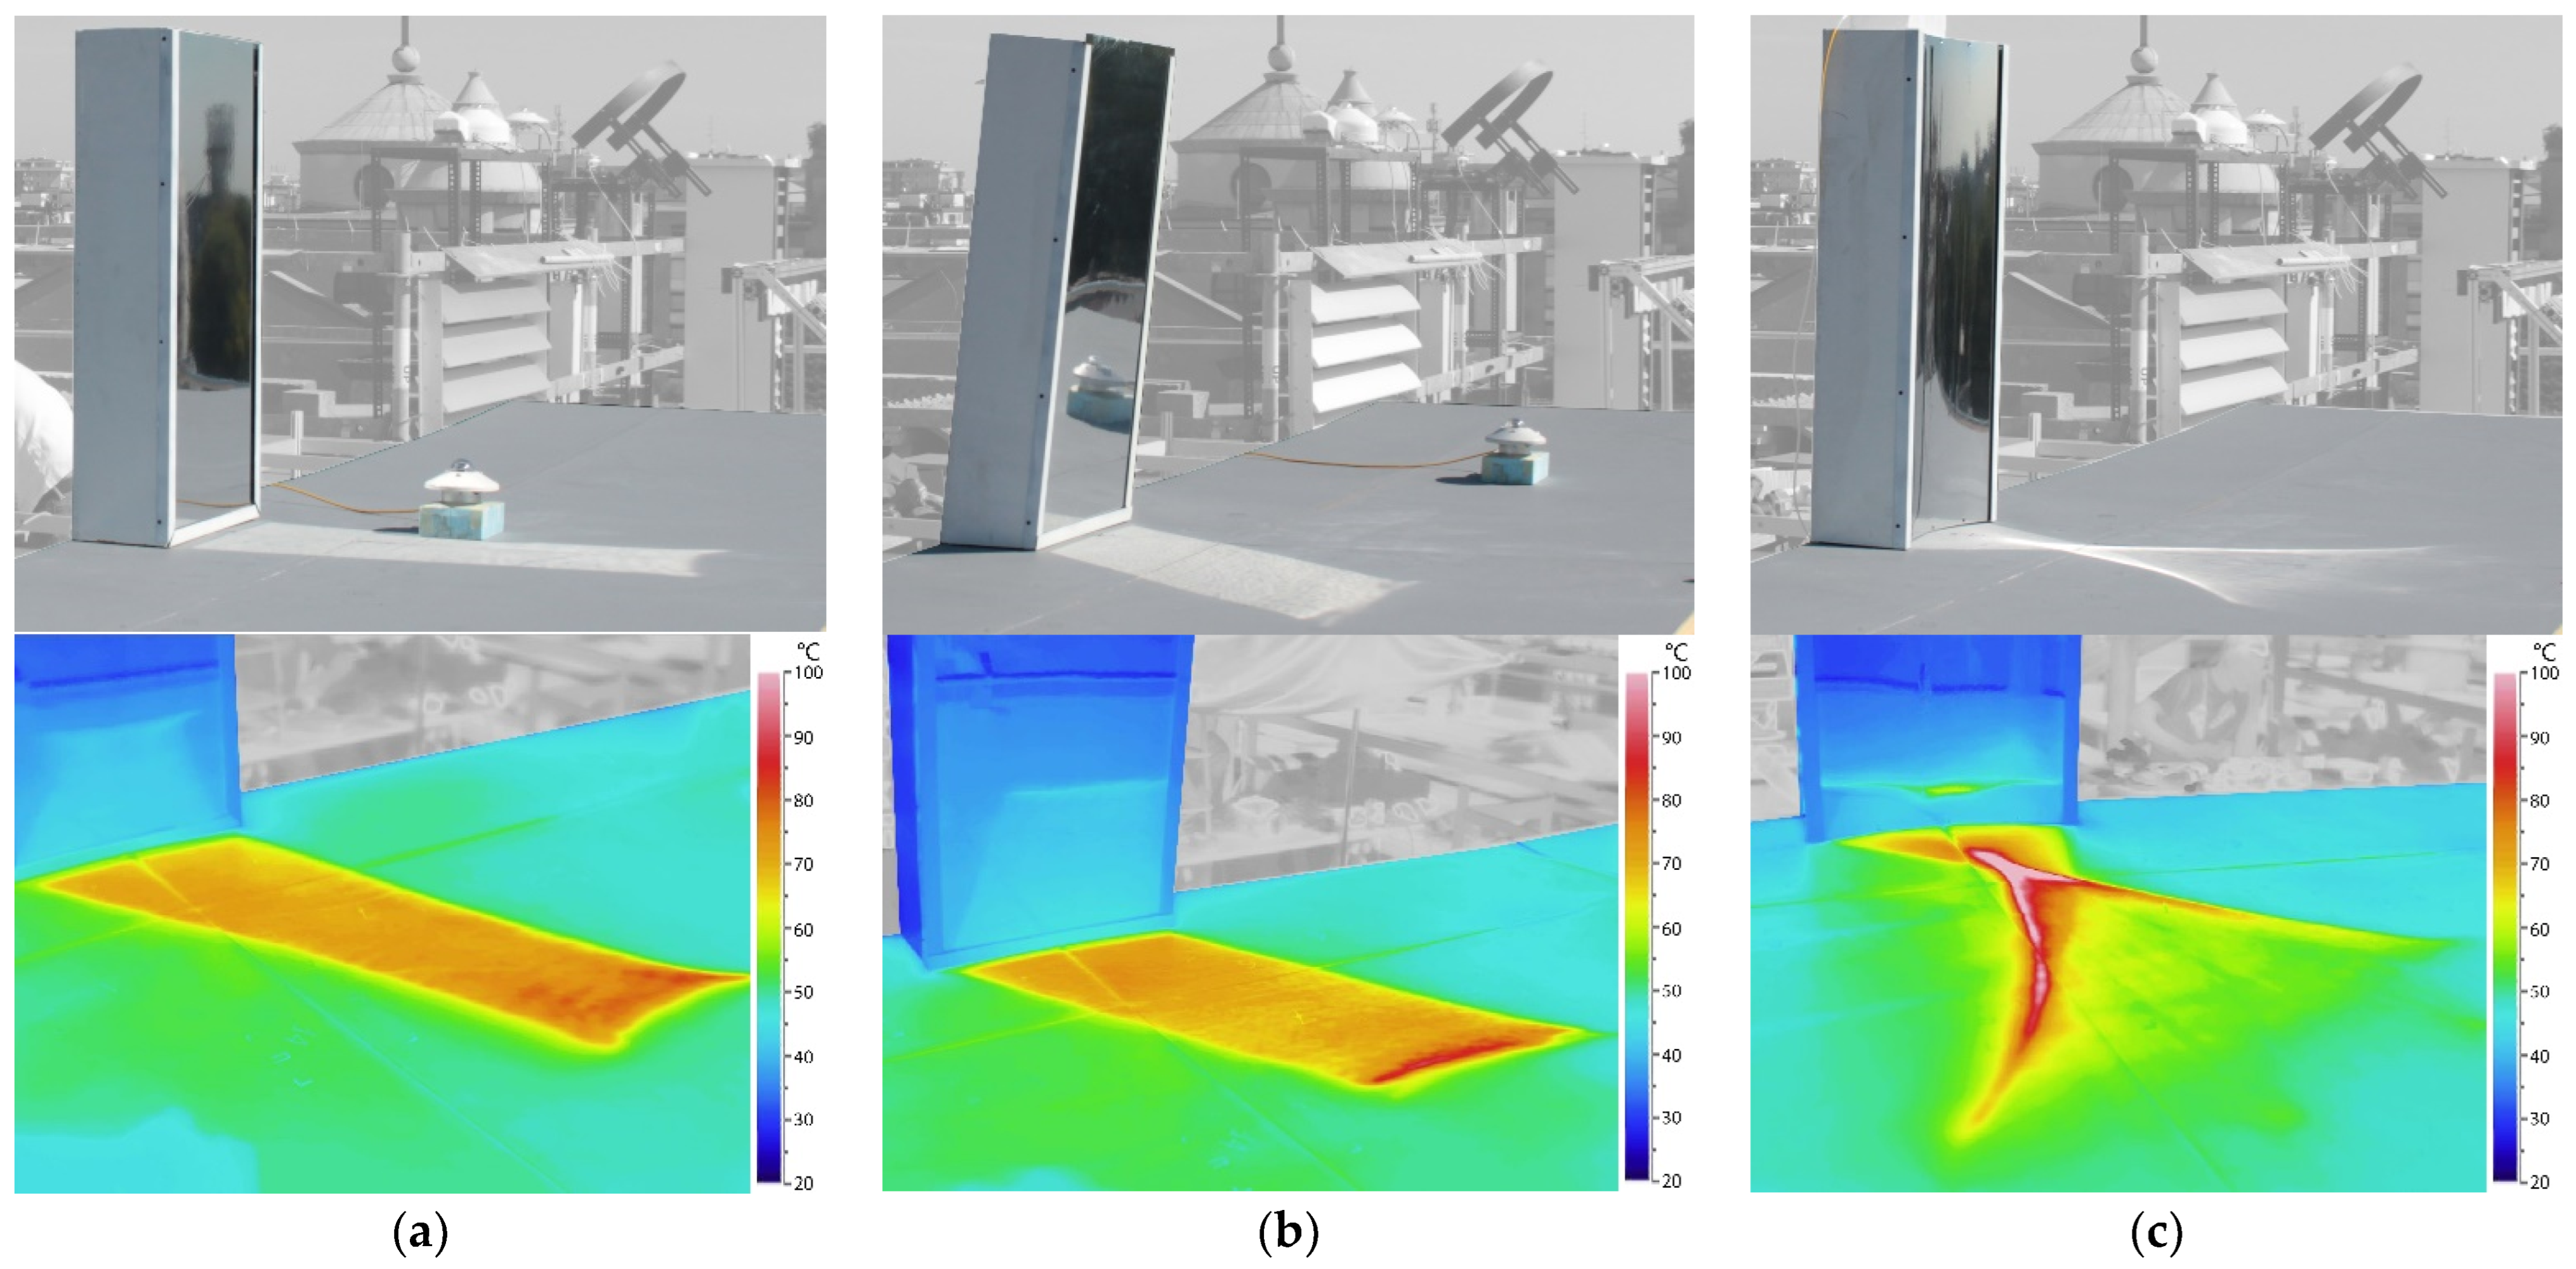
2.1.2. Scale Models
2.2. Experimental Sample Material Properties
Instruments and Measurements Procedure
- An albedometer (CMA11 by Kipp & Zonen), with data recorded by an M-Log logger (by LSI) placed over a specific plastic support, was used to measure solar irradiance in different positions over the test plane (Figure 2b). The CMA11 is a secondary standard albedometer with a maximum solar irradiance value equal to 4000 W/m2 and 5 s of response time.
- CM21 and CM22 pyranometers (by Kipp Zonen) were used to measure the undisturbed solar irradiance and calibrate the albedometer.
- A CM6 pyranometer with a shadow-band was used to measure the diffuse component of solar radiation.
- A thermal infrared camera was used to verify the temperature increase on the plane due to reflections.
2.3. The Simulations Workflow
2.3.1. The Façade Material Benchmark
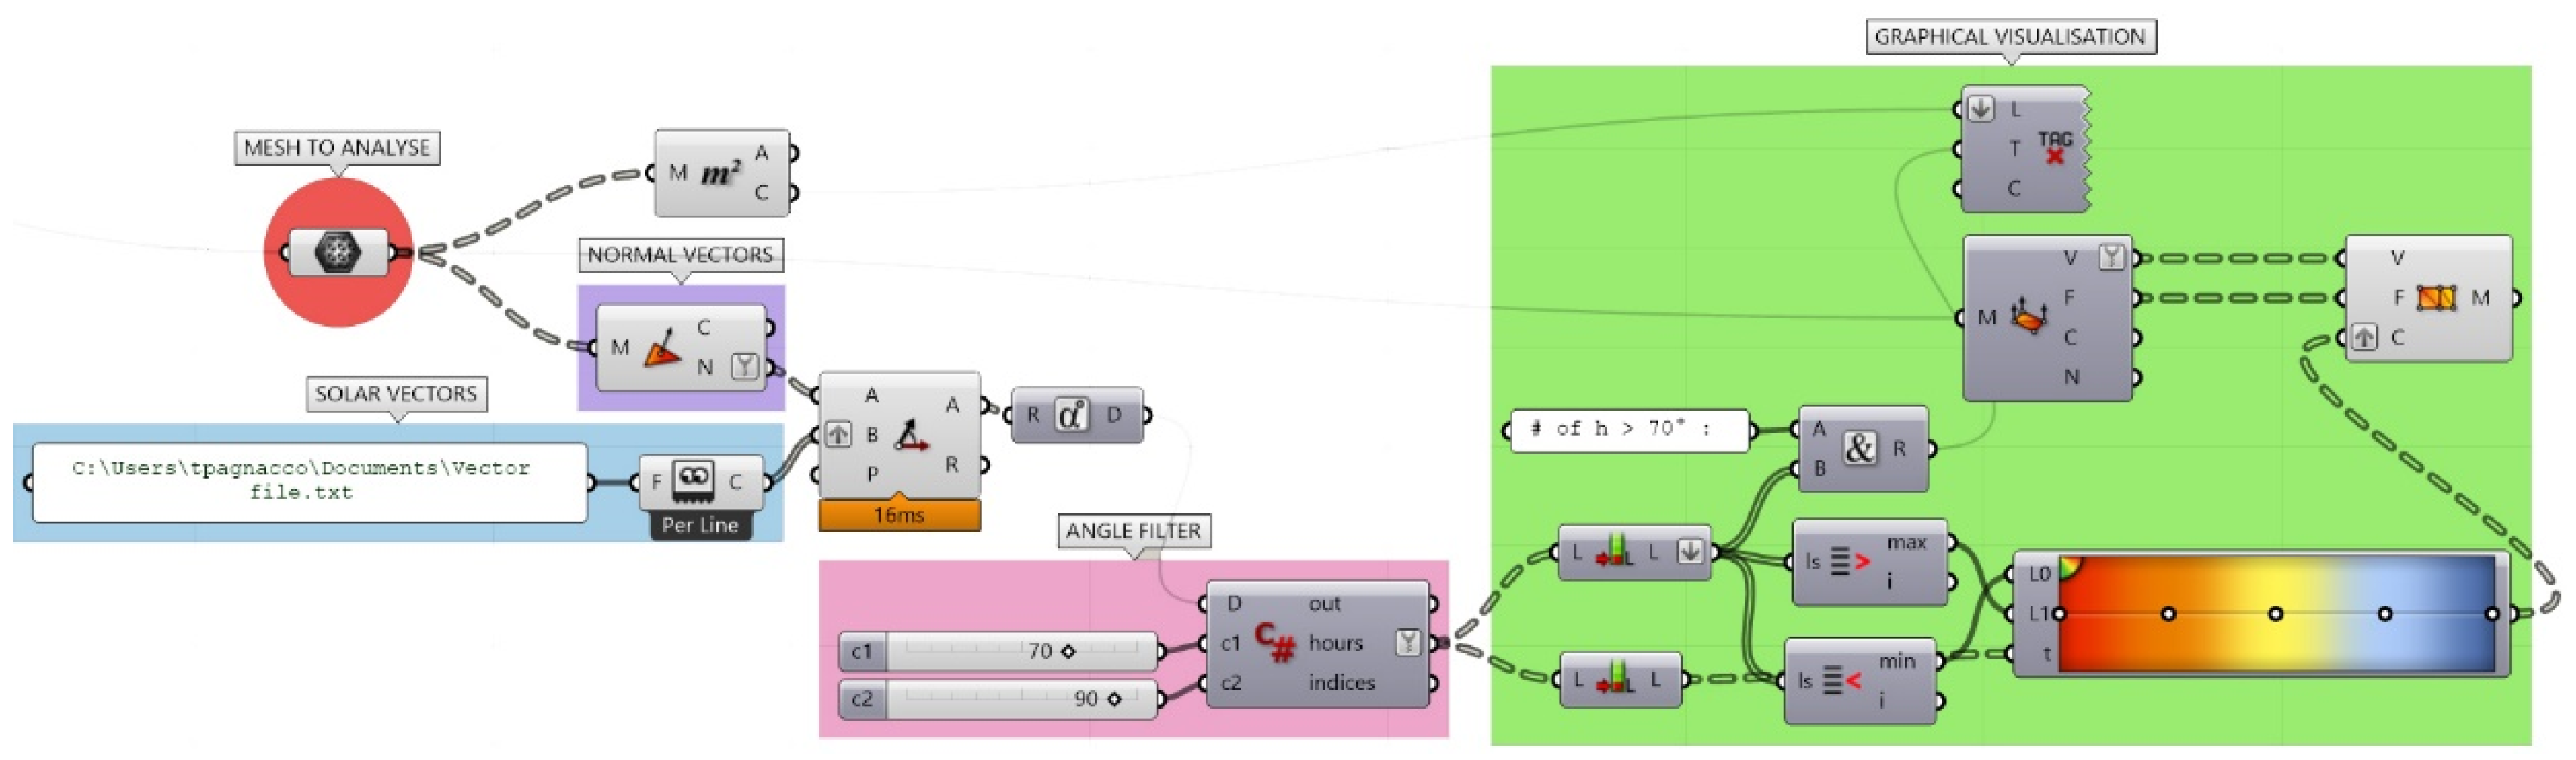
2.3.2. A Parametric Analysis Script for Unwanted Reflections of a Glazed Façade
- Every “solar ray” represents the sun’s position in the middle of each sun hour of radiation;
- A quad mesh subdivision of the building mass surface was used in order to replicate a realistic building façade panelization, made through the use of discrete glazed elements.
- (α) is the incidence angle;
- (αs) is the hourly solar altitude; and
- (Δγ) is the difference between the hourly solar azimuth (γs) and the azimuth of the surface normal (γ), both measured from the South.
3. Results
3.1. Experimental Measurements
3.2. Simulated Frequency Distribution of Solar Reflection Occurrences: Hourly Annual Distribution
3.3. Simulated Frequency Distribution of Solar Reflection Occurrences: Spatial Surface Distribution
- In the southern-exposed facades with parabolic sections, the possibility of negative effects becomes greater while moving away from the geometric focus of the parabola that describes the surface (Figure 13a);
- In the case of east-facing exposed parabolic surfaces, the area that is close to the focus of the parabola seems more critical (Figure 13b).
4. Discussion
5. Conclusions
Author Contributions
Funding
Institutional Review Board Statement
Informed Consent Statement
Data Availability Statement
Acknowledgments
Conflicts of Interest
Appendix A. Flat Diffusive Façade


| Start Time | End Time | MIN N.d. | MAX N.d. | A | B | C | D | E | F | G | H | I | L | M | N | O | P |
|---|---|---|---|---|---|---|---|---|---|---|---|---|---|---|---|---|---|
| [hh:mm] | [hh:mm] | [W/m2] | [W/m2] | The Upper Value Refers to the Measure in Each Point [W/m2] While the Lower Is the Ratio [-] with the Undisturbed Measure (Unit of Sun) | |||||||||||||
| 9:00 | 9:15 | 254 | 294 | 267 | 323 | 310 | 292 | 339 | 337 | 333 | 328 | 333 | 316 | 321 | 338 | 346 | 336 |
| 1.27 | 1.21 | 1.11 | 1.27 | 1.24 | 1.21 | 1.16 | 1.17 | 1.09 | 1.09 | 1.13 | 1.13 | 1.09 | |||||
| 10:00 | 10:16 | 420 | 458 | 430 | 521 | 495 | 458 | 504 | 517 | 506 | 490 | 495 | 478 | 483 | 505 | 509 | 492 |
| 1.24 | 1.16 | 1.06 | 1.16 | 1.18 | 1.15 | 1.10 | 1.10 | 1.06 | 1.06 | 1.10 | 1.10 | 1.05 | |||||
| 11:00 | 11:17 | 549 | 578 | 556 | 673 | 628 | 585 | 627 | 657 | 640 | 614 | 620 | 600 | 597 | 625 | 625 | 602 |
| 1.23 | 1.14 | 1.06 | 1.13 | 1.18 | 1.14 | 1.09 | 1.10 | 1.06 | 1.05 | 1.09 | 1.09 | 1.05 | |||||
| 12:03 | 12:20 | 654 | 676 | 647 | 799 | 753 | 695 | 717 | 748 | 743 | 723 | 732 | 710 | 650 | 711 | 739 | 703 |
| 1.22 | 1.15 | 1.06 | 1.09 | 1.13 | 1.12 | 1.09 | 1.10 | 1.06 | 0.97 | 1.06 | 1.10 | 1.04 | |||||
| 13:02 | 13:18 | 546 | 734 | 732 | 895 | 832 | 761 | 773 | 830 | 798 | 754 | 760 | 747 | 749 | 784 | 790 | 755 |
| 1.64 | 1.45 | 1.27 | 1.18 | 1.22 | 1.13 | 1.03 | 1.04 | 1.02 | 1.02 | 1.07 | 1.08 | 1.04 | |||||
| 14:00 | 14:16 | 690 | 712 | 695 | 852 | 789 | 727 | 713 | 766 | 732 | 706 | 720 | 713 | 721 | 754 | 761 | 727 |
| 1.20 | 1.11 | 1.03 | 1.01 | 1.09 | 1.05 | 1.01 | 1.04 | 1.03 | 1.04 | 1.09 | 1.10 | 1.05 | |||||
| 15:00 | 15:15 | 631 | 656 | 648 | 782 | 720 | 680 | 655 | 696 | 671 | 649 | 667 | 656 | 655 | 684 | 691 | 672 |
| 1.19 | 1.10 | 1.04 | 1.01 | 1.07 | 1.04 | 1.01 | 1.04 | 1.03 | 1.03 | 1.08 | 1.09 | 1.06 | |||||
| 16:00 | 16:18 | 510 | 570 | 550 | 656 | 591 | 575 | 527 | 550 | 525 | 512 | 530 | 520 | 535 | 553 | 560 | 540 |
| 1.15 | 1.05 | 1.03 | 0.97 | 1.02 | 0.99 | 0.97 | 1.01 | 1.00 | 1.03 | 1.07 | 1.09 | 1.05 | |||||
| 17:00 | 17:17 | 347 | 398 | 374 | 461 | 421 | 420 | 364 | 376 | 356 | 344 | 360 | 361 | 365 | 374 | 378 | 361 |
| 1.16 | 1.07 | 1.08 | 0.94 | 0.98 | 0.94 | 0.91 | 0.96 | 0.98 | 1.00 | 1.05 | 1.07 | 1.03 | |||||
Appendix B. Flat Reflective Façade

| Start Time | End Time | MIN N.d. | MAX N.d. | A | B | C | D | E | F | G | H | I | L | M | N | O | P |
|---|---|---|---|---|---|---|---|---|---|---|---|---|---|---|---|---|---|
| [hh:mm] | [hh:mm] | [W/m2] | [W/m2] | The Upper Value Refers to the Measure in Each Point [W/m2] While the Lower Is the Ratio [-] with the Undisturbed Measure (Unit of Sun) | |||||||||||||
| 9:00 | 9:11 | 256 | 279 | 248 | 255 | 263 | 467 | 304 | 282 | 285 | 294 | 297 | 403 | 281 | 281 | 280 | 278 |
| 1.00 | 1.02 | 1.80 | 1.15 | 1.06 | 1.06 | 1.08 | 1.09 | 1.47 | 1.01 | 1.00 | 0.99 | 0.98 | |||||
| 10:00 | 10:10 | 416 | 439 | 406 | 422 | 754 | 431 | 467 | 445 | 444 | 450 | 458 | 439 | 870 | 441 | 438 | 437 |
| 1.02 | 1.81 | 1.03 | 1.11 | 1.05 | 1.04 | 1.05 | 1.06 | 1.02 | 2.00 | 1.01 | 0.99 | 0.98 | |||||
| 11:00 | 11:11 | 550 | 563 | 540 | 905 | 987 | 557 | 590 | 575 | 575 | 580 | 592 | 572 | 1099 | 1075 | 564 | 557 |
| 1.65 | 1.79 | 1.01 | 1.06 | 1.04 | 1.03 | 1.03 | 1.05 | 1.02 | 1.95 | 1.91 | 0.99 | 0.97 | |||||
| 12:05 | 12:16 | 653 | 662 | 661 | 1179 | 1201 | 657 | 680 | 677 | 676 | 673 | 688 | 675 | 663 | 1294 | 1190 | 662 |
| 1.81 | 1.84 | 1.01 | 1.04 | 1.03 | 1.02 | 1.02 | 1.04 | 1.02 | 1.00 | 1.96 | 1.80 | 1.00 | |||||
| 13:06 | 13:17 | 676 | 686 | 693 | 1321 | 705 | 698 | 694 | 708 | 711 | 691 | 697 | 686 | 685 | 704 | 1327 | 1374 |
| 1.92 | 1.03 | 1.02 | 1.01 | 1.03 | 1.04 | 1.01 | 1.02 | 1.01 | 1.01 | 1.04 | 1.94 | 2.01 | |||||
| 14:01 | 14:1 | 660 | 669 | 672 | 1290 | 680 | 682 | 667 | 1242 | 1259 | 665 | 688 | 677 | 671 | 675 | 684 | 667 |
| 1.92 | 1.02 | 1.02 | 1.00 | 1.86 | 1.90 | 1.01 | 1.04 | 1.03 | 1.02 | 1.02 | 1.03 | 1.01 | |||||
| 15:18 | 15:24 | 558 | 565 | 569 | 602 | 576 | 585 | 558 | 1075 | 565 | 1309 | 582 | 578 | 573 | 573 | 571 | 563 |
| 1.05 | 1.02 | 1.04 | 1.00 | 1.93 | 1.01 | 2.33 | 1.03 | 1.02 | 1.02 | 1.02 | 1.02 | 1.01 | |||||
| 16:14 | 16:23 | 428 | 449 | 462 | 481 | 468 | 486 | 455 | 782 | 428 | 635 | 453 | 445 | 442 | 440 | 440 | 435 |
| 1.06 | 1.04 | 1.08 | 1.02 | 1.75 | 0.97 | 1.45 | 1.03 | 1.02 | 1.02 | 1.03 | 1.03 | 1.02 | |||||
| 16:57 | 17:08 | 308 | 334 | 334 | 347 | 339 | 359 | 525 | 314 | 296 | 297 | 462 | 314 | 313 | 310 | 311 | 308 |
| 1.03 | 1.01 | 1.09 | 1.60 | 0.97 | 0.92 | 0.93 | 1.46 | 1.00 | 1.00 | 1.01 | 1.02 | 1.02 | |||||
Appendix C. Flat 10% Tilted Diffusive Façade

| Start Time | End Time | MIN N.d. | MAX N.d. | A | B | C | D | E | F | G | H | I | L | M | N | O | P |
|---|---|---|---|---|---|---|---|---|---|---|---|---|---|---|---|---|---|
| [hh:mm] | [hh:mm] | [W/m2] | [W/m2] | The Upper Value Refers to the Measure in Each Point [W/m2] While the Lower Is the Ratio [-] with the Undisturbed Measure (Unit of Sun) | |||||||||||||
| 9:03 | 9:19 | 257 | 302 | 268 | 329 | 311 | 289 | 342 | 340 | 343 | 333 | 329 | 316 | 311 | 328 | 329 | 318 |
| 1.28 | 1.20 | 1.10 | 1.29 | 1.26 | 1.25 | 1.20 | 1.16 | 1.10 | 1.07 | 1.12 | 1.11 | 1.05 | |||||
| 10:00 | 10:21 | 426 | 474 | 430 | 534 | 500 | 457 | 500 | 516 | 518 | 499 | 498 | 485 | 482 | 509 | 513 | 490 |
| 1.28 | 1.17 | 1.07 | 1.15 | 1.18 | 1.18 | 1.13 | 1.12 | 1.08 | 1.06 | 1.11 | 1.11 | 1.05 | |||||
| 11:18 | 11:33 | 590 | 605 | 595 | 744 | 687 | 614 | 652 | 685 | 674 | 639 | 656 | 638 | 642 | 671 | 678 | 636 |
| 1.27 | 1.16 | 1.04 | 1.10 | 1.15 | 1.13 | 1.07 | 1.10 | 1.06 | 1.07 | 1.12 | 1.12 | 1.05 | |||||
| 12:23 | 12:39 | 685 | 702 | 692 | 848 | 798 | 715 | 725 | 795 | 775 | 735 | 745 | 727 | 728 | 771 | 774 | 733 |
| 1.24 | 1.16 | 1.04 | 1.05 | 1.14 | 1.11 | 1.06 | 1.07 | 1.04 | 1.04 | 1.10 | 1.10 | 1.04 | |||||
| 13:00 | - | - | - | - | - | - | - | - | - | - | - | - | - | - | - | - | - |
| - | - | - | - | - | - | - | - | - | - | - | - | - | - | ||||
| 14:06 | 14:51 | 554 | 690 | 686 | 850 | 790 | 735 | 713 | 775 | 735 | 702 | 710 | 699 | 694 | 726 | 730 | 690 |
| 1.23 | 1.15 | 1.07 | 1.04 | 1.13 | 1.33 | 1.24 | 1.20 | 1.16 | 1.12 | 1.15 | 1.14 | 1.08 | |||||
| 15:01 | 15:16 | 620 | 630 | 632 | 686 | 720 | 673 | 652 | 702 | 673 | 641 | 648 | 642 | 643 | 675 | 683 | 651 |
| 1.09 | 1.15 | 1.07 | 1.04 | 1.12 | 1.07 | 1.02 | 1.03 | 1.02 | 1.03 | 1.08 | 1.10 | 1.05 | |||||
| 16:01 | 16:32 | 425 | 498 | 516 | 646 | 587 | 566 | 524 | 557 | 530 | 443 | 456 | 453 | 468 | 487 | 498 | 463 |
| 1.30 | 1.19 | 1.16 | 1.09 | 1.17 | 1.14 | 1.04 | 1.06 | 1.05 | 1.07 | 1.10 | 1.14 | 1.07 | |||||
| 17:00 | 17:13 | 333 | 356 | 340 | 426 | 392 | 395 | 343 | 369 | 351 | 339 | 348 | 348 | 349 | 358 | 363 | 349 |
| 1.16 | 1.10 | 1.11 | 0.97 | 1.05 | 1.00 | 0.97 | 1.01 | 1.01 | 1.02 | 1.05 | 1.07 | 1.04 | |||||
Appendix D. Flat 10% Tilted Reflective Façade

| Start Time | End Time | MIN N.d. | MAX N.d. | A | B | C | D | E | F | G | H | I | L | M | N | O | P |
|---|---|---|---|---|---|---|---|---|---|---|---|---|---|---|---|---|---|
| [hh:mm] | [hh:mm] | [W/m2] | [W/m2] | The Upper Value Refers to the Measure in Each Point [W/m2] While the Lower Is the Ratio [-] with the Undisturbed Measure (Unit of Sun) | |||||||||||||
| 9:17 | 9:28 | 302 | 328 | 292 | 312 | 509 | 487 | 363 | 337 | 337 | 344 | 346 | 437 | 331 | 332 | 331 | 329 |
| 1.05 | 1.68 | 1.59 | 1.18 | 1.08 | 1.07 | 1.08 | 1.08 | 1.36 | 1.02 | 1.01 | 1.00 | 0.98 | |||||
| 10:20 | 10:31 | 469 | 490 | 455 | 494 | 846 | 488 | 526 | 503 | 504 | 508 | 518 | 500 | 906 | 512 | 498 | 492 |
| 1.06 | 1.80 | 1.04 | 1.11 | 1.05 | 1.05 | 1.06 | 1.08 | 1.03 | 1.86 | 1.04 | 1.01 | 0.99 | |||||
| 11:20 | 11:31 | 588 | 603 | 581 | 1155 | 1113 | 596 | 628 | 616 | 614 | 615 | 627 | 613 | 1002 | 1146 | 616 | 605 |
| 1.97 | 1.89 | 1.01 | 1.06 | 1.05 | 1.04 | 1.03 | 1.05 | 1.02 | 1.67 | 1.90 | 1.02 | 0.99 | |||||
| 12:20 | 12:31 | 663 | 675 | 654 | 1292 | 1337 | 669 | 680 | 696 | 699 | 687 | 697 | 685 | 677 | 1313 | 1288 | 680 |
| 1.95 | 2.02 | 1.00 | 1.02 | 1.04 | 1.05 | 1.03 | 1.05 | 1.03 | 1.00 | 1.95 | 1.91 | 1.01 | |||||
| 13:21 | 13:32 | 642 | 685 | 685 | 1229 | 696 | 682 | 686 | 722 | 1299 | 686 | 702 | 695 | 688 | 708 | 1314 | 694 |
| 1.79 | 1.02 | 1.03 | 1.06 | 1.08 | 1.95 | 1.01 | 1.03 | 1.01 | 1.03 | 1.10 | 1.93 | 1.02 | |||||
| 14:20 | 14:31 | 650 | 657 | 656 | 1219 | 675 | 675 | 658 | 1249 | 1232 | 663 | 676 | 667 | 662 | 669 | 679 | 659 |
| 1.85 | 1.03 | 1.03 | 1.00 | 1.91 | 1.89 | 1.01 | 1.04 | 1.02 | 1.01 | 1.03 | 1.04 | 1.01 | |||||
| 15:27 | 15:35 | 540 | 549 | 546 | 976 | 563 | 579 | 551 | 1159 | 515 | 1063 | 560 | 554 | 552 | 553 | 558 | 547 |
| 1.77 | 1.03 | 1.06 | 1.01 | 2.12 | 0.95 | 1.95 | 1.03 | 1.02 | 1.02 | 1.02 | 1.03 | 1.02 | |||||
| 16:27 | 16:38 | 390 | 411 | 420 | 435 | 421 | 443 | 414 | 709 | 388 | 394 | 411 | 406 | 401 | 399 | 401 | 398 |
| 1.05 | 1.02 | 1.08 | 1.02 | 1.75 | 0.96 | 0.99 | 1.04 | 1.04 | 1.03 | 1.02 | 1.04 | 1.03 | |||||
| 17:20 | 17:31 | 248 | 270 | 270 | 288 | 280 | 304 | 456 | 263 | 244 | 244 | 604 | 262 | 263 | 259 | 261 | 257 |
| 1.05 | 1.04 | 1.14 | 1.74 | 1.01 | 0.95 | 0.95 | 2.39 | 1.05 | 1.05 | 1.04 | 1.05 | 1.05 | |||||
Appendix E. Concave Diffusive Façade

| Start Time | End Time | MIN N.d. | MAX N.d. | A | B | B_2 | C | D | E | F | G | H | I | L | M | N | O | P |
|---|---|---|---|---|---|---|---|---|---|---|---|---|---|---|---|---|---|---|
| [hh:mm] | [hh:mm] | [W/m2] | [W/m2] | The Upper Value Refers to the Measure in Each Point [W/m2] While the Lower Is the Ratio [-] with the Undisturbed Measure (Unit of Sun) | ||||||||||||||
| 9:28 | 9:47 | 335 | 384 | 351 | 413 | - | 402 | 373 | 417 | 416 | 412 | 405 | 410 | 395 | 397 | 417 | 419 | 407 |
| 1.23 | - | 1.18 | 1.09 | 1.19 | 1.18 | 1.15 | 1.12 | 1.12 | 1.06 | 1.06 | 1.10 | 1.10 | 1.06 | |||||
| 10:26 | 10:49 | 494 | 530 | 511 | 604 | 625 | 574 | 530 | 573 | 586 | 575 | 559 | 564 | 543 | 545 | 571 | 573 | 550 |
| 1.23 | 1.26 | 1.16 | 1.06 | 1.14 | 1.15 | 1.13 | 1.09 | 1.09 | 1.04 | 1.04 | 1.09 | 1.09 | 1.04 | |||||
| 11:41 | 11:57 | 623 | 645 | 618 | 744 | 798 | 725 | 664 | 693 | 731 | 715 | 686 | 693 | 658 | 665 | 694 | 708 | 677 |
| 1.20 | 1.28 | 1.16 | 1.06 | 1.10 | 1.16 | 1.13 | 1.08 | 1.09 | 1.03 | 1.04 | 1.08 | 1.10 | 1.05 | |||||
| 12:45 | 13:01 | 694 | 708 | 713 | 815 | 841 | 792 | 729 | 754 | 801 | 779 | 734 | 751 | 726 | 720 | 762 | 760 | 692 |
| 1.17 | 1.21 | 1.14 | 1.05 | 1.09 | 1.15 | 1.12 | 1.05 | 1.07 | 1.03 | 1.02 | 1.08 | 1.07 | 0.98 | |||||
| 13:30 | 13:44 | 716 | 720 | 733 | 865 | 898 | 809 | 741 | 740 | 795 | 773 | 740 | 751 | 739 | 740 | 775 | 780 | 746 |
| 1.20 | 1.25 | 1.12 | 1.03 | 1.03 | 1.11 | 1.08 | 1.03 | 1.05 | 1.03 | 1.03 | 1.08 | 1.09 | 1.04 | |||||
| 14:31 | 14:46 | 663 | 668 | 669 | 800 | 831 | 746 | 701 | 682 | 734 | 711 | 682 | 690 | 683 | 690 | 720 | 730 | 701 |
| 1.20 | 1.24 | 1.12 | 1.05 | 1.02 | 1.10 | 1.07 | 1.03 | 1.04 | 1.03 | 1.04 | 1.09 | 1.10 | 1.06 | |||||
| 16:28 | 16:44 | 441 | 476 | 480 | 572 | 576 | 506 | 498 | 447 | 472 | 447 | 432 | 447 | 449 | 456 | 470 | 476 | 458 |
| 1.18 | 1.20 | 1.06 | 1.05 | 0.95 | 1.01 | 0.97 | 0.95 | 0.99 | 1.00 | 1.02 | 1.06 | 1.08 | 1.04 | |||||
| 17:30 | 17:44 | 262 | 296 | 295 | 341 | 345 | 304 | 314 | 258 | 274 | 256 | 251 | 264 | 273 | 275 | 279 | 282 | 270 |
| 1.13 | 1.15 | 1.03 | 1.07 | 0.90 | 0.97 | 0.92 | 0.91 | 0.97 | 1.01 | 1.03 | 1.05 | 1.08 | 1.04 | |||||
Appendix F. Concave Reflective Façade

| Start Time | End Time | MIN N.d. | MAX N.d. | A | B | B_2 | C | D | E | F | G | H | I | L | M | N | O | P |
|---|---|---|---|---|---|---|---|---|---|---|---|---|---|---|---|---|---|---|
| [hh:mm] | [hh:mm] | [W/m2] | [W/m2] | The Upper Value Refers to the Measure in Each Point [W/m2] While the Lower Is the Ratio [-] with the Undisturbed Measure (Unit of Sun) | ||||||||||||||
| 9:35 | 9:53 | 350 | 397 | 341 | 370 | 375 | 394 | 450 | 419 | 396 | 395 | 404 | 409 | 422 | 464 | 389 | 386 | 384 |
| 1.01 | 1.0207 | 1.07 | 1.21 | 1.12 | 1.05 | 1.05 | 1.07 | 1.07 | 1.1 | 1.2 | 1 | 0.99 | 0.99 | |||||
| 10:42 | 10:55 | 512 | 539 | 517 | 526 | 533 | 1402 | 865 | 562 | 545 | 544 | 549 | 560 | 608 | 668 | 553 | 536 | 529 |
| 1.02 | 1.03 | 2.71 | 1.67 | 1.08 | 1.05 | 1.04 | 1.05 | 1.07 | 1.15 | 1.26 | 1.04 | 1.00 | 0.99 | |||||
| 11:41 | 11:56 | 620 | 634 | 631 | 651 | 667 | 690 | 631 | 657 | 650 | 649 | 648 | 663 | 649 | 853 | 1022 | 647 | 637 |
| 1.04 | 1.07 | 1.10 | 1.00 | 1.04 | 1.03 | 1.03 | 1.03 | 1.05 | 1.03 | 1.35 | 1.62 | 1.02 | 1.00 | |||||
| 12:42 | 12:56 | 678 | 689 | 689 | 1286 | 1521 | 696 | 680 | 694 | 701 | 702 | 696 | 713 | 701 | 687 | 718 | 1103 | 812 |
| 1.90 | 2.24 | 1.03 | 1.00 | 1.02 | 0.00 | 1.03 | 1.03 | 1.01 | 1.03 | 1.02 | 1.00 | 1.05 | 1.62 | |||||
| 13:40 | 13:48 | 674 | 682 | 692 | 1055 | 1823 | 695 | 689 | 686 | 702 | 1492 | 686 | 704 | 694 | 687 | 693 | 752 | 1089 |
| 1.55 | 2.68 | 1.02 | 1.01 | 1.01 | 1.03 | 2.18 | 1.00 | 1.03 | 1.02 | 1.01 | 1.02 | 1.11 | 1.61 | |||||
| 15:07 | 15:17 | 573 | 601 | 611 | 620 | 627 | 606 | 617 | 602 | 1095 | 607 | 681 | 623 | 590 | - | - | 592 | - |
| 1.03 | 1.05 | 1.01 | 1.04 | 1.01 | 1.85 | 1.04 | 1.17 | 1.07 | 1.02 | - | - | 1.04 | - | |||||
| 15:37 | 15:44 | 518 | 533 | 547 | 554 | 557 | 540 | 557 | 719 | 1237 | 522 | 653 | 571 | 534 | 531 | 531 | 533 | 527 |
| 1.05 | 1.06 | 1.03 | 1.06 | 1.37 | 2.37 | 1.00 | 1.25 | 1.09 | 1.03 | 1.02 | 1.02 | 1.03 | 1.02 | |||||
| 16:45 | 16:55 | 346 | 372 | 379 | 383 | 384 | 376 | 396 | 380 | 363 | 340 | 569 | 433 | 360 | 358 | 354 | 355 | 351 |
| 1.04 | 1.05 | 1.03 | 1.09 | 1.04 | 1.00 | 0.95 | 1.60 | 1.23 | 1.02 | 1.03 | 1.02 | 1.03 | 1.02 | |||||
| 17:37 | 17:47 | 197 | 228 | 237 | 237 | 231 | 251 | 238 | 203 | 192 | 196 | 225 | 214 | 213 | 208 | 210 | 208 | |
| 1.04 | 1.04 | 1.03 | 1.14 | 1.10 | 0.94 | 0.91 | 0.94 | 1.09 | 1.05 | 1.05 | 1.04 | 1.07 | 1.06 | |||||
References
- Santamouris, M.; Vasilakopoulou, K. Present and Future Energy Consumption of Buildings: Challenges and Opportunities towards Decarbonisation. e-Prime 2021, 1, 100002. [Google Scholar] [CrossRef]
- Zhang, J.; Mohegh, A.; Li, Y.; Levinson, R.; Ban-Weiss, G. Systematic Comparison of the Influence of Cool Wall versus Cool Roof Adoption on Urban Climate in the Los Angeles Basin. Environ. Sci. Technol. 2018, 52, 11188–11197. [Google Scholar] [CrossRef] [PubMed]
- Zhang, Y.; Long, E.; Li, Y.; Li, P. Solar radiation reflective coating material on building envelopes: Heat transfer analysis and cooling energy saving. Energy Explor. Exploit. 2017, 35, 748–766. [Google Scholar] [CrossRef] [Green Version]
- Akbari, H.; Pomerantz, M.; Taha, H. Cool surfaces and shade trees to reduce energy use and improve air quality in urban areas. Sol. Energy 2001, 70, 295–310. [Google Scholar] [CrossRef]
- Akbari, H. Measured energy savings from the application of reflective roofs in two small non-residential buildings. Energy 2003, 28, 953–967. [Google Scholar] [CrossRef] [Green Version]
- Akbari, H.; Konopacki, S. Calculating energy-saving potentials of heat-island reduction strategies. Energy Policy 2005, 33, 721–756. [Google Scholar] [CrossRef]
- Synnefa, A.; Santamouris, M.; Akbari, H. Estimating the effect of using cool coatings on energy loads and thermal comfort in residential buildings in various climatic conditions. Energy Build. 2007, 39, 1167–1174. [Google Scholar] [CrossRef]
- Santamouris, M. Cooling the cities—A review of reflective and green roof mitigation technologies to fight heat island and improve comfort in urban environments. Sol. Energy 2014, 103, 682–703. [Google Scholar] [CrossRef]
- Santamouris, M.; Ding, L.; Fiorito, F.; Oldfield, P.; Osmond, P.; Paolini, R.; Prasad, D.; Synnefa, A. Passive and active cooling for the outdoor built environment—Analysis and assessment of the cooling potential of mitigation technologies using performance data from 220 large scale projects. Sol. Energy 2017, 154, 14–33. [Google Scholar] [CrossRef]
- Zinzi, M. Exploring the potentialities of cool facades to improve the thermal response of Mediterranean residential buildings. Sol. Energy 2016, 135, 386–397. [Google Scholar] [CrossRef]
- Lee, H.; Mayer, H. Thermal comfort of pedestrians in an urban street canyon is affected by increasing albedo of building walls. Int. J. Biometeorol. 2018, 62, 1199–1209. [Google Scholar] [CrossRef] [PubMed]
- Nazarian, N.; Dumas, N.; Kleissl, J.; Norford, L. Effectiveness of cool walls on cooling load and urban temperature in a tropical climate. Energy Build. 2019, 187, 144–162. [Google Scholar] [CrossRef] [Green Version]
- Rossi, F.; Pisello, A.L.; Nicolini, A.; Filipponi, M.; Palombo, M. Analysis of retro-reflective surfaces for urban heat island mitigation: A new analytical model. Appl. Energy 2014, 114, 621–631. [Google Scholar] [CrossRef]
- Rossi, F.; Morini, E.; Castellani, B.; Nicolini, A.; Bonamente, E.; Anderini, E.; Cotana, F. Beneficial effects of retroreflective materials in urban canyons: Results from seasonal monitoring campaign. J. Phys. Conf. Ser. 2015, 655, 12012. [Google Scholar] [CrossRef]
- Yuan, J.; Farnham, C.; Emura, K. Development of a retro-reflective material as building coating and evaluation on albedo of urban canyons and building heat loads. Energy Build. 2015, 103, 107–117. [Google Scholar] [CrossRef]
- Levinson, R.; Chen, S.; Slack, J.; Goudey, H.; Harima, T.; Berdahl, P. Design, characterization, and fabrication of solar-retroreflective cool-wall materials. Sol. Energy Mater. Sol. Cells 2020, 206, 110117. [Google Scholar] [CrossRef] [Green Version]
- Yang, S.-H.; Matzarakis, A. Study on human thermal comfort for architecture—The Example of Shanghai, China. In Proceedings of the ICUC9—9th International Conference on Urban Climate, Toulouse, France, 20–24 July 2015. [Google Scholar]
- Matzarakis, A.; Fröhlich, D.; Gangwisch, M.; Ketterer, C.; Peer, A.; Freiburg, A.; Freiburg, D. Developments and applications of thermal indices in urban structures by RayMan and SkyHelios model. In Proceedings of the ICUC9—9th International Conference on Urban Climate, Toulouse, France, 20–24 July 2015. [Google Scholar]
- Schiler, M.; Valmont, E. Microclimatic impact: Glare around the Walt Disney Concert Hall. In Proceedings of the Solar World Congress 2005 Joint American Solar Energy Society/International Solar Energy Conference, Orlando, 6–12 August 2005; p. 511. [Google Scholar]
- Furler, R.A. Angular Dependence of Optical Properties of Homogeneous Glasses. ASHRAE Trans. 1991, 98, 1. [Google Scholar]
- CityA.M. Dazzling Shard Has Inadvertent Effect of Blinding Train Drivers. 2012. Available online: https://www.cityam.com/dazzling-shard-has-inadvertent-effect-blinding-train-drivers/ (accessed on 20 January 2022).
- Rose, T.; Wollert, A. The dark side of photovoltaic—3D simulation of glare assessing risk and discomfort. Environ. Impact Assess. Rev. 2015, 52, 24–30. [Google Scholar] [CrossRef]
- Ho, C.K.; Ghanbari, C.M.; Diver, R.B. Methodology To Assess Potential Glint and Glare Hazards From Concentrating Solar Power Plants: Analytical Models and Experimental Validation. J. Sol. Energy Eng. 2011, 133, 3102. [Google Scholar] [CrossRef]
- Las Vegas Review Journal. Vdara Visitor: ‘Death Ray’ Scorched Hair. 2010. Available online: https://www.reviewjournal.com/news/vdara-visitor-death-ray-scorched-hair/ (accessed on 20 January 2022).
- Pexels. Available online: https://www.pexels.com/ (accessed on 16 March 2022).
- Campbell-Dollaghan, K. A Brief History of Buildings That Melt Things. Available online: https://gizmodo.com/a-brief-history-of-buildings-that-melt-things-1247657178 (accessed on 20 January 2022).
- Danks, R.; Good, J. Urban Scale Simulations of Solar Reflections in the Built Environment: Methodology & Validation. In Proceedings of the Symposium on Simulation for Architecture & Urban Design 2016, London, UK, 16–18 May 2016; pp. 19–26. [Google Scholar]
- Danks, R.; Good, J.; Sinclair, R. Assessing reflected sunlight from building facades: A literature review and proposed criteria. Build. Environ. 2016, 103, 193–202. [Google Scholar] [CrossRef]
- Development Control Plan. Section 3 General Provisions, Sydney, AU. 2012. Available online: https://www.cityofsydney.nsw.gov.au/-/media/corporate/files/2020-07-migrated/files_s-1/section3-dcp2012-170619.pdf?download=true (accessed on 16 March 2022).
- Buildings Department. Guidelines on Design and Construction Requirements for Energy Efficiency of Residential Buildings; Buildings Department: Hong Kong, 2014. [Google Scholar]
- Dwyer, C. Planning Advice Note Solar Glare: Guidelines and Best Practice for Assessing Solar Glare in the City of London; The City of London Corporation: London, UK, 2017. [Google Scholar]
- Suk, J.Y.; Schiler, M.; Kensek, K. Is Exterior Glare Problematic? Investigation on Visual Discomfort Caused by Reflected Sunlight on Specular Building Facades. In Proceedings of the PLEA 2016 Conference on Passive and Low energy Architecture.Cities, buildings, People: Towards Regenerative Environments, Los Angeles, CA, USA, 11–13 July 2016. [Google Scholar]
- Shih, N.J.; Huang, Y.S. A study of reflection glare in Taipei. Build. Res. Inf. 2001, 29, 30–39. [Google Scholar] [CrossRef]
- Danks, R.; Good, J. Urban Solar Reflection Identification, Simulation, Analysis and Mitigation: Learning From Case Studies. In Proceedings of the eSim 2016 Building Performance Simulation Conference eSim 2016, Hamilton, ON, Canada, 3–6 May 2016; pp. 309–318. [Google Scholar]
- Brzezicki, M. The Influence of Reflected Solar Glare Caused by the Glass Cladding of a Building: Application of Caustic Curve Analysis. Comput. Civ. Infrastruct. Eng. 2012, 27, 347–357. [Google Scholar] [CrossRef]
- Yang, X.; Grobe, L.; Stephen, W. Simulation of Reflected Daylight From Building Envelopes. In Proceedings of the 13th Conference of International Building Performance Simulation Association, Chambéry, France, 26–28 August 2013; pp. 3673–3680. [Google Scholar]
- Ou, Y. Quantitative study of reflection of sunlight by a glass curtain wall resulting in a visual masking effect. Appl. Opt. 2014, 53, 6893. [Google Scholar] [CrossRef] [PubMed]
- Shih, N.J.; Huang, Y.-S. An analysis and simulation of curtain wall reflection glare. Build. Environ. 1999, 36, 619–626. [Google Scholar] [CrossRef]
- Vollmer, M.; Möllmann, K.P. Caustic effects due to sunlight reflections from skyscrapers: Simulations and experiments. Eur. J. Phys. 2012, 33, 1429–1455. [Google Scholar] [CrossRef]
- POV-Ray. Available online: http://www.povray.org/ (accessed on 16 March 2022).
- OpticStudio. Available online: https://www.zemax.com/pages/opticstudio (accessed on 16 March 2022).
- Ishak, N.M.; Hien, W.N.; Jenatabadi, H.S.; Mustafa, N.A.; Zawawi, E.M.A. Effect of reflective building façade on pedestrian visual comfort. IOP Conf. Ser. Earth Environ. Sci. 2019, 385, 12059. [Google Scholar] [CrossRef]
- Achsani, R.A.; Wonorahardjo, S. Studies on Visual Environment Phenomena of Urban Areas: A Systematic Review. IOP Conf. Ser. Earth Environ. Sci. 2020, 532, 12016. [Google Scholar] [CrossRef]
- Wong, J.S.J. A comprehensive ray tracing study on the impact of solar reflections from glass curtain walls. Environ. Monit. Assess. 2016, 188, 16. [Google Scholar] [CrossRef]
- Danks, R.; Good, J.; Sinclair, R. Avoiding The Dreaded Death Ray: Controlling Facade Reflections through Purposeful Design. In Proceedings of the Façade Tectonics World Congress, Los Angeles, CA, USA, 2016; Volume 2, ISBN 978-1-882352-43-2. Available online: https://www.researchgate.net/publication/309136628_Avoiding_The_Dreaded_Death_Ray_Controlling_Facade_Reflections_Through_Purposeful_Design (accessed on 16 March 2022).
- McNeel Rhinoceros. Available online: https://www.rhino3d.com/ (accessed on 16 March 2022).
- Grasshopper for Rhinoceros. Available online: https://www.grasshopper3d.com/ (accessed on 16 March 2022).
- Barr, J. Skyscraper Height. J. Real Estate Financ. Econ. 2012, 45, 723–753. [Google Scholar] [CrossRef]
- UNI—Ente Italiano di Normazione. UNI EN 14500—Benessere Termico E Visivo, Metodi Di Prova E Di Calcolo; UNI—Ente Italiano di Normazione: Milano, Italy, 2021. [Google Scholar]
- ASTM International (ASTM). ASTM E903—Standard Test Method for Solar Absorptance, Reflectance, and Transmittance of Materials Using Integrating Spheres; ASTM International: West Conshohocken, PA, USA, 2020; p. 17. [Google Scholar]
- Masson, V.; Grimmond, C.S.B.; Oke, T.R. Evaluation of the Town Energy Balance (TEB) Scheme with Direct Measurements from Dry Districts in Two Cities. J. Appl. Meteorol. 2002, 41, 1011–1026. [Google Scholar] [CrossRef]
- Lemonsu, A.; Grimmond, C.S.B.; Masson, V. Modeling the Surface Energy Balance of the Core of an Old Mediterranean City: Marseille. J. Appl. Meteorol. 2004, 43, 312–327. [Google Scholar] [CrossRef]
- Ban-Weiss, G.A.; Woods, J.; Levinson, R. Using remote sensing to quantify albedo of roofs in seven California cities, Part 1: Methods. Sol. Energy 2015, 115, 777–790. [Google Scholar] [CrossRef] [Green Version]
- LBNL WINDOW Version 7.7.16. Available online: https://windows.lbl.gov/software/window (accessed on 16 March 2022).
- González, J.; Fiorito, F. Daylight Design of Office Buildings: Optimisation of External Solar Shadings by Using Combined Simulation Methods. Buildings 2015, 5, 560–580. [Google Scholar] [CrossRef] [Green Version]
- Duffie, J.; Beckman, W. Solar Engineering of Thermal Processes, 4th ed.; John Wiley & Sons: Hoboken, NJ, USA, 2013; ISBN 9780470873663. [Google Scholar]
- Takebayashi, H. High-reflectance technology on building façades: Installation guidelines for pedestrian comfort. Sustainability 2016, 8, 785. [Google Scholar] [CrossRef] [Green Version]
- Shanks, K.; Ferrer-Rodriguez, J.P.; Fernàndez, E.F.; Almonacid, F.; Pérez-Higueras, P.; Senthilarasu, S.; Mallick, T. A >3000 suns high concentrator photovoltaic design based on multiple Fresnel lens primaries focusing to one central solar cell. Sol. Energy 2018, 169, 457–467. [Google Scholar] [CrossRef]
- Gordon, J.M. A 100-sun linear photovoltaic solar concentrator design from inexpensive commercial components. Sol. Energy 1996, 57, 301–305. [Google Scholar] [CrossRef]
- Paolini, R.; Terraneo, G.; Ferrari, C.; Sleiman, M.; Muscio, A.; Metrangolo, P.; Poli, T.; Destaillats, H.; Zinzi, M.; Levinson, R. Effects of soiling and weathering on the albedo of building envelope materials: Lessons learned from natural exposure in two European cities and tuning of a laboratory simulation practice. Sol. Energy Mater. Sol. Cells 2020, 205, 110264. [Google Scholar] [CrossRef] [Green Version]
- Wang, J.; Liu, S.; Meng, X.; Gao, W.; Yuan, J. Application of retro-reflective materials in urban buildings: A comprehensive review. Energy Build. 2021, 247, 111137. [Google Scholar] [CrossRef]
- Yuan, J.; Emura, K.; Farnham, C. Evaluation of retro-reflective properties and upward to downward reflection ratio of glass bead retro-reflective material using a numerical model. Urban Clim. 2021, 36, 100774. [Google Scholar] [CrossRef]
- Tsangrassoulis, A.; Santamouris, M. Numerical estimation of street canyon albedo consisting of vertical coated glazed facades. Energy Build. 2003, 35, 527–531. [Google Scholar] [CrossRef]
- Kotopouleas, A.; Giridharan, R.; Nikolopoulou, M.; Watkins, R.; Yeninarcilar, M. Experimental investigation of the impact of urban fabric on canyon albedo using a 1:10 scaled physical model. Sol. Energy 2021, 230, 449–461. [Google Scholar] [CrossRef]
- Aida, M.; Gotoh, K. Urban albedo as a function of the urban structure—A two-dimensional numerical simulation—Part II. Bound. Layer Meteorol. 1982, 23, 415–424. [Google Scholar] [CrossRef]


| Name of the Building | Façade Material | Building Geometry | Effects on the Surroundings | Mitigation Strategies Applied |
|---|---|---|---|---|
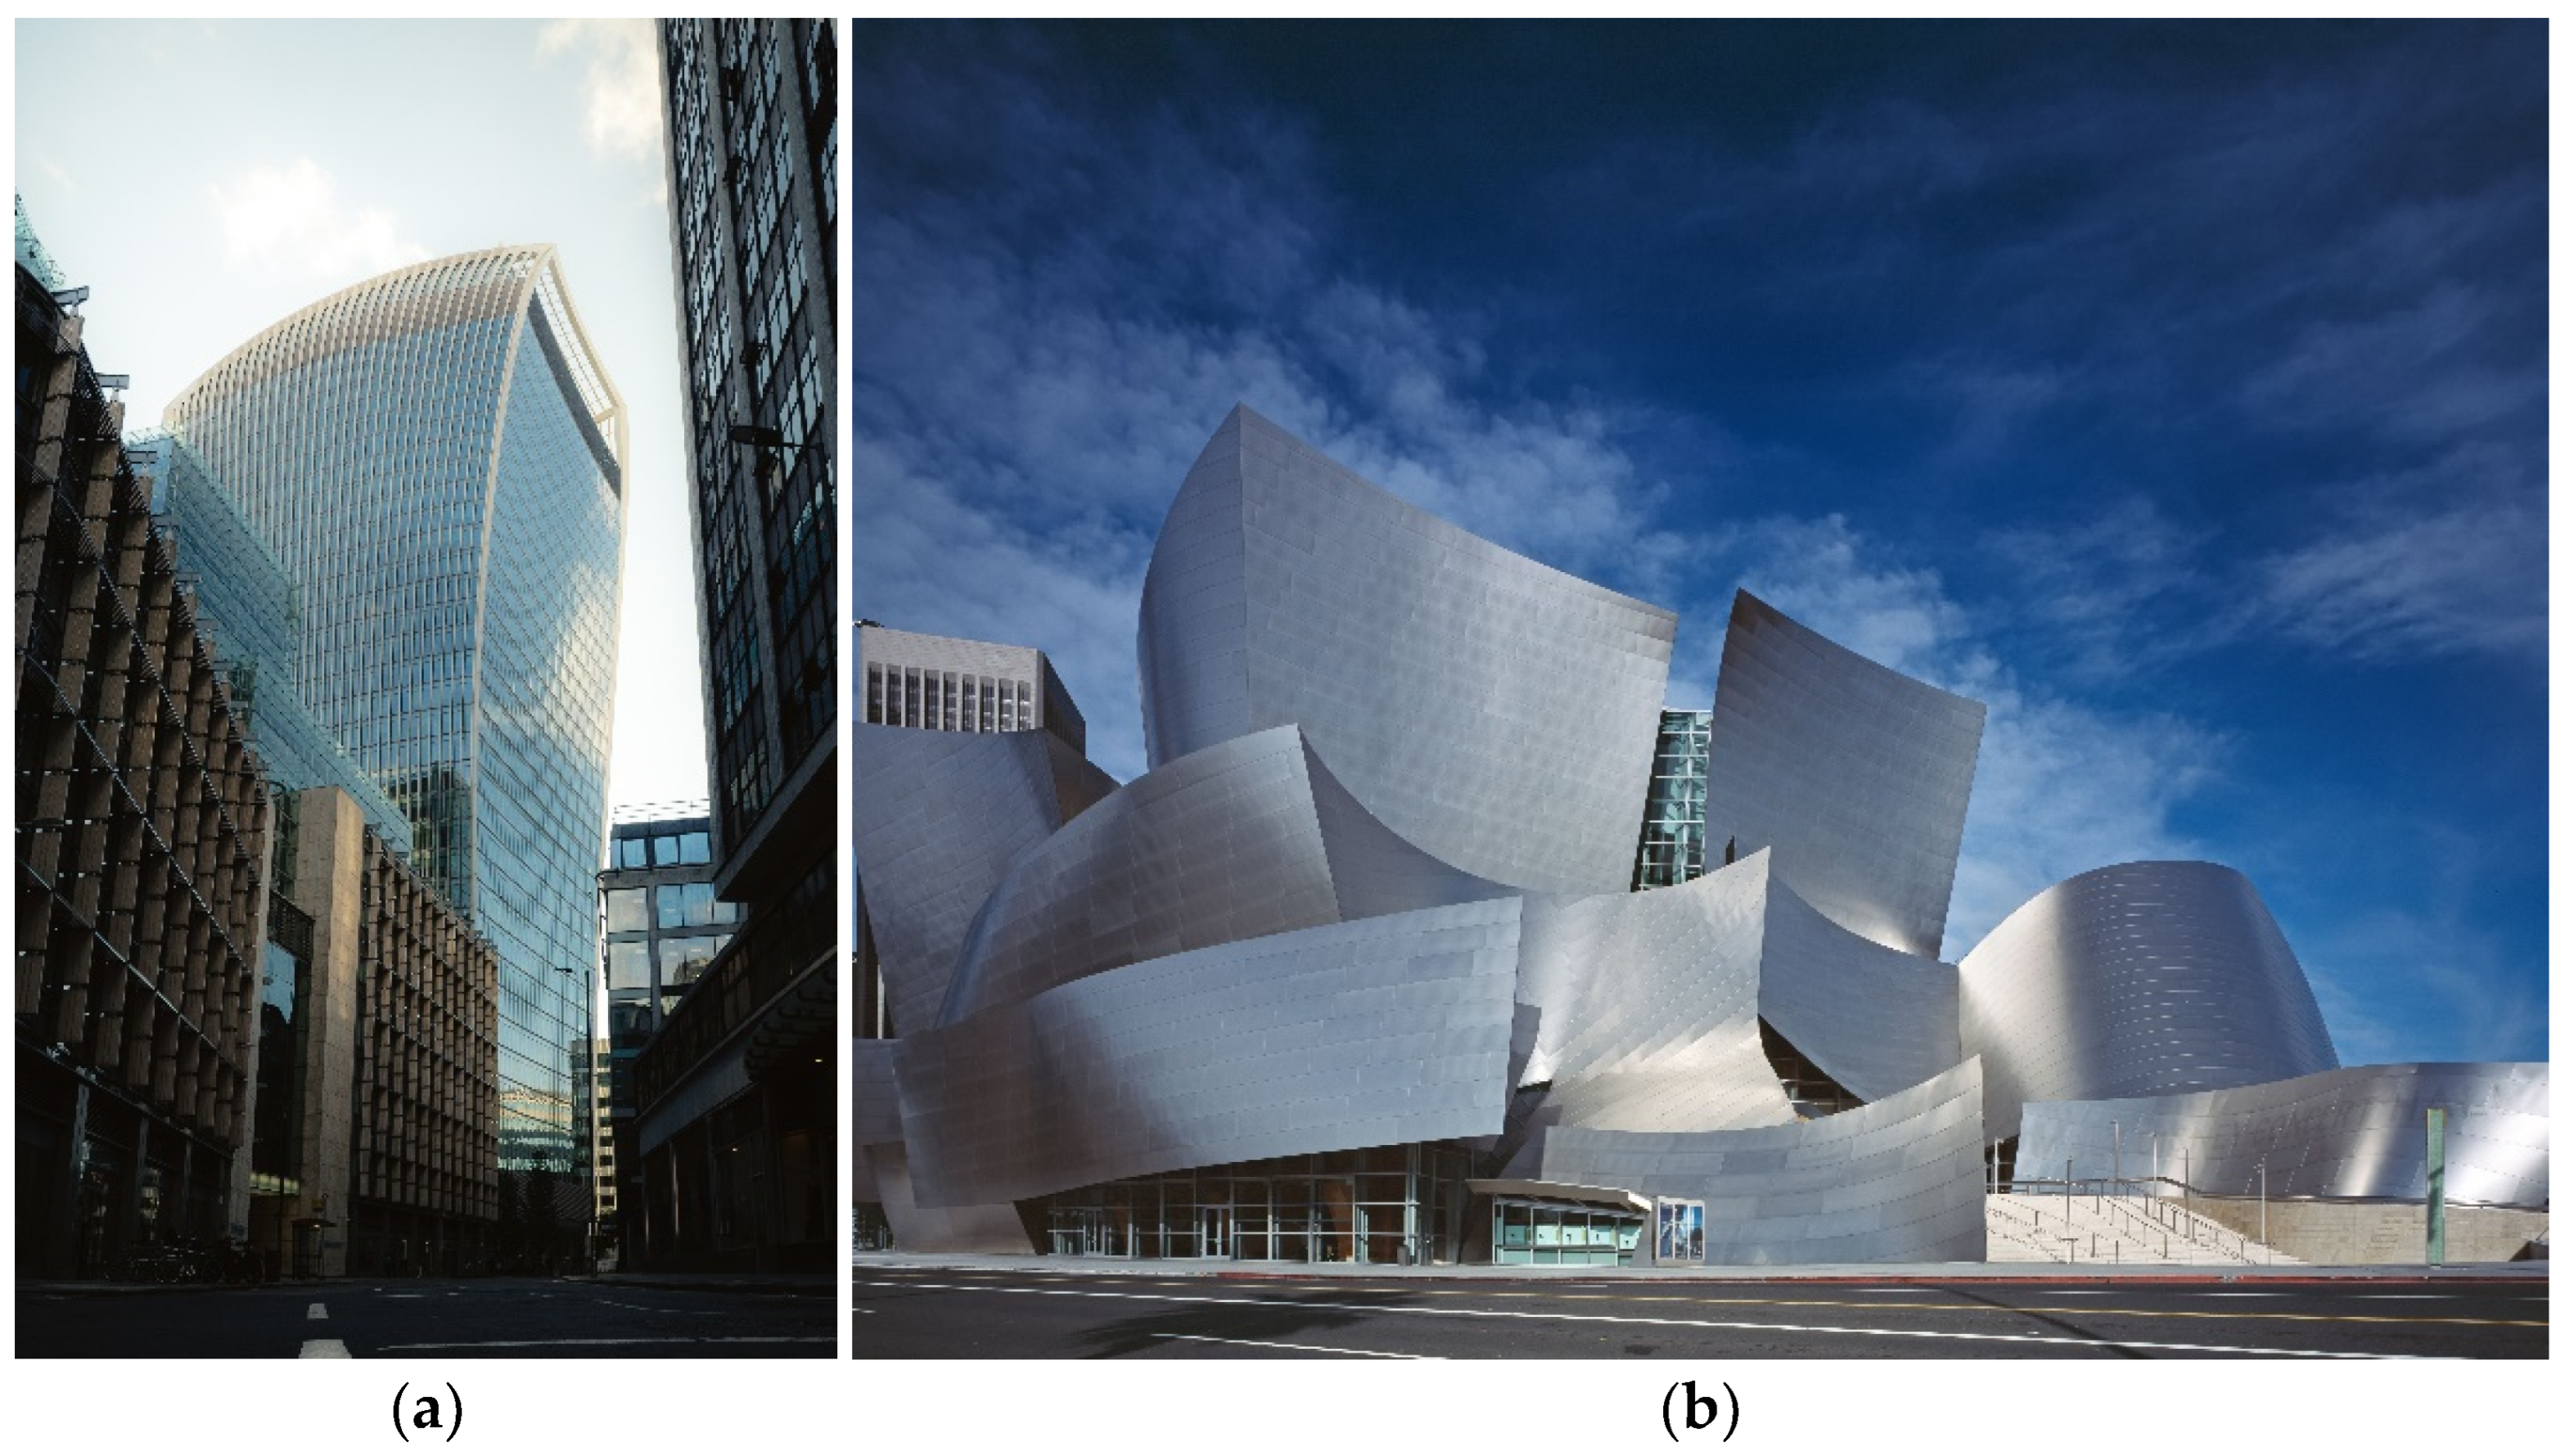
| 20 Fenchurch Street-London, UK (Figure 1a) | Laminated glazing | Concave, single curvature | Reported focused solar radiation spot at pedestrian level six times higher than direct sunlight | External fins and shading systems |
| Vdara Building- LasVegas, USA | Reflective glazing | Concave, single curvature | Reported raised temperatures in the surrounding areas and sunburns on pedestrian bystanders | Application of nonreflective solar films on the façade |
| Walt Disney Concert Hall-Los Angeles, USA (Figure 1b) | Stainless steel panels | Multiple double curvature surfaces | Multiple disabling glare sources, melted asphalt pavements due to the concentrated sunlight | Diffuse and satin-finishing of surfaces |
| Description | Code | τs [%] | ρs [%] | τv [%] |
|---|---|---|---|---|
| High Reflective Sun Control_DGU | HR_SunC | 9.9 | 53.3 | 15.1 |
| Selective_DGU | SEL | 31.6 | 23.9 | 66.5 |
| Flat Reflective Façade | |||||
|---|---|---|---|---|---|
h. 10:00 | Meas. [W/m2] | N.d.Meas | UoS | Time | |
| [W/m2] | [-] | [hh:mm] | |||
| A | 406 | 410 | 0.99 | 10:00 | |
| B | 422 | 413 | 1.02 | 10:01 | |
| C | 754 | 416 | 1.81 | 10:02 | |
| D | 431 | 420 | 1.03 | 10:03 | |
| E | 467 | 422 | 1.11 | 10:04 | |
| F | 445 | 424 | 1.05 | 10:05 | |
| G | 444 | 424 | 1.05 | 10:05 | |
| H | 450 | 428 | 1.05 | 10:06 | |
| I | 458 | 428 | 1.07 | 10:06 | |
| L | 439 | 431 | 1.02 | 10:07 | |
| M | 870 | 434 | 2.00 | 10:09 | |
| N | 441 | 439 | 1.01 | 10:10 | |
| O | 438 | 442 | 0.99 | 10:11 | |
| P | 437 | 446 | 0.98 | 10:12 | |
h. 13:00 | Meas. [W/m2] | N.d.Meas | UoS | Time | |
| [W/m2] | [-] | [hh:mm] | |||
| A | 693 | 686 | 1.01 | 13:06 | |
| B | 1321 | 687 | 1.92 | 13:07 | |
| C | 705 | 685 | 1.03 | 13:08 | |
| D | 698 | 685 | 1.02 | 13:09 | |
| E | 694 | 685 | 1.01 | 13:10 | |
| F | 708 | 684 | 1.03 | 13:11 | |
| G | 711 | 684 | 1.04 | 13:12 | |
| H | 691 | 685 | 1.01 | 13:13 | |
| I | 697 | 686 | 1.02 | 13:14 | |
| L | 686 | 681 | 1.01 | 13:15 | |
| M | 685 | 676 | 1.01 | 13:16 | |
| N | 704 | 676 | 1.04 | 13:17 | |
| O | 1327 | 683 | 1.94 | 13:18 | |
| P | 1374 | 684 | 2.01 | 13:19 | |
h. 16:00 | Meas. [W/m2] | N.d.Meas | UoS | Time | |
| [W/m2] | [-] | [hh:mm] | |||
| A | 462 | 456 | 1.01 | 16:14 | |
| B | 481 | 452 | 1.06 | 16:15 | |
| C | 468 | 452 | 1.04 | 16:15 | |
| D | 486 | 449 | 1.08 | 16:16 | |
| E | 455 | 449 | 1.01 | 16:16 | |
| F | 782 | 446 | 1.75 | 16:17 | |
| G | 428 | 441 | 0.97 | 16:19 | |
| H | 635 | 441 | 1.44 | 16:19 | |
| I | 453 | 439 | 1.03 | 16:20 | |
| L | 445 | 438 | 1.02 | 16:21 | |
| M | 442 | 434 | 1.02 | 16:22 | |
| N | 440 | 428 | 1.03 | 16:23 | |
| O | 440 | 428 | 1.03 | 16:23 | |
| P | 435 | 428 | 1.02 | 16:24 | |
| Concave Reflective Façade | |||||
|---|---|---|---|---|---|
h. 10:00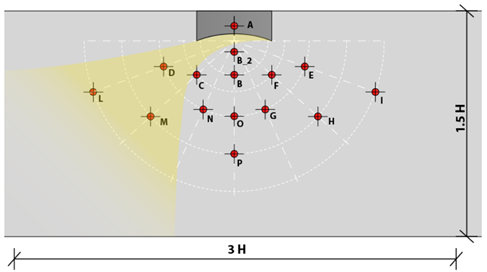 | Meas. [W/m2] | N.d.Meas | UoS | Time | |
| [W/m2] | [-] | [hh:mm] | |||
| A | 341 | 350 | 0.98 | 9:35 | |
| B | 370 | 365 | 1.01 | 9:40 | |
| B_2 | 375 | 367 | 1.02 | 9:41 | |
| C | 394 | 367 | 1.07 | 9:41 | |
| D | 450 | 371 | 1.21 | 9:42 | |
| E | 419 | 374 | 1.12 | 9:43 | |
| F | 396 | 377 | 1.05 | 9:44 | |
| G | 395 | 377 | 1.05 | 9:44 | |
| H | 404 | 379 | 1.07 | 9:45 | |
| I | 409 | 381 | 1.07 | 9:46 | |
| L | 422 | 383 | 1.10 | 9:47 | |
| M | 464 | 386 | 1.20 | 9:48 | |
| N | 389 | 388 | 1.00 | 9:49 | |
| O | 386 | 390 | 0.99 | 9:50 | |
| P | 384 | 390 | 0.99 | 9:50 | |
h. 13:00 | Meas. [W/m2] | N.d.Meas | UoS | Time | |
| [W/m2] | [-] | [hh:mm] | |||
| A | 689 | 678 | 1.02 | 12:42 | |
| B | 1286 | 677 | 1.90 | 12:43 | |
| B_2 | 1521 | 678 | 2.24 | 12:44 | |
| C | 696 | 678 | 1.03 | 0:00 | |
| D | 680 | 677 | 1.00 | 12:45 | |
| E | 694 | 679 | 1.02 | 12:46 | |
| F | 701 | 683 | 1.03 | 12:48 | |
| G | 702 | 684 | 1.03 | 12:49 | |
| H | 696 | 686 | 1.01 | 12:50 | |
| I | 713 | 689 | 1.03 | 12:51 | |
| L | 701 | 688 | 1.02 | 12:52 | |
| M | 687 | 684 | 1.00 | 12:53 | |
| N | 718 | 684 | 1.05 | 12:54 | |
| O | 1103 | 683 | 1.62 | 12:55 | |
| P | 812 | 683 | 1.19 | 12:56 | |
h. 16:00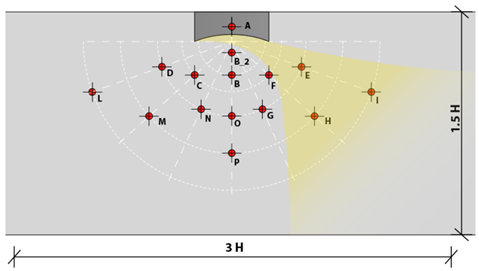 | Meas. [W/m2] | N.d.Meas | UoS | Time | |
| [W/m2] | [-] | [hh:mm] | |||
| A | 547 | 533 | 1.03 | 15:37 | |
| B | 554 | 530 | 1.05 | 15:38 | |
| B_2 | 557 | 530 | 1.05 | 15:38 | |
| C | 540 | 524 | 1.03 | 15:39 | |
| D | 557 | 524 | 1.06 | 15:39 | |
| E | 719 | 524 | 1.37 | 15:40 | |
| F | 1237 | 524 | 2.36 | 15:40 | |
| G | 522 | 523 | 1.00 | 15:41 | |
| H | 653 | 523 | 1.25 | 15:41 | |
| I | 571 | 522 | 1.09 | 15:42 | |
| L | 534 | 522 | 1.02 | 15:42 | |
| M | 531 | 519 | 1.02 | 15:43 | |
| N | 531 | 519 | 1.02 | 15:43 | |
| O | 533 | 518 | 1.03 | 15:44 | |
| P | 527 | 517 | 1.02 | 15:45 | |
| Incidence Angle α of the Solar Radiation Per Orientation—Flat Vertical Façade | |||
|---|---|---|---|
| α | E/W | SE/SW | S |
| α < 50° | 51% | 42% | 34% |
| 50° < α < 60° | 15% | 22% | 16% |
| 60° < α < 70° | 11% | 15% | 21% |
| 70° < α < 80° | 8% | 11% | 16% |
| 80° < α < 85° | 10% | 5% | 7% |
| 85° < α < 90° | 5% | 5% | 6% |
| Total > 70° | 23% | 21% | 29% |
Publisher’s Note: MDPI stays neutral with regard to jurisdictional claims in published maps and institutional affiliations. |
© 2022 by the authors. Licensee MDPI, Basel, Switzerland. This article is an open access article distributed under the terms and conditions of the Creative Commons Attribution (CC BY) license (https://creativecommons.org/licenses/by/4.0/).
Share and Cite
Speroni, A.; Mainini, A.G.; Zani, A.; Paolini, R.; Pagnacco, T.; Poli, T. Experimental Assessment of the Reflection of Solar Radiation from Façades of Tall Buildings to the Pedestrian Level. Sustainability 2022, 14, 5781. https://doi.org/10.3390/su14105781
Speroni A, Mainini AG, Zani A, Paolini R, Pagnacco T, Poli T. Experimental Assessment of the Reflection of Solar Radiation from Façades of Tall Buildings to the Pedestrian Level. Sustainability. 2022; 14(10):5781. https://doi.org/10.3390/su14105781
Chicago/Turabian StyleSperoni, Alberto, Andrea Giovanni Mainini, Andrea Zani, Riccardo Paolini, Tommaso Pagnacco, and Tiziana Poli. 2022. "Experimental Assessment of the Reflection of Solar Radiation from Façades of Tall Buildings to the Pedestrian Level" Sustainability 14, no. 10: 5781. https://doi.org/10.3390/su14105781
APA StyleSperoni, A., Mainini, A. G., Zani, A., Paolini, R., Pagnacco, T., & Poli, T. (2022). Experimental Assessment of the Reflection of Solar Radiation from Façades of Tall Buildings to the Pedestrian Level. Sustainability, 14(10), 5781. https://doi.org/10.3390/su14105781