1. Introduction
Mode share of people who bike has increased since the beginning of the new millennium, and biking is popular to travel short distances in urban areas. Biking is preferred as a mode of transportation when a trip distance is two to three miles [
1]. Three miles is a distance that can be reached within 7 to 20 min based on the experience and confidence level of a bicyclist. In congested urban areas, distances of less than three miles can be reached faster by bike than by car.
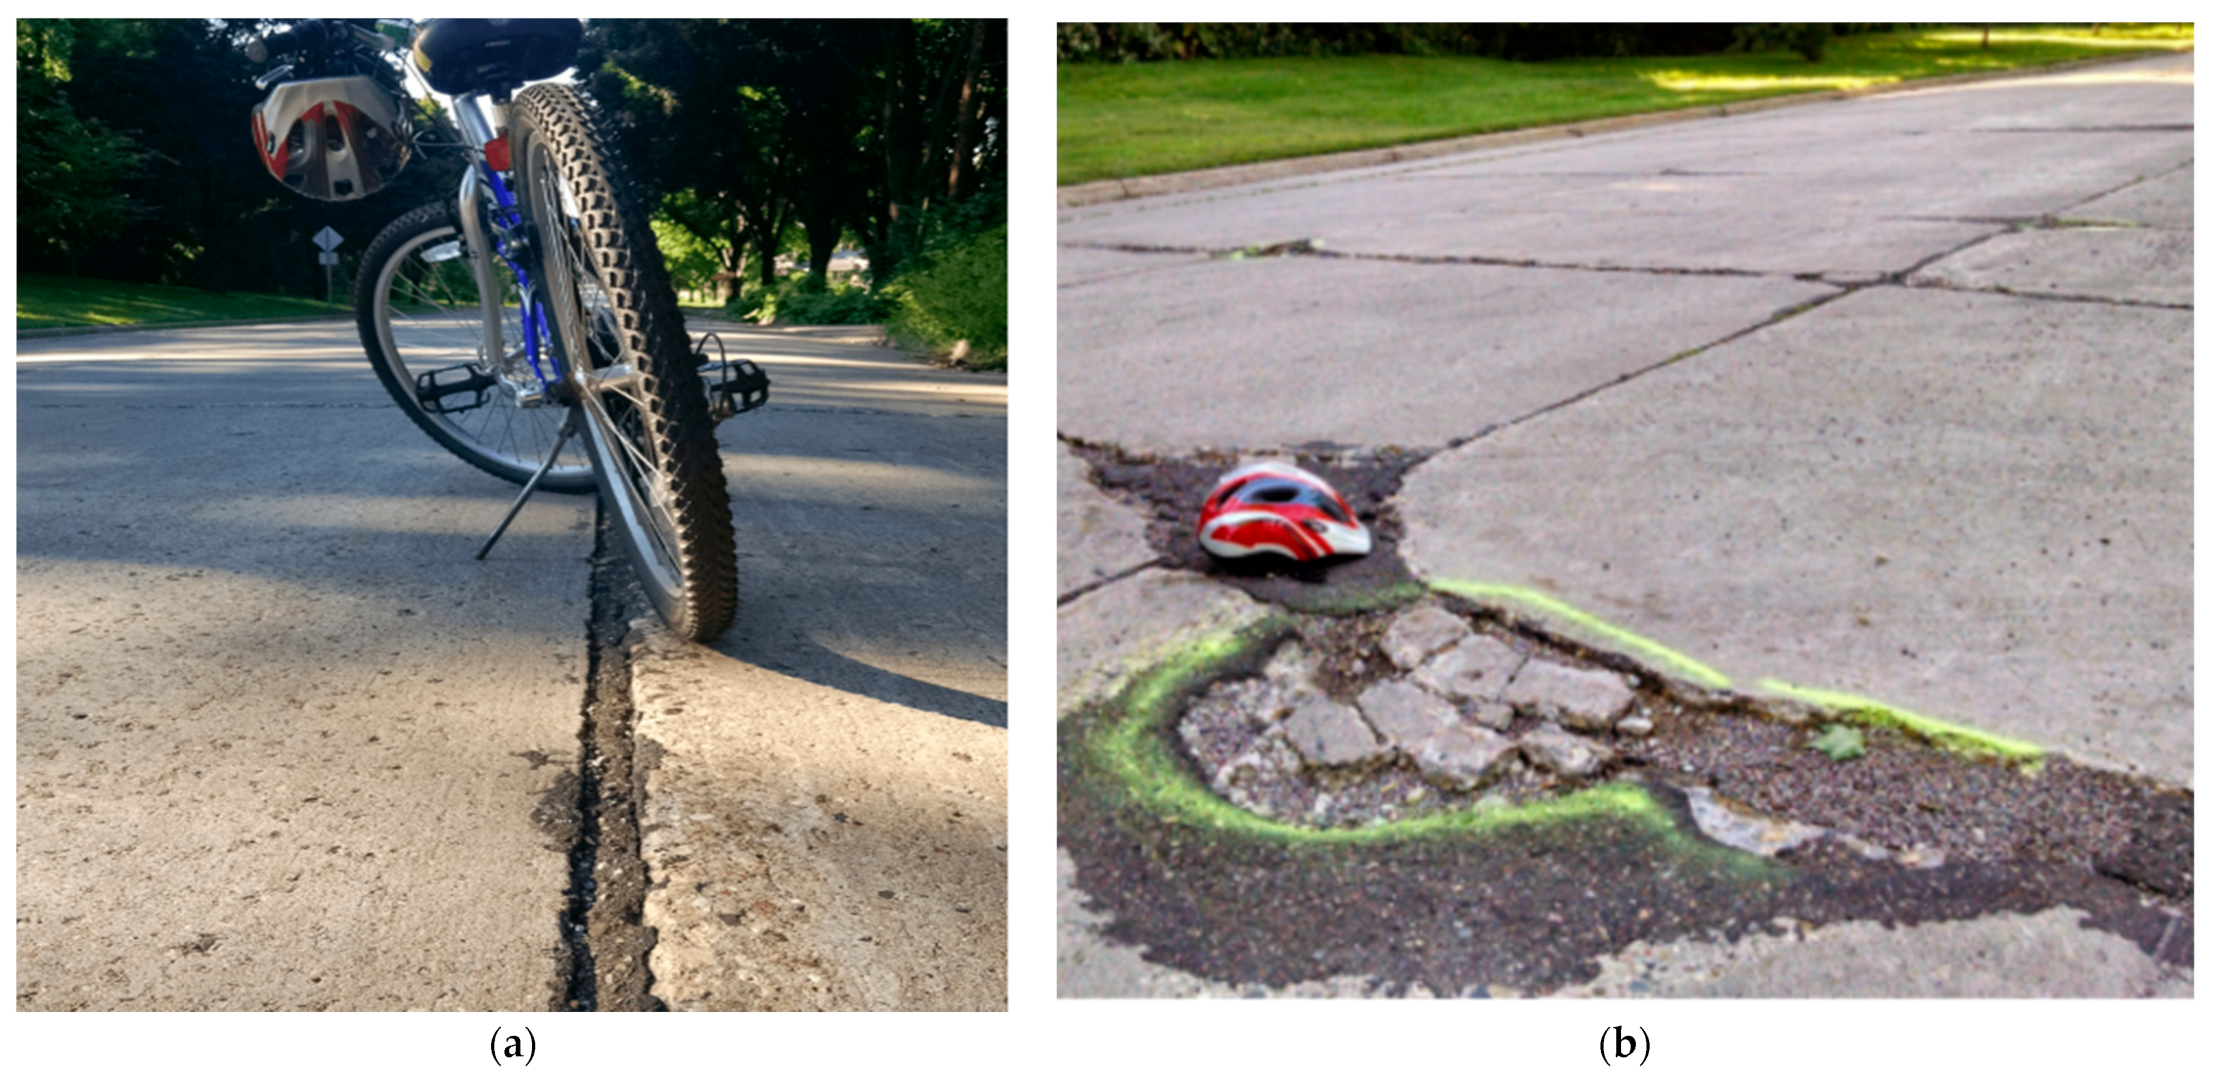
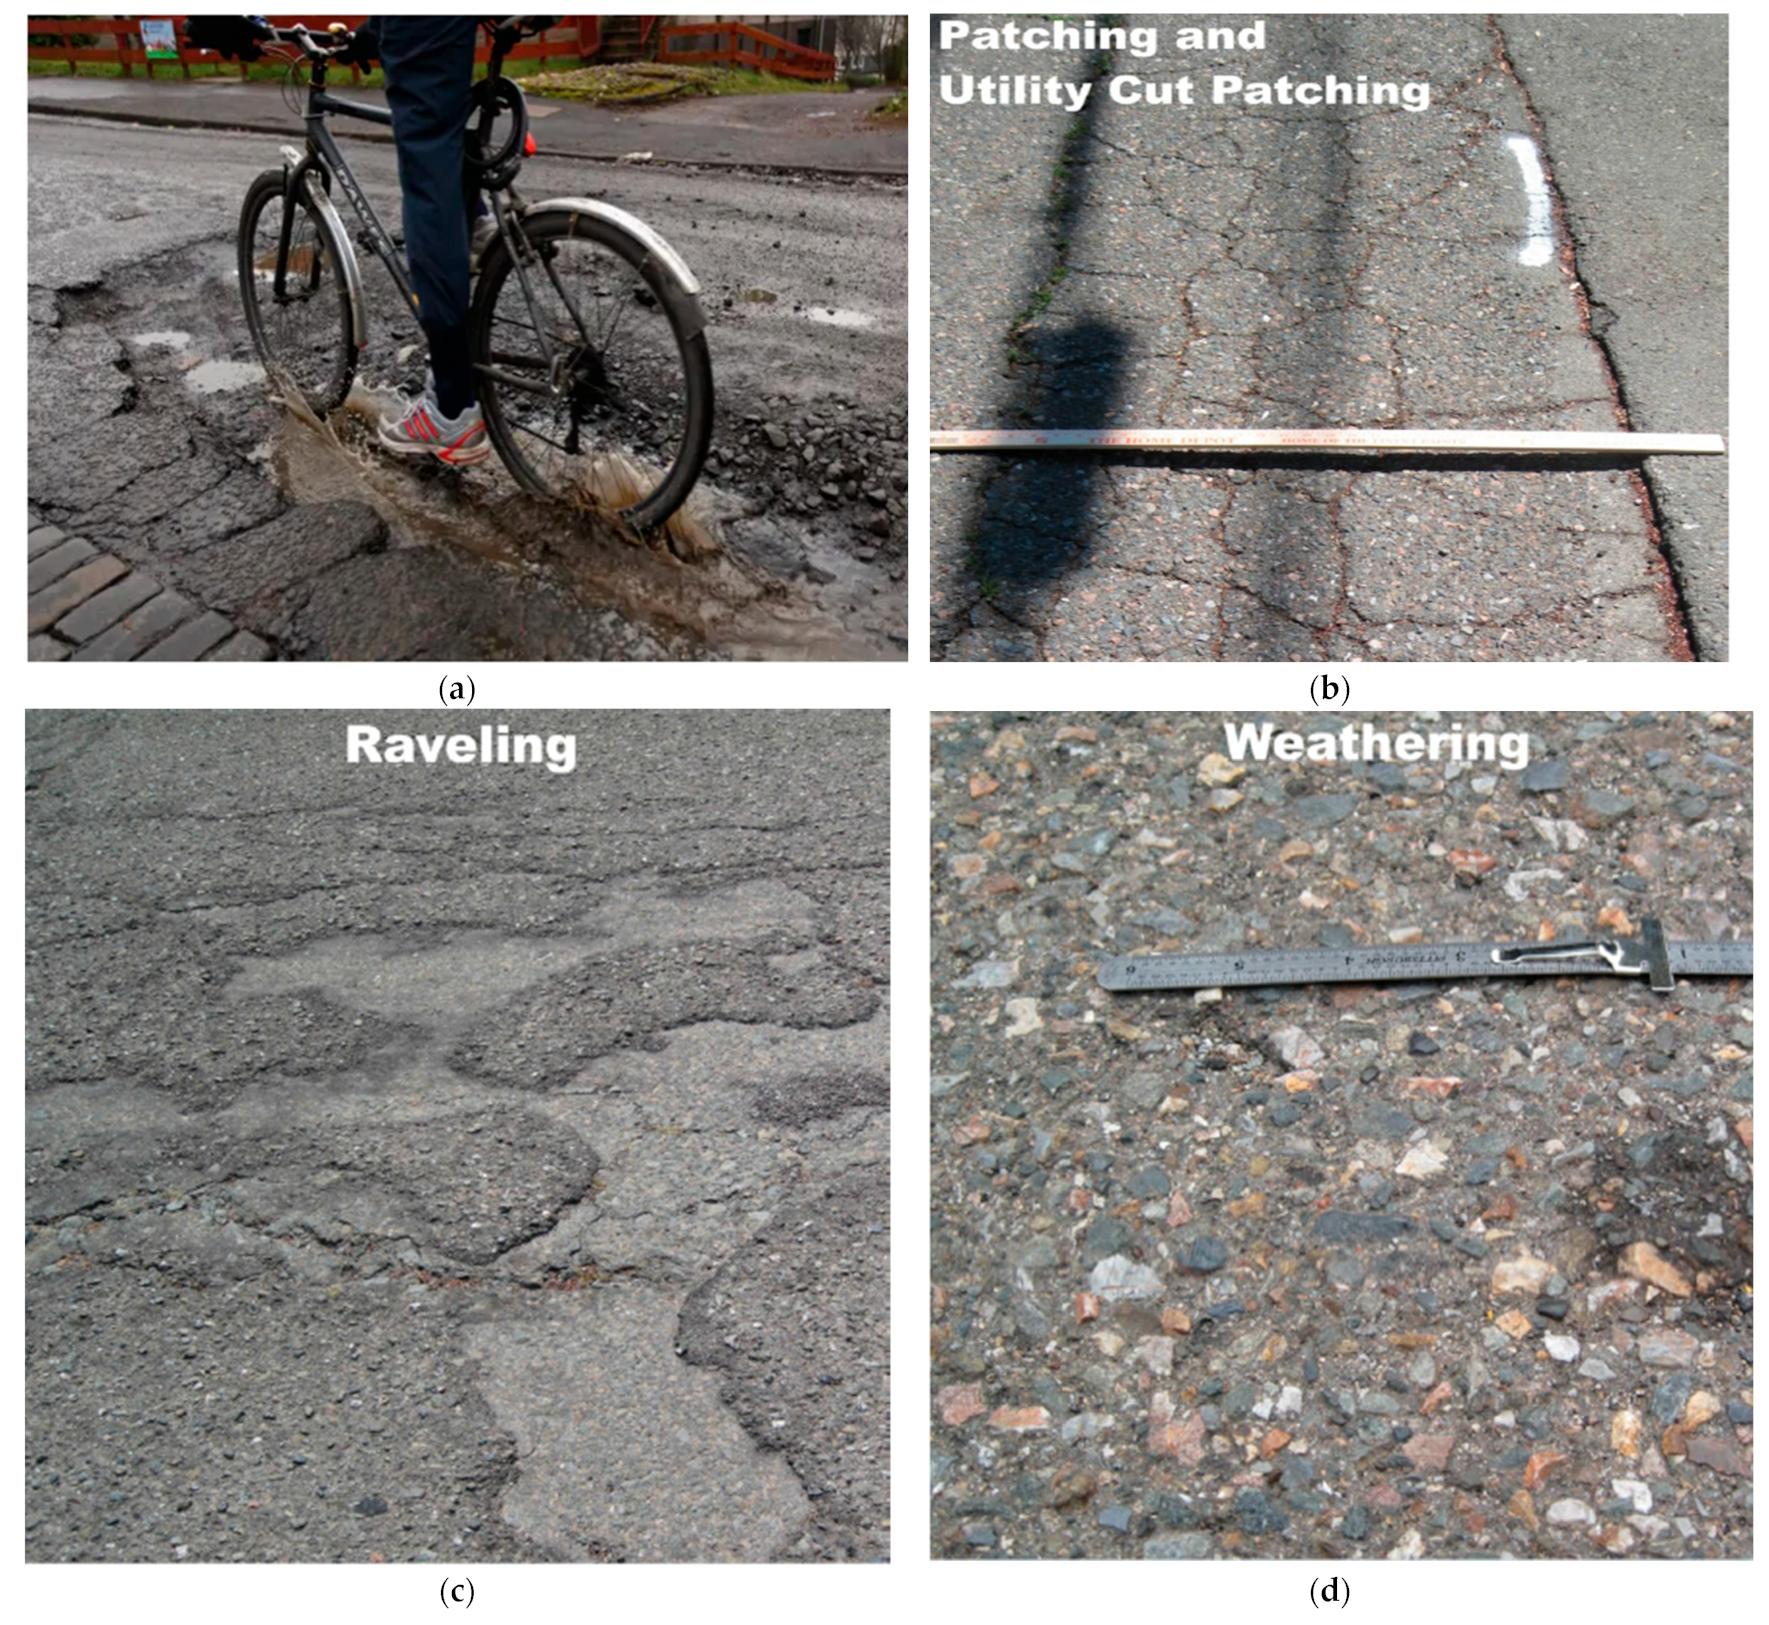
As more bikeways are built on roads, the timely application of maintenance treatments becomes critical to ensure safe and comfortable conditions. Longitudinal and transverse cracks that progress to potholes, and rough utility cut patching are flexible pavement distresses that represent a safety threat to bicyclists as shown in
Figure 1a,b. Raveling and weathering also expose bicyclists to a very rough, uneven surface due the loss of aggregates as shown in
Figure 1c,d. Rigid pavement distresses such as faulting (different elevation across a joint) and spalling (break down of the slab corner edges) are also a safety hazard to bicyclists as shown in
Figure 2a,b.
Large U.S. cities have adopted complete streets policies that require all new constructions to provide “safe access for pedestrians, bicyclists, children, the elderly, people with mobility challenges, transit users, and motorists” [
5]. Current policies on the selection of maintenance treatments for pavements may not fulfill the specific needs of bikeways, leading to unsafe conditions, ineffective funding allocation, and risk of liability costs in case of an accident due to unacceptable on-road bikeway riding conditions. Another problem is the inspection and maintenance costs of bikeways which are usually very high and subordinated to streets [
6].
This paper describes how to integrate bikeway maintenance policies into pavement management practices to address maintenance needs considering the bicyclists’ higher sensitivity to distresses and pavement surface riding conditions. The ultimate goal is to contribute to the implementation of an integrated planning approach supported by enhanced pavement management systems able to assist transportation agencies, metropolitan planning organizations, and cities in the development of maintenance and rehabilitation program that benefits all road users.
2. Literature Review
2.1. Overview of Bikeway Planning Policies
On-road bikeways are built to address the need for alternative urban transportation modes and to promote healthier lifestyles in local communities. AASHTO Guide for the Development of Bicycle Facilities defines the following existing types of on-road bikeway facilities [
1]:
Bicycle boulevard: “a street segment, or series of contiguous street segments, that has been modified to accommodate through bicycle traffic and minimize through motor traffic.”
Bicycle lane: “a proportion of roadway that has been designated for preferential or exclusive use by bicyclists by pavement markings and, if used, signs.”
Shared lane: “a lane of a traveled way that is open to both bicycle and motor vehicle travel.”
Paved shoulder: “a portion of roadway contiguous with the traveled way that accommodates stopped vehicles, emergency use, and lateral support of subbase, base, and surface courses.”
As for the bikeway location, users prefer dedicated bikeways that are protected from traffic, and integrated with walking facilities [
7]. However, as the bikeway network is limited, bicyclists are forced to use regular traffic lanes. On low-volume and low-speed streets, bicyclists use the same lane as traffic since there are not dedicated bike lanes. To address this situation, there are cities such as the City of Charlotte in North Carolina that includes bike lanes as part of all projects for streets [
8]. This raises a question about the minimum desired pavement condition to provide a comfortable and safe ride for cyclists. On major roads, some bicyclists tend to ride on a sidewalk where it may be perceived as safer while in reality there are higher collision and fall event rates than non-sidewalk cyclists. [
9].
Riding with caution on a deteriorated surface and paying less attention to the traffic situation is potentially dangerous. The bikeway condition not only affects the ride comfort, but also the safety of the bicyclist. Avoiding a pothole can lead to a collision and poor surface conditions can cause the cyclist to fall. North Carolina DOT has collected bicycle and pedestrian crash data for analysis, and “Bicyclist lost control—surface conditions” was one of the crash types observed [
10]. Even so, the majority of bicycle collisions and falls that do not involve a motor vehicle are not reported to the police and are not recorded in accident databases [
9]. Hospital reports show that 70–90% of bicycle accidents that end in the emergency room are caused by falls, fixed object crashes, and collisions between bicyclists [
11]. Collisions with motor vehicles are in the minority of crashes.
It is important to consider that, unlike motorized vehicle drivers, bicyclists are not subject to age limitations or licensing. Moreover, bicyclists of all ages are more vulnerable to injury in a crash. Doubtless, roads should be safe for all users, and it is vital to maintain on-street bikeways in good condition. Past experience indicates that preventive maintenance is more cost-effective than delaying treatments until pavements deteriorate to a poor condition. That should be true also for bike lanes located on roadways separated from vehicle traffic by pavement markings.
Federal programs that can be used for funding bikeways include Transportation Alternatives Program/Transportation Enhancement Activities (TAP/TE), CMAQ (Congestion Mitigation and Air Quality Improvement Program), HSIP (Highway Safety Improvement Program), STP (Surface Transportation Program), SRTS (Safe Routes to School), FTA (Federal Transit Administration Capital Funds), ATI (Associated Transit Improvement), NHPP (National Highway Performance Program) and FLH (Federal Lands Highway Program). However, these funds are used mostly for construction, and limited funding is dedicated to the preventive maintenance of on-street bikeways.
Accommodating bicyclists into the transportation infrastructure is feasible even for cities with tight budgets. Different policy-making strategies have been adopted to encourage bicycling as an attractive mode of transportation, however, strategic plans and management systems are not connected. Therefore, bike lanes are not incorporated in traditional pavement management systems [
12]. There are some cities that are integrating bike lanes as part of all projects for streets. For example, the City of Charlotte study deployed complete streets principles in new construction that resulted in a minor overall cost increase. It was estimated that construction costs of a bike lane on a complete street are on average
$300,000 (about 5% of the overall project budget) while sidewalk construction costs were
$250,000 (about 3% of the overall project budget). If two traffic lanes were built instead of three lanes, 2% of the costs could be saved and the addition of a bike lane and a sidewalk could yield a 6% overall project budget increase [
8].
2.2. Condition Assessment
Bikeway pavement condition is one of the most influencing variables to determine the level of service and quality of the riding. The Highway Capacity Manual (HCM) 2010 Bicycle Level of Service (BLOS) score is very sensitive to the bikeway pavement condition which can change the score by 5 points on the A–F scale, showing the significance of proper maintenance [
13]. On the other hand, an evaluation conducted on two bicycle facilities in Washington, D.C did not reflect in the user survey responses the high sensitivity of pavement condition in the HCM BLOS model [
14]. Pavement condition considered in BLOS uses a FHWA’s pavement condition rating index called Present Serviceability Rating (PSR). PSR was developed from motorized vehicles perspective with a scale from 5 (new pavement) to 0 (extremely deteriorated or distressed over 75% of the surface) [
15].
Another performance measure used by cities such as Portland in Oregon, Cheyenne in Wyoming, and Albuquerque in New Mexico is the Bikeway Quality Index (BQI) which considers 10 factors including pavement quality (using PSR scale), connectivity, density of both bikeway and road network, topography, permeability, land use, cycling potential, existing bikeway network, and overall existing conditions [
16].
The City of Ann Arbor in Michigan uses a 0–10 scale to assess the pavement quality within a bike lane. Also, a scale of 0–5 is used for condition assessment of striping and symbols [
17]. Other approaches incorporate Level of Service (LoS) performance measures for bicycles to evaluation the existing conditions. The City of Gainesville in Florida developed a LOS rating score system of A through F for corridor evaluations on arterial an collector roadways, and the results were used to prepare a congestion management system plan [
18].
The City of Davis in California used PMS StreetSaver to prioritize maintenance of 50.4 centerline miles of bicycle paths [
19]. The bikeway database is separated from the regular pavement database; however, both use the same performance measure, the Pavement Condition Index (PCI). PCI is an overall condition rating that ranges from 0 to 100 calculated based on the type, extent, and severity of seven distresses. For asphalt pavements, these distresses include alligator cracking, block cracking, distortions, longitudinal and transversal cracking, patch, and utility cut patch, rutting/depression, raveling, and weathering [
3]. For concrete pavements, the inspected distresses are corner break, divided slab, faulting, linear cracking, patching and utility cuts, scaling/map cracking/crazing, and spalling [
20]. A PCI of 100 represents a pavement in very good condition without distresses.
2.3. Bikeway Maintenance Policies
Departments of Transportation (DOTs) have developed maintenance policies for bikeways that consider:
DOTs perform on-road bikeways routine maintenance, including sweeping and fixing potholes as reactive maintenance to a reported problem [
21]. On-road bikeways located in urban areas could receive maintenance with the street pavement section prioritized with the aid of Pavement Management Systems (PMS) [
21,
22]. However, the prioritization in PMS is often based on motorized vehicles criteria without considering the needs of bicyclists who are more sensitive to pavement distresses.
The Chicago Bike Plan places maintenance and repairs as one of the priorities and their specific performance measures include [
23]:
The University of Illinois at Urbana-Champaign developed a Bike Path Management System for its campus bike paths [
24]. Surface defects include raveling, spalling/scaling, ponding, potholes, settlement, and cracking. Also, the condition of markings, geometrics, large vertical displacements, and transition were assessed in the visual condition rating. Rideability is assessed by riding the bike path using a low, medium, and high severity rating scale. Low severity indicates no repairs needed or a satisfactory state, medium severity indicates the need for repairs within one year or moderate problems with some sign of deterioration, and high severity indicates the need for immediate repairs or significant problems. A worst-first strategy was used to prioritize the pavement sections in unsatisfactory condition.
In response to the tremendous growth of bicycle users, several cities throughout the world have announced plans to expand and modernize their bicycle networks and different Pavement Management Systems have been used to incorporate biking demand into strategic plans for the maintenance and improvement of bicycle networks. For example, GPS trajectories of bicycles monitored by cellphones are used to depict bicycling demand [
12]. Other bicycling facilities, such as bicycle racks and shelters, can also be scheduled using this type of tool.
Public opinion poll responses are used by the City of Naberezhnye Chelny to receive public feedback for improving the safety of bicyclists. For assessing the safety and efficiency of the bicycle network, a decision support system (DSS) was developed with modules that assess the level of integration of the city public transport system and the bicycling infrastructure [
25].
2.4. Integration of Intelligent Transportation Systems (ITS) Technology with PMS
Urban transportation is multi-modal comprising vehicles, pedestrians, and bikes. With modern intelligent transportation technology, integrated pavement management systems can be more efficient in an effort to address multiple road users’ needs. Traffic conditions data and road users’ information regarding the vehicle and bike positions, flow, space occupancy, and congestion can be registered for better management. One of the most important measures that affects the safety of bicyclists is vehicle speed. The existence of traffic congestion, accidents, and events is indicated by abnormalities and rapid changes in traffic speed. The space-temporal fluctuations in traffic speed are commonly used by traffic control and management systems to dynamically adjust traffic signal timing plans, broadcast traffic accidents, and establish management strategies [
26].
Using existing available technology, a large-scale deployment of the ITS is possible. There are ITS infrastructure deployment models for edge-level speed estimation: the COngestion COverage MOdel (COCOMO) and the Edge COverage MOdel (ECOMO). COCOMO’s infrastructure demand is constant, whereas ECOMO’s is dependent on edge congestion profiles. Edge-level speed estimation is possible with the COCOMO and ECOMO with 90 percentile errors of 10% to 22% and 10% to 13%, respectively [
27].
ITS approaches and tools will evolve in the future, although the concepts for the implementation of integrated pavement systems described in this paper should remain. Advanced traffic control systems, such as multi-objective traffic signal control systems, linked automobiles, and autonomous driving, typically employ traffic states from several traffic modes at the same time as significant inputs. Wi-Fi and Bluetooth passive sensing technology are excellent means for gathering traffic speed data. Real-time calculation of multi-modal traffic speed of road networks covered by passive Wi-Fi and Bluetooth sensors is feasible. Probabilistic fuzzy C-means clustering algorithms can be used to correct traffic speed estimates. The implementation of these tools should result in accurate and real-time multi-modal traffic speed information, enhancing traffic control and management [
26].
In a futuristic autonomous driving scenario, it is foreseen that deep learning and multimodal fusion approaches could be used for modeling purposes. The built end-to-end deep neural network takes the visual image and related depth information as input in the early fusion level. Simultaneous outputs with pixel-wise semantic segmentation as scene interpretation and vehicle control commands can be analyzed with deep learning. The end-to-end deep learning-based autonomous driving model has been tested in high-fidelity simulated urban driving scenarios, and the results have been compared to the CoRL2017 and NoCrash benchmarks. Testing reveals that this approach outperforms the competition in terms of performance and generalization, with a 100% success rate in static navigation tasks in both training and unobserved settings, as well as higher success rates in other tasks. The synergy of multimodal sensor fusion with deep learning applied to different traffic scenarios should improve the performance models [
28].
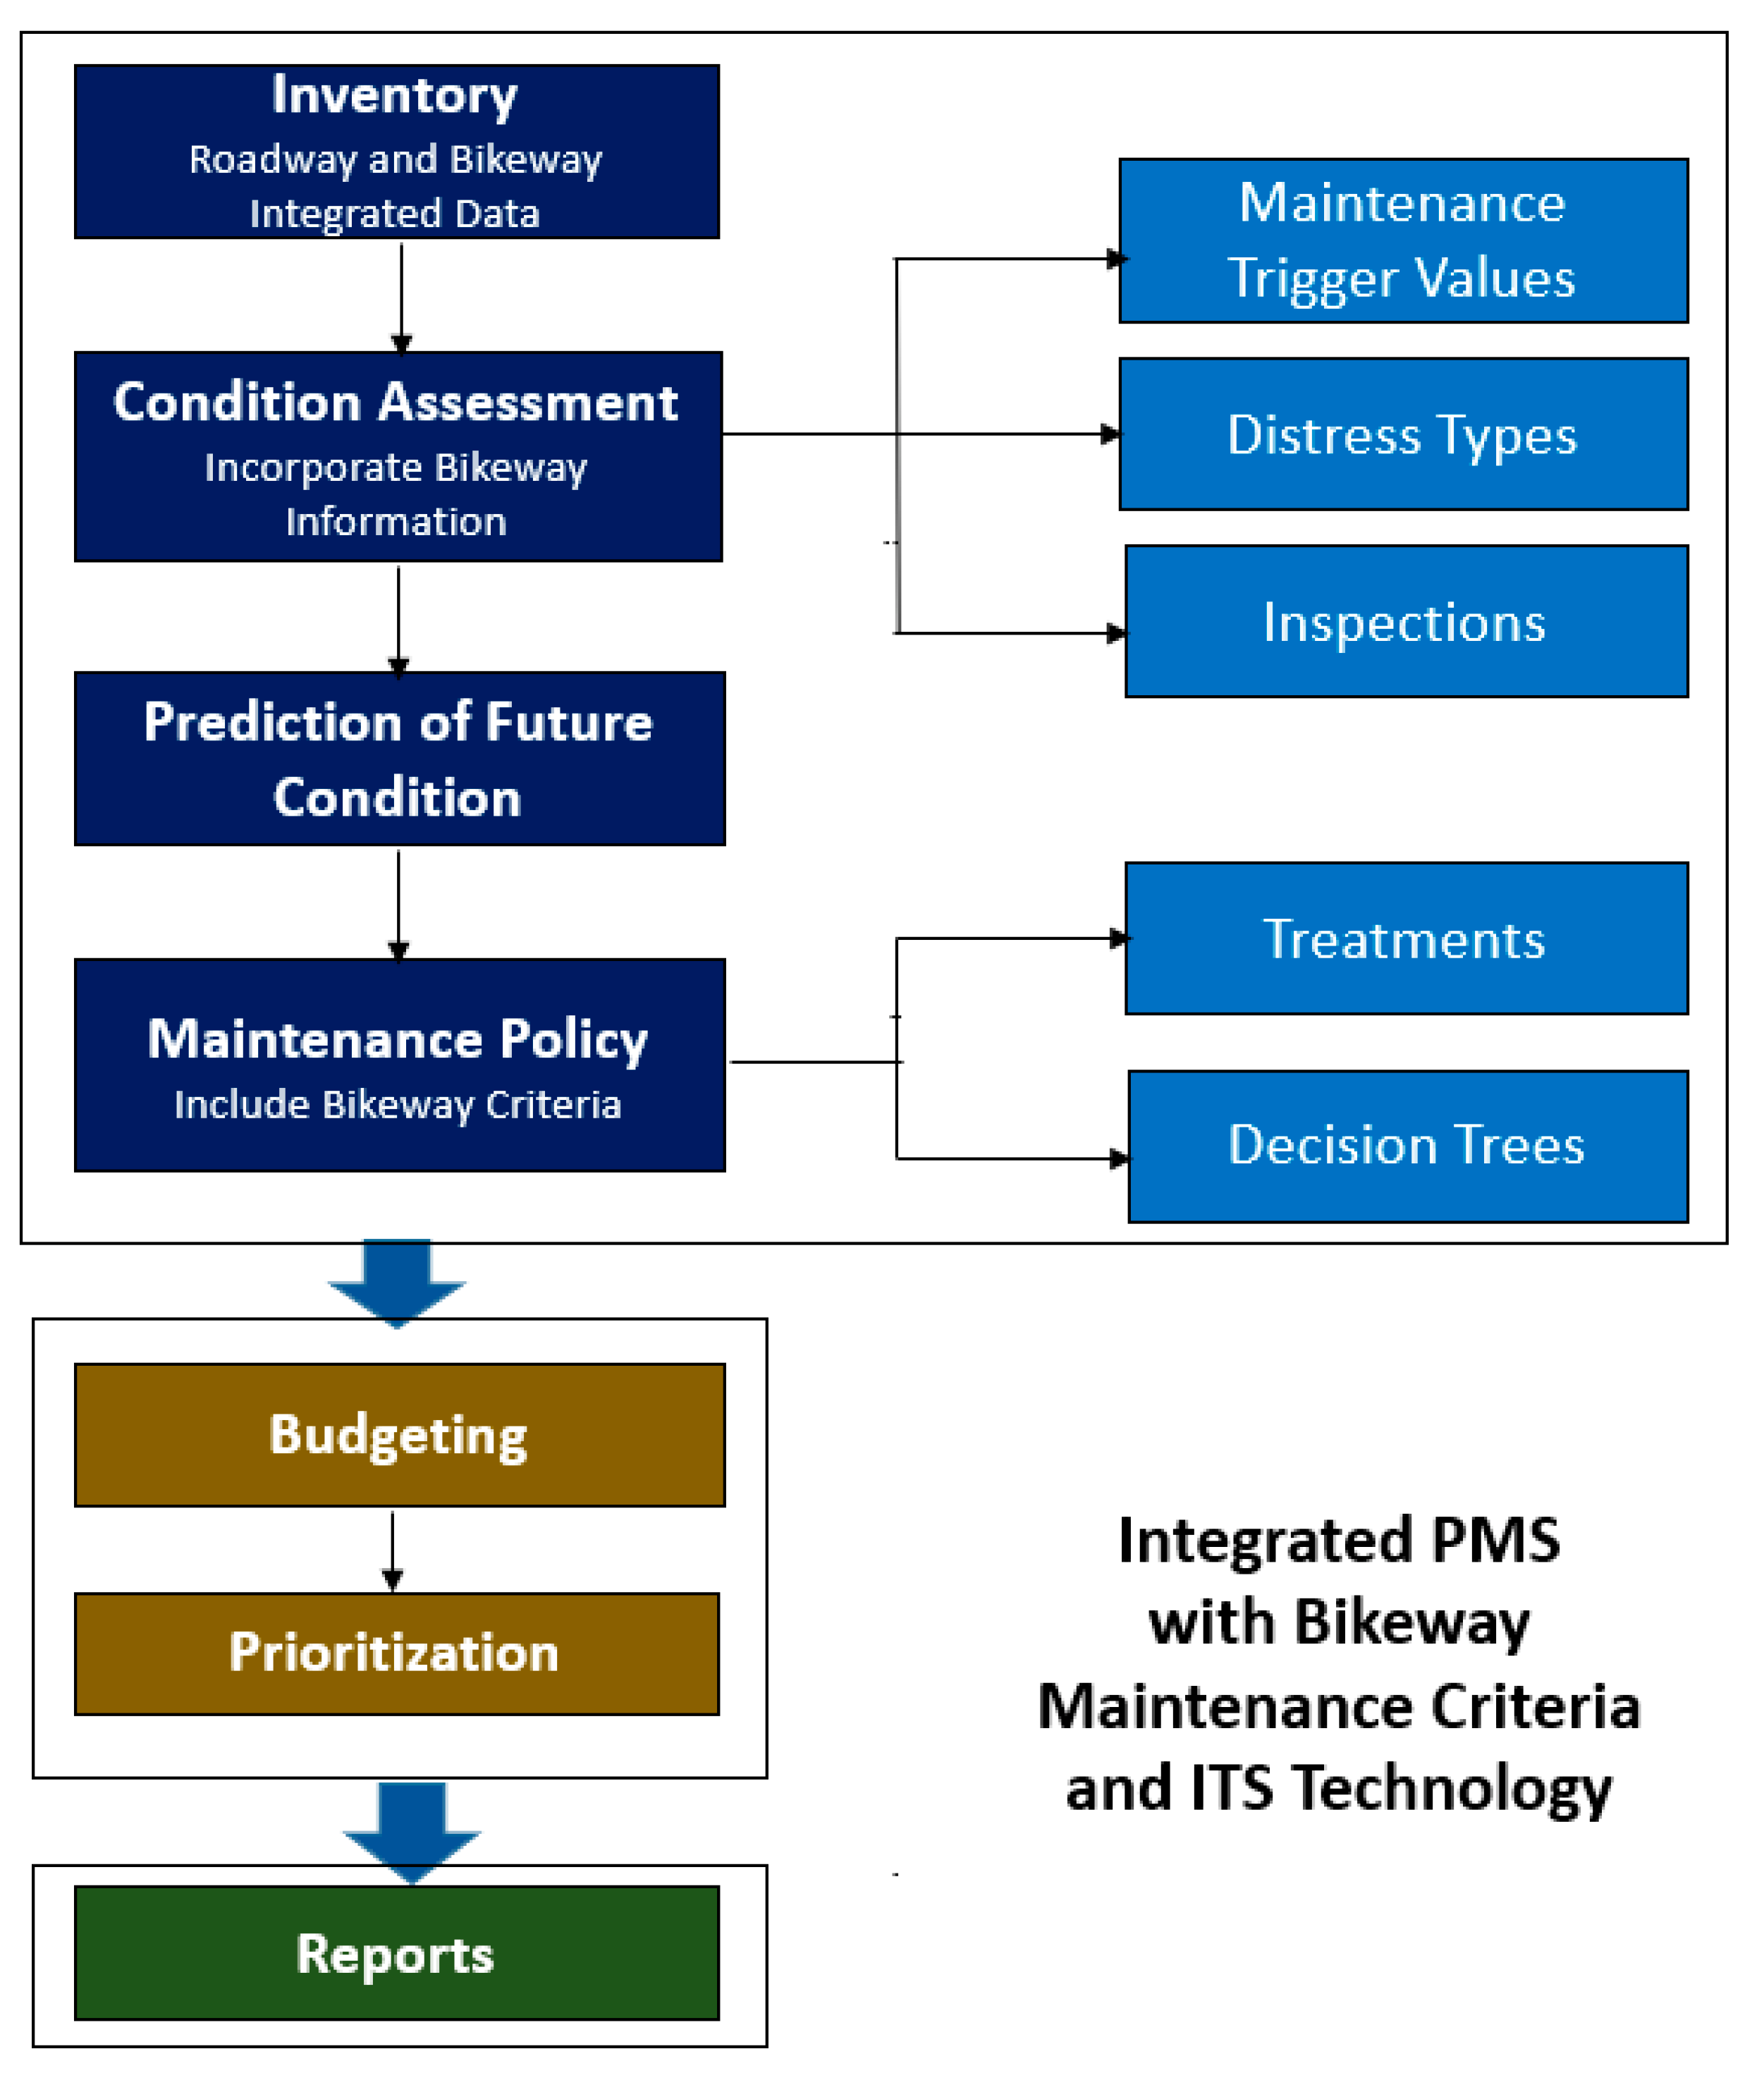
3. Methodology to Integrate Bikeway Criteria into Pavement Management
This paper describes an integrated planning approach to manage on-street bikeways as part of an overall pavement management program with the aid of a PMS. PMS includes an inventory of pavement sections and analytical tools to assist in the development of maintenance plans based on the condition assessment and available funding. Traditionally, PMSs do not consider on-road bikeways data and criteria in the inventory, treatment selection criteria, budget needs, prioritization methods, and reports.
Figure 3 shows an overview of an integrated pavement management approach that incorporates bikeway maintenance data and criteria in the inventory, condition assessment, and maintenance policies for treatment selection. The results of the integration of bikeway criteria into PMS should result in enhanced procedures for budgeting and prioritization of funds that will ultimately benefit all road users.
A description of PMS components integrating bikeway maintenance criteria follows with examples in each section to illustrate their application in pavement management practices.
3.1. Inventory
To account for the information needed for the maintenance of on-road bikeways, the data fields shown in
Table 1 should be added to the pavement management database. Some attributes are directly related to the roadway section, such as beginning and end locations. Other attributes useful for on-road bikeway planning and management include width, classification, surface type, condition of bikeway and markings, and complaints history. Accident statistics can also be used to identify sections that have reached an unsatisfactory level of service. Traffic counts for bikes can be used for the prioritization of heavily used bikeways with stricter requirements on condition levels. Bus and other motorized vehicle traffic should be observed to make sure that the proper bikeway type is selected.
3.2. Condition Assessment
3.2.1. Bikeway Distress Types
Distresses used for roadway pavement could also be applied to on-road bikeways. However, cyclists are more sensitive to pavement distresses. Potholes, cracking, and rough utility cuts have a major impact on the comfort and safety of bicyclists. Potholes are usually fixed on a reactive basis. Sections with cracking distresses should receive higher priority in the maintenance plan to improve the competitiveness of the section in the funding allocation process. Utility cuts must be backfilled and fully compacted to be as smooth as new pavements.
3.2.2. Maintenance Trigger Values
The need for a maintenance treatment can be triggered either by individual distresses or an overall condition index. Pavement distress thresholds can incorporate bikeway condition criteria to account for distresses with a major influence on bicyclist comfort and safety, such as longitudinal cracking. For example, crack width and vertical irregularities can be used as trigger values for treatment selection.
Table 2 shows the suggested maximum acceptable cracking width and height of surface irregularity, recommended by the Minnesota Department of Transportation (MnDOT), based on their orientation with respect to bike traffic demand [
29].
An overall condition index, such as the Pavement Condition Index (PCI) can be used to trigger maintenance. PCI is proposed in the integrated approach described in this paper because it is a condition index already adopted by local transportation agencies for pavements. Therefore, PCI can be readily used for rating bikeway conditions with some accommodations. For example, on-road bikeways can have a higher standard and, therefore, a higher PCI range to define very good and good conditions. Further research is needed regarding what riding surface conditions should be considered acceptable for bikeways. Also, distress deductions in PCI should be calibrated for the safety and comfort needs of bicyclists. Riding speed is another important factor, as vibration is negatively correlated with speed as found by the California Department of Transportation in research conducted to study the relationship between pavement macrotexture, bicycle vibration, and bicyclist ride quality [
30].
3.2.3. Inspections
Pavement sections with on-road bikeways should be inspected more often due to safety concerns. Bicyclists can report issues in an online system (e.g.,
seeclickfix.com accessed on 13 April 2022) or a mobile app with the option to upload a picture of the problem. Then, an inspector can visit the site based on those reports. Regular bikeway inspections can register the distress types, severity, and quantity.
3.3. Prediction of Future Condition
Pavement deterioration curves are defined by ASTM D6433 and other specifications adopted by agencies for pavement sections with motorized traffic. These pavement deterioration curves can be temporarily used for on-road bikeways. However, the deterioration of on-road bikeways carrying lighter loading of traffic mostly consisting of bicycles should be different, and it may require developing their own set of deterioration curves.
3.4. Maintenance Policy
3.4.1. Treatments
Maintenance treatments compatible with bikeways are summarized in
Table 3. Treatments listed in this table are applied to pavements, but additional considerations should be adopted for bikeways based on their own needs. For example, the timing for treatment applications may be reduced in sections with bikeways when compared to sections without bikeways.
Some pavement treatments, such as a chip seal, are not recommended on bikeways because they could adversely affect the bicyclist’s comfort of ride and safety. Chip seals deteriorate and lose aggregates affecting surface roughness riding conditions. This type of treatment should require more frequent maintenance on those pavement sections with on-road bikeways.
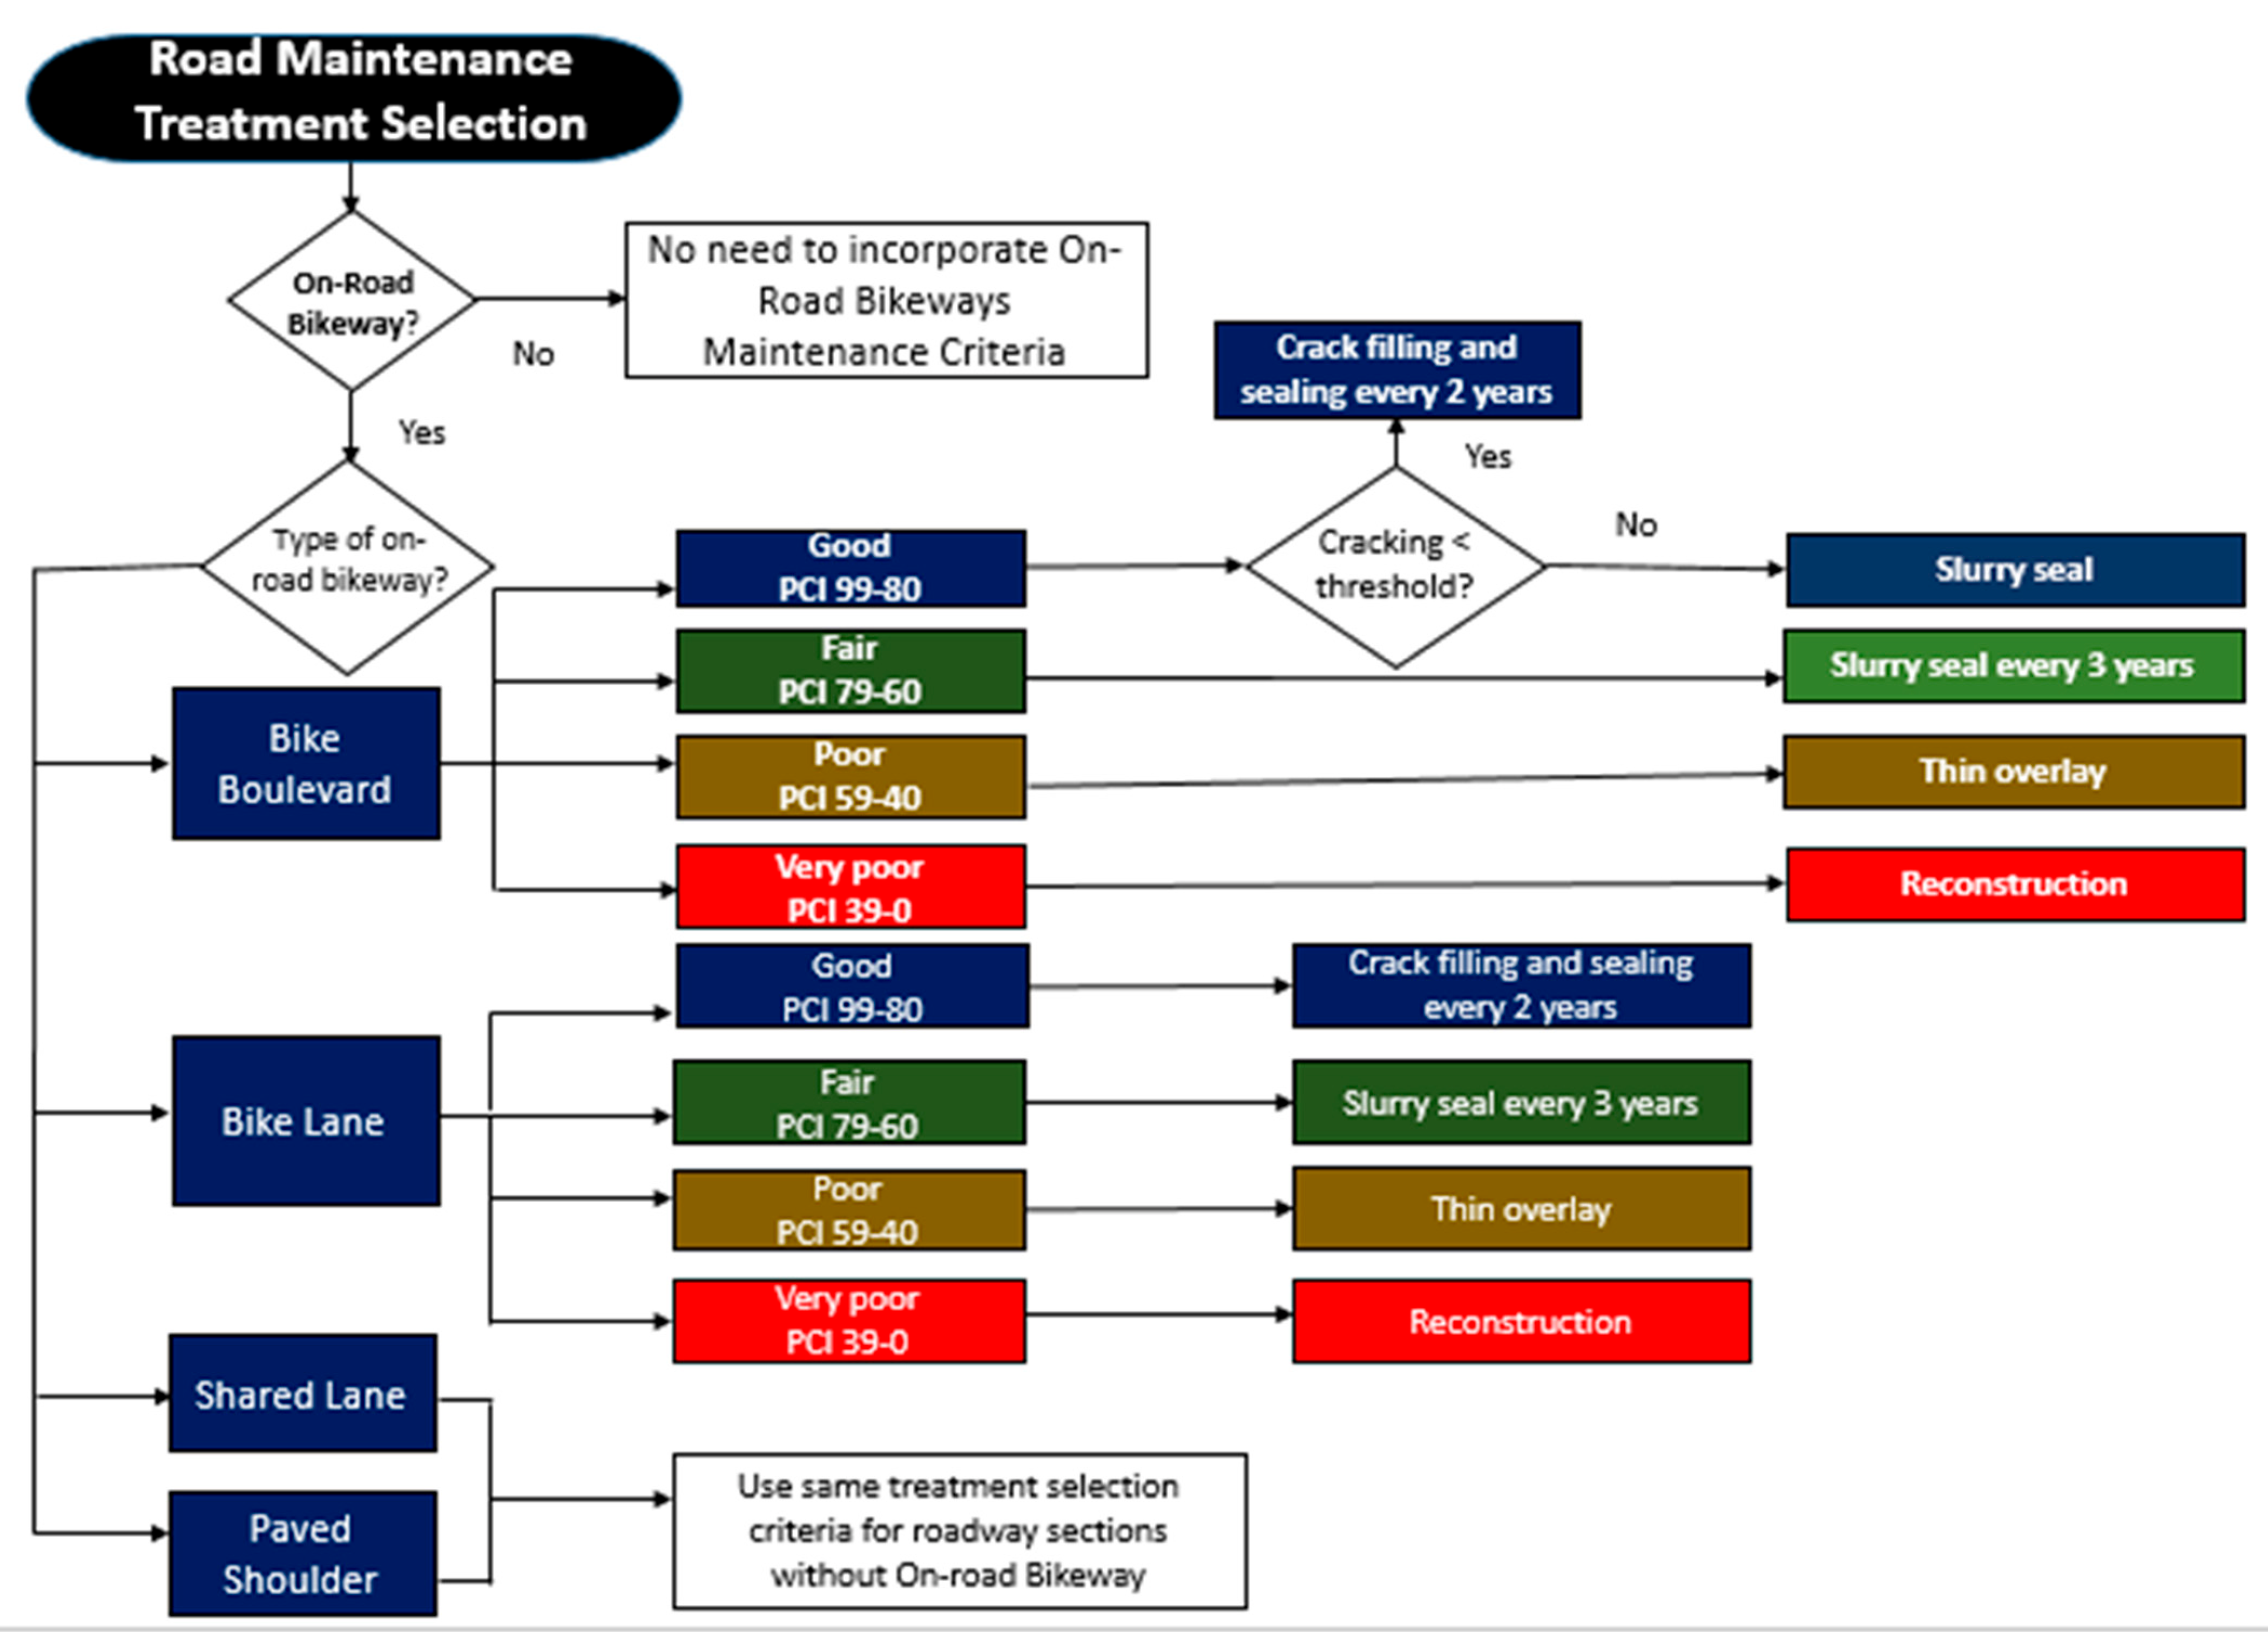
3.4.2. Decision Trees
The timing of a treatment application is usually related to the expected service life of treatment. Maintenance can be triggered either by time intervals between treatments or by reaching certain distress or condition level.
Figure 4 shows an example of a decision tree using PCI and cracking thresholds combined with time intervals for different types of bikeways. The decision tree begins by identifying if the road section includes a bikeway; if not, a traditional decision tree for pavements without bikeways applies. If a road section includes a bikeway, then a maintenance treatment is recommended according to the type of on-road bikeway and pavement condition.
In this example, the decision tree distinguishes between on-road bikeway types. Bike boulevards and bike lanes have stricter condition intervals, where poor condition begins at PCI 59. The quality of surface is evaluated on bike boulevards by checking the severity of cracking. Shared lanes and paved shoulders are assigned the same maintenance treatments as pavement sections without bikeway lanes.
4. Results of the Application of the Methodology
The results of the application of the methodology to integrate bikeway criteria into pavement management will be reflected in the budget and prioritization process followed by the agency.
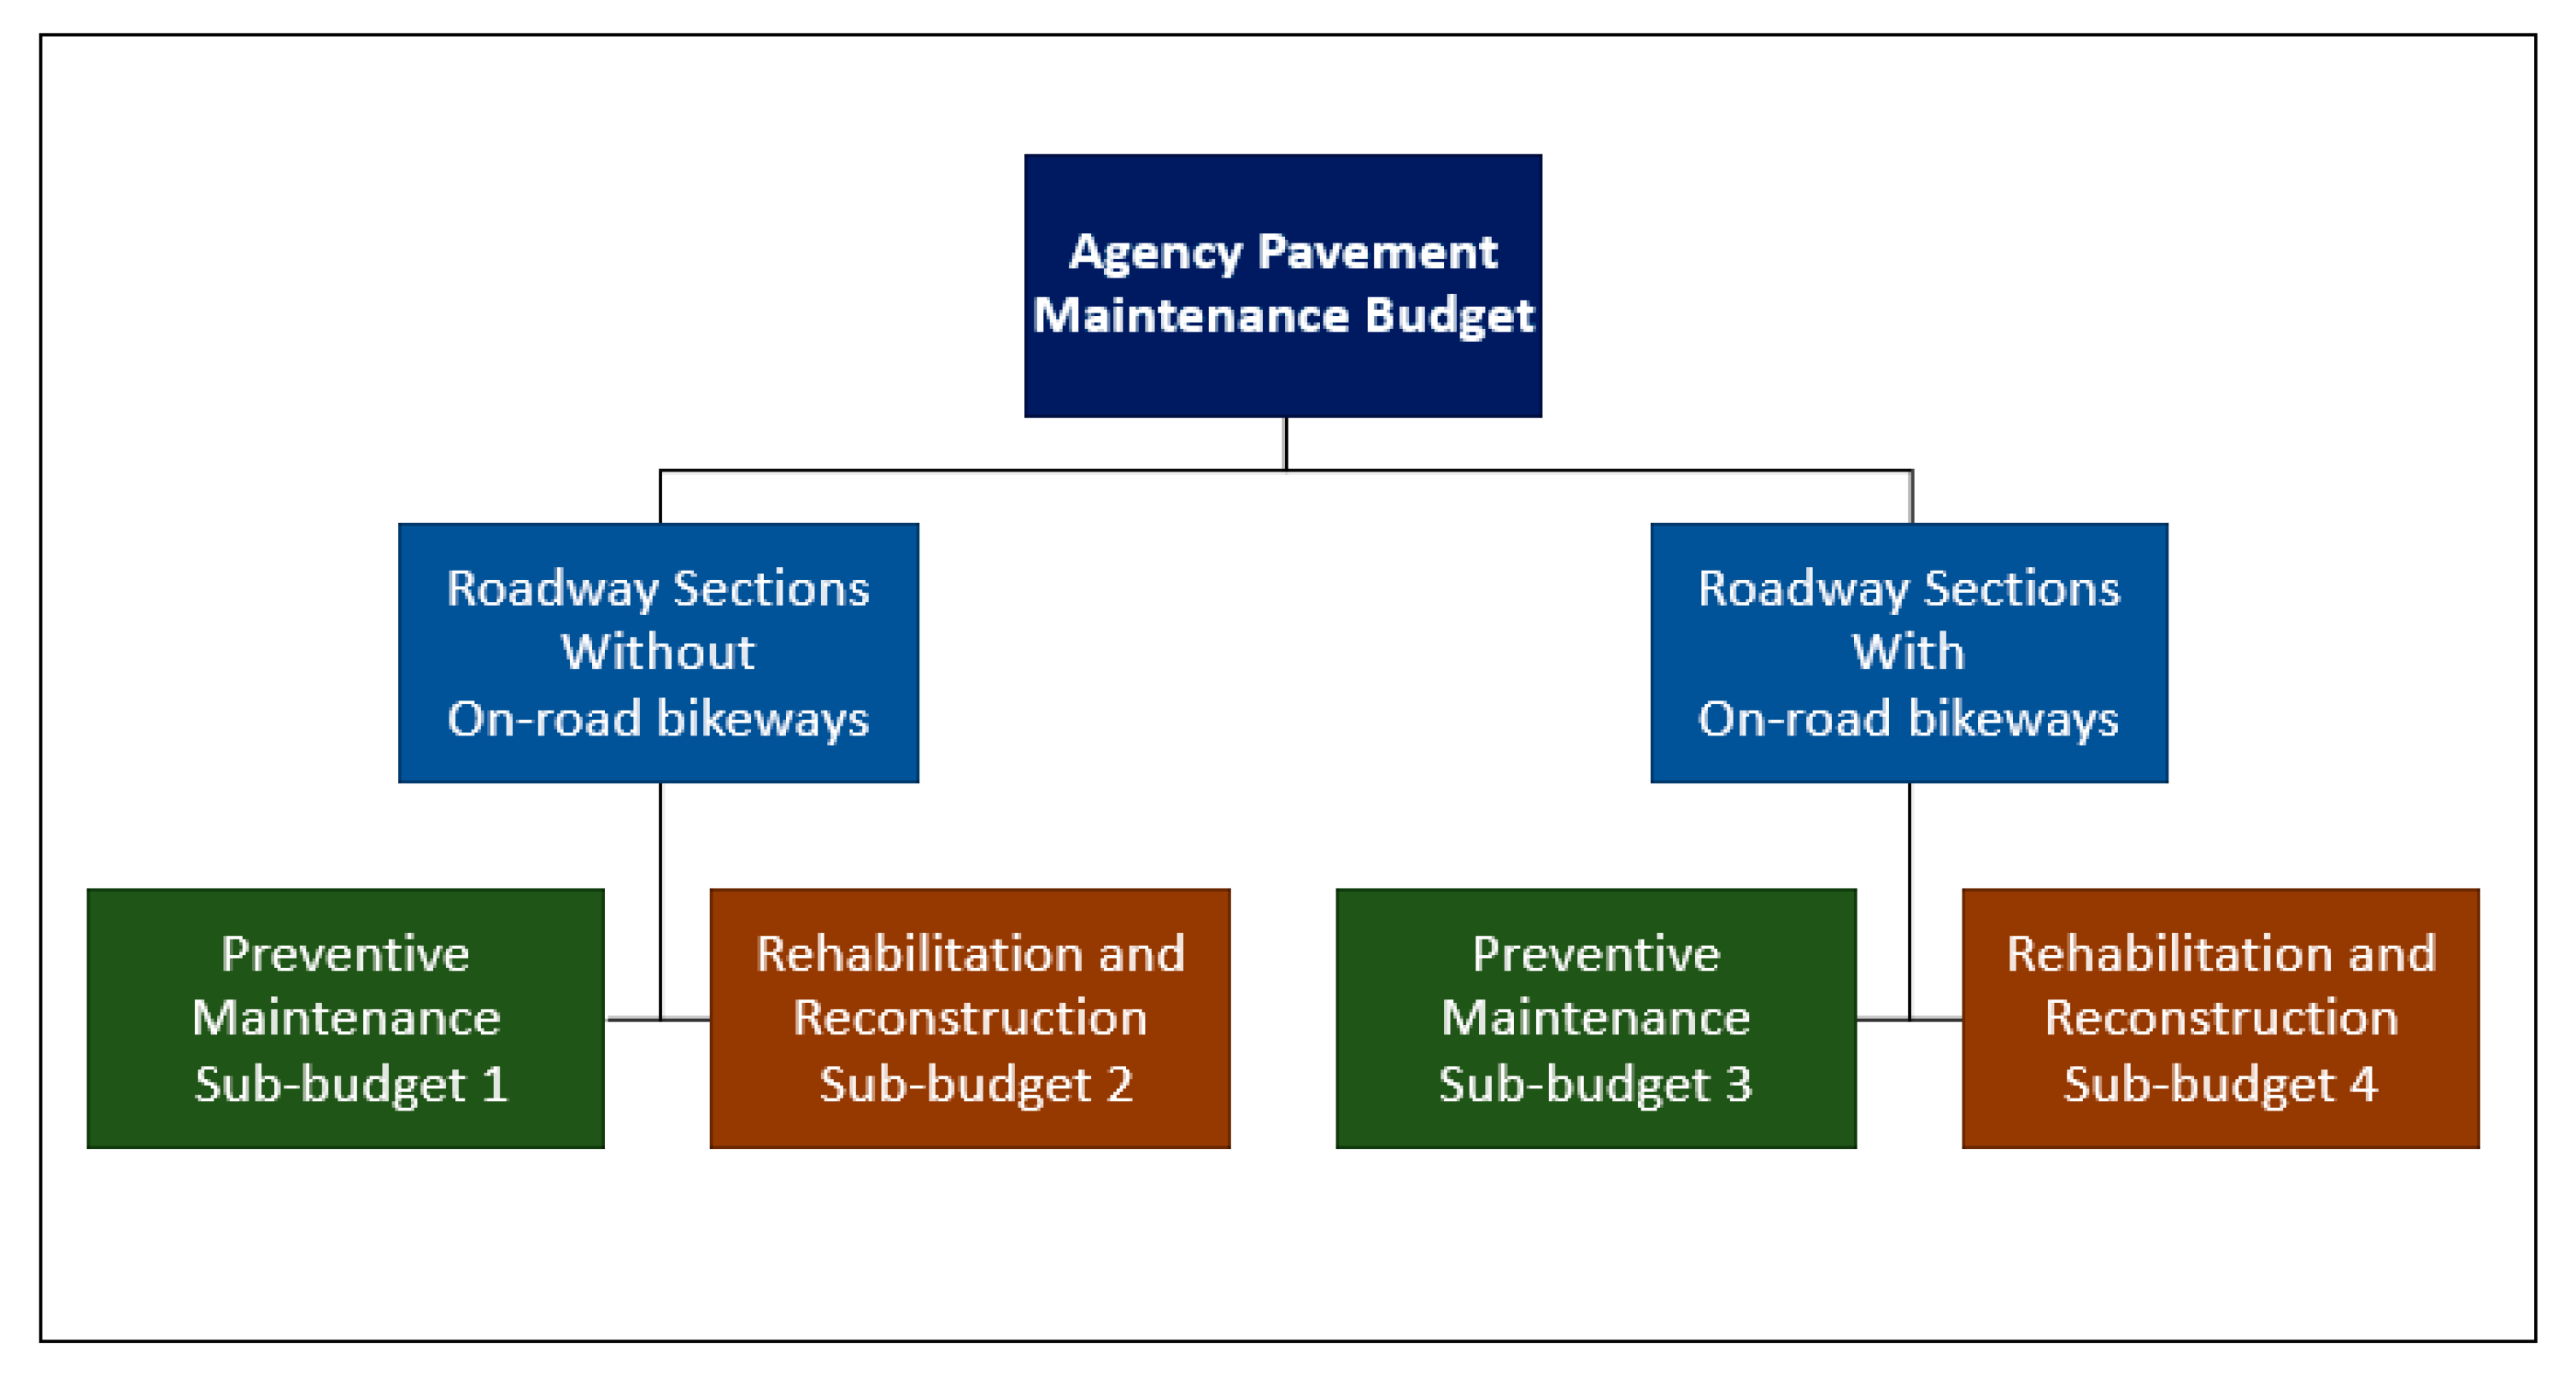
4.1. Budgeting
In PMS, sections in need of maintenance, with and without on-road bikeways, compete for limited funds. The results of the integrated methodology for budget allocation will be budgets for roads with and without on-road bikeways divided into sub-budgets categories for preventive maintenance, rehabilitation, and reconstruction.
Figure 5 shows the sub-budget categories, in which maintenance projects compete for funding. It illustrates that bikeway maintenance programs should preferably have their own budget.
4.2. Prioritization
When funds are limited, maintenance on bikeway lane sections is prioritized based on transportation efficiency, regional significance, and safety. Bikeways with higher traffic counts of bicyclists usually receive a higher priority. Pavement sections with bike boulevards can also be ranked higher in the project selection process.
Table 4 shows an example of weights and score calculations for setting maintenance priorities. Relative weights and ranges for the numerical values should be aligned with agency policies that are updated based on expert judgment and results from past experiences. In this example, a section with a bike boulevard, with medium bike traffic, normal transportation efficiency, normal regional significance, and in need of major safety improvement would score 0.91 point out of 1 and ranked higher than other candidate sections competing for funding.
Maintenance scenarios for sections with on-road bikeways can also be run considering a minimum acceptable condition as a target. Based on lessons learned with road pavements, a “worst first” maintenance approach to prioritize sections leads to higher backlog costs. Therefore, preserving on-road bikeway networks in good condition avoids higher future costs due to major interventions required to recover later from a deteriorated condition to the desired level of service.
5. Reports
Pavement management reports can be enhanced with information relevant to on-road bikeways. Reports can include the condition of on-road bikeway pavement, pavement markings, and signs. Accident rates can also be reported with the condition.
Table 5 shows an example of a condition report for on-road bikeways. For conditions, an up arrow shows an improvement trend, a down arrow indicates deterioration, and a dash shows no change compared to the previous year. For accident rates, an up arrow shows an increase in accidents, and a down arrow indicates a decrease. A full dot indicates that the set goal is not met. A white dot signifies that the accident rate meets the set goal.
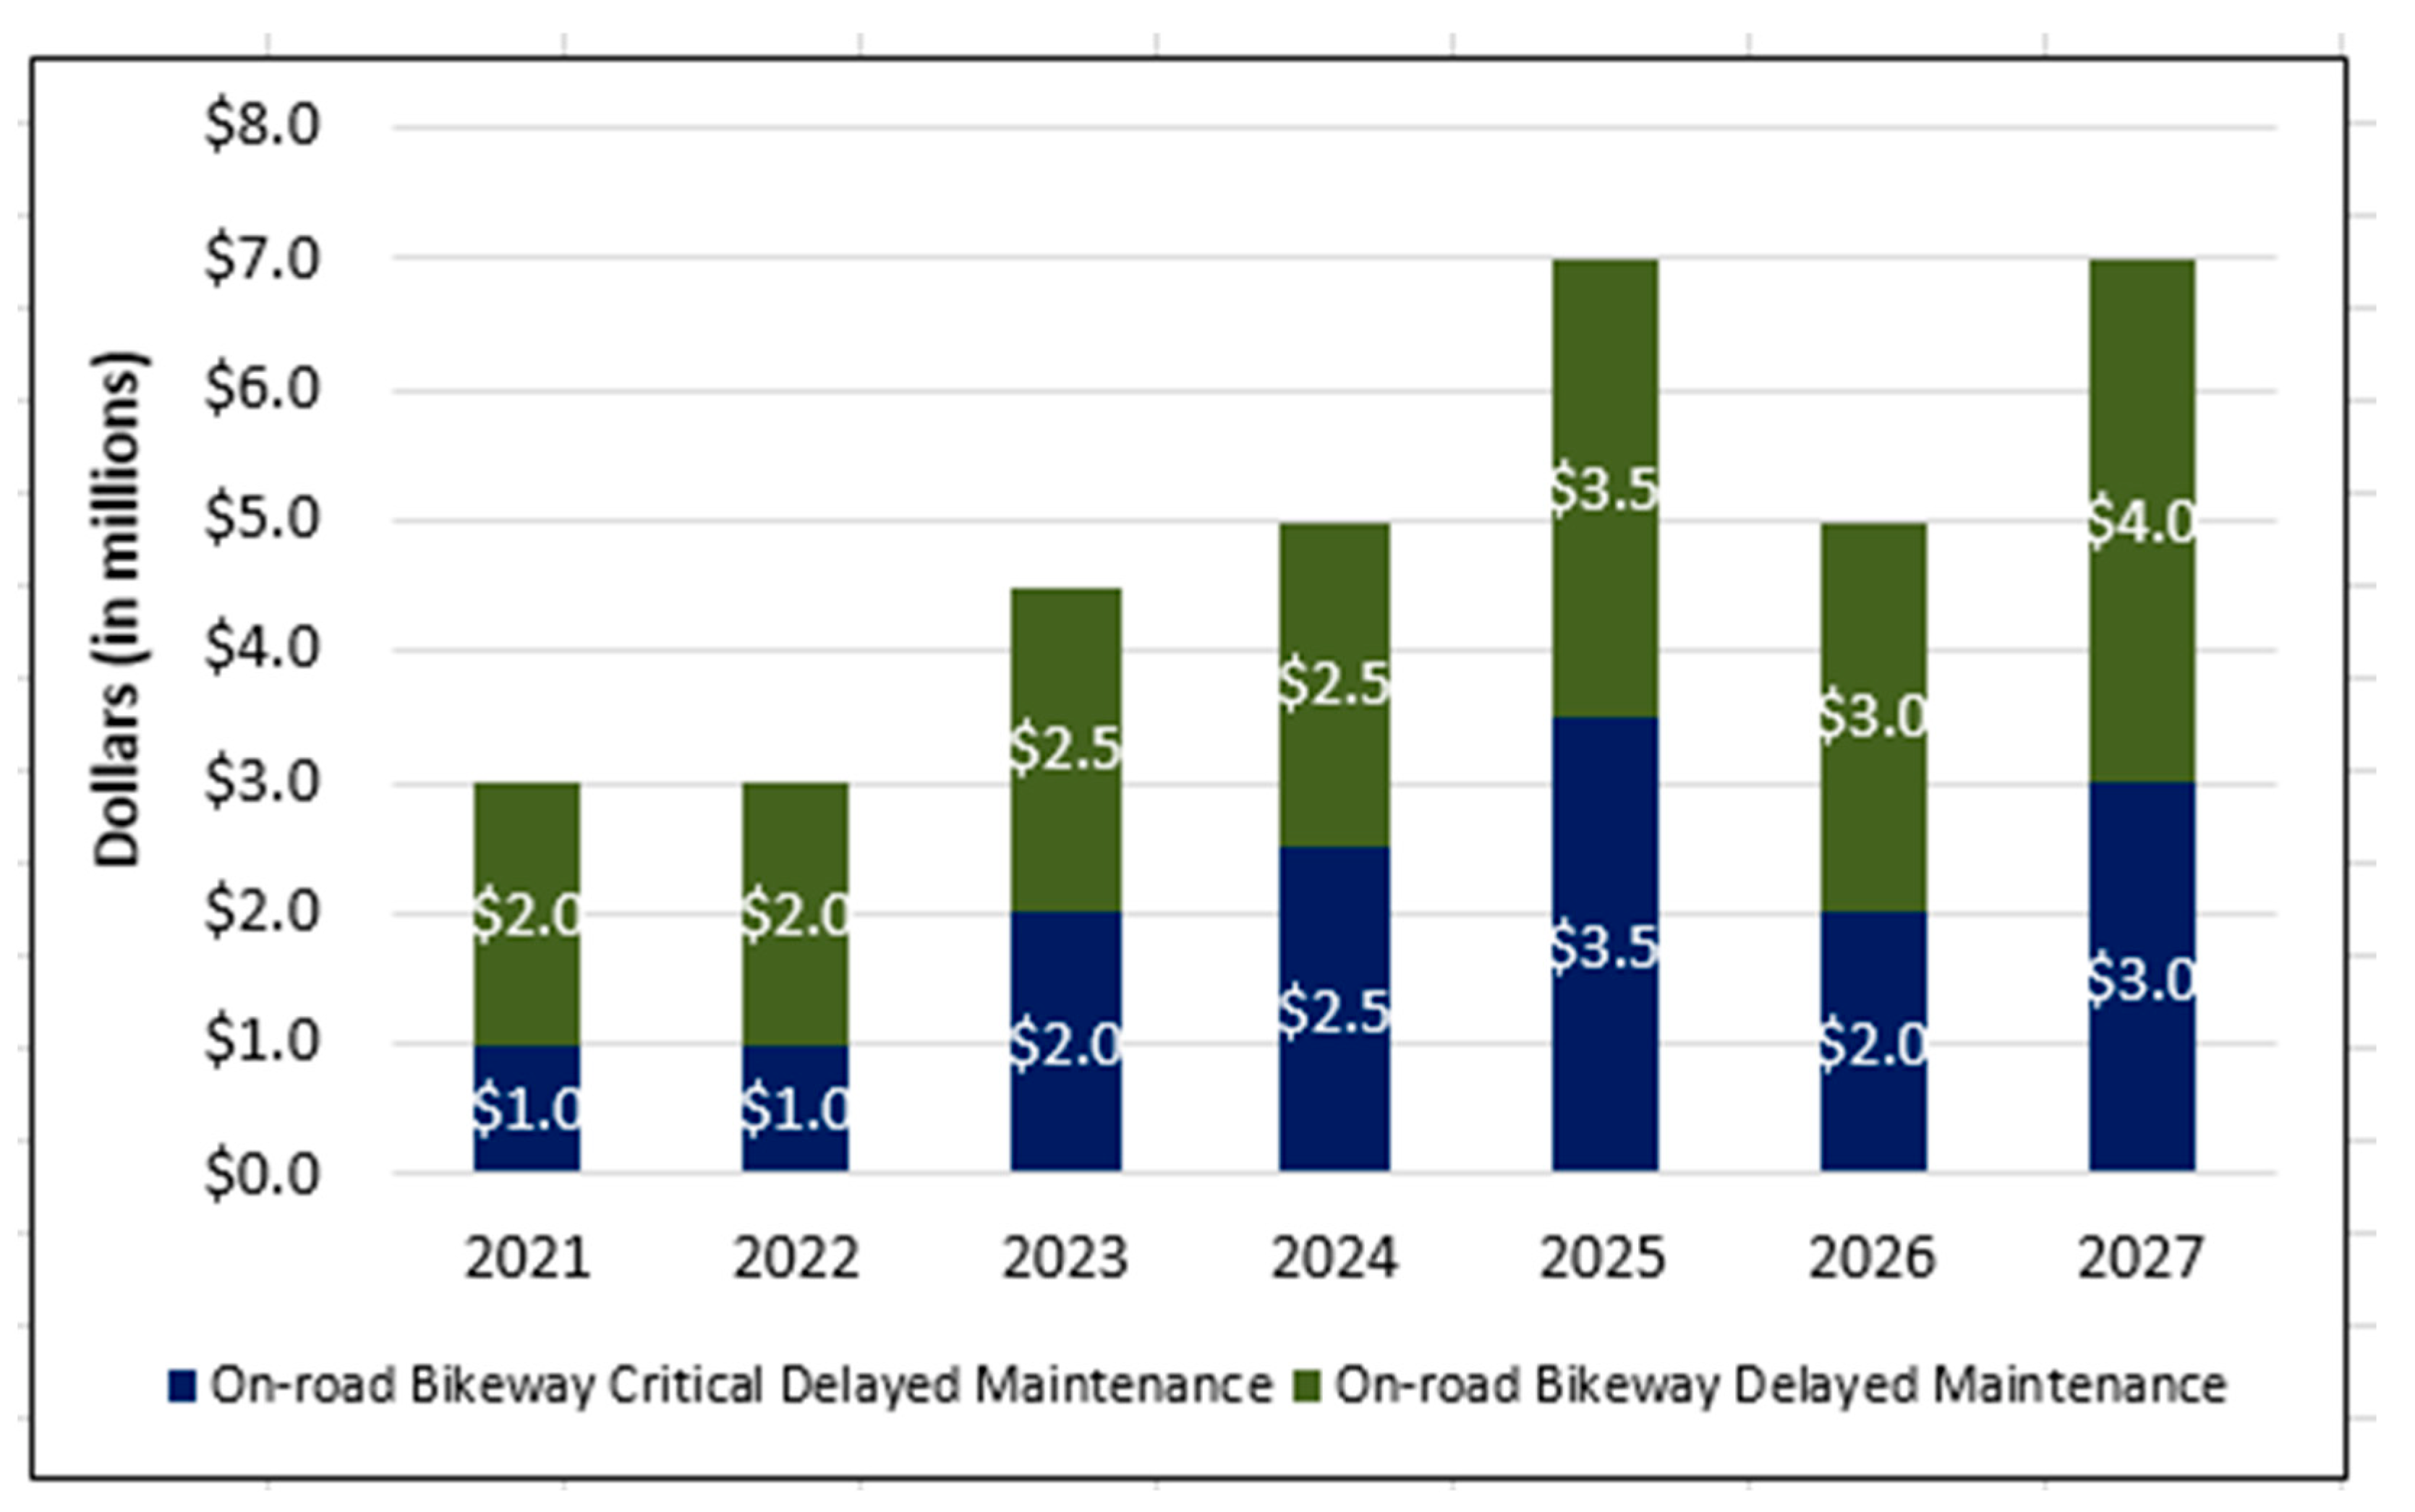
Critical delayed bikeway maintenance should be clearly identified in the reports, as deferred maintenance will cause safety hazards to bicyclists.
Figure 6 shows an example to differentiate critical delayed maintenance funds required for pavement sections with on-road bikeways and those sections without. A
$1 million delayed maintenance on-road budget for bikeways categorized as critical in 2021 increased to
$3 million in 2027. The total amount of delayed maintenance increases from
$3 million to
$7 million in the same period. Critical maintenance should not be delayed because on-road bikeways in critical conditions increase future budget needs and compromise road users’ safety.
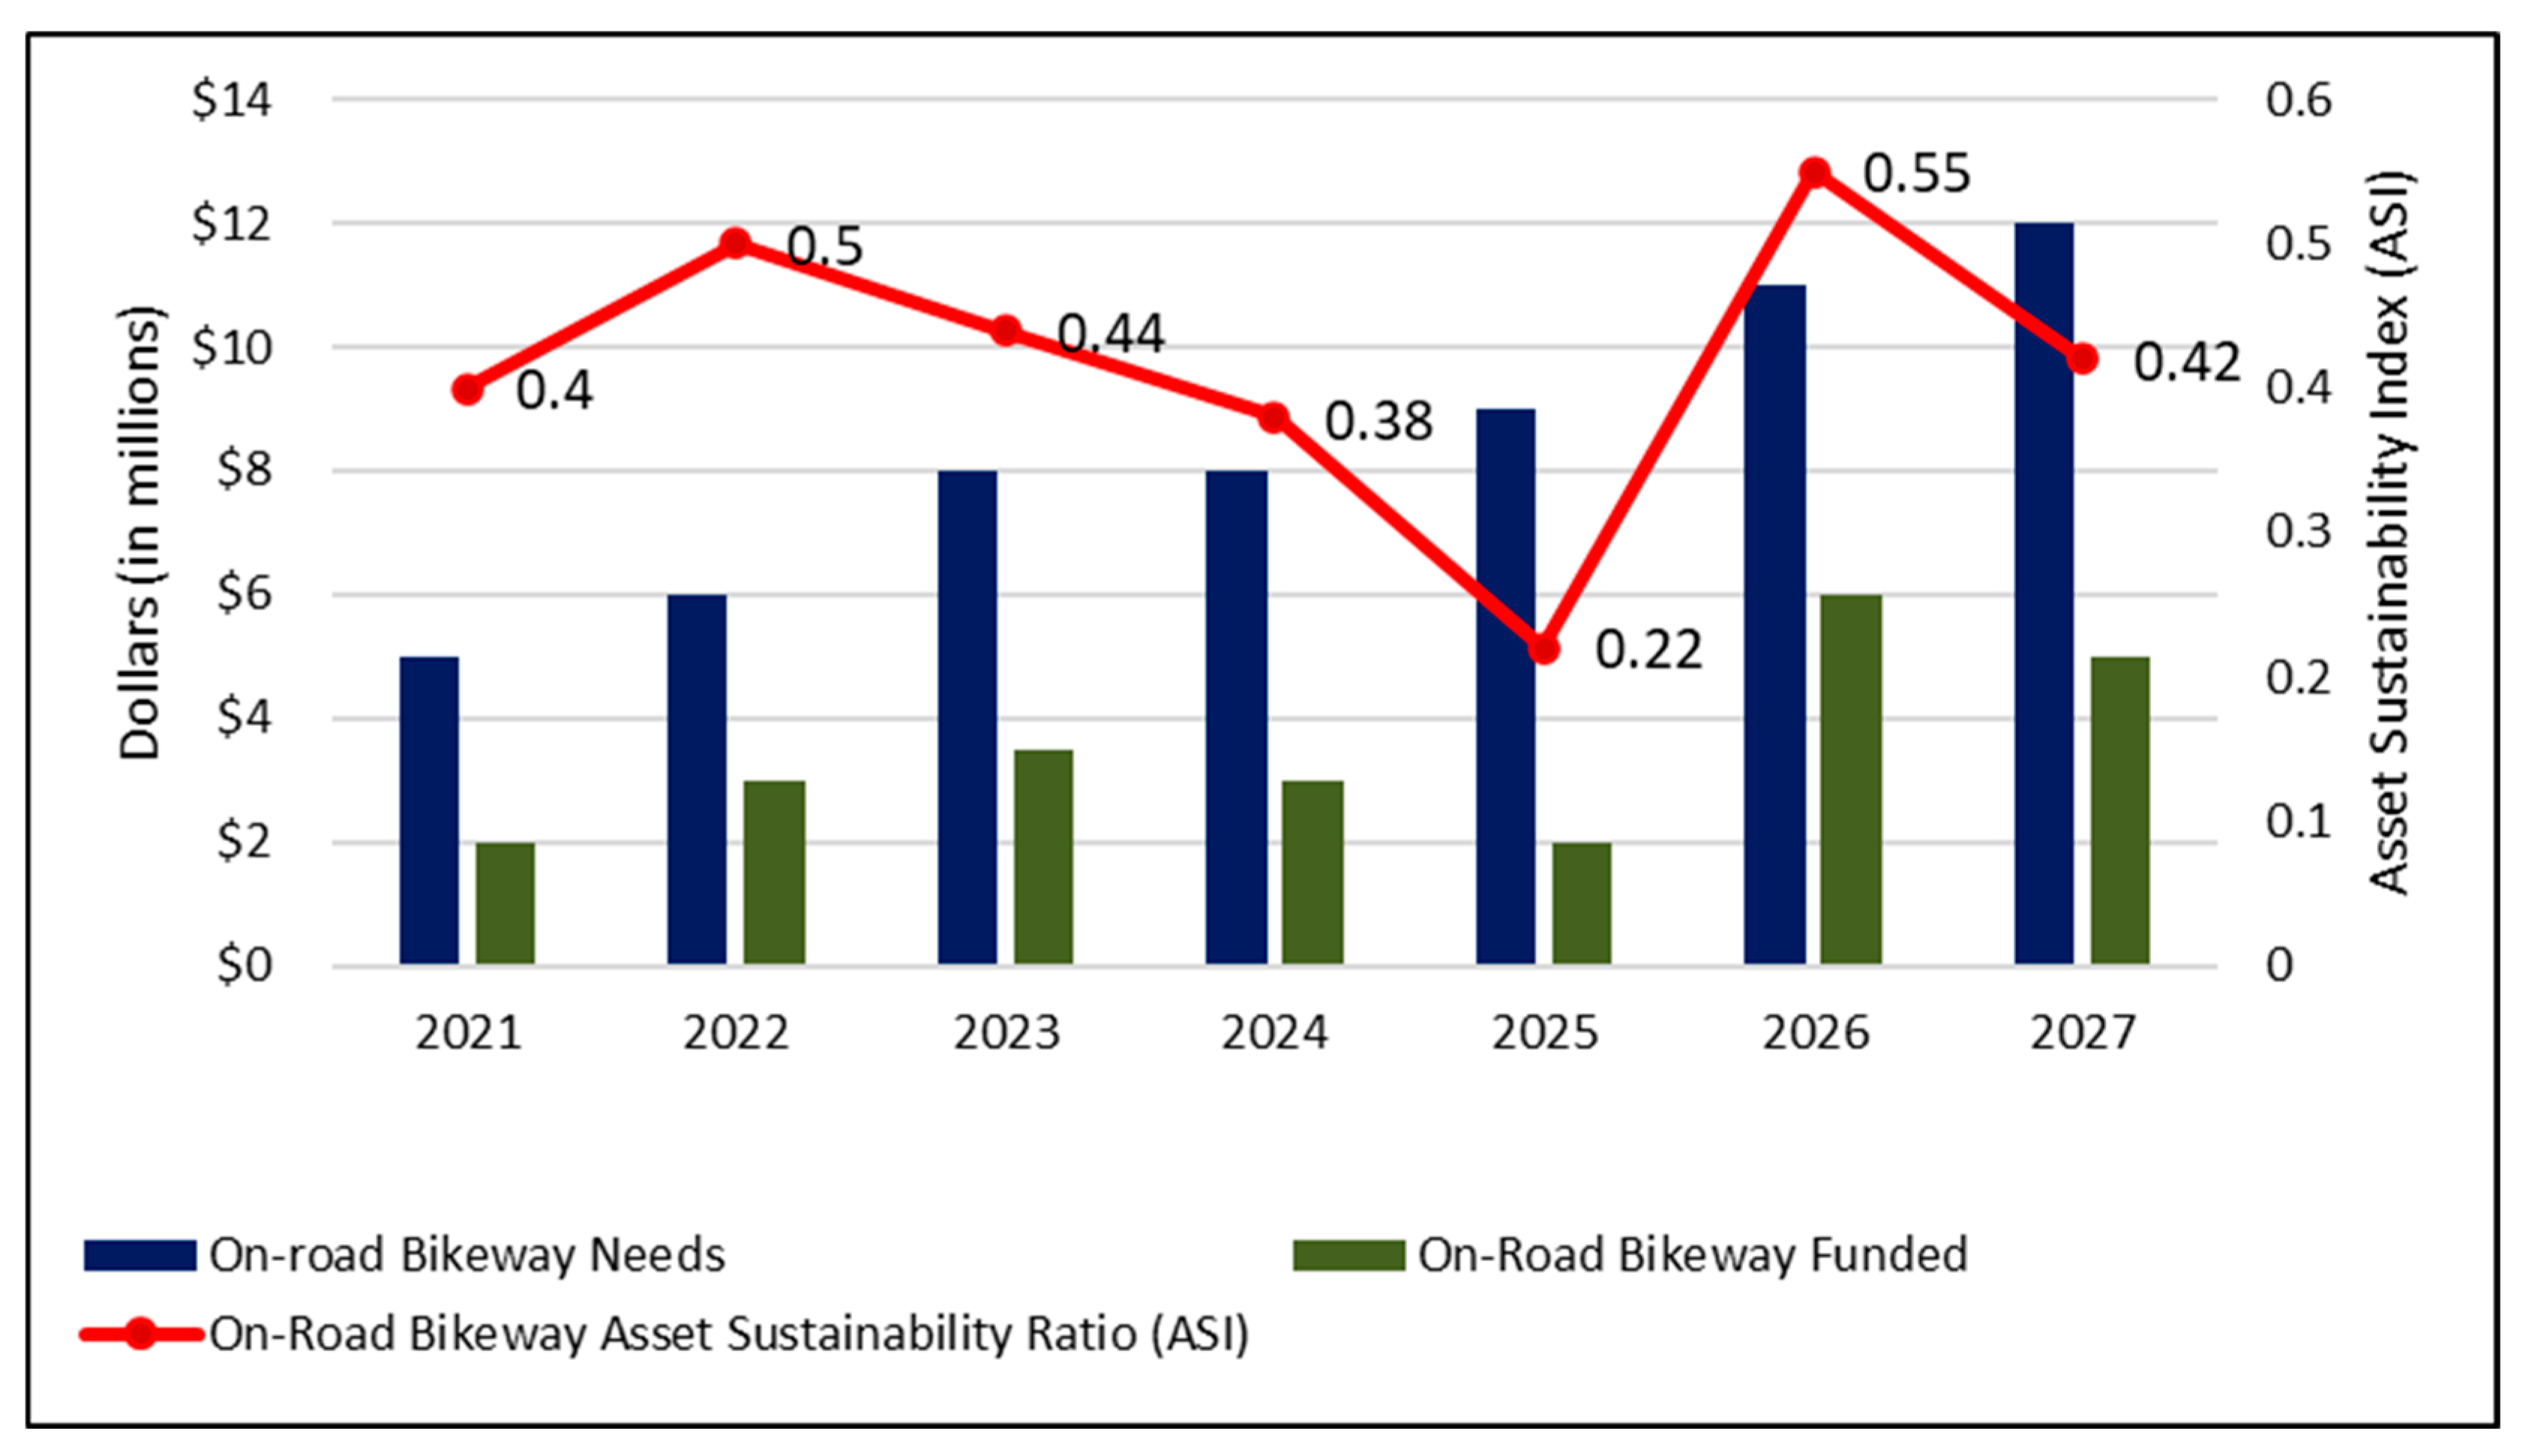
The Asset Sustainability Index (ASI) can be adopted as an index to analyze funding allocation trends. ASI is a ratio of allocated funds and budget needs. The optimum ASI is 1 which expresses that all budget needs are met. A lower ASI indicates underfunding of the on-road bike network that will result in higher budget needs in the future.
Figure 7 shows an example of an ASI trend over a planning period of 7 years. The ASI is below 1, therefore not enough funds to address the budget needs would be allocated to the road network.
6. Conclusions
The main conclusion of this paper is that the increasing number of on-road bikeways in urban environments demands the integration of bikeway maintenance criteria and ITS technology into pavement management practices. While transportation agencies handle pavement maintenance with approaches traditionally focused on motorized vehicles, this study brings attention to the following factors that are unique to bikeways and should be considered in maintenance policies:
Bicyclists’ higher sensitivity to distresses and pavement conditions.
Suitability of pavement treatments for use in bikeways.
Importance of preventive maintenance for bikeways and the consequences of deferral.
It is concluded from this paper that the integration of bikeway maintenance criteria into a PMS should include:
Bikeway inventory data.
Distress types, severity, and quantity.
Maintenance trigger values for bikeways.
More frequent inspection intervals.
Maintenance treatments appropriate for bikeways.
Decision trees incorporating bikeways in the treatment selection criteria.
Budgeting with sub-budgets dedicated to bikeways and preventive maintenance.
Prioritization methods that consider all road users.
Reporting for condition and delayed maintenance.
Further research is also needed in the bicyclist’s perception of distresses, and the impact of severity and quantity on ride comfort and safety.
Further research is needed in the bicyclist’s perception of distresses, and the impact of severity and quantity on ride comfort and safety. Condition performance models used for pavements should be calibrated for bikeways since bicyclists are more sensitive to pavement distresses than motorized vehicle road users. Another factor is that a roadway section can deteriorate in a different manner than the adjacent on-road bikeway. On-road bikeways carry lighter loading of traffic mostly consisting of bicycles should be different, and it may require developing their own set of deterioration curves. Therefore, a question arises if it is more cost-effective to apply a treatment on both, or only to the sector that reached a certain trigger condition level or pre-established time interval.
As contributions, the planning approach developed in this study should aid transportation agencies, metropolitan planning organizations, and cities to incorporate bikeway maintenance criteria and ITS technology at the planning stage to make better-informed timely decisions. Bikeway data and maintenance criteria are integrated into PMS components including inventory, condition assessment, maintenance policies, budget needs, funding prioritization, and reports. For example, prioritization criteria for funding allocation should consider bike traffic, transportation efficiency, regional significance, and safety criteria. Agencies should be aware of this information to consider the needs of all road users when planning and managing roadway networks. It is also envisioned that modern intelligent transportation technology to collect simultaneous data in real time for multiple road users should contribute to the implementation of more efficient integrated pavement management systems.
Author Contributions
C.M.C.: Conceptualization, manuscript writing, analysis, and discussion of results (corresponding author). M.V.: conceptualization, manuscript writing, literature search, analysis. S.L.M.: literature review, resources, editing, and review. All authors have read and agreed to the published version of the manuscript.
Funding
This work was supported by the Metropolitan Transportation Commission (MTC) in the San Francisco Bay Area, California, U.S. Project Title: Streetsaver® Training and Guidance: Asset and Pavement Management Systems Research Development and Implementation.
Institutional Review Board Statement
Not applicable.
Informed Consent Statement
Not applicable.
Data Availability Statement
All data generated or analyzed during this study are included in this published article.
Acknowledgments
The authors acknowledge preliminary work conducted for the Metropolitan Transportation Commission (MTC) in the San Francisco Bay Area, California, U.S.
Conflicts of Interest
The authors declare no conflict of interest.
References
- AASHTO. Guide for the Development of Bicycle Facilities; American Association of State Highway and Transportation Officials: Washington, DC, USA, 2012. [Google Scholar]
- Laker, L. What to do if you hit a pothole while cycling. The Guardian. 26 March 2018. Available online: https://www.theguardian.com/environment/bike-blog/2018/mar/26/what-to-do-if-you-hit-a-pothole-while-cycling (accessed on 4 April 2022).
- Metropolitan Transportation Commission. Pavement Condition Index Distress Identification Manual for Flexible Pavements, 4th ed.; Metropolitan Transportation Commission: San Francisco, CA, USA, 2016. [Google Scholar]
- Streets Blog USA. Want Action? Here’s How to Photograph a Pothole. 2020. Available online: https://usa.streetsblog.org/2020/02/07/want-action-heres-how-to-photograph-a-pothole/ (accessed on 4 April 2022).
- Milne, A.; Melin, M. Bicycling and Walking in the United States; 2014 Benchmarking Report; Alliance for Biking & Walking: Washington, DC, USA, 2014. [Google Scholar]
- Marchiori, M. Safe cycle: Infrastructural control for bikers. In Proceedings of the 2018 IEEE 16th International Conference on Dependable, Autonomic and Secure Computing, Athens, Greece, 12–15 August 2018. [Google Scholar]
- Nuworsoo, C.; Cooper, E. Considerations for Integrating Bicycling and Walking Facilities into Urban Infrastructure. Transp. Res. Rec. J. Transp. Res. Board 2013, 2393, 125–133. [Google Scholar] [CrossRef]
- Shapard, J.; Cole, M. Do Complete Streets Cost More than Incomplete Streets? Transp. Res. Rec. J. Transp. Res. Board 2013, 2393, 134–138. [Google Scholar] [CrossRef]
- Aultman-Hall, A.; Adams, M.F., Jr. Sidewalk bicycling safety issues. Transp. Res. Rec. J. Transp. Res. Board 1998, 1636, 71–76. [Google Scholar] [CrossRef]
- NCDOT—North Carolina Department of Transportation. North Carolina Bicycle Crash Types 2011–2015; Prepared for The North Carolina Department of Transportation Division of Bicycle and Pedestrian Transportation; The University of North Carolina Highway Safety Research Center: Chapel Hill, NC, USA, 2018. [Google Scholar]
- Stutts, J.C.; Hunter, W.W. Injuries to Pedestrians and Bicyclists: An Analysis Based on Hospital Emergency Department Data; FHWA-RD-99-10 078; Federal Highway Administration: Washington, DC, USA, 1997. [Google Scholar]
- Elsaid, F.; Amador-Jimenez, L.; Alescandru, C. Incorporating Bicycling Demand into Pavement Management Systems for Convenient Bikeway Networks. Can. J. Civil Eng. 2019, 47, 759–770. [Google Scholar] [CrossRef]
- Carter, P.; Martin, F.; Nunez, M.; Peters, S.; Raykin, L.; Salinas, J.; Milam, R. Complete Enough for Complete Streets? Sensitivity Testing of Multimodal Level of Service in the Highway Capacity Manual. Transp. Res. Rec. J. Transp. Res. Board 2013, 2395, 31–40. [Google Scholar] [CrossRef]
- Parks, J.; Tanaka, A.; Ryus, P.; Monsere, C.M.; McNeil, N.; Goodno, M. Assessment of Three Alternative Bicycle Infrastructure Quality-of-Service Metrics. Transp. Res. Rec. J. Transp. Res. Board 2013, 2387, 56–65. [Google Scholar] [CrossRef]
- Federal Highway Administration—FHWA. MIRE—Model Inventory of Roadway Elements—Version 1.0; FHWA-SA-10-018; Federal Highway Administration—FHWA: Washington, DC, USA, 2010. [Google Scholar]
- Renfro, R.; Voros, K. Cycle Zone Analysis. Cheyenne On-Street Bicycle Plan and Greenway Plan Update; Working Paper #7; Alta Planning Design: Portland, OR, USA, 2011. [Google Scholar]
- City of Ann Arbor. 2015 Non-Motorized Progress Report; City of Ann Arbor: Ann Arbor, MI, USA, 2015. [Google Scholar]
- Dixon, L.B. Bicycle and Pedestrian Level-of-Service Performance Measures and Standards for Congestion Management Systems. Transp. Res. Rec. J. Transp. Res. Board 1996, 1538, 1–9. [Google Scholar] [CrossRef]
- NCE—Nichols Consulting Engineers. City of Davis Pavement Management Final Report; 2012 Pavement Management Update; NCE—Nichols Consulting Engineers: Reno, NV, USA, 2013. [Google Scholar]
- Metropolitan Transportation Commission. Pavement Condition Index Distress Identification Manual for Rigid Pavements, 3rd ed.; Metropolitan Transportation Commission: San Francisco, CA, USA, 2016. [Google Scholar]
- University of Illinois at Urbana-Champaign. 2013 Campus Bike Plan, Campus Bicycle Network Master Plan; Draft; Facilities & Services Transportation Demand Management: Champaign, IL, USA, 2013. [Google Scholar]
- Minnesota Department of Transportation. 20-Year State Highway Investment Plan 2014–2033; Minnesota Department of Transportation: Saint Paul, MN, USA, 2013. [Google Scholar]
- City of Chicago. Chicago Bike 2015 Plan; Mayor’s Bicycle Advisory Council: Chicago, IL, USA, 2006. [Google Scholar]
- Gharaibeh, N.; Wilson, C.; Darter, M.; Jones, G. Development of a Bike Path Management System for the University of Illinois at Urbana-Champaign. Transp. Res. Rec. J. Transp. Res. Board 1998, 1636, 56–63. [Google Scholar] [CrossRef]
- Makarova, I.; Boyko, A.; Almetova, Z. Decision-making on Development of Cycling Infrastructure through Safety Assessment at Design and Operation Stages. Transp. Res. Procedia 2020, 50, 397–404. [Google Scholar] [CrossRef]
- Pu, Z.; Ciu, Z.; Tang, J.; Wang, Y. Multi-Modal Traffic Speed Monitoring: A Real-Time System Based on Passive Wi-Fi and Bluetooth Sensing Technology. IEEE Internet Things J. 2021. [Google Scholar] [CrossRef]
- Chaturvedi, M.; Srivastava, S. Multi-Modal Design of an Intelligent Transportation System. IEEE Trans. Intell. Transp. Syst. 2017, 18, 2017–2027. [Google Scholar] [CrossRef]
- Huang, Z.; Lv, C.; Xing, Y.; Wu, J. Multi-Modal Sensor Fusion-Based Deep Neural Network for End-to-end Autonomous Driving with Scene Understanding. IEEE Sens. J. 2020, 21, 11781–11790. [Google Scholar] [CrossRef]
- Minnesota Department of Transportation. MnDOT Bikeway Facility Design Manual 2007; Minnesota Department of Transportation: Saint Paul, MN, USA, 2007. [Google Scholar]
- University of California Davis Berkeley (UC Davis). Preliminary Results: Measurement of Macrotexture on Surface Treatments and Survey of Bicyclist Ride Quality on Mon-198 and SLO-1 Test Sections; UCPRC-TM-2013-07; Li, H., Harvey, J., Wu, R., Thigpen, C., Louw, S., Chen, Z., Lea, J., Jones, D., Rezaie, A., Eds.; California Department of Transportation Division of Research, Innovation, and System Information (DRISI): Sacramento, CA, USA, 2013. [Google Scholar]
- Peshkin, D.G.; Hoerner, T.E.; Zimmerman, K.A. Optimal Timing of Pavement Preventive Maintenance Treatment Applications; NCHRP Report 523; National Cooperative Highway Research Program: Washington, DC, USA, 2004. [Google Scholar]
- Texas Higher Education Coordinating Board. Summary of Deferred Maintenance Needs FY 2010 to FY 2014, Deferred Maintenance Plans (MP2) and Campus Addressed Deferred Maintenance (MP4); Texas Higher Education Coordinating Board: Austin, TX, USA, 2010. [Google Scholar]
- Federal Highway Administration—FHWA. Asset Sustainability Index: A Proposed Measure for Long-Term Performance; FHWA-HEP-12-046; Transportation Asset Management Case Studies, Comprehensive Transportation Asset Management: Washington, DC, USA, 2012. [Google Scholar]
| Publisher’s Note: MDPI stays neutral with regard to jurisdictional claims in published maps and institutional affiliations. |
© 2022 by the authors. Licensee MDPI, Basel, Switzerland. This article is an open access article distributed under the terms and conditions of the Creative Commons Attribution (CC BY) license (https://creativecommons.org/licenses/by/4.0/).


