Review

Decision Support Systems for Managing Construction Projects: A Scientific Evolution Analysis

1
GP Krk d.d., Stjepana Radića 31, 51500 Krk, Croatia
2
Faculty of Civil Engineering, University of Rijeka, Radmile Matejčić 3, 51000 Rijeka, Croatia
3
Faculty of Civil Engineering, Architecture and Geodesy, University of Split, Matice Hrvatske 15, 21000 Split, Croatia
*
Author to whom correspondence should be addressed.
Sustainability 2022, 14(9), 4977; https://doi.org/10.3390/su14094977
Submission received: 7 March 2022 / Revised: 5 April 2022 / Accepted: 19 April 2022 / Published: 21 April 2022
(This article belongs to the Special Issue Sustainability in Construction Management)

Abstract

:
The dynamic nature and increasing complexity of construction projects impose many challenges for project planning and control. For years, there has been a debate about the success of construction projects and how to achieve them. A bibliometric study was developed based on 750 scientific papers on project success, decision support system, optimization, and project performance. Data are collected from the Scopus and Web of Science databases and cover the period from January 2000 to February 2022. Several types of analysis were made—data information, research growth, most productive country, most productive institution, most relevant source, most influential authors, collaborations between countries, institutions, authors, most relevant or most cited publication, highest frequency, and keyword occurrence. It is pointed out which are the important authors and journals and in which direction further research should be directed. This paper identifies that construction is one of the least digitized industries in the world. There is a great need for more studies on the organizational changes necessary for digitization and how to evaluate and implement digital technologies to support business on the construction site.

1. Introduction

The dynamic nature and increasing complexity of construction projects impose many project planning and control challenges. For years, there has been a debate about the success of construction projects and how to achieve them. There is no single guideline for project management researchers to measure or predict project success. An understanding of the concept of project success depends on a separate understanding of the concept of project stakeholders. The project succeeds if certain expectations are met for an individual stakeholder [1]. Because multiple stakeholders are involved in a project, each with their own goals and their vision of success, their conflicting goals can make it difficult to define and resolve problems. How well the goals and objectives of the project will be achieved and how many different requirements will be met depends on the decisions made during the project life cycle. This certainly depends on the appropriate and comprehensive cooperation of all stakeholders involved. Each of the participants in the project introduces their vision of the problem and their vision of project success arising from the specific conditions of the construction industry, the wishes and attitudes of investors, and the impact of socioeconomic and environmental aspects [2,3,4,5]. Traditional approaches to success analysis deal with the Iron Triangle, monitoring the project by price, time, and quality [6]. If additional parameters are taken into account, predicting problems from a huge set of data becomes even more problematic.
A project will be considered successful if the project objects are met. In order to achieve the project objectives, project performance measurements were found to be key to project control [6]. Furthermore, decision-making is the key to project success in all sectors, especially in construction, which requires the handling of diverse information and knowledge [7].
Unpredictability, dynamism and a large amount of information are the main characteristics of construction projects. The planning of construction processes and efficient management is extremely important for success [8]. Usually, many decisions are made in the initial stages of a project that directly impact the success of the project, therefore all risks must be identified at the outset [9]. The project manager must have good experience in initiating, planning, and executing construction projects. There are many decisions that project managers must make daily, quickly, efficiently, and without error, as every mistake brings significant financial losses. Some mistakes can even be fatal for the whole company. Engineers require help making decisions to improve the quality of problem-solving. The problems they face are always multicriteria-based [10]. Engineers need to manage diverse and constantly changing project data. They need timely support. Many building information modeling (BIM) applications are already integrated into project management processes. However, the construction industry suffers from poor decision-making. To make the best decisions, a large amount of information needs to be processed and classified [11]. The influence of digitalization on the management processes in the construction industry is growing. Given the complexity of project management, decision-making processes, and operational performance, special emphasis on communication, data collection, and feedback throughout the organization is required [12]. The implementation and support of intelligent Industry 4.0 tools such as AI, big data analytics, and soft computing tools combined with management information systems will provide benefits to project stakeholders by enabling them to anticipate and manage their investments appropriately.
This research aims to make a detailed holistic approach to a literature review to develop an information system that will serve project managers to optimize the decision-making process and take control in uncertain project environments. Process modeling and optimization will potentially speed up problem-solving, facilitate business, and steer the project toward a positive outcome. This paper aims to detect the gaps of worldwide literature through the bibliometric analysis of the scientific papers published in Web of Science (WoS) and Scopus databases from January 2000 to February 2022. Since these are the two most comprehensive databases of this scientific field, their data overlap, therefore the study of the merged database is one of the contributions of this paper. The paper includes the analysis of data information, research growth, most productive country, most productive institution, most relevant source, most influential authors, collaborations between countries, institutions, authors, most relevant or most cited publication, highest frequency, and keyword occurrence. The conducted bibliometric analysis allows researchers to gain an overview of an area in one place, identify knowledge gaps, extract new research ideas, and position their intended contribution to the area. It gives a valuable overview of the area and topic progression over the years.

2. Methodology

Bibliometric analysis is an increasingly popular method in scientific circles and field research. It is defined as a systematic quantitative review of the literature that enables transparent and systematic qualitative analysis and the synthesis of information. At the same time, it enables a quantitative and objective approach, i.e., the statistical analysis of collected bibliometric data [13,14]. The bibliometric method is used when raw scientific data are too large for manual review. It serves to overview a particular field and illuminate the areas located in that field. By identifying and proving new and unexplored areas, researchers can prove the impact of their work. In addition, it is often used to identify potential collaborators in research or to identify the journals in which they want to be published.
Bibliometric parameters are numerical values used to evaluate the impact. Eigen-factor, article influence score, SCImago journal rank, and source-normalized impact per paper are used for journal evaluation [15], and h-index, publication count, citation count, hc-index, m-Quotient, e-Index, g-Index, i-n Index are used for researchers’ evaluation [15,16,17,18,19]. The importance of assigning numerical values was well stated by Lord Kelvin in his lecture to the Institution of Civil Engineers. He said: “I often say that when you can measure what you are speaking about, and express it in numbers, you know something about it; but when you cannot measure it, when you cannot express it in numbers, your knowledge is of a meager and unsatisfactory kind; it may be the beginning of knowledge, but you have scarcely in your thoughts advanced to the state of Science, whatever the matter may be” [20].
The use of bibliometrics is not new, but the most remarkable development occurred in the last decade, where rapid development was recorded along with a much larger number of publications on the subject [21]. Based on the already established steps described in the literature, a similar methodological framework of bibliometric analysis was applied. The first step was to conceptualize the research and collect bibliometric data that were analyzed in detail. Visualization was made, after which it was possible to interpret and create new knowledge [22,23].
In addition to the growth of Web of Science and Scopus databases, the increasing use of this method can certainly be attributed to the development of additional biblio-metric software. The list of popular software for analysis and visualization includes VOSviewer [24], Gephi [25], Bibliometrix [22], HistCite [26], CiteSpace [27], Pajek [28], Sci2 [29], PoP (Publish or Perish) [30], BibExcel, UCINet [31], etc. In this article, data processing is performed using VOSviewer.
VOSviewer, where VOS stands for visualization of similarities, is a software tool designed for creating, visualizing, and exploring maps based on data. Data can be network, text, or, as used for this article, bibliographic data. In VOSviewer data connection is carried out following distance-based maps, where the distance between two items reflects the strength of the relation between the items. The data is interconnected by links and each link has a strength represented by a positive numerical value. The total link strength indicates the number of publications in which two keywords occur together [32]. VOSviewer by default assigns network items to clusters. A cluster is a set of closely related items. Each item in a network is assigned to only one cluster. More details on this, including the results of the analysis, are explained in Section 3.6.

2.1. Search Query

The most important part of undertaking successful research is the accurate definition of a query. If the query is written too generally, researchers will have an overview of a too wide area, possibly even with forest data, and it will be difficult to find the required gap in the research area. The area of interest that was searched to draft this article refers to the worldwide area and the period from January 2000 to February 2022. All scientific papers such as articles, review articles, conference reviews, conference papers, and books were reviewed. The aim of this article is to investigate the impact and development of the literature on decision support systems and performance. The search began with these two terms. Since our further research requires a connection with construction companies and project performance, the query was specified as described below. The “*” tag was used to cover as many keyword combinations as possible.
Figure 1 gives a visual representation of the process of defining our query. By overlapping four fields and obtaining a cross-section of their content, the area is limited to our interest. Figure 2 defines in more detail the content of each field of which the sections are made. Field A represents the decision support system or DSS. Field B directs the search to contractors and the private sector. The words were filtered to include projects, companies, organizations, engineers, and investments, but also have a common link in the term construction. The idea of field C was to include the concepts related to the successful implementation of the project. The following were considered: (1) Which are key indicators of a project’s success? (2) How to measure project performance? (3) What is successful performance management? (4) What affects the success or failure of the project? (5) Can we predict problems on time? By overlapping the mentioned fields and including them within the period from January 2000 to February 2022, which represents field D, the process of defining the query is successfully completed.
In mathematical terms, the current statement is expressed as (1)–(5):
TS = TSD ∪ (TSA ∩ TSB ∩ TSC)
TSA = “decision support system*” OR “DSS”
TSB = “construction” AND “project*” OR “compan*” OR “organization*” OR “in-vest*” OR “engineer*”
TSC = “key performance indicator*” OR “KPI” OR “failure” OR “success” OR “pre-diction*” OR “performance manag*” OR “performance measur*” OR “project* perform*”
TSD = worldwide, 2000–2022

2.2. Data Selection

The authors very often note that it is necessary to pay special attention to the choice of database. They argue that it is first necessary to be well informed about the content of databases and to review the advantages and disadvantages of individual databases, and only then start searching [33,34].
Two databases were selected and processed for this article—Scopus and Web of Science. They belong to the group of the largest and highest-quality databases covering the global area. Since they contain a wide range of information and scientific research from various research areas and are characterized by the quality of the selected articles, they are often chosen for extensive research and bibliometric data analysis [35,36]. WoS was developed in the second half of the 20th century and for years has been the exclusive and largest database available for scientific research and bibliometric analysis. At the beginning of the 21st century, Scopus was introduced to the scene and immediately set out to present serious competition. Numerous scientists have already engaged in comparing the two bases, trying to infer which base is better. Research has not drawn unequivocal conclusions about the quality of databases and which database is better for searching scientific data [37,38,39,40]. Both databases offer multiple databases for interdisciplinary research and allow in-depth research of a specific academic field. With the help of Scopus and WoS databases, it is possible to discover the latest areas of research relatively quickly and easily, to determine trends and the importance of topics in the world of researchers by year, or to find out which country and institution publishes important topics for the selected area of interest.
Scopus and WoS offer slightly different ways of searching. Differences in search mode are listed in Table 1.

2.3. Data Cleaning

By simultaneously searching two databases, we obtained a comparison of their contents. Table 2 shows the number of articles found in each database for the fields described in Section 2.1. After the first rough search of the results, the fields of interest were overlapped. The number of articles that match our search has been significantly reduced. In the Scopus database, 343 articles matched the search, and, in the Web of Science database, 681 articles matched. Although it is often mentioned that Scopus has greater coverage by publications than WoS [33,37,41], for this topic, the search results are different. The WoS database proved to be broader and contained more data than Scopus for this particular topic.
A review of the data revealed that preliminary cleaning is required. Categories that are not relevant to this research have been removed, i.e., medicine, biology, pharmacology, social sciences, art and humanities, horticulture, earth and planetary sciences, etc. Although a robust analysis is done throughout the article of the research area, further steps in the research will require a detailed search of the database. In which case, due to ignorance of the language, we would exclude articles in Chinese, Portuguese, etc. For this reason, despite the review of scientific papers in the worldwide area, the search was reduced to scientific papers in English. Since two databases contain large amounts of data and scientific papers, as might be expected from the experiences of other researchers [39,42], some of the data presented in the results are expected to be repeated. To facilitate and speed up the process, help through the Zotero program was selected. Zotero is an open-source program that helps researchers edit and manage bibliographic notes. Importing and exporting data is possible in various formats. For this article, after searching, data from the Scopus and WoS are exported to an RIS file, which can then be imported directly into Zotero. A search of data on the Internet revealed comments that Zotero sometimes has problems with importing data, i.e., that it sometimes makes a mistake. After reviewing the entered data and correcting the located deficiencies, the search for duplicated scientific data from the processed two databases started. Fifty-nine duplicate articles and nineteen conference papers were located. The number of data ready for further processing has been reduced to 750 (Table 3).
Excel was used for the further statistical processing, analysis, and listing of data on year of publication, country of issue, and affiliation.

3. Results and Discussion

3.1. Global Statistics

From 750 documents collected from the two databases, 72% of records are classified as articles, of which 4% are more precisely specified as review articles. Moreover, 27% are conference papers and reviews, and only 1% of the total data are book chapters. The results were expected, given that Scopus and WoS are known to mostly cover journal articles and focus less on other types of publications (e.g., conference papers and books) [38].
Figure 3 shows the trend of publishing scientific papers in Scopus and WoS. Apart from the fact that Scopus’ database has obviously less data, there is a small and barely noticeable increase in publishing. In the WoS database, the increase in performance is more or less constant and with a much steeper trajectory.
In addition, Figure 3 shows the trend line of the merged database from which duplicate data were previously removed. At the beginning of the analyzed period, interest in this topic was extremely low. In the first five years, only 12 papers were published. A somewhat significant increase in the number of publications started only in 2010, when 15 papers were published; since then, it has mostly been on an upward trajectory. In 2021, 73 scientific papers were published. The annual increase in publications on the topic of DSS and performance management in construction projects is visible. The average annual growth is calculated and amounts to 30.09%. According to historical data, it is possible to assume that more than 115 scientific papers will be published in 2022. The figure shows that interest in this topic is undoubtedly growing, and significant progress can be expected in the coming years.

3.2. Country Statistics

The analysis of the most productive countries was based on the associated country of the author. Table 4 gives a comparative analysis of the most active countries according to the Scopus, WoS, and merged databases.
The countries that have devoted the most effort in publishing are the USA, the People’s Republic of China, and the UK. Those countries are the three leading, most active countries in all three databases. Canada, Australia, Taiwan, and South Korea appear in all databases, which confirms their activity. Their ranking order is slightly different depending on the observed database. Differences in support of publications between Scopus and WoS are visible if we keep track of Iran, Malaysia, and Italy, which are among the top 10 active countries in the WoS database but are not among Scopus’ top 10. Equally, Brazil, Egypt, and India are on Scopus’ top 10 rankings and are not shown on WoS’s rankings.
The analysis of Table 4 shows that the authors of some countries prefer WoS rather than Scopus. WoS has a significantly larger number of publications compared to the Scopus database. Authors from the UK and USA have published twice as many publications in the WoS database than in the Scopus database. It can be noticed that authors from Canada and China publish significantly more papers in WoS than in Scopus. The number of published papers in WoS is over three-times higher. An even more significant difference relates to Australia, whose authors published 9 papers in the Scopus database and 48 in WoS database, over five-times more.
Of the top 10 countries, five were from Asia, two were from Europe, two were from North America, and one was from Oceania. Given that 24% of publications include international collaboration, it can be concluded that the topic is favorable for international cooperation.
Figure 4 shows the percentage of participation of individual countries in the total number of selected 750 publications. As expected, given the size, development, and the already known fact that they are world leaders in scientific production, the People’s Republic of China and the USA are definitely leading in publishing scientific papers on this topic. Each of the two countries participate with almost 20% in the publications among the selected 750 papers. The importance of their percentage comes to the fore when comparing a further list of states and their percentages of participation. The People’s Republic of China and the United States together account for 38.80% of the total number of publications. It is interesting to compare that the same percentage of participation has the sum of the following eight countries on the list—UK (8.53%), Australia (6.67%), Canada (6.40%), South Korea (4.0%), Malaysia (3.60%), Taiwan (3.60), Iran (3.20%), and Italy (3.20%). A more detailed list of all countries whose authors participated in the publications is given in Table A1 of Appendix A. In addition, the total number of publications per country was calculated, and the ratio of their number of publications to the total of the 750 publications analyzed was given.

3.3. Institution Statistics

Table 5 shows the top 10 institutions that publish the largest number of bibliometric publications, according to Scopus and WoS. A total of 18% of the publications were published by authors affiliated with these institutions. It is noticeable that four of the ten leading institutions are from the People’s Republic of China (Hong Kong Polytechnic University, Huazhong University of Science & Technology, University of Hong Kong, and City University of Hong Kong). In Section 3.2, country statistics were analyzed, with the People’s Republics of China and the USA leading the way. Comparing these data with institution statistics, the absence of USA institutions is noticeable and surprising. Purdue University is the only representative of USA institutions and is in the top 10 active institutions, but only in eighth place. Continuing to link with Section 3.2, the University of Alberta appears as the representative of Canada in second place, and the National Taiwanese University as the representative of Taiwan is in four place in the top 10 active institutions of the world.
An analysis of the collaboration of institutions with each other was made. Table 6 shows the top 10 active institutions and the percentage of their publications produced in collaboration with other institutions. Cooperation is most evident with the institutions of the People’s Republic of China. Hong Kong Polytechnic University is the leader in the percentage of published publications produced in collaboration with other scientific institutions (77.78%). Other institutions of the People’s Republic of China have very high percentages as well: Huazhong University of Science & Technology with 76.47%, the City University of Hong Kong with 70%, and the University of Hong Kong with 50% of scientific papers published in collaboration. Among the top 10 active institutions, National Taiwan University has the largest percentage of self-produced publications. It is worth noting that as many as 75% of the publications are produced independently within that institution. Moreover, with a high percentage of self-produced publications, not far behind the National Taiwan University, is the University of Auckland, which has independently written 70% of the published papers.

3.4. Journals Statistics

Publications are retrieved from a wide range of journals and different knowledge areas, totaling 297 journals and conferences. Table 7 lists the top 10 journals that published the most scientific papers on the topic. These turned out to be journals of extremely high quality. Eight out of ten are defined as the highest-ranked journals in a category (Q1), and just two out of ten are positioned as Q2. These journals are distributed in different knowledge areas such as engineering, energy, social science, environmental science, business, management and accounting, computer science, and decision sciences. The topic is interesting not only in the field of construction but also beyond. Obviously, this topic has widely attracted the attention of many researchers. This implies that this paper will not only have a scientific contribution for engineering and construction, but it is relevant to other management sciences for all researchers working with intelligent systems or those working on digitization, industry 4.0, etc.
One of the most commonly used journal evaluation measures is the impact factor. The journal may have a different value for this factor each year. This is the number of citations the journal received in the last full year for articles published in the previous two years, divided by the total number of articles published by the journal in the previous two years or simply the average number of citations published in the last two years.
By analyzing Table 7 and the impact factor, first on the scale with a factor of 9.297 would be the Journal of Cleaner Production and then Automation in Construction with 9.160. Although the impact factor is considered to be one of the most commonly used measures for evaluating a journal, some researchers have pointed to its negative characteristics and noted that these values should not be blindly monitored. Journal impact factors correlate poorly with the actual citations of individual articles and are not statistically representative of individual journal articles. In addition, this value has nothing to do with the assessing of the quality of individual articles, but rather journals [43,44].
CiteScore measures the average number of citations per document that a title receives over a period of three years. It refers to articles, reviews, letters, notes, editorials, conferences, and other documents, which give a complete picture and a more comprehensive and up-to-date view of the journal’s impact. The transparent and straightforward calculation gives CiteScore a clear advantage over other measures [45].

3.5. Author Statistics

By browsing the Scopus and WoS databases, it is possible to obtain specific information about each author. In addition to the variants of authors’ names and surnames used in publications (published names), a list of authors’ current and previous affiliations is visible. In addition to the total number of publications, there are papers on which author was guided as the first, last, or corresponding author.
Author statistics were made separately for Scopus, Web of Sciences, and merged databases. Certain illogicalities or errors were noticed during the analysis as the authors used different variants of their names and surnames. The error occurred because of the connection between different variants of names and affiliations, therefore the databases classified and led them as different authors. Pranckute emphasized [33] that it is possible that, for example, the Scopus database can make a mistake in classifying the author due to the absence of an email address. Errors were corrected, therefore Table 8 contains the ranking list of the 10 most active authors.
Databases give us information on citing articles and times cited, which is extremely important to reveal the impact of an author’s scientific work, whether the topic is current, interesting, and whether some new data important for further research was discovered. Usually, it is possible to see the time progress of the number of publications in parallel with the line indicating the number of citations of authors by year. In this regard, it is important to emphasize the h-index. Although the h-index was introduced on the scientific scene in 2005, due to the simplicity of the calculation and its objectivity, it became a very popular, and monitored the index that measures the effect of productivity and the citations of authors’ publications. It quantifies the results of an individual’s scientific research [18].
The h-index defines the number (h) of the best papers in a database, each of which is cited at least h times. One limitation is that the h-index may vary from database to database, as they cover different publications in different age ranges. Although initially the index was used only to measure the productivity and citations of authors, later the h-index began to be used to measure impact of journals, institutions, etc. [33]. What is also considered to be a disadvantage is that few authors can have the same h-index even though one of them may have a significantly higher number of published papers and higher number of total citations. In this regard, the h-index is unfavorable for new journals and researchers [33].
According to Hirsch [18], it is good if an author in 20 years of research has an h-index of 20. It is outstanding if the h-index is 40 and truly exceptional if it is 60. Considering Table 9 and all the data collected from Scopus and WoS databases, Shen G.Q. and AbouRizk S. are considered to be outstanding. Taking into account Shens’ h-index of 57 from Scopus and 51 from WoS, he tends to reach the Hirsch category of truly exceptional soon. Zhang L.M. is now in the Hirsch category of good but believing that the author doesn’t have 20 years of research experience, it is to be expected that will soon move into higher categories.
In order to conduct a quality bibliometric analysis, it is very important to consider the cooperation of the authors in scientific papers. In this way, it is possible to see their personal development and the development and progress of a particular topic [33]. A co-authorship analysis was made in VOSviewer, and the visualization is visible in Figure 5. The network of cooperation has been developed, connecting different institutions and countries, which is further proof of the topicality of the topic.
Table 10 lists the 10 most cited publications. In addition to information on the title, authors, the number of citations, the year of publication, the author’s affiliation, and the country associated with the author were also written. The most frequently cited paper is “A fuzzy decision framework for contractor selection” by Singh and Tiong from Singapore, published in 2005. It has been cited a total of 162 times. In second place is “Cognitive biases and decision support systems development (a design science approach)” by Arnott from Australia, published in 2006, which was cited a total of 150 times. What is somewhat surprising is the third publication in the row. In collaboration with American and Chinese authors (Ding, Zhou, and Akinci), the paper “Building Information Modeling (BIM) application framework: The process of expanding from 3D to computable nD” was published in 2014. The total number of citations is 149. Although published almost 10 years later, the number of citations is just slightly lower and can be expected soon to surpass the top two articles of this analysis. Moreover, the work published in 2018 climbed very high on the list of the most cited publications. In just three and a half years, it has become more frequently cited than scientific papers published more than a decade ago. It is the work of authors Li, Xue, Li, Hong, and Shen from Chinese universities entitled “An Internet of Things-enabled BIM platform for on-site assembly services in prefabricated construction”.
Among the affiliates, the institutions seen in Section 3.3 are repeated. Institutional statistics, i.e., the top active institutions—Huazhong University of Science & Technology, University of Hong Kong, and Hong Kong Polytechnic University.
Very interesting information lies in the analysis of the countries associated with the author. In addition to the People’s Republic of China, the USA, Australia, South Korea, and Singapore, which have already been mentioned in Section 3.2 or Section 3.3, the list includes Serbia. Two scientific papers have been published at Serbian universities and are high on the list of the most cited papers. The article by Gigovic, Pamucar, Bozanic, and Ljubojevic, “Application of the GIS-DANP-MABAC multi-criteria model for selecting the location of wind farms: A case study of Vojvodina, Serbia”, was published in 2017. Despite the recent year of publication, the paper was cited 141 times and occupied the fifth position on this scale. Immediately following this, on the sixth rank position, is the article by Rikalovic, Cosic, and Lazarevic, “GIS Based Multi-Criteria Analysis for Industrial Site Selection”, published in 2014, cited 140 times.

3.6. Research Hotspots and Evolutions

Keywords are indicators of studies that transfer main topics. Keywords that appear together can be identified and analyzed to reflect the most interesting research issues in a particular field. For this article, the visualization of the most common words was made in VOSviewer. The document imported into VOSviewer had to be created as a .ris file, since the data were not imported directly from Scopus or WoS but were edited, overlapped, and had duplicate publications removed. In order not to show forest data and all 4184 different keywords, the minimum number of occurrences of a keyword was chosen to be ten. This reduced the range of keywords to 103 words. A list of all terms above the threshold is shown in Appendix A (Table A2) along with occurrence data. The created visualization (Figure 6) shows 103 nodes divided into four clusters. The clusters are very intertwined, and the total link strength is 7240. Every keyword is considered to be an item that can have various attributes. One of them is weight, an attribute that is restricted to non-negative values. Weight indicates the importance of the item and, if the item is more important, it will be more visible and noticeable on visualization. There are two standard weight attributes, referred to as the Links attribute and the Total link strength attribute. Table 11 shows the top 20 most common and strongest words of this research. These are the words that are most prominent in the visualization [46].
By counting the appearance frequency of keywords, hot spots of the research topic can be analyzed [47].
Cluster number 1 is red (Figure 6). It is the most significant cluster with 36 keywords. All terms in this cluster indicate the system development and digitalization of the AEC industry, as can be concluded from the terms: “BIM”, “critical success factors”, “decision support”, “GIS”, “impact”, “implementation”, “industry”, “information”, “knowledge”, “management”, “methodology”, “performance”, “simulation”, “sustainability”, and “quality”. Although the bibliometric analysis was made with publications from all over the world, it is interesting that “Hong Kong” appears as one of the keywords of this cluster. Given that the three Hong Kong universities are among the top 10 most active institutions, this information is consistent and only confirms their strong influence. By reviewing these clusters, we can conclude that the three universities published the most on the topic of the progress and improvement of digitalization in the AEC world.
Digitization is seen as a dynamic process of change driven by the rapid development of innovative concepts that brings significant potential benefits to the construction industry. The literature often states that we live in the age of Industry 4.0. It is the age of information technology, digitalization, and the emergence of machines driven by artificial intelligence. Artificial intelligence is the replacement of work processes intended for humans by automated or semi-automated machines, commonly referred to as “intelligent agents”. This reduces the chance of errors in work processes. Intelligent agents perceive the environment and increase the chances of success [48]. Although construction is one of the largest industries in the world, digitalization is being introduced very slowly among construction companies. Moreover, construction is considered to be one of the least digitized industries in the world. A significant shift in digitalization has been achieved with the introduction of building information modeling (BIM) [48,49]. However, for this research area, there is a great need for more studies on the organizational changes necessary for digitization and how to evaluate and implement digital technologies to support business on the construction site.
Cluster number 2 is green (Figure 6) and brings together 29 items, among which are “automation”, “benchmarking”, “computer simulation”, “construction equipment”, “contractors”, “costs”, “decision making”, “efficiency”, “KPI”, “investments”, “project management”, “project performance”, “risk analysis”“, and “success”. The common denominator of the whole cluster is the increasing long-term productivity of construction projects.
To create a competitive advantage in the construction industry, it is necessary to increase productivity, develop construction equipment, and automate work processes. It is increasingly common to think that knowledge management is no less important than a key organizational ability of construction company managers. Benchmarking is a great approach to continuously improve and advance the construction company’s processes while taking into account competitive activities and dynamics. It provides a systematic framework for identifying, classifying, and evaluating enterprise processes, activities, and performance. The primary goal of benchmarking is continuous improvement while monitoring the activities of other competing companies [50]. There are three main types of benchmarking: (1) internal—research and analysis of practice within a company’s department to seek progress; (2) competitive—research of competitive practices and implementation in its business; (3) generic—research on the best practices of a company that does not operate in the same type of industry. Competitive benchmarking is best researched through the literature. However, there is still a lot of unexplored area regarding benchmarking and construction companies [51,52].
Cluster number 3 is blue (Figure 6) and contains 23 items such as: “algorithms”, “artificial intelligence”, “classification”, “data mining”, “DSS”, “decision theory”, “decision threes”, “forecasting”, “fuzzy logic”, “mathematical models”, “neural networks”, “optimization”, “planning”, “prediction”, and “scheduling”. This cluster focuses on the optimization of construction projects using artificial intelligence. Every construction company in the form of its progress must certainly work on process optimization. It cannot be competitive, thrive, and break into new markets if it does not pay attention to this aspect. Optimization can increase resource efficiency, reduce construction time, minimize construction costs, etc.
Cluster number 4 is yellow (Figure 6) and has 15 terms. The main keywords of this cluster are: “analytic hierarchy process”, “case-based reasoning”, “contractor selection”, “criteria”, “decision-making”, “model”, “supply chain management”, “support”, and “uncertainty”. A common notion of these terms is multicriteria decision-making.
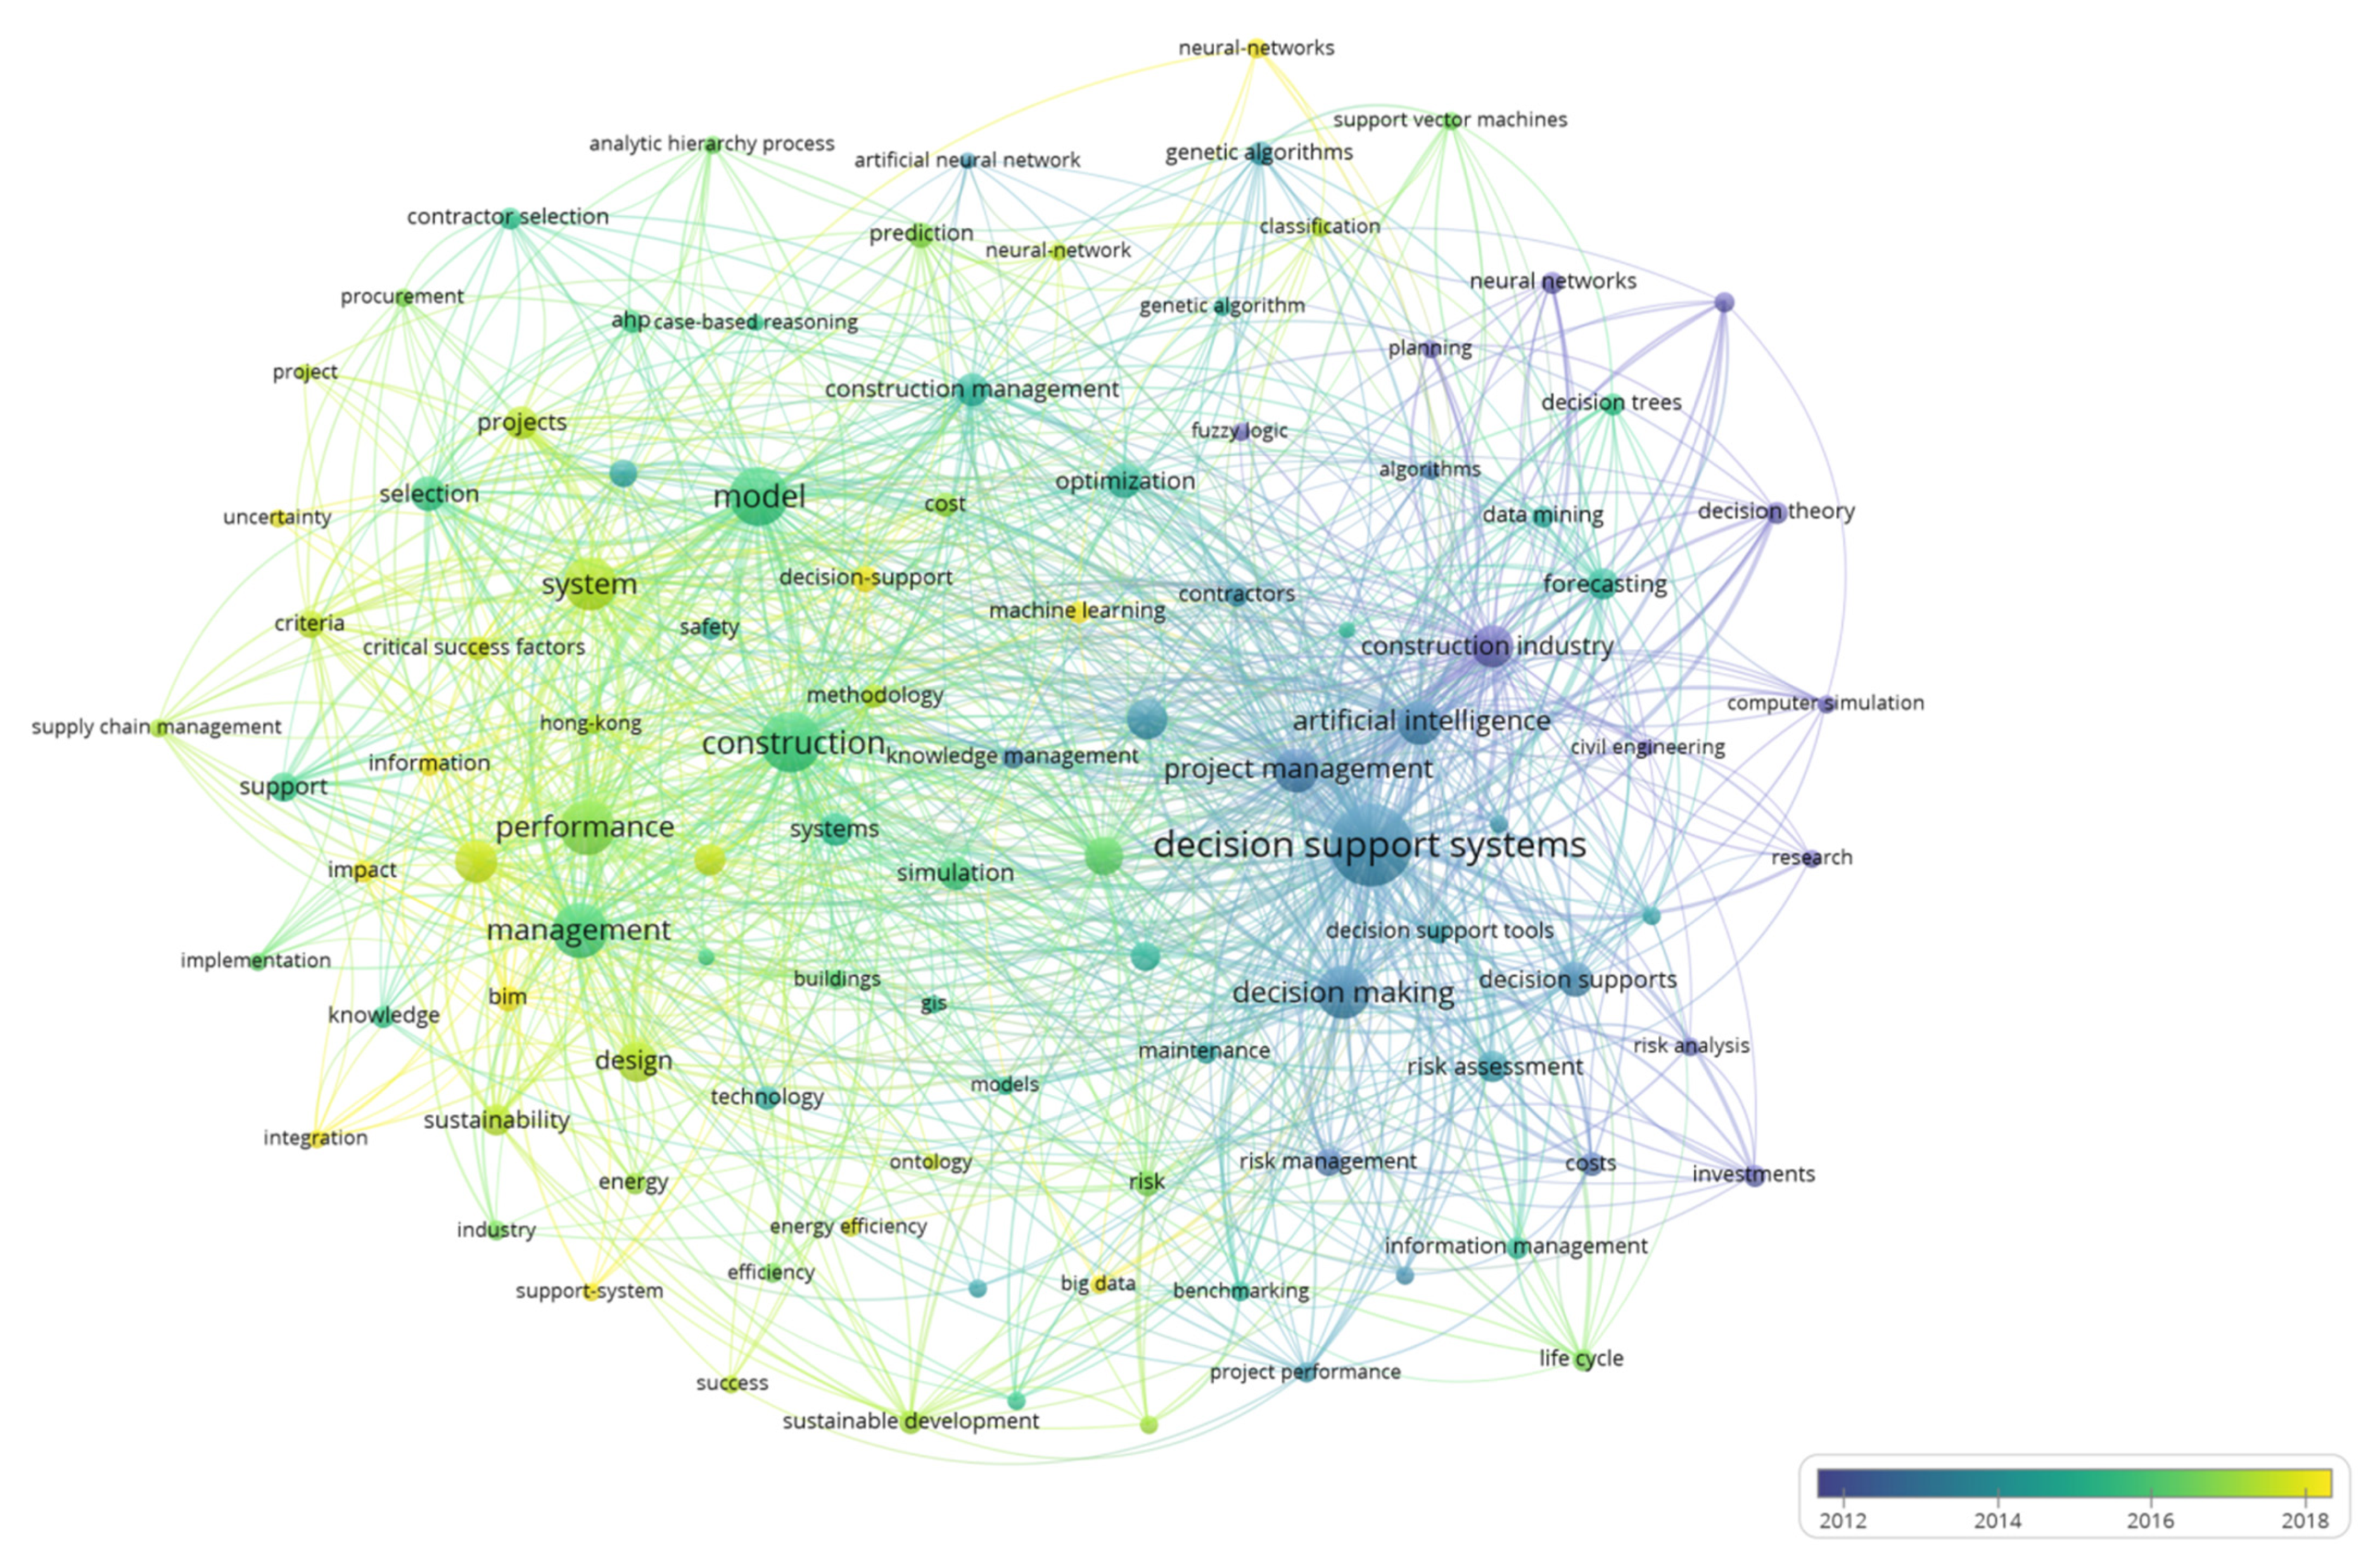
Comparing Figure 6 with the network visualization of clustered keywords and Figure 7 with the presentation of keyword usage over the years, it can be seen that the terms of clusters no. 1 and no. 4 are quite new. Researchers have been using them frequently for the last 5 years and that is why they are colored yellow or very light green on Figure 7. Especially new are considered to be: “BIM”, “impact”, “integration”, “support-system” and “decision-support” from the red cluster (no. 1), and “decision-making”, “uncertainty” and “criteria” from the yellow cluster (no. 4). There are no blue or dark green items in this area. This visualization confirms that the concepts of cluster no. 1 (red) and cluster no. 4 (yellow) still have a lot of room for improvement and research. The topics are broad and modern. This can be used by future researchers to direct their research topics or develop their current topics in this direction.
The right side of Figure 7, which includes mostly cluster no. 2 (green) and cluster no. 3 (blue), according to Figure 6, is darker in color. The blue and dark green colors suggest that researchers used them ten years ago or even before. The size of the node indicates the frequency of use of the term. Therefore, the “decision support system” is the biggest node of this research, the most commonly used, and one that researchers have often written about. Ten years ago, the terms “construction industry”, “artificial intelligence”, “project management”, “decision making”, “risk management”, and “mathematical models” were also very popular. Some of the newer and more modern terms from these clusters are “big data” from cluster no. 2 and “neural network” and “classification” from cluster no. 3.

4. Conclusions

Our study provided a holistic overview and extensive analysis of bibliometric data collected using Scopus and WoS databases. It made a significant step forward for all future researchers dealing with this topic. We used bibliometric analysis because we wanted to discover new trends in the work of articles and journals, the degree of cooperation between institutions and countries, and which journals are the strongest in this topic. In addition, since researchers often discuss the size, quality, and content of different databases, we were interested in comparing Scopus and WoS, whether the data overlap and whether Scopus is indeed a more robust database, i.e., a database with multiple publications, as they often claim. An analysis of the collected data proved that the WoS database would be a better choice if the researcher does not want to combine data from multiple databases. In addition, another scientific contribution to the topic has been made by creating a new, merged database and analyzing those data.
Bibliometric analysis suited us because we decided to filter several hundred publications that correspond to the need for robust analysis. At the same time, it is a very objective analysis because it monitors the number of citations, publications, the appearance of keywords, etc. We have considered several types of analysis—data information, research growth, most productive country, most productive institution, most relevant source, most influential authors, collaborations between countries, institutions, authors, most relevant or most cited publication, highest frequency, and keyword occurrence.
There has been a significant increase in publications in the last 20 years. The interest in this topic is undoubtedly growing, and significant progress can be expected in the coming years. The most active countries are, as expected, the People’s Republic of China and the United States, which significantly lead in the number of publications. Hong Kong Polytechnic University is the most active institution, along with the University of Alberta and Huazhong University of Science & Technology. International collaboration and collaboration between institutions are significant, which indicates a broad interest in the topic. G.Q.Shen, S.AbouRizk. and L.M.Zhang proved to be the top three most active authors on this topic, with a high degree of citation and enviable h-indexes. By analyzing the journals that published the most scientific papers on this topic, we learned that this paper would make a scientific contribution not only to construction engineers, but also to other fields’ researchers—business, management, accounting, computer science, decision sciences, and many others dealing with intelligent systems, digitalization, industry development 4.0, etc.
Keyword co-occurrence visualization and analysis showed that “BIM”, “impact”, “integration”, “support-system”, “decision-support”, “decision-making”, “uncertainty”, “criteria”, “big data”, “neural network”“, and “classification” burst recently. In addition, the analysis showed four keyword clusters, which, in order of size and significance, are: (1) the system development and digitalization of the AEC industry; (2) increasing long-term productivity of construction projects; (3) optimization of construction projects using artificial intelligence; (4) multicriteria decision-making. By analyzing this area, we found out that, even though construction is one of the largest industries in the world, it is considered to be one of the least digitized industries in the world. There is a great need for more studies on the organizational changes necessary for digitization and how to evaluate and implement digital technologies to support business on the construction site. This paper identified that digitalization of the construction industry, Industry 4.0, and their relations, are the current research hotspots that can be considered as future research directions. Further research should be focused on modeling an information system that will serve project managers to optimize the decision-making process and take control in uncertain project environments. It is crucial to help speed up the optimization process, solve problems, facilitate business, and direct the project towards a positive outcome.
The limitations of this research lie in the use of data from the Scopus and WoS databases. The inclusion of Google Scholar would possibly expand the existing database, and the analysis might yield different results or could provide a different path for further research to complement this study. In addition, scientific papers published only in English were analyzed, although worldwide literature was reviewed.

Author Contributions

Conceptualization, K.G., I.M. and N.J.; methodology, K.G., I.M. and N.J.; software, K.G.; validation, K.G., I.M. and N.J.; formal analysis, K.G., I.M. and N.J.; investigation, K.G., I.M. and N.J.; resources, K.G. and I.M.; data curation, K.G.; writing—original draft preparation, K.G., I.M. and N.J.; writing—review and editing, K.G., I.M. and N.J.; visualization, K.G.; supervision, I.M. and N.J.; project administration, I.M.; funding acquisition, I.M. All authors have read and agreed to the published version of the manuscript.

Funding

The APC was funded by the authors.

Institutional Review Board Statement

Not applicable.

Informed Consent Statement

Not applicable.

Data Availability Statement

Data available on request due to restrictions, e.g., privacy or ethical. The data presented in this study are available on request from the corresponding author. The data are not publicly available due to further research to be published.

Acknowledgments

This research has been fully supported by the University of Rijeka under the project number uniri-pr-tehnic-19-18 and DSC4SUM collaboration (dsc4sum.gradri.uniri.hr). Also, this research is partially supported through project KK.01.1.1.02.0027, a project co-financed by the Croatian Government and the European Union through the European Regional Development Fund – the Competitiveness and Cohesion Operational Programme.

Conflicts of Interest

Authors declare no conflict of interest.

Appendix A

Table A1. Country statistics—number of published documents and ratio to a total of 750 analyzed documents.
CountryRecord Count% of 750
People’s R. China14619.47%
USA14519.33%
UK648.53%
Australia506.67%
Canada486.40%
South Korea304.00%
Malaysia273.60%
Taiwan273.60%
Iran243.20%
Italy243.20%
Turkey212.80%
Brazil202.67%
Spain192.53%
Egypt182.40%
India182.40%
Singapore162.13%
Germany152.00%
Lithuania131.73%
France121.60%
New Zealand121.60%
Pakistan121.60%
Poland121.60%
Portugal121.60%
Indonesia111.47%
Netherlands111.47%
Saudi Arabia111.47%
Sweden111.47%
Denmark91.20%
Russia81.07%
Chile70.93%
Greece60.80%
Japan60.80%
Switzerland60.80%
Thailand60.80%
Israel50.67%
Norway50.67%
Slovenia50.67%
Ukraine50.67%
Croatia40.53%
Iraq40.53%
Jordan40.53%
Morocco40.53%
Nigeria40.53%
Peru40.53%
Tunisia40.53%
United Arab Emirates40.53%
Austria30.40%
Belgium30.40%
Colombia30.40%
Finland30.40%
Ghana30.40%
Serbia30.40%
Vietnam30.40%
Czech Republic20.27%
Libya20.27%
Slovakia20.27%
South Africa20.27%
Barbados10.13%
Belize10.13%
Bhutan10.13%
Bosnia and Herzegovina10.13%
Cyprus10.13%
Estonia10.13%
Honduras10.13%
Hungary10.13%
Kazakhstan10.13%
Kenya10.13%
Kuwait10.13%
Lebanon10.13%
Mexico10.13%
Mozambique10.13%
North Macedonia10.13%
Qatar10.13%
Romania10.13%
Zimbabwe10.13%
Table A2. List of author’s keyword and their frequency.
ClusterKeywords
Cluster 1big data (11), bim (23), buildings (14), construction (120), critical success factors (19), decision support (29), decision-support (22), design (57), energy (16), energy efficiency (13), framework (61), gis (13), hong-kong (11), impact (17), implementation (12), industry (15), information (16), integration (13), knowledge (16), knowledge management (16), machine learning (18), maintenance (18), management (99), methodology (20), models (11), ontology (10), performance (104), quality (10), safety (17), simulation (39), support-system (12), sustainability (34), sustainable construction (11), system (97), systems (36), technology (20)
Cluster 2automation (10), benchmarking (15), civil engineering (10), computer simulation (12), construction equipment (12), construction industry (62), construction projects (52), contractors (19), costs (21), decision making (95), decision support systems (232), decision support tools (18), decision supports (40), efficiency (15), information management (18), investments (17), key performance indicators (11), life cycle (16), managers (13), project management (66), project performance (15), research (12), risk (24), risk analysis (11), risk assessment (32), risk management (26), risks (11), success (11), sustainable development (21)
Cluster 3algorithms (12), artificial intelligence (64), artificial neural network (10), classification (11), construction management (39), cost (19), data mining (17), decision support system (55), decision theory (17), decision trees (16), forecasting (32), fuzzy logic (13), genetic algorithm (12), genetic algorithms (20), mathematical models (15), neural networks (18), neural-network (12), neural-networks (15), optimization (41), planning (12), prediction (24), scheduling (12), support vector machines (13)
Cluster 4AHP (17), analytic hierarchy process (12), case-based reasoning (10), contractor selection (16), criteria (28), decision-making (35), decision-support-system (28), model (115)

References

  1. Sanvido, V.; Grobler, F.; Parfitt, K.; Guvenis, M.; Coyle, M. Critical Success Factors for Construction Projects. J. Constr. Eng. Manag. 1992, 118, 91–111. [Google Scholar] [CrossRef]
  2. Jajac, N.; Marović, I.; Mladineo, M. Planning support concept to implementation of sustainable parking development projects in ancient Mediterranean cities. Croat. Oper. Res. Rev. 2014, 5, 345–359. [Google Scholar] [CrossRef]
  3. Marović, I.; Zavrski, I.; Jajac, N. Ranking zones model—A multicriterial approach to the spatial management of urban areas. Croat. Oper. Res. Rev. 2015, 6, 91–103. [Google Scholar] [CrossRef]
  4. Marović, I.; Hanak, T. Selection of adequate site location during early stages of construction project management: A multi-criteria decision analysis approach. IOP Conf. Ser. Mater. Sci. Eng. 2017, 251, 012044. [Google Scholar] [CrossRef] [Green Version]
  5. Pamukovic, J.K.; Rogulj, K.; Dumanic, D. A Sustainable Approach for the Maintenance of Asphalt Pavement Construction. Sustainability 2021, 13, 109. [Google Scholar] [CrossRef]
  6. Abdulhayoglu, M.A.; Thijs, B. Use of locality sensitive hashing (LSH) algorithm to match Web of Science and Scopus. Scientometrics 2018, 116, 1229–1245. [Google Scholar] [CrossRef]
  7. Zhu, X.; Meng, X.; Zhang, M. Application of multiple criteria decision making methods in construction: A systematic literature review. J. Civ. Eng. Manag. 2021, 27, 372–403. [Google Scholar] [CrossRef]
  8. Zavadskas, E.K.; Vainiūnas, P.; Turskis, Z.; Tamošaitienė, J. Multiple criteria decision support system for assessment of projects managers in construction. Int. J. Inf. Technol. Decis. Mak. 2012, 11, 501–520. [Google Scholar] [CrossRef]
  9. Boddy, S.; Rezgui, Y.; Wetherill, M.; Cooper, G. Knowledge informed decision making in the building lifecycle: An application to the design of a water drainage system. Autom. Constr. 2007, 16, 596–606. [Google Scholar] [CrossRef]
  10. Tam, C.M.; Tong, T.K.L.; Leung, A.W.T.; Chiu, G.W.C.; Leung, W.T.A. Site Layout Planning using Nonstructural Fuzzy Decision Support System. J. Constr. Eng. Manag. 2002, 128, 220–231. [Google Scholar] [CrossRef] [Green Version]
  11. Jelodar, M.B.; Wilkinson, S.; Kalatehjari, R.; Zou, Y. Designing for construction procurement: An integrated Decision Support System for Building Information Modelling. Built Environ. Proj. Asset Manag. 2021, 12, 111–127. [Google Scholar] [CrossRef]
  12. Torrecilla-Garcia, J.A.; Pardo-Ferreira, M.C.; Rubio-Romero, J.C. Overall Introduction to the Framework of BIM-based Digital Twinning in Decision-making in Safety Management in Building Construction Industry. Dir. Organ. 2021, 74, 31–38. [Google Scholar] [CrossRef]
  13. Grant, M.J.; Booth, A. A typology of reviews: An analysis of 14 review types and associated methodologies. Health Inf. Libr. J. 2009, 26, 91–108. [Google Scholar] [CrossRef] [PubMed]
  14. Shi, Y.; Blainey, S.; Sun, C.; Jing, P. A literature review on accessibility using bibliometric analysis techniques. J. Transp. RadioGraphics 2020, 87, 102810. [Google Scholar] [CrossRef]
  15. Choudhri, A.F.; Siddiqui, A.; Khan, N.R.; Cohen, H. Understanding Bibliometric Parameters and Analysis. RadioGraphics 2015, 35, 736–746. [Google Scholar] [CrossRef] [Green Version]
  16. Alonso, S.; Cabrerizo, F.J.; Herrera-Viedma, E.; Herrera, F. h-Index: A review focused in its variants, computation and standardization for different scientific fields. J. Informetr. 2009, 3, 273–289. [Google Scholar] [CrossRef] [Green Version]
  17. Egghe, L. Mathematical theory of the h- and g-index in case of fractional counting of authorship. J. Am. Soc. Inf. Sci. Technol. 2008, 59, 1608–1616. [Google Scholar] [CrossRef]
  18. Hirsch, J.E. An index to quantify an individual’s scientific research output. Proc. Natl. Acad. Sci. USA 2005, 102, 16569–16572. [Google Scholar] [CrossRef] [Green Version]
  19. Hirsch, J.E. An index to quantify an individual’s scientific research output that takes into account the effect of multiple coauthorship. Scientometrics 2010, 85, 741–754. [Google Scholar] [CrossRef] [Green Version]
  20. Kelvin, L. 1893, Lecture to the Institution of Civil Engineers, 3 May 1883. Available online: https://thefutureorganization.com/lord-kelvin-on-measurement/ (accessed on 6 March 2022).
  21. Donthu, N.; Kumar, S.; Mukherjee, D.; Pandey, N.; Lim, W.M. How to conduct a bibliometric analysis: An overview and guidelines. J. Bus. Res. 2021, 133, 285–296. [Google Scholar] [CrossRef]
  22. Aria, M.; Cuccurullo, C. Bibliometrix: An R-tool for comprehensive science mapping analysis. J. Informetr. 2017, 11, 959–975. [Google Scholar] [CrossRef]
  23. Zupic, I.; Čazer, T. Bibliometric methods in management and organization. Organ. Res. Methods 2014, 18, 429–472. [Google Scholar] [CrossRef]
  24. Van Eck, N.J.; Waltman, L. Software survey: VOSviewer, a computer program for bibliometric mapping. Scientometrics 2010, 84, 523–538. [Google Scholar] [CrossRef] [PubMed] [Green Version]
  25. Donthu, N.; Kumar, S.; Pattnaik, D. Forty-five years of Journal of Business Research: A bibliometric analysis. J. Bus. Res. 2020, 109, 1–14. [Google Scholar] [CrossRef]
  26. Garfield, E. From the science of science to Scientometrics visualizing the history of science with HistCite software. J. Inf. 2009, 3, 173–179. [Google Scholar] [CrossRef] [Green Version]
  27. Cui, Y.; Mou, J.; Liu, Y. Knowledge mapping of social commerce research: A visual analysis using CiteSpace. Electron. Commer. Res. 2018, 18, 837–868. [Google Scholar] [CrossRef]
  28. Mrvar, A.; Batagelj, V. Analysis and visualization of large networks with program package Pajek. Complex. Adapt. Syst. Model. 2016, 4, 1–8. [Google Scholar] [CrossRef] [Green Version]
  29. Lewis, D.M.; Alpi, K.M. Bibliometric Network Analysis and Visualization for Serials Librarians: An Introduction to Sci2. Ser. Rev. 2017, 43, 239–245. [Google Scholar] [CrossRef]
  30. Jacsó, P. Calculating the h-index and other bibliometric and scientometric indicators from Google Scholar with the Publish or Perish software. Online Inf. Rev. 2009, 33, 1189–1200. [Google Scholar] [CrossRef] [Green Version]
  31. Machado, F.J.; Martens, C.D.P. Project Management Success: A Bibliometric Analisys. Rev. Gestão Proj. 2015, 6, 28–44. [Google Scholar] [CrossRef] [Green Version]
  32. Guo, Y.-M.; Huang, Z.-L.; Guo, J.; Li, H.; Guo, X.-R.; Nkeli, M.J. Bibliometric Analysis on Smart Cities Research. Sustainability 2019, 11, 3606. [Google Scholar] [CrossRef] [Green Version]
  33. Pranckutė, R. Web of Science (WoS) and Scopus: The Titans of Bibliographic Information in Today’s Academic World. Publications 2021, 9, 12. [Google Scholar] [CrossRef]
  34. Roy-Hubara, N.; Shoval, P.; Sturm, A. A Method for Database Model Selection. Lect. Notes Bus. Inf. Process. 2019, 352, 261–275. [Google Scholar]
  35. Baas, J.; Schotten, M.; Plume, A.; Côté, G.; Karimi, R. Scopus as a curated, high-quality bibliometric data source for academic research in quantitative science studies. Quant. Sci. Stud. 2019, 1, 377–386. [Google Scholar] [CrossRef]
  36. Li, K.; Rollins, J.; Yan, E. Web of Science use in published research and review papers 1997–2017: A selective, dynamic, cross-domain, content-based analysis. Scientometrics 2018, 115, 1–20. [Google Scholar] [CrossRef] [PubMed] [Green Version]
  37. Echchakoui, S. Why and how to merge Scopus and Web of Science during bibliometric analysis: The case of sales force literature from 1912 to 2019. J. Mark. Anal. 2020, 8, 165–184. [Google Scholar] [CrossRef]
  38. Martín-Martín, A.; Orduna-Malea, E.; Thelwall, M.; Delgado López-Cózar, E. Google Scholar, Web of Science, and Scopus: A systematic comparison of citations in 252 subject categories. J. Informetr. 2018, 12, 1160–1177. [Google Scholar] [CrossRef] [Green Version]
  39. Mongeon, P.; Paul-Hus, A. The journal coverage of Web of Science and Scopus: A comparative analysis. Scientometrics 2016, 106, 213–228. [Google Scholar] [CrossRef]
  40. Zhu, J.; Liu, F.; Liu, W. The secrets behind Web of Science’s DOI search. Scientometrics 2019, 119, 1745–1753. [Google Scholar] [CrossRef]
  41. Durán Domínguez, A.; Río Rama, M.D.; Álvarez García, J. Bibliometric analysis of publications on wine tourism in the databases Scopus and WoS. Eur. Res. Manag. Bus. Econ. 2017, 23, 8–15. [Google Scholar] [CrossRef] [Green Version]
  42. Visser, M.; van Eck, N.J.; Waltman, L. Large-scale comparison of bibliographic data sources: Scopus, Web of Science, Dimensions, Crossref, and Microsoft Academic. Quant. Sci. Stud. 2021, 2, 20–41. [Google Scholar] [CrossRef]
  43. Greenwood, D.C. Reliability of journal impact factor rankings. BMC Med. Res. Methodol. 2007, 7, 48. [Google Scholar] [CrossRef] [PubMed] [Green Version]
  44. Seglen, P.O. Why the impact factor of journals should not be used for evaluating research. BMJ 1997, 314, 498–502. [Google Scholar] [CrossRef] [Green Version]
  45. Cascajares, M.; Alcayde, A.; Salmerón-Manzano, E.; Manzano-Agugliaro, F. The Bibliometric Literature on Scopus and WoS: The Medicine and Environmental Sciences Categories as Case of Study. Int. J. Environ. Res. Public Health 2021, 18, 5851. [Google Scholar] [CrossRef]
  46. Van Eck, N.J.; Waltman, L. VOSviewer Manual-Manual for VOSviewer Version 1.6.6. 2017. Available online: https://www.vosviewer.com/documentation/Manual_VOSviewer_1.6.6.pdf (accessed on 2 October 2021).
  47. Huai, C.; Chai, L. A bibliometric analysis on the performance and underlying dynamic patterns of water security research. Scientometrics 2016, 108, 1531–1551. [Google Scholar] [CrossRef]
  48. Zakariyyah, K.I.; John, I.B.; Ijaola, I.A. Cultural orientations and strategic capability for the adoption of building information modeling in construction firms. Eng. Rep. 2021, 3, e12417. [Google Scholar] [CrossRef]
  49. Lasarte, N.; Elguezabal, P.; Sagarna, M.; Leon, I.; Otaduy, J.P. Challenges for Digitalisation in Building Renovation to Enhance the Efficiency of the Process: A Spanish Case Study. Sustainability 2021, 13, 12139. [Google Scholar] [CrossRef]
  50. Camp, R. Benchmarking: The Search for Industry Best Practices That Leads to Superior Performance; ASQC Quality Press: Milwaukee, WI, USA, 1989; p. 299. [Google Scholar]
  51. Kale, S.; Karaman, A.E. Benchmarking the knowledge management practices of construction firms. J. Civ. Eng. Manag. 2012, 18, 335–344. [Google Scholar] [CrossRef] [Green Version]
  52. Spendolini, M.J. The Benchmarking Book; American Management Association: New York, NY, USA, 1992; p. 209. [Google Scholar]
Figure 1. Query defining via Venn diagram.
Sustainability 14 04977 g001
Figure 2. Decomposition of search query. The “*” tag was used to cover as many keyword combinations as possible.
Sustainability 14 04977 g002
Figure 3. Documents by publication year.
Sustainability 14 04977 g003
Figure 4. Country participation in total number of publications.
Sustainability 14 04977 g004
Figure 5. Co-authorship analysis from VOSviewer.
Sustainability 14 04977 g005
Figure 6. Keywords network visualization (VOSviewer).
Sustainability 14 04977 g006
Figure 7. Keyword visualization—development over the years (VOSviewer).
Sustainability 14 04977 g007
Table 1. Difference in Scopus and WoS databases search mode.
DatabaseSearch FieldSearch PhraseStipulated PeriodDocument Type
WoSTS = Topic (title, summary, author’s keywords and keyword plus)TITLE-ABS-KEY((“decision support system*” OR “dss”)AND(“construction” AND (“project*” OR “compan*” OR “organization*” OR “invest*” OR “engineer*”)) AND (“key performance indicator*” OR “kpi” OR “failure” OR “success” OR “prediction*” OR (“performance manag*” OR “performance measur*”) OR “project* perform*”)) AND PUBYEAR > 19992000–2022Articles, Review Articles, Proceedings Papers, Early Access, Book Chapters
ScopusTITLE-ABS-KEY (Article title, Abstract, Keywords)(((TS = (decision support system* OR dss)) AND TS = (construction AND (project* OR compan* OR organization* OR invest* OR engineer*)) AND TS = (key performance indicator* OR kpi OR failure OR success OR prediction* OR performance manag* OR performance measur* OR project* perform*))) AND PY = (2000–2022)>1999Article, Conference Paper, Conference Review, Review, Book Chapter
Table 2. Number of articles found in Scopus and WoS databases.
ScopusWoS
TSD ∪ TSA116,16295,825
TSD ∪ TSB413,234211,561
TSD ∪ TSC3,853,2513,825,406
Total:4,382,6474,132,792
TS = TSD ∪ (TSA ∩ TSB ∩ TSC)343681
Table 3. The process of reducing the amount of data.
ScopusWoS
After the initial search343681
After preliminary cleaning of the documents259569
Identifying duplicates78
Total750
Table 4. Most active countries according to the Scopus, WoS, and merged databases.
ScopusWoSMerged
Country# PublicationsCountry# PublicationsCountry# Publications
USA50People’s R. China116People’s R. China146
People’s R. China36USA113USA145
UK21UK50UK64
Canada17Australia48Australia50
Brazil11Canada37Canada48
Taiwan11Iran26South Korea30
Australia9Malaysia24Malaysia27
South Korea9Taiwan23Taiwan27
Egypt8South Korea22Iran24
India7Italy18Italy24
Table 5. Main affiliations according to Scopus and WoS.
InstitutionCountry# Publications
1Hong Kong Polytechnic UniversityPeople’s R. China27
2University of AlbertaCanada18
3Huazhong University of Science & TechnologyPeople’s R. China17
4National Taiwan University Taiwan16
5University of Hong KongPeople’s R. China11
6Vilnius Gediminas Technical UniversityLithuania11
7National University of SingaporeSingapore11
8Purdue University USA11
9City University of Hong KongPeople’s R. China10
10University of AucklandNew Zealand10
Table 6. Most active institutions and the percentage of their publications produced in collaboration.
Institution# PublicationsCollaboration with Other Scientific InstitutionsIndependent Publication
Hong Kong Polytechnic University2777.78%22.22%
University of Alberta1844.44%55.56%
Huazhong University of Science & Technology1776.47%23.53%
National Taiwan University 1625.00%75.00%
University of Hong Kong1250.00%50.00%
Vilnius Gediminas Technical University1145.45%54.55%
National University of Singapore1172.73%27.27%
Purdue University 1163.64%36.36%
City University of Hong Kong1070.00%30.00%
University of Auckland1030.00%70.00%
Table 7. Journals that published the most.
Sources# PublicationsQuartilleh-IndexImpact Factor 2020CiteScore 2020SJR
Automation in Construction43Q11219.16012.01.837
Engineering Construction and Architectural Management38Q2583.1804.00.585
Journal of Construction Engineering and Management32Q11144.4406.40.967
Sustainability23Q1853.4803.90.612
Journal of Civil Engineering and Management22Q2472.9505.40.529
Journal of Computing in Civil Engineering20Q1734.6407.60.936
Expert Systems with Applications16Q12078.67012.71.368
Journal of Cleaner Production15Q12009.29713.11.937
Journal of Management Engineering14Q1707.1807.91.646
Advanced Engineering Informatics11Q1815.6038.61.107
Table 8. The most active authors according to Scopus, WoS, and merged databases.
ScopusWoSMerged
Author# PublicationsAuthor# PublicationsAuthor# Publications
Cheng, M.Y.5Shen, G.Q.13Shen, G.Q.13
Abourizk, S.5Cheng, M.Y.8AbouRizk, S.12
Mahfouz, T.4Abourizk, S.8Zhang, L.M.11
Zhang, L.M.4Wu, X.7Wu, X.10
Hastak, M.3Zhang, L.M.7Cheng, M.Y.9
Kandil, A.3Ismail, Z.A.6Ismail, Z.A.6
Wu, X.3Turskis, Z.6Turskis, Z.6
Abdelghany, Y.2Zavadskas, E.K.6Zavadskas, E.K.6
Adi, T.J.W.2Ding, L.Y.5Zhang, Y.6
Akbari, S.2Kim, S.5Kim, S.6
Table 9. Top 3 active authors.
AuthorScopusWoS
h-Index# Publications Sum of Times Citedh-Index# Publications Sum of Times Cited
Shen, G.Q.573557277512898293
AbouRizk, S.403563726312203447
Zhang, L.M.281631725251322068
Table 10. List of the most cited papers.
Publication YearTitleAuthorsAffiliationCountry# Citations
2005A fuzzy decision framework for contractor selectionSingh, D.; Tiong, R.L.K.Nanyang Technological Univ.Singapore162
2006Cognitive biases and decision support systems development: a design science approachArnott, D.Monash UniversityAustralia150
2014Building Information Modeling (BIM) application framework: The process of expanding from 3D to computable nDDing, L.Y.; Zhou, Y.; Akinci, B.Huazhong University of Science & TechnologyChina149
Carnegie Mellon Univ.USA
2017Application of the GIS-DANP-MABAC multi-criteria model for selecting the location of wind farms: A case study of Vojvodina, SerbiaGigovic, L.; Pamucar, D.; Bozanic, D.; Ljubojevic, S.Univ. Def. BelgradeSerbia141
2014GIS Based Multi-Criteria Analysis for Industrial Site SelectionRikalovic, A.; Cosic, I.; Lazarevic, D.University of Novi SadSerbia140
2007A hybrid neurogenetic approach for stock forecastingKwon, Y.-K.; Moon, B.-R.Seoul National UniversitySouth Korea131
2013Dynamic life cycle assessment: framework and application to an institutional buildingCollinge, W.O.; Landis, A.E.; Jones, A.K.; Schaefer, L.A.; Bilec, M.M.University of PittsburghUSA129
Arizona State University
2018An Internet of Things-enabled BIM platform for on-site assembly services in prefabricated constructionLi, C.Z.; Xue, F.; Li, X.; Hong, J.K.; Shen, G.Q.Shenzhen UniversityChina117
University of Hong Kong
Hong Kong Polytechnic University
Chongqing University
2010Developing a Risk Assessment Model for construction safetyFung, I.W.H.; Tam, V.W.Y.; Lo, T.Y.; Lu, L.L.H.Western Sydney Univ.Australia115
City University of Hong KongChina
2012Risk analysis during tunnel construction using Bayesian Networks: Porto Metro case studySousa, R.L.; Einstein, H.H.Massachusetts Institute of Technology (MIT)USA115
Table 11. List of the strongest words.
KeywordOccurrencesTotal Link Strength
decision support systems2321123
construction120579
model115509
performance104462
management99432
system97412
decision making95489
project management66427
artificial intelligence64419
construction industry62367
framework61297
design57263
decision support system55211
construction projects52311
selection43219
optimization41175
decision supports40223
construction management39207
simulation39161
Publisher’s Note: MDPI stays neutral with regard to jurisdictional claims in published maps and institutional affiliations.

