Article

Use of Parallel ResNet for High-Performance Pavement Crack Detection and Measurement

1
Key Lab of Digital Signal and Image Processing of Guangdong Province, Shantou 515063, China
2
College of Engineering, Shantou University, Shantou 515063, China
3
Department of Mechanical and Electrical Engineering, Shantou Polytechnic, Shantou 515078, China
4
Guangzhou Environmental Protection Investment Nansha Environmental Energy Co., Ltd., Guangzhou 511470, China
5
Department of Civil, Construction and Environmental Engineering, Sapienza University, Via Eudossiana, 18-00184 Rome, Italy
*
Authors to whom correspondence should be addressed.
Sustainability 2022, 14(3), 1825; https://doi.org/10.3390/su14031825
Submission received: 24 December 2021 / Revised: 25 January 2022 / Accepted: 31 January 2022 / Published: 5 February 2022
(This article belongs to the Special Issue Transportation Safety and Pavement Management)

Abstract

:
In the process of road pavement health and safety assessment, crack detection plays a pivotal role in a preventive maintenance strategy. Recently, Convolutional Neural Networks (CNNs) have been applied to automatically identify the cracks on concrete pavements. The effectiveness of a CNN-based road crack detection and measurement method depends on several factors, including the image segmentation of cracks with complex topology, the inference of noises with similar texture to the distress, and the sensitivity to thin cracks. The presence of shadows, strong light reflections, and road markings can also severely affect the accuracy in detection and measurement. In this study, a review of the state-of-the-art CNN methods for crack identification is presented, paying attention to existing limitations. Then, a novel deep residual convolutional neural network (Parallel ResNet) is proposed with the aim of creating a high-performance pavement crack detection and measurement system. The challenge and special feature of Parallel ResNet is to remove the noise inference, identifying even thin and complex cracks correctly. The performance of Parallel ResNet has been investigated on two publicly available datasets (CrackTree200 and CFD), comparing it with that of competing methods suggested in the literature. Parallel ResNet reached the maximum scores in Precision (94.27%), Recall (92.52%), and F1 (93.08%) using the CrackTree200 dataset. Similarly, for the CFD dataset the novel method achieved high values in Precision (96.21%), Recall (95.12%), and F1 (95.63%). Based on the crack detection and image recognition results, mathematical morphology was then used to further minimize noise and accurately segment the road diseases, obtaining the outer contours of the connected domain in crack images. Therefore, crack skeletons have been extracted to measure the distress length, width, and area on images of rigid pavements. The experimental results show that Parallel ResNet can effectively minimize noise to obtain the geometry of cracks. The results of crack characteristic measurements are accurate and Parallel ResNet can be assumed as a reliable method in pavement crack image analysis, in order to plan the best road maintenance strategy.

1. Introduction

Monitoring, measuring, and evaluating pavement conditions are essential parts of road pavement maintenance activities, due to the perspective to plan corrective actions [1,2]. Cracking is one of the most common road diseases [3,4]. The identification of cracks is a highly attractive problem as it allows the planning of the most efficient preventive maintenance interventions; in fact, cracks activate the main degradation phenomena of the pavement [5,6]. To recognize the extent of the crack and the corresponding degree of severity found during the inspection allows the assessment of the level of pavement decay. As proof, the commonly used Pavement Condition Index (PCI) [7] provides a global assessment of flexible or rigid pavements by distinguishing the extent and severity of each defect. Traditional road crack detection methods are time consuming, wasteful, and subjective [8,9,10]. Recent advances in technology had a significant impact in the field of pavement distress evaluation and measurement, making it possible to analyze the damage more quickly and reliably than consolidated methods [11,12,13]. Hence, the road managers can prioritize and plan the maintenance of the road network, in order to keep the infrastructure in good condition and to extend their service life [14].
Crack identification systems based on digital image processing have already been used in the detection of transport infrastructures such as highways, tunnels, and bridges [15,16,17]. This approach requires image acquisition hardware and image detection software. Road surface images are typically collected by multi-functional road detection vehicles or surveyor robots [10,18]. Cracks in the images are distinguished into linear cracks and complex cracks (block or network cracks): linear cracks are evaluated by measuring the average width and length of cracks, while complex cracks are measured using the average crack width and crack area [7]. The original images are generally processed using the main algorithms of pre-processing, threshold segmentation, edge segmentation, and mathematical morphology [16,17,19].
In recent years, digital image detection based on machine learning algorithms or deep neural networks has been applied in many fields, such as equipment fault diagnosis, medical image classification, and facial recognition [20,21,22]. At the same time, it has also been used to automatically identify cracks on concrete pavements [23], with reliable detection results. However, some issues limit the automatic detection of road surface cracks based on digital image processing. Firstly, the problem of inaccurate crack detection with complex topology and noise inference should be solved [12,23,24,25]. Furthermore, it is very difficult to distinguish between certain noises in the image background (e.g., characterized by a dark and thin nature) and cracks. Then, the detection accuracy is low and the measurement error is very large on thin cracks or with complex topology [10,26,27].
In order to overcome the above-discussed problems of well-known road crack detection and measurement systems, in this study the Convolutional Neural Network (CNN) structure is improved by combining a fully convolutional layer network [28] and residual network [29]. Thus, in this study is proposed a novel parallel residual CNN, namely Parallel ResNet, with multiple branches of parallel structures, regularizing the loss function.
The mathematical morphology method to further filter noise, to eliminate blur, and to segment cracks is applied. Using the medial axis skeleton algorithm [30,31], the crack skeleton and the contour of the disease’s connected domain is extracted. The primary goals are the reduction in error when measuring the maximum and average crack width, distress length and area. Therefore, the proposed pavement crack detection and measurement method can improve the accuracy and reliability in road health assessment systems.

2. Related Works

This section briefly reviews the literature on automatic crack detection and measurement methods based on image processing applications.

2.1. Crack Detection

First studies on crack detection using image processing are related to the intensity-threshold approach, due to its simplicity and efficiency [32]. However, this method is generally suitable for image processing with consistent background grayscale, uniform illumination, and high contrast.
The gray level of the crack edge has an obvious step phenomenon and the background gray level changes slowly, so the crack target can also be segmented by detecting the edge using algorithms such as Roberts, Sobel, Canny, Prewit, or Log [33]. Qu et al. in [34] adopted basic mathematical morphology operations to complete the identification and connection of linear crack targets: too many threshold settings reduce the adoption of similar approaches. On the other hand, the segmentation algorithm of edge detection is mostly based on the local gray and gradient information to identify the crack edge, which is only suitable for crack maps with a strong edge label [35].
Kass et al. in [36] proposed the Minimal Path Method (MPM) to extract simple open curves from images, in order to avoid false detections and to measure the width of the cracks. Some researchers in [37] introduced an approach that selects endpoints globally, and then obtains a minimum path. Nguyen et al. in [38] applied Free-From Anisotropy to consider intensity and crack form features for detection on pavement surface images.
As the image data size increases, several studies have considered the use of image processing and machine learning approaches. Statistical analysis are the most popular and widely used methodological approaches [39,40]. Delagnes and Barba in [41] suggested the detection of poorly contrasted cracks in textured areas using a Markov random field model. Wang et al. in [20] employed a Support Vector Machine (SVM) to recognize aircraft skin cracks. Bray et al. in [42] used the neural networks classification approach to identify road defects. Yang et al. in [28] adopted artificial neural network models to separate crack pixels from the background by selecting appropriate thresholds. However, all these methods had disadvantages in detecting the complete crack structure over the entire image. Shi et al. in [24] proposed an automatic road crack detection method, i.e., CrackForest, based on random structured forests. The main purpose of this system is to characterize the distress and eliminate noise marked as cracks by learning the inherent structured information of road diseases. Low accuracy in complex crack detection is the biggest limitation of the CrackForest algorithm.
Deep learning is a subfield of machine learning. In recent years, Convolutional Neural Networks have not only performed better in multi-class classification tasks but have also made significant progress in segmentation and concrete cracks detection. Chambon and Moliard in [43] presented a comparative study of deep learning software frameworks, network architectures, selected hyper-parameters, and crack detection performances. Some researchers in [28,30] adopted the Fully Convolutional Network (FCN) to achieve automated road crack detection and measurement. Liu et al. in [44] applied U-net, an encoder–decoder network approach, to detect concrete cracks. In more detail, the encoder network is similar to a VGG-16 deep convolutional neural network, and it includes an up sampling layer and dense skip connection. The U-net-based method showed high effectiveness, good robustness, and better accuracy than previous FCNs. Liu et al. in [45] proposed a two-step pavement crack detection and segmentation method based on CNN. The method combines the detection and segmentation of cracks on the pavement together, so that the cracks found in the first step are segmented in the second step to improve accuracy. Lau et al. in [46] proposed a U-Net-based network architecture with an encoder of pre-trained ResNet-34. In this study, techniques such as freezing the layer groups, assigning different learning rates to each layer group, and incrementally increasing the image size were adopted. Song et al. in [47] proposed the Multi-scale Feature Attention Network as an innovative approach to automatically identify cracks. Some researchers in [23] involved the use of a cross-entropy loss function and the VGG16 network model for crack detection on concrete pavements. He et al. in [29] adopted the Residual Network (ResNet), which solved the network degradation problem with the residual network, a 152-layer successfully trained neural network. ResNet can obtain higher accuracy than VGGNet and GoogleNet, and higher computational efficiency than VGGNet. Shortcut connections in the ResNet realizes identity mapping, so the data stream can flow across layers, and a deeper network should improve image recognition. Kumar et al. in [21] proposed an ensemble of Fine-Tuned Convolutional Neural Networks for medical image classification. Veit Andreas et al. in [48] showed how residual networks work as relatively shallow networks.

2.2. Crack Measurement
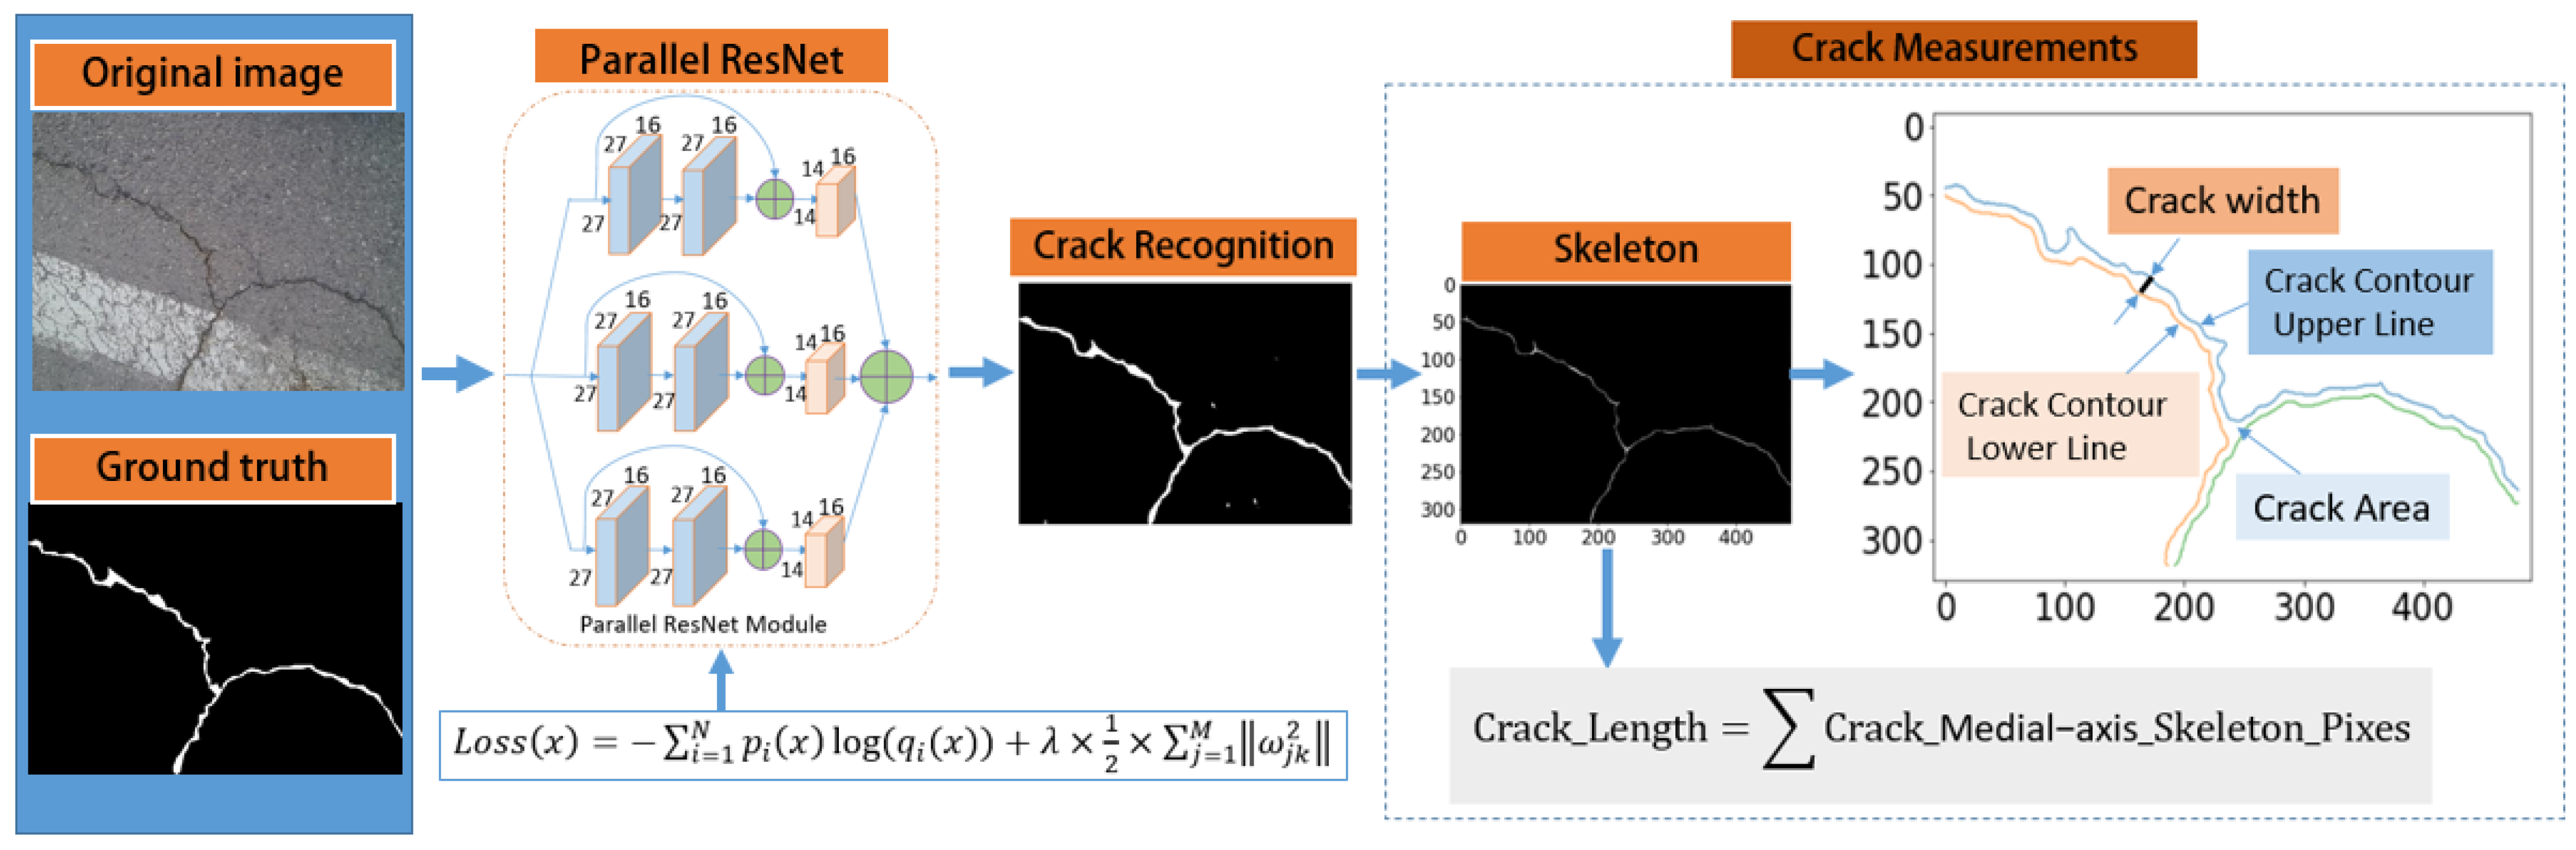
Several researchers have focused on techniques to measure the width, length, and area of cracks: they are important factors in road safety diagnosis. Shan et al. in [49] pointed out that the type, number, width and length of road cracks represent the early levels of decay of concrete structures. Hyunwoo Cho et al. in [50] proposed a Crack Width Transform Method, that can be summarized in the following steps: (I) crack width transform, (II) aspect ratio filtering, (III) crack region search, (IV) hole filling, and (V) relative thresholding. The method has high accuracy and consistency in linear or simple crack width measurements.
Thinning algorithms for binary images can extract crack skeletons. Peleg et al. in [51] proposed an index table thinning algorithm, which can extract crack skeletons. However, the skeleton shape is easy to be deformed, and a spiculated margin is produced in the process of thinning. In this regard, the Hilditch thinning algorithm [52] reduces the distortion and the spiculated margin. However, due to too many conditions and the computational complexity, significant resources are required and the processing speed is slow. Zhang and Suen in [53] refined the algorithm: the processing speed is improved, but a single pixel of thinning cannot be guaranteed, the bifurcation point is difficult to find, and the thinning process has a spiculated margin. Some researchers in [27,54] pointed out that many methods were used for crack width measurement: commonly, the left and right boundary method, skeleton point oblique method and boundary point minimum distance method have been applied to crack width measurement. The crack length can be calculated from the crack skeleton, and the fracture area from the pixel statistical method. However, the skeleton extraction process of cracks with complex topology creates more spiculated margins.

3. Methodology

In this section, a novel method for crack detection and measurement based on raw input road surface images is presented. The overall procedure of the proposed approach is summarized in Figure 1.
A deep residual convolutional neural network, namely Parallel ResNet, is adopted to improve the crack detection performance of CNNs. The main features of the model include skip connection convolutional layer, parallel neural network structure, regularized loss function, and convolutional layer with a stride equal to 2. Supervised learning analyzes the crack image dataset (necessary for training) and yields the crack recognition as output.
The additional task of the novel approach is the crack measurement. The mathematical morphology method is employed to further sort out blur and noise and effectively segment the crack. Then, the crack skeleton is extracted by the medial axis skeleton algorithm from the crack recognition image. The crack length is calculated considering the total number of pixels of the crack skeletons with single pixel width. The outer contours of the connected domain are also extracted for the crack. Finally, the use of the normal vertical crack skeleton method allows the crack width and area of each connected domain to be measured and the crack characteristics to be counted, such as the crack width and area of the entire image.

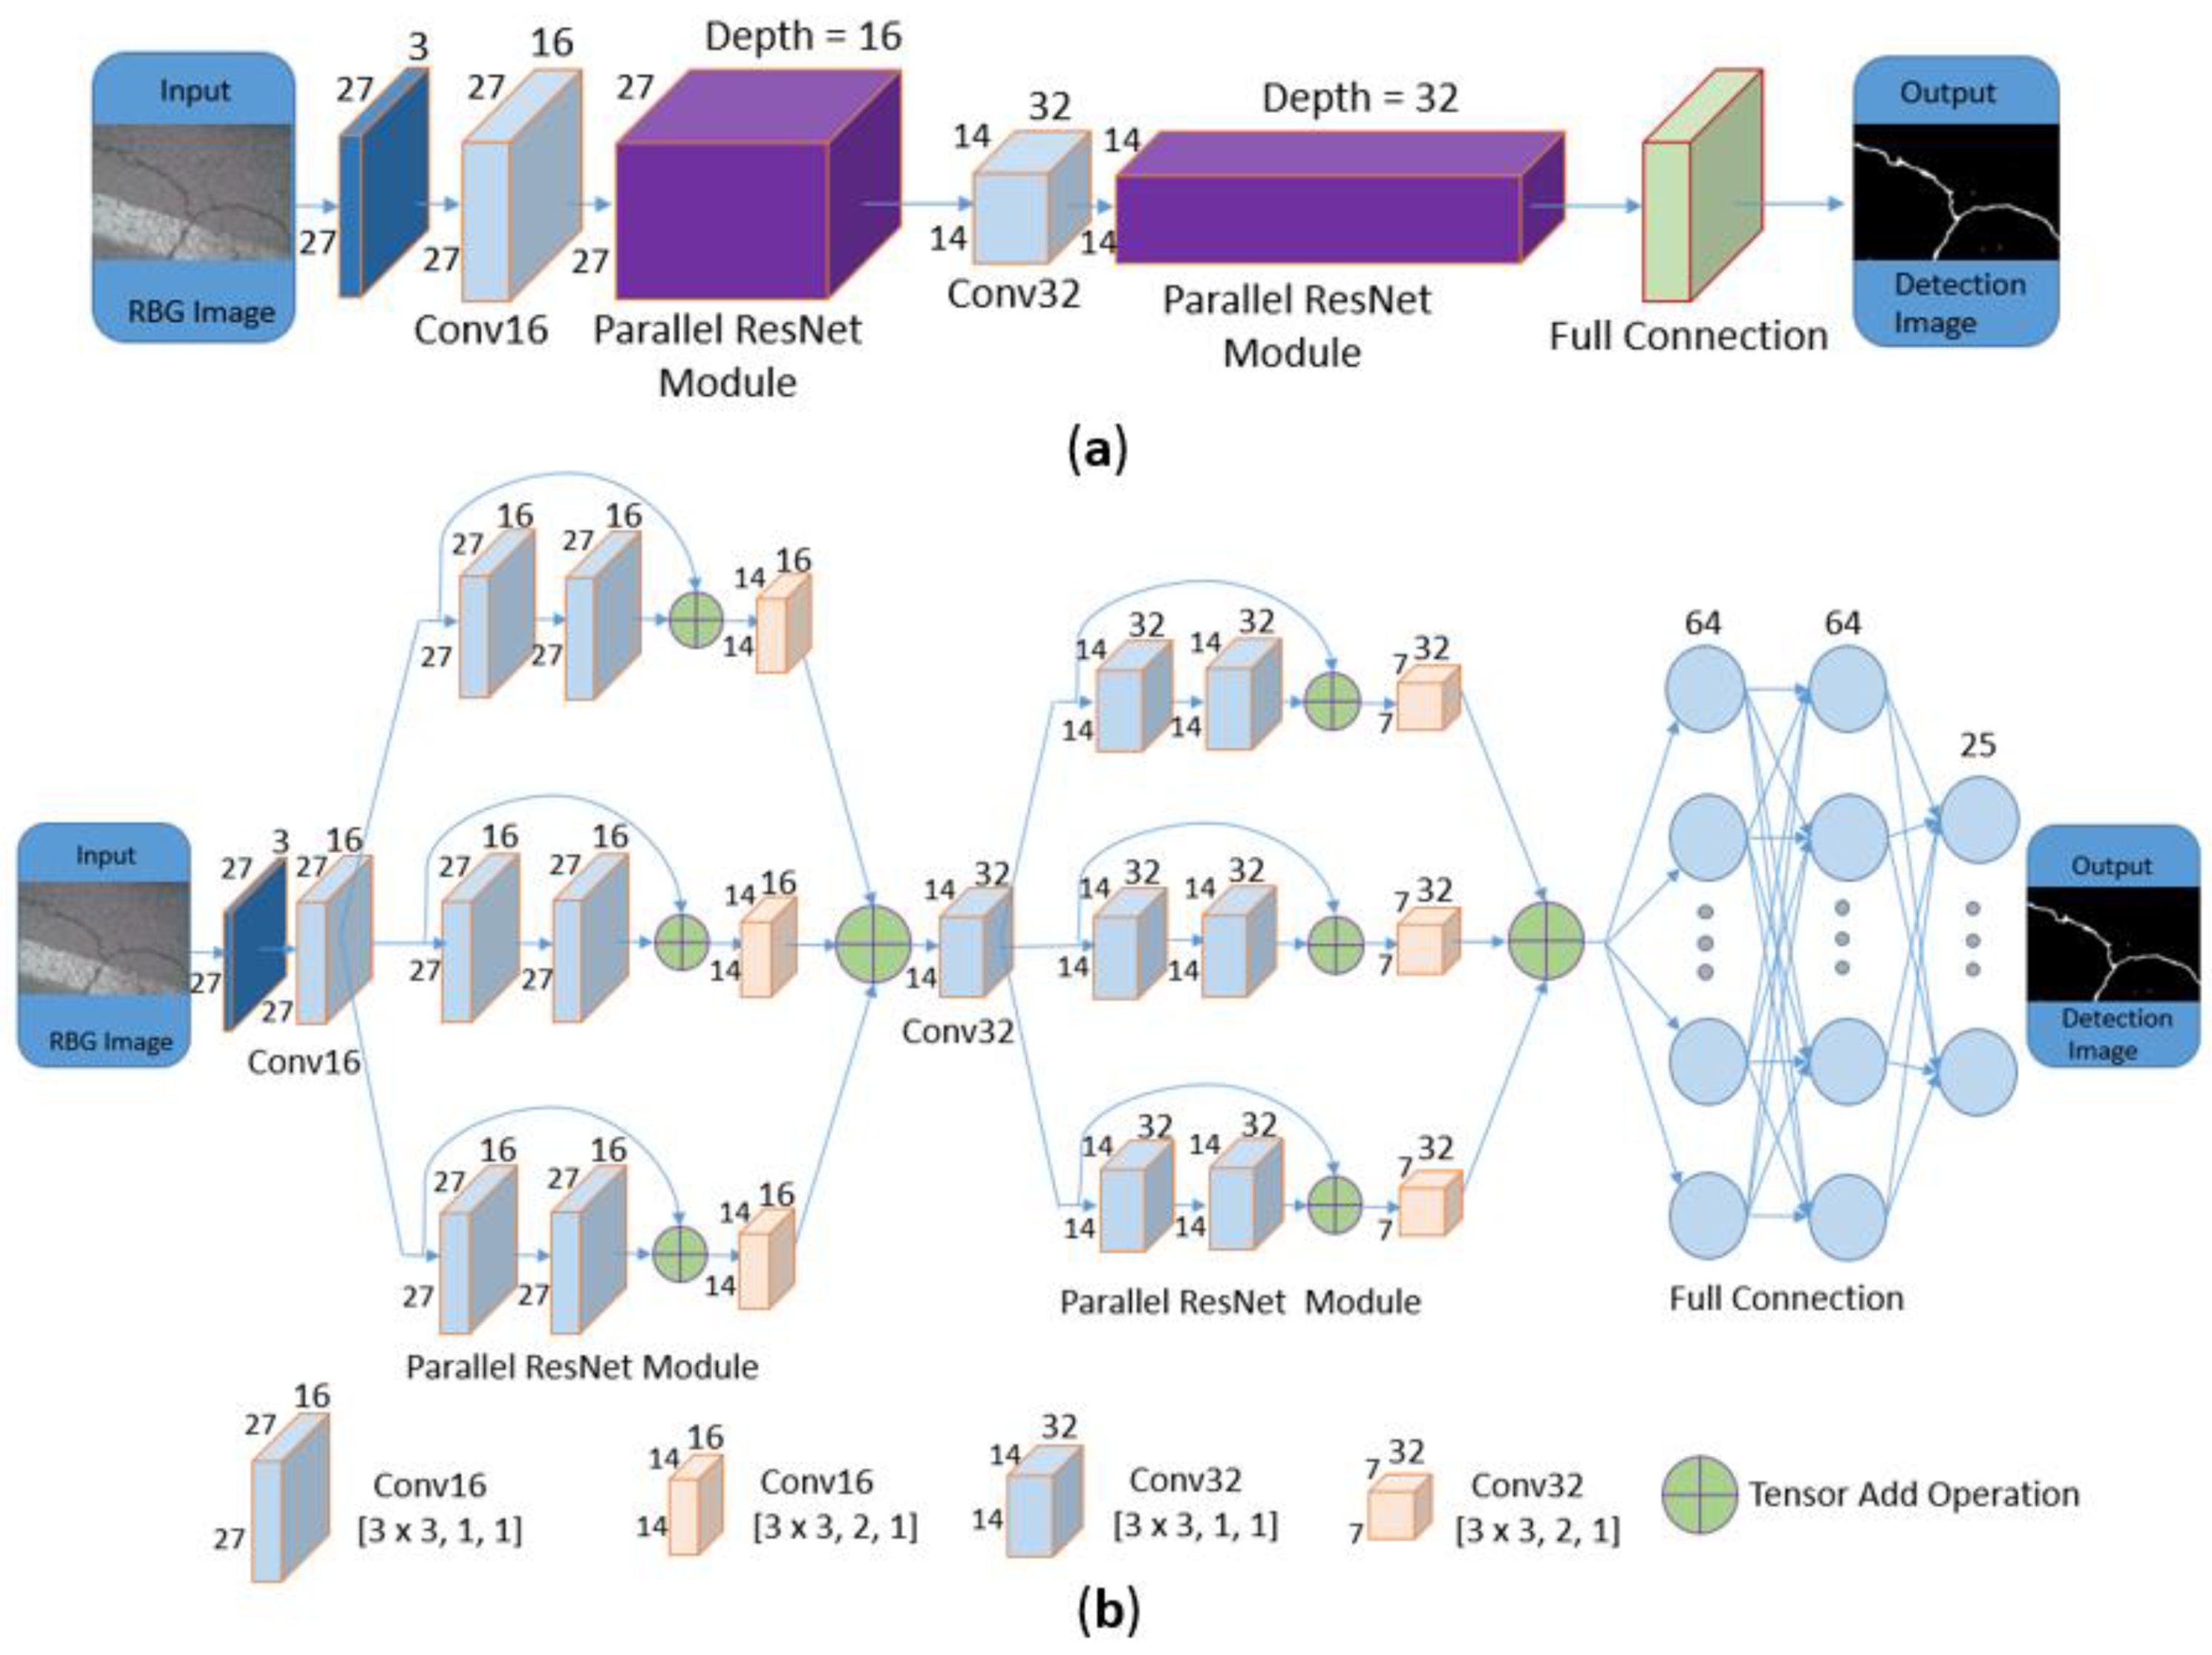
3.1. Automatic Pavement Crack Detection Method

In this research, the innovative approach involves the multi-branch parallel combination of deep convolutional network structures, with the aim of providing a more accurate and efficient detection method than the single branch structure. This assumption is in accordance with real-life situations: the results obtained by merging the knowledge in crack identification from different people are more reliable than the ones obtained from a single person. The criterion is explained through the example in Figure 2.
The proposed methodology focuses on the implementation of residual convolutional neural networks. This classical CNN architecture adopts skip connection to return the feature map of a certain layer to the next one, or even deeper, avoiding the network model degradation due to gradient disappearance and explosion. Then, a parallel structure module of residual networks is introduced, which is based on the idea of paralleling multiple residual networks, replacing the traditional pooling layer with a convolutional layer characterized by a stride of 2, and regularizing the loss function.
The Parallel ResNet architecture, in the case of a number of branches equal to 3, is described in Table 1.
The symbol represents the tensor add operation, the terms “Conv*”, “Conv_*” and “Conv_*_*all” are convolutional layers: for example, in Conv16 [3 × 3, 1, 1] the depth is 16, kernel size is 3 × 3, stride is 1, and with zero padding. The term “FC-*” represents the full connection layer. The output patch 5 × 5 is a structured prediction center based on the input patch 27 × 27. In the final output, the activation function sigmoid is used for the binary classification task. The Rectified Linear Unit (ReLU) is employed to increase the non-linearity for hidden layers.
The Parallel ResNet architecture forward propagation diagram is described in Figure 3a: the size of the input patch is 27 × 27 with three channels; other cubes indicate the feature maps obtained from the convolutional layer (Conv), Parallel Residual Convolutional Neural Network Module (the Parallel ResNet Module), and Full Connection. An exploded view of the Parallel ResNet Module is shown in Figure 3b.
Additional information is provided for a better understanding of the discussed architecture. The convolutional layer (Conv) plays a key role in CNN. In the process of data transmission, sparse interaction and parameter sharing are realized, which reduce the number of parameters in the CNN model and allow the extraction of useful feature information. Turning to mathematics, Equation (1) represents the convolutional operation of the convolutional layer:
C o n v ( x ) i , j = m n X i m ,   j n K m , n
where X is the two-dimensional input matrix; K is the convolutional kernel; and m and n are the row and column values of the convolutional kernel. In expanded form, Equation (1) is rewritten considering two different values of stride, for example, equal to 1 and 2 (Equations (2) and (3), respectively).
[ a b c e f g   d h ] [ i j k l ] = [ a i + b j + e k + f l   b i + c j + f k + g l   c i + d j + f k + h l ]
[ a b c e f g   d h ] [ i j k l ] = [ a i + b j + e k + f l   c i + d j + f k + h l ]
where [ a b c e f g   d h ] is the input two-dimensional tensor; and [ i j k l ] is a 2 × 2 convolutional kernel tensor.
Based on the convolutional layer parallel structure of the concept-v3 model [12,54], this paper proposes a network structure with a multiple skip connection convolutional layer (residual block) connected in parallel, i.e., the Parallel ResNet Module (Figure 4). For a better comprehension, it is distinguished in:
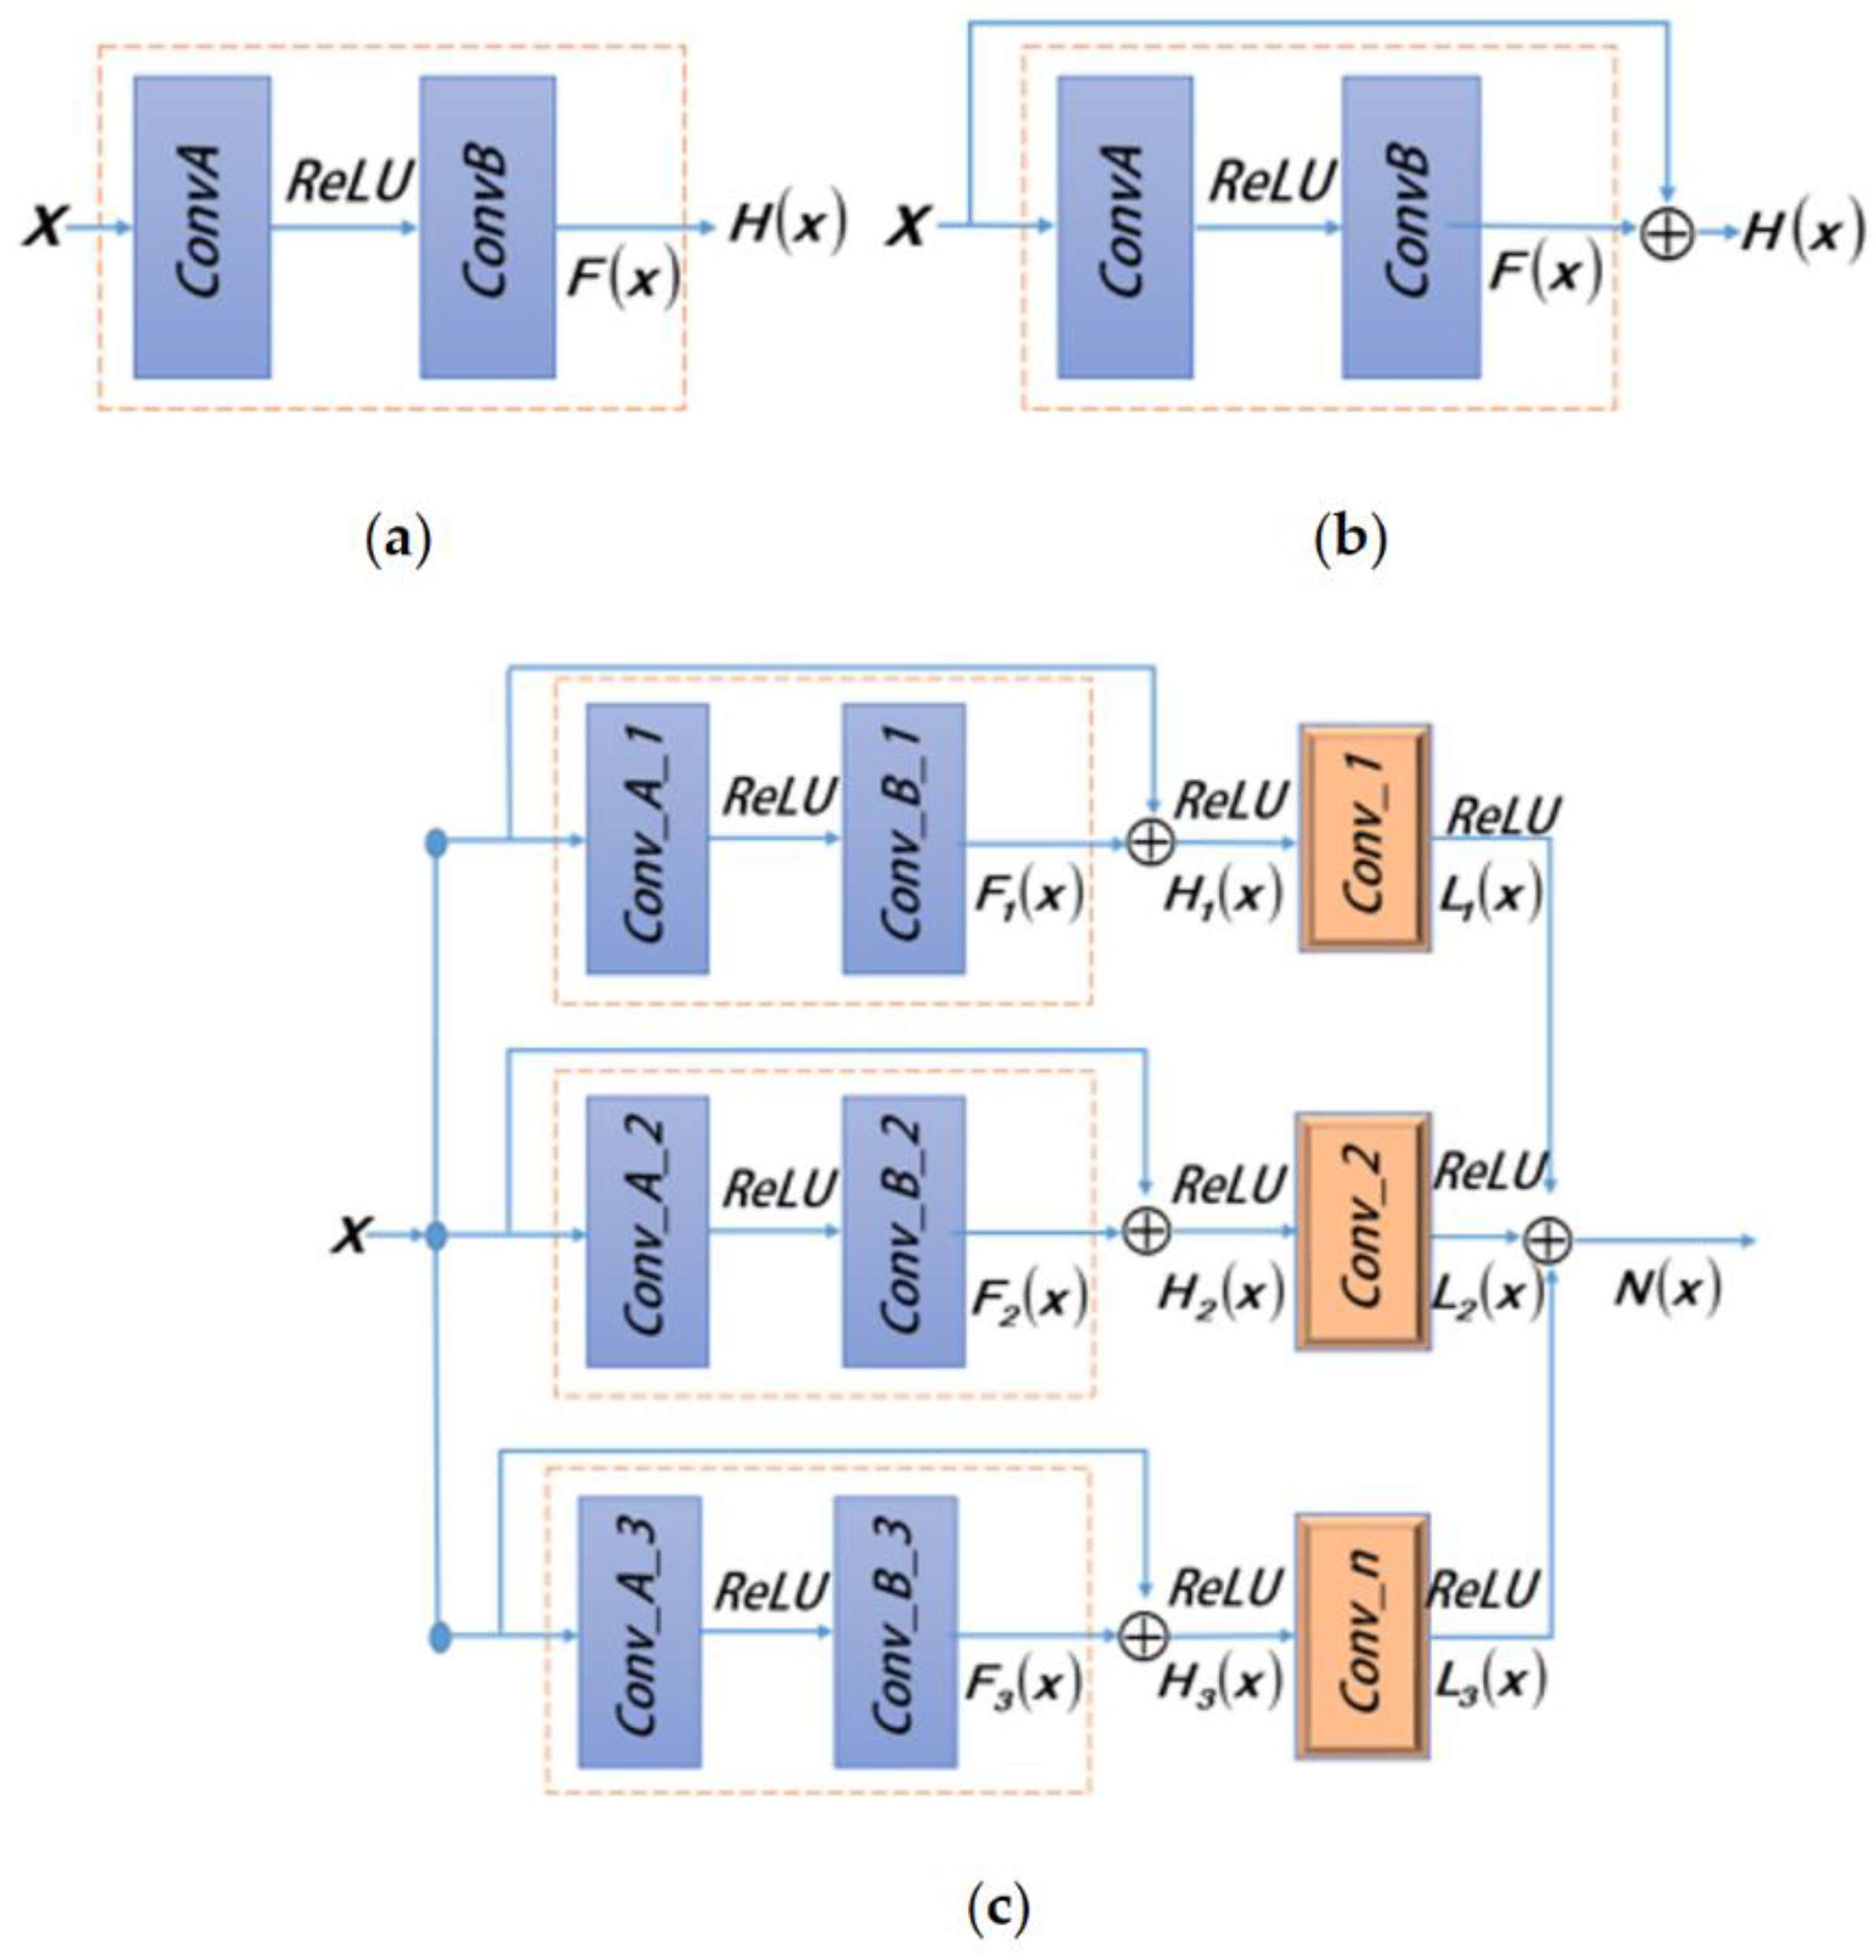
  • Figure 4a, which represents two standard convolutional layers. The related function is defined by Equation (4):
H ( x ) = F ( x )
  • Figure 4b, which shows a residual module skipping two convolutional layers (L = 2). The mathematical expression is described by Equation (5):
H ( x ) = F ( x ) + x
  • Figure 4c, a Parallel ResNet module with three branches in parallel. The structure of each branch in the parallel module is the same. For example, the first parallel branch is composed of a residual block skipping two convolutional layers (Conv_A_1 and Conv_B_1), and a convolutional layer (Conv_1) with a stride of 2. Finally, through the add operation, the module outputs N ( x )
.
The Parallel ResNet module function is described by the following Equations (6)–(10):
H i ( x ) = x l + k = l L F i ( x k )
F i ( x k ) = f ( C 0 k , C 1 k , , C c k )
C m k = n x m x i k 1 w n m l + b m l
L i ( x ) = H i ( x ) W i + t i
N ( x ) = i = 1 n L i ( x )
where H ( x ) is the output of the residual module; L is the number of skip layers; F ( x k ) represents the output after C k is activated; C m k is the m-th channel of the k-th layer’s characteristic graph; the function f ( ) is the ReLU activation function; χ m represents the subset of the input feature used to calculate C i k ; w n m l is the convolutional kernel matrix which size is 3 × 3 ; L i ( x ) is the output tensor of the convolutional layer with a stride equal to 2; denotes the convolution operation symbol; W i is the convolutional kernel matrix which size is also 3 × 3 ; and n is the number of batch elements.
The Parallel ResNet module, compared with standard convolutional modules, has the following advantages:
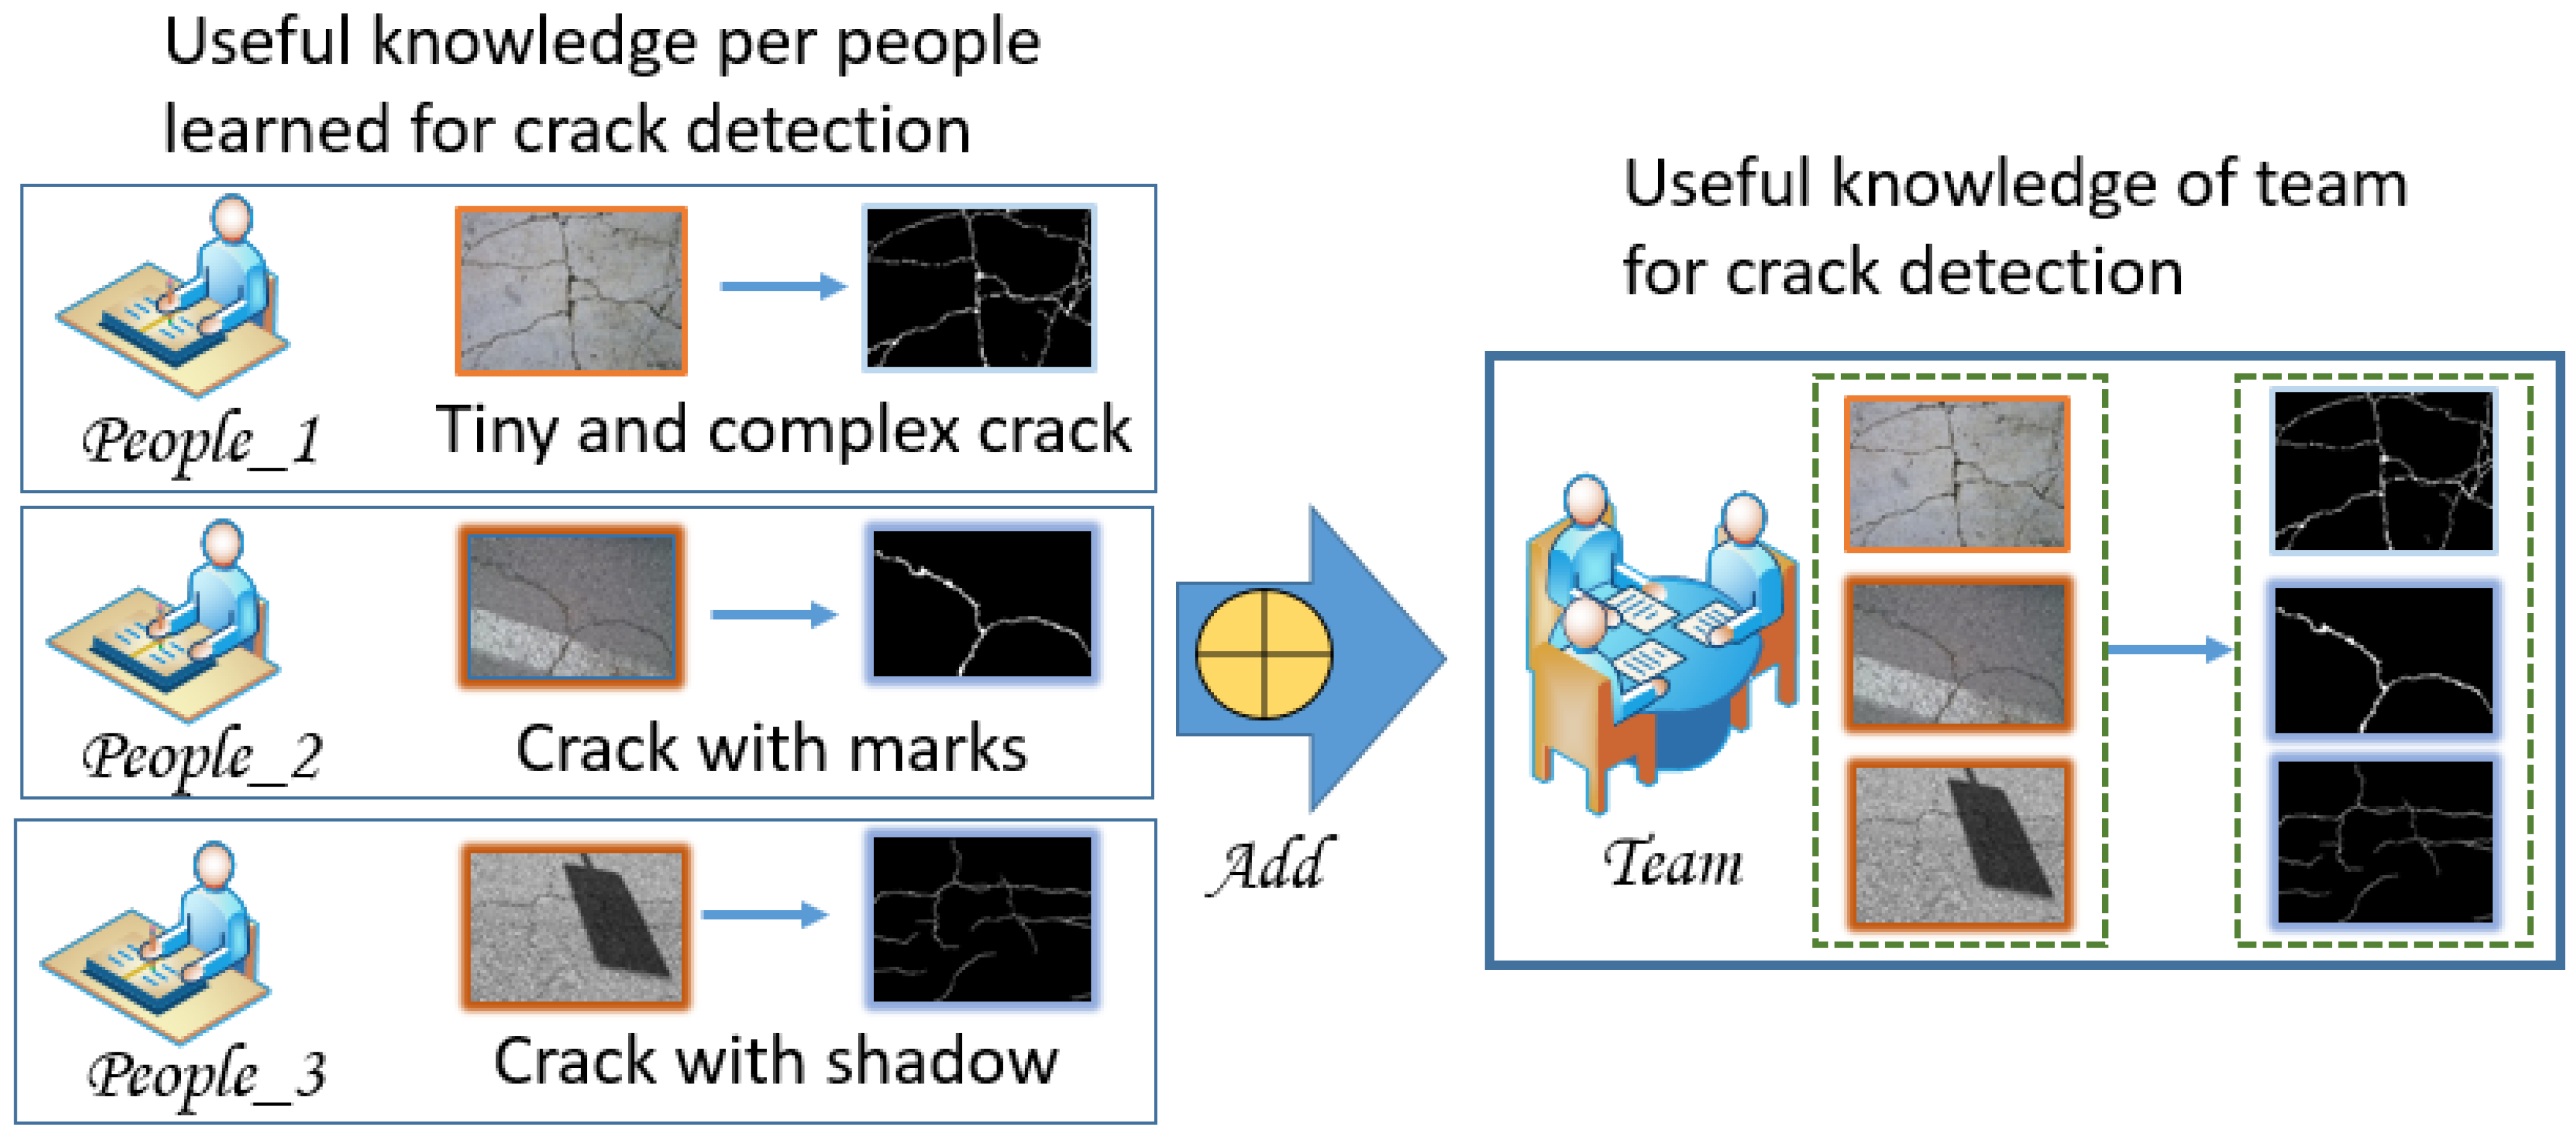
  • In the forward propagation of each branch, if the weights in the convolutional layer (Figure 2a) have not learned any information, it is equivalent to performing an identity transformation. If the convolutional layer has learned some useful knowledge, then it may have a better learning ability than the identity function;
  • The skip connects change the output function of convolutional layer training from H ( x ) to H ( x ) = F ( x ) + x . This ensures that the gradient calculated for H ( x ) does not tend to zero in the process of back propagation. In addition, in back propagation, the residual block is more sensitive to the change of output, and can adjust the weight more finely than the standard convolutional layer;
  • A parallel structure, through multiple branches in parallel, can learn more useful knowledge and can identify crack features in the training and learning phases.
Regularizing the loss function is another important issue to be considered in the developed methodology. Cross entropy is a common loss function, and it can be calculated as follows (Equation (11)):
L o s s ( x ) = i = 1 N p i ( x ) log ( q i ( x ) )
where L o s s ( x ) represents regularizing the loss function; N is the number of batch elements; x is an input batch; and p i ( x ) and q i ( x ) are the actual probability and model prediction probability that the input batch belongs to the ith type.
After performing L2 regularization on the unit, the formula can be rewritten as follows (Equation (12)):
L o s s ( x ) = i = 1 N p i ( x ) log ( q i ( x ) ) + λ j = 1 M ω j 2
where M is the number of parameters in the regularization part; ω is the parameter item involved in the regularization; λ is the regularization coefficient, which defines the degree of regularization; and represents the L2 regularization method.
The regularization coefficient L2 limits the size of the parameter values and can prevent overfitting. During the tests, the regularization coefficient is set to 0.0005. In the crack detection method of Parallel ResNet, the convolutional kernel weight of a branch in the Parallel ResNet Module is randomly selected in the regularization process to participate in the L2 regularization calculation. In TensorFlow 2.0, the L2 regularization method is adopted ( R ( ω ) = ω 2 2 = 1 2 × j | ω j 2 | ). Therefore, the derived expression (Equation (13)) can be written:
L o s s ( x ) = i = 1 N p i ( x ) log ( q i ( x ) ) + λ × 1 2 × j = 1 M ω j k 2
where k = R a n d ( b r a n c h s ) ; and λ in this study is set to 0.0005.
A branch of the Parallel ResNet module is randomly selected for L2 regularization to provide a greater diversity of parameter learning and updating, which avoids over fitting and is useful in achieving the global optimal solution.

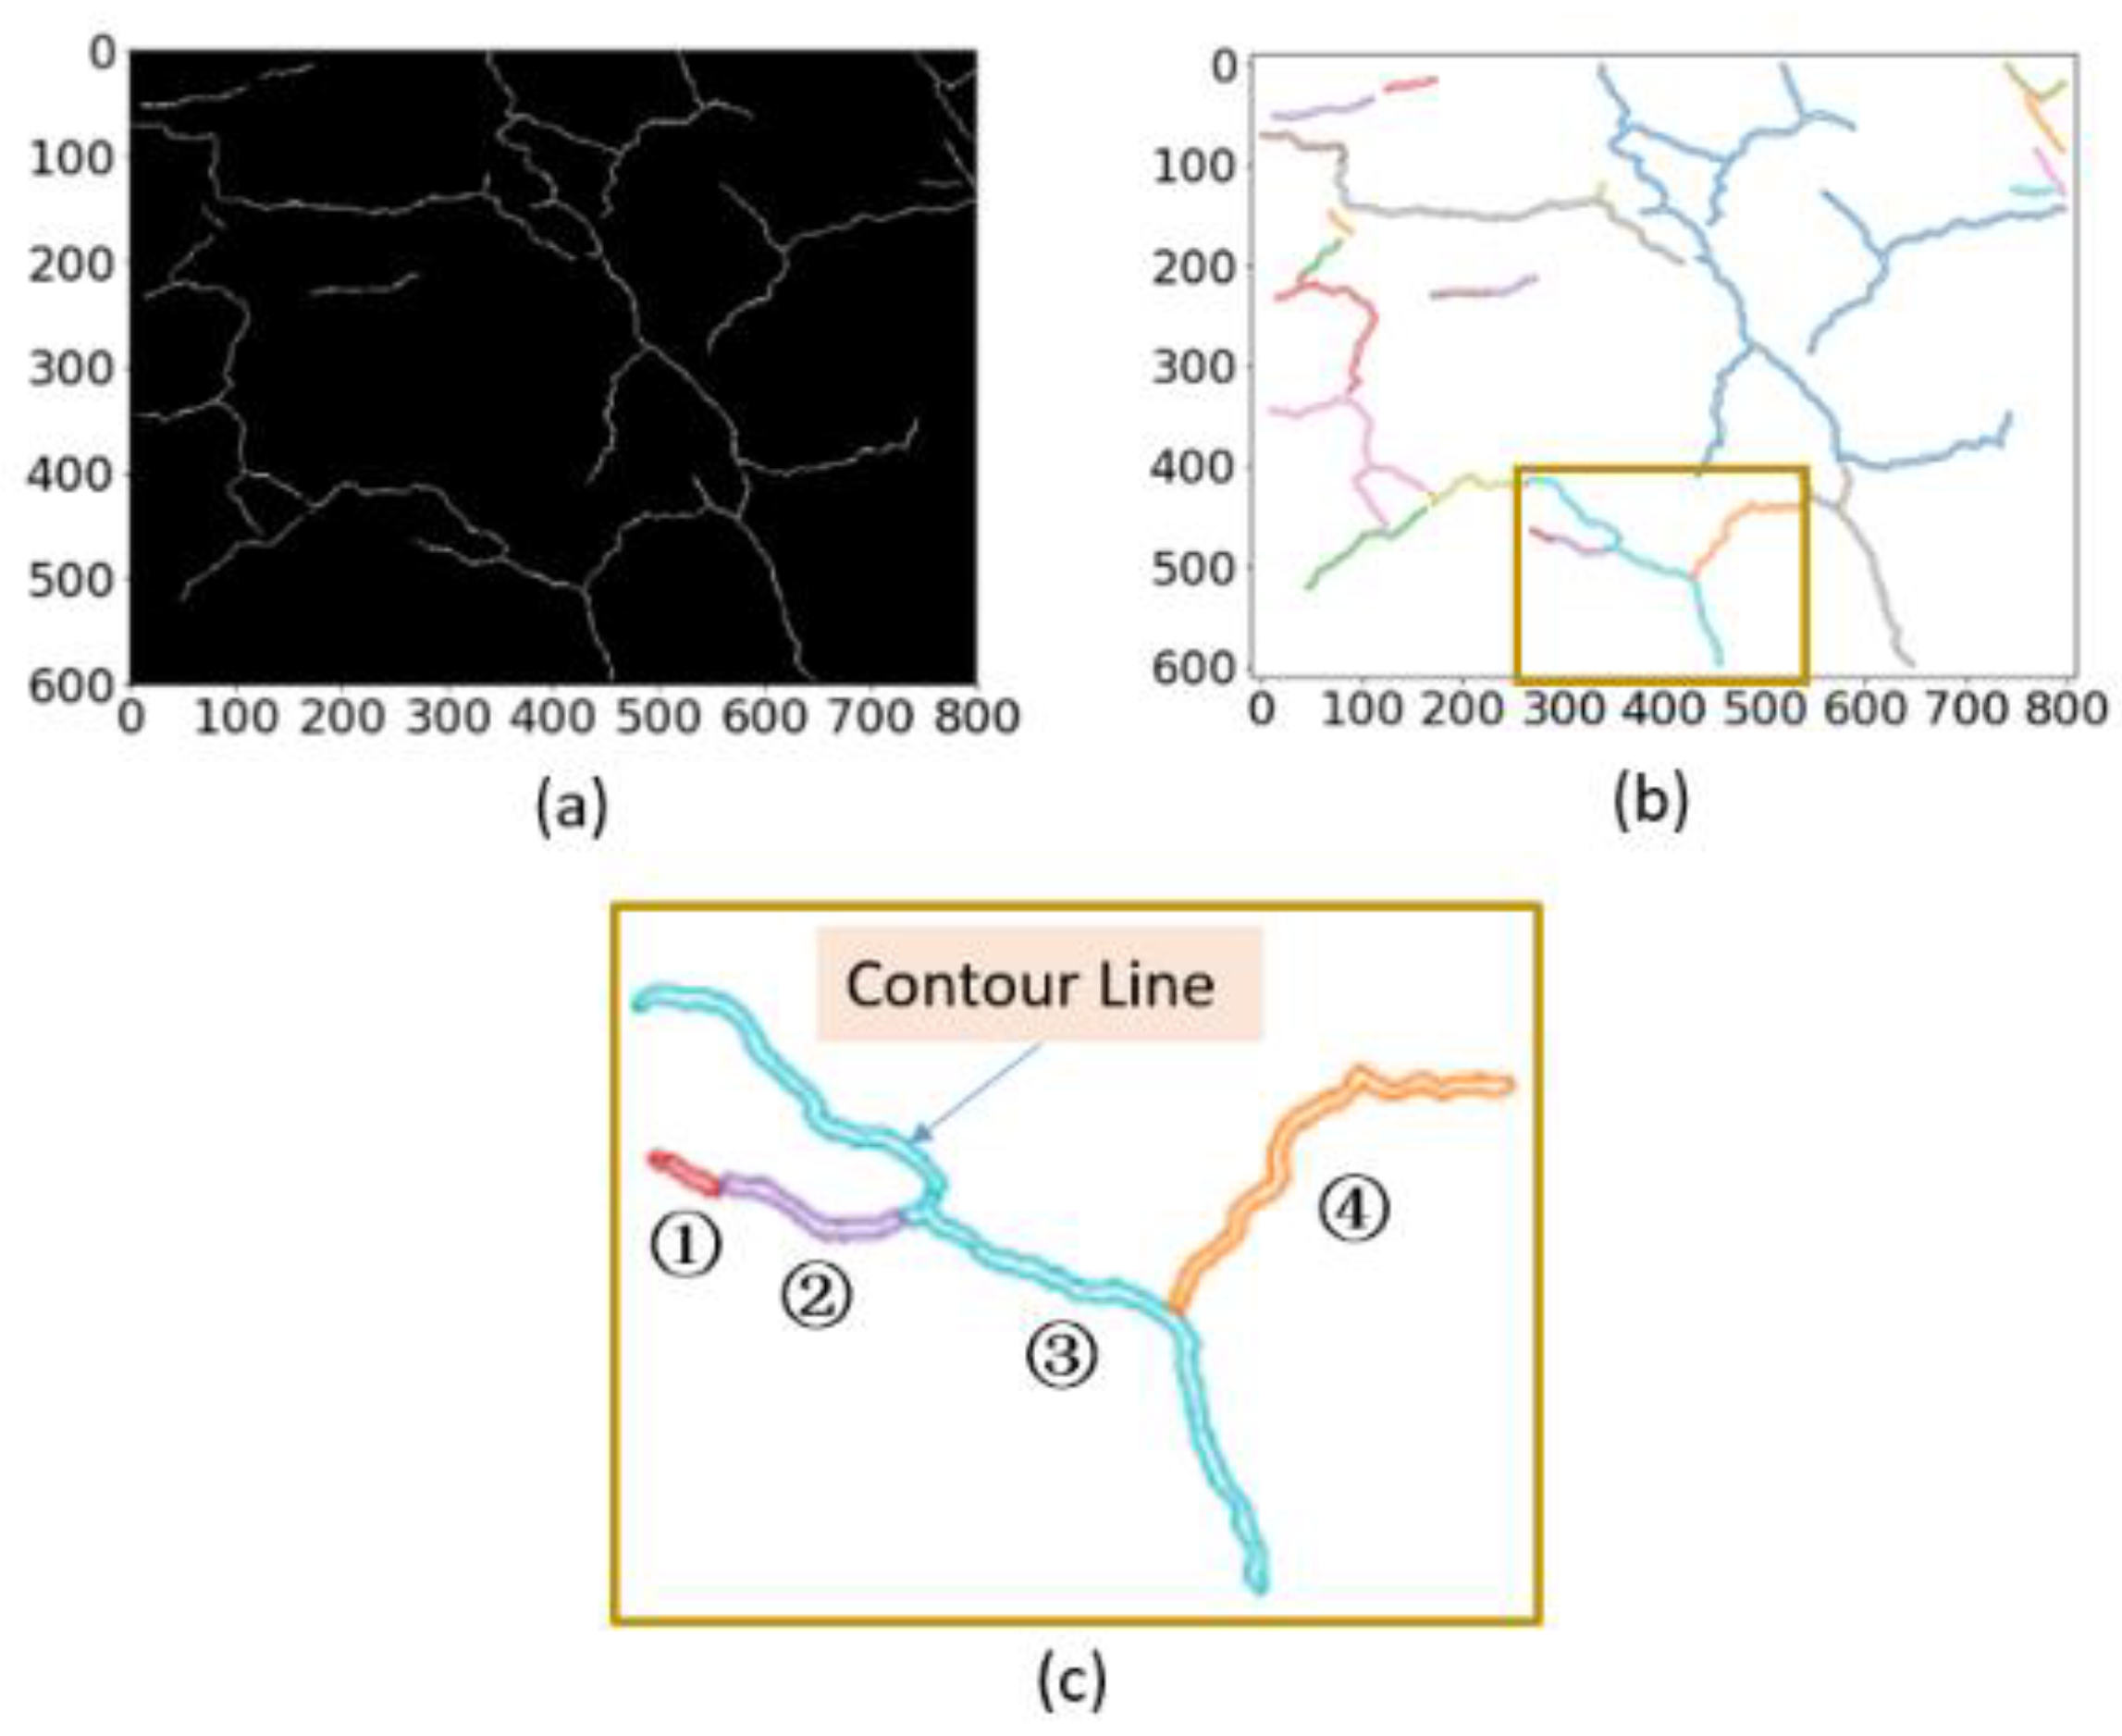
3.2. Crack Measurement Method

The automatic crack detection process does not completely eliminate inferences (e.g., irregular distributions, small areas, similar pixels and shapes to cracks) in images returned by Parallel ResNet. Hence, the mathematical morphology method has been used to further minimize noise and accurately segment the investigated road diseases. Mathematical morphology is based on set theory in order to describe different objects in an image, perform matching operations on the image by defining structural elements of specific sizes and shapes, and analyze and recognize the target area in the original image. Assuming that the pixel set of the image to be processed is I and the structural element is set to P, the mathematical morphology operation is the set operation of P and I. In this paper, the main operations of mathematical morphology (expansion, corrosion, opening and closing) are used to smooth the edges of the cracks, remove small holes, binary image deblurring and other actions, as summarized in Table 2.
Then, the connected domain and the outer contour of the crack are extracted by mathematical morphology methods. The adopted criterion is to remove unnecessary contour points and keep only skeleton points; multiple iterations are performed to obtain the final result. In this work, the medial-axis skeleton algorithm is used to extract the crack skeleton. The purpose of extracting the crack skeleton in the pavement surface images is to measure the characteristic parameters of road diseases. As discussed above, cracks in digital images may be incoherent, thin and complex; topology cracks may also have multiple connected regions after being segmented, and can be divided into different connected domains. The overall procedure is presented in Figure 5.
Turning to mathematics, one by one statistical calculation, based on the connected domain of the divided cracks, is required to define the width, length, and area of the cracks. Based on the displacement of pixels for crack skeletons, the following Equation (14) can be used to calculate the crack length:
L c r a c k = m n f ( x , y ) d l
where f ( x , y ) are the calibrated pixel displacements in the coherent crack; d l is the finite length of the crack skeleton elements; and m and n are the numbers of connected domains in the crack images and the total numbers of finite lengths of the crack skeleton elements in the coherent crack, respectively.
The crack skeleton normal line method measures the maximum crack width. The average crack width is estimated by dividing the crack area by the crack length, as written in Equation (15):
W a v g = A c r a c k L c r a c k
Hence, the area of the crack ( A c r a c k ) is calculated by counting the total pixels of the connected domain. For the calculation of crack area with complex topology, not only does the area of the cracks themselves have to be counted, but also the minimum area of the external rectangle of the cracks. Finally, the process of crack characteristic measurement is shown in Table 3.

4. Experiments and Results

The proposed method, Parallel ResNet, is trained and tested on two different databases with RGB images: CrackTree200 [55] and CFD [24]. The CrackTree200 dataset contains 206 images (size 800 × 600 pixels) of cracks in concrete pavements, including noises such as shadows and uneven lighting. The CrackTree200 dataset contains cracks that are thinner in thickness and have a more complex topology. In this study, the CrackTree200 dataset was split into two subsets: 156 images for training and 40 for testing. The CFD dataset contains 118 RGB images with a resolution of 320 × 480 pixels; these data also have some inferences such as shadows, oil spots and water stains, and have non-uniform illumination. In this case, the number of samples was extended; the images were flipped up and down, left and right, and diagonally; and the expanded CFD dataset was then split into two subsets (288 images for training and 184 for test).
In the data pre-processing stage, a strategy with a change in the ratio of positive to negative training samples was proposed to solve the multi-label classification problem with imbalanced samples [56]. The batch size for each iteration was set to 256, and 10 epochs were conducted in the CrackTree200 and CFD datasets.
The computing platform was equipped with Intel Xeon CPU E3-1505M, GPU NVIDIA Quadro M1200 8G, Windows 10 System, and TensorFlow2.0.
In order to evaluate the performance of Parallel ResNet, three statistical parameters are considered: Precision, Recall and F1 scores. They are calculated as described in Table 4:
Considering that ground truth cracks are manually annotated and there are transitional areas between crack pixels and non-crack pixels in real images, it was proposed to tolerate a small distance between the detection and the reference segmentation for the calculation of the TP rate [57]. In this study, it was assumed that the detected pixels, which are no more than two pixels away from the manually labeled pixel, are also true positive pixels.

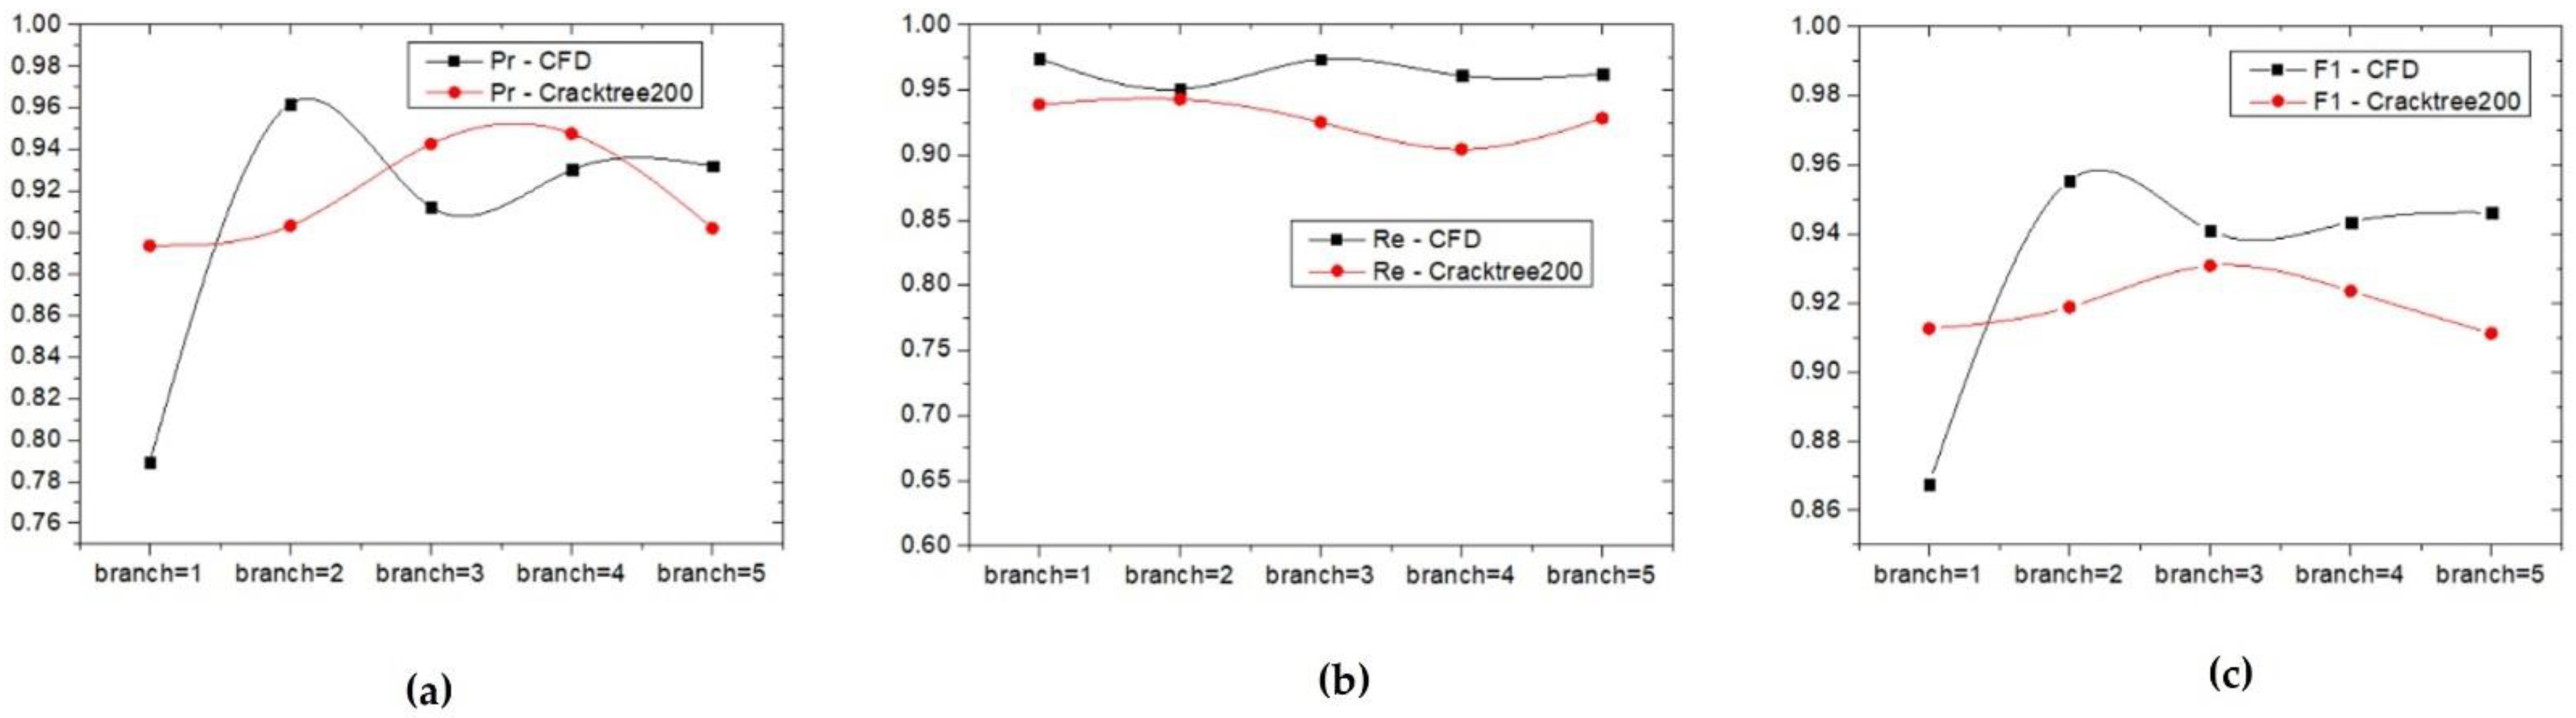
4.1. Multiple Branches of Parallel ResNet

By distinguishing the number of branches in the Parallel ResNet module, the performance of the method will be different. To analyze this assumption in a numerical way, several values (1, 2, 3, 4, and 5) were set as number of branches. Considering both available datasets (CrackTree200 and CFD), the Precision, Recall and F1 parameters were calculated (Table 5 and Figure 6). Specifically, in the CrackTree200 database it was noted that F1 obtains the highest value for a number of branches equal to 3. Differently, for the CFD database, the best score for F1 is reached when the number of branches is equal to 2. Regarding the Recall parameter, the values obtained for different numbers of branches fall within a narrow range: for the CrackTree200 database they are between 0.9 and 0.943; and for the CFD database they are between 0.95 and 0.98. Comparing Figure 6a,c, the Precision and F1 parameters have a similar trend (a convex function) to the number of branches.
For automatic detection of crack digital images, the branch amount of Parallel ResNet was set according to the F1 score. Therefore, a number of branches equal to 3 was assumed for the CrackTree200 dataset, and equal to 2 for the CFD dataset. Deep learning optimization methods and hyper-parameters of Parallel ResNet model were selected by comparative experimental methods. A gradient-descent optimization algorithm, i.e., Adaptive Moment Estimation (Adam), was used in this study. The ReLU was employed to increase the non-linearity for hidden layers. Moreover, in the final output the sigmoid activation function was used for the binary classification task. It should also be noted that in the training phase, the regularization coefficient (λ) was set to 0.0005, and the learning rate was set to 0.001.

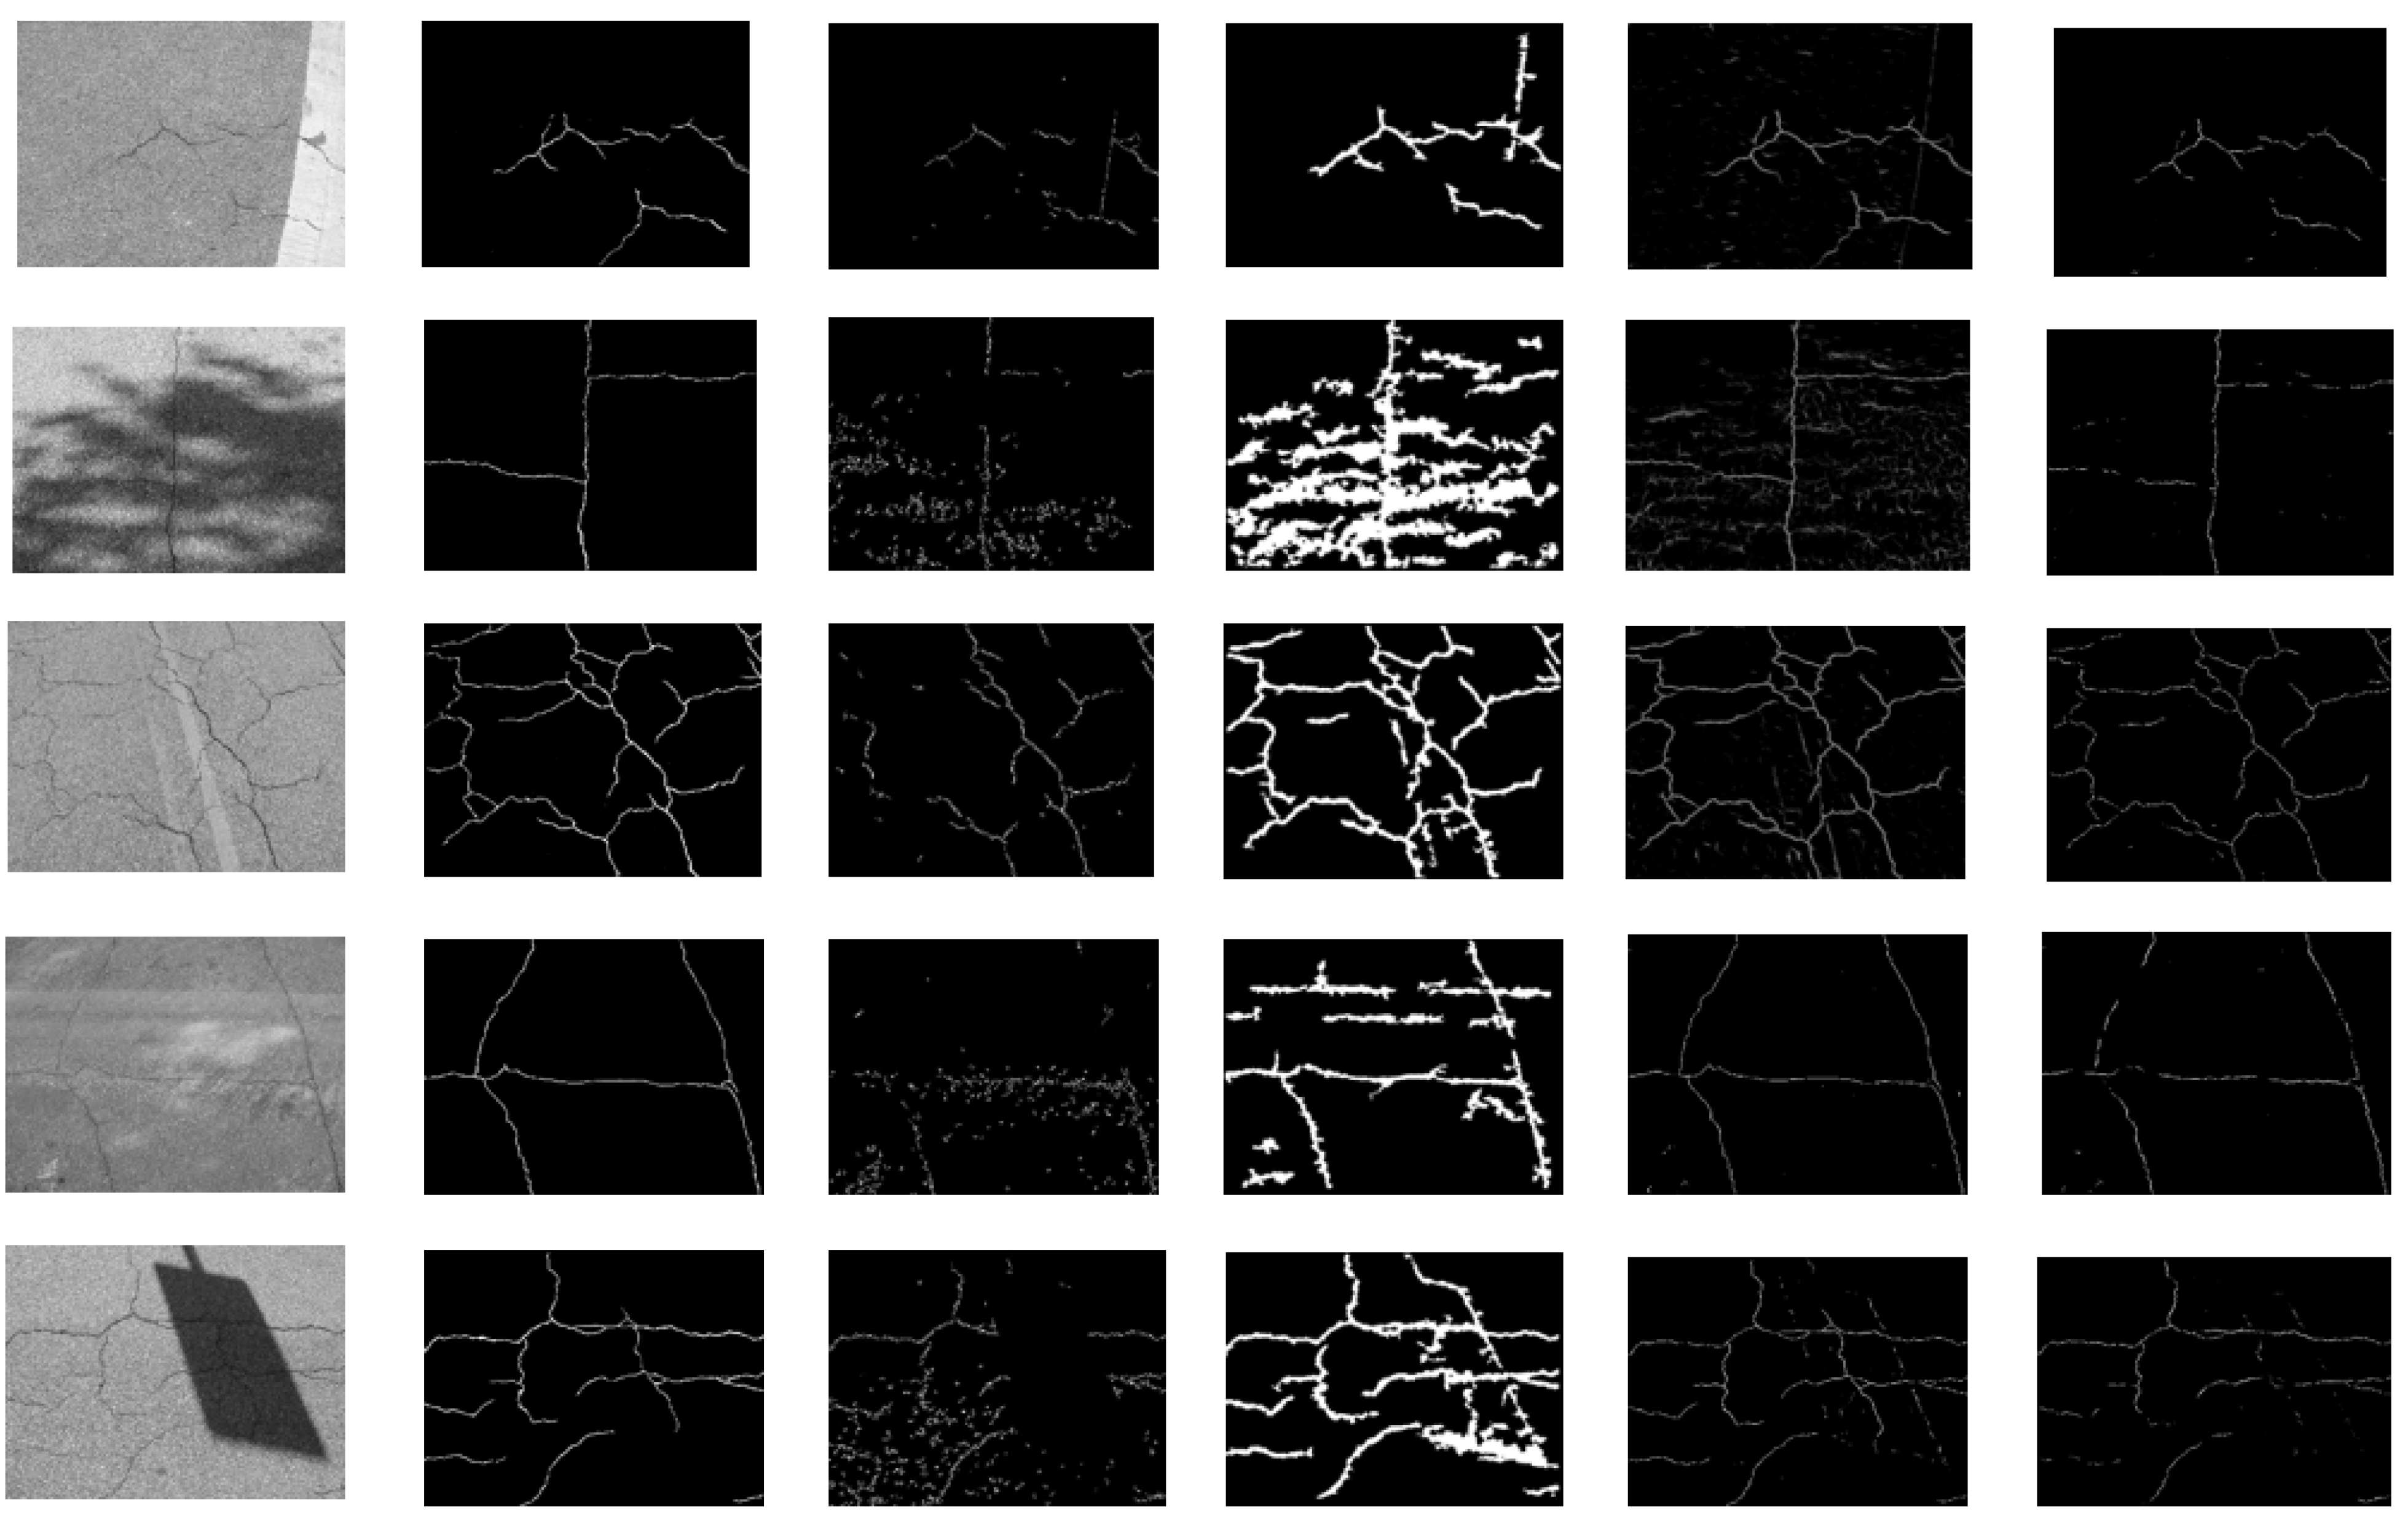
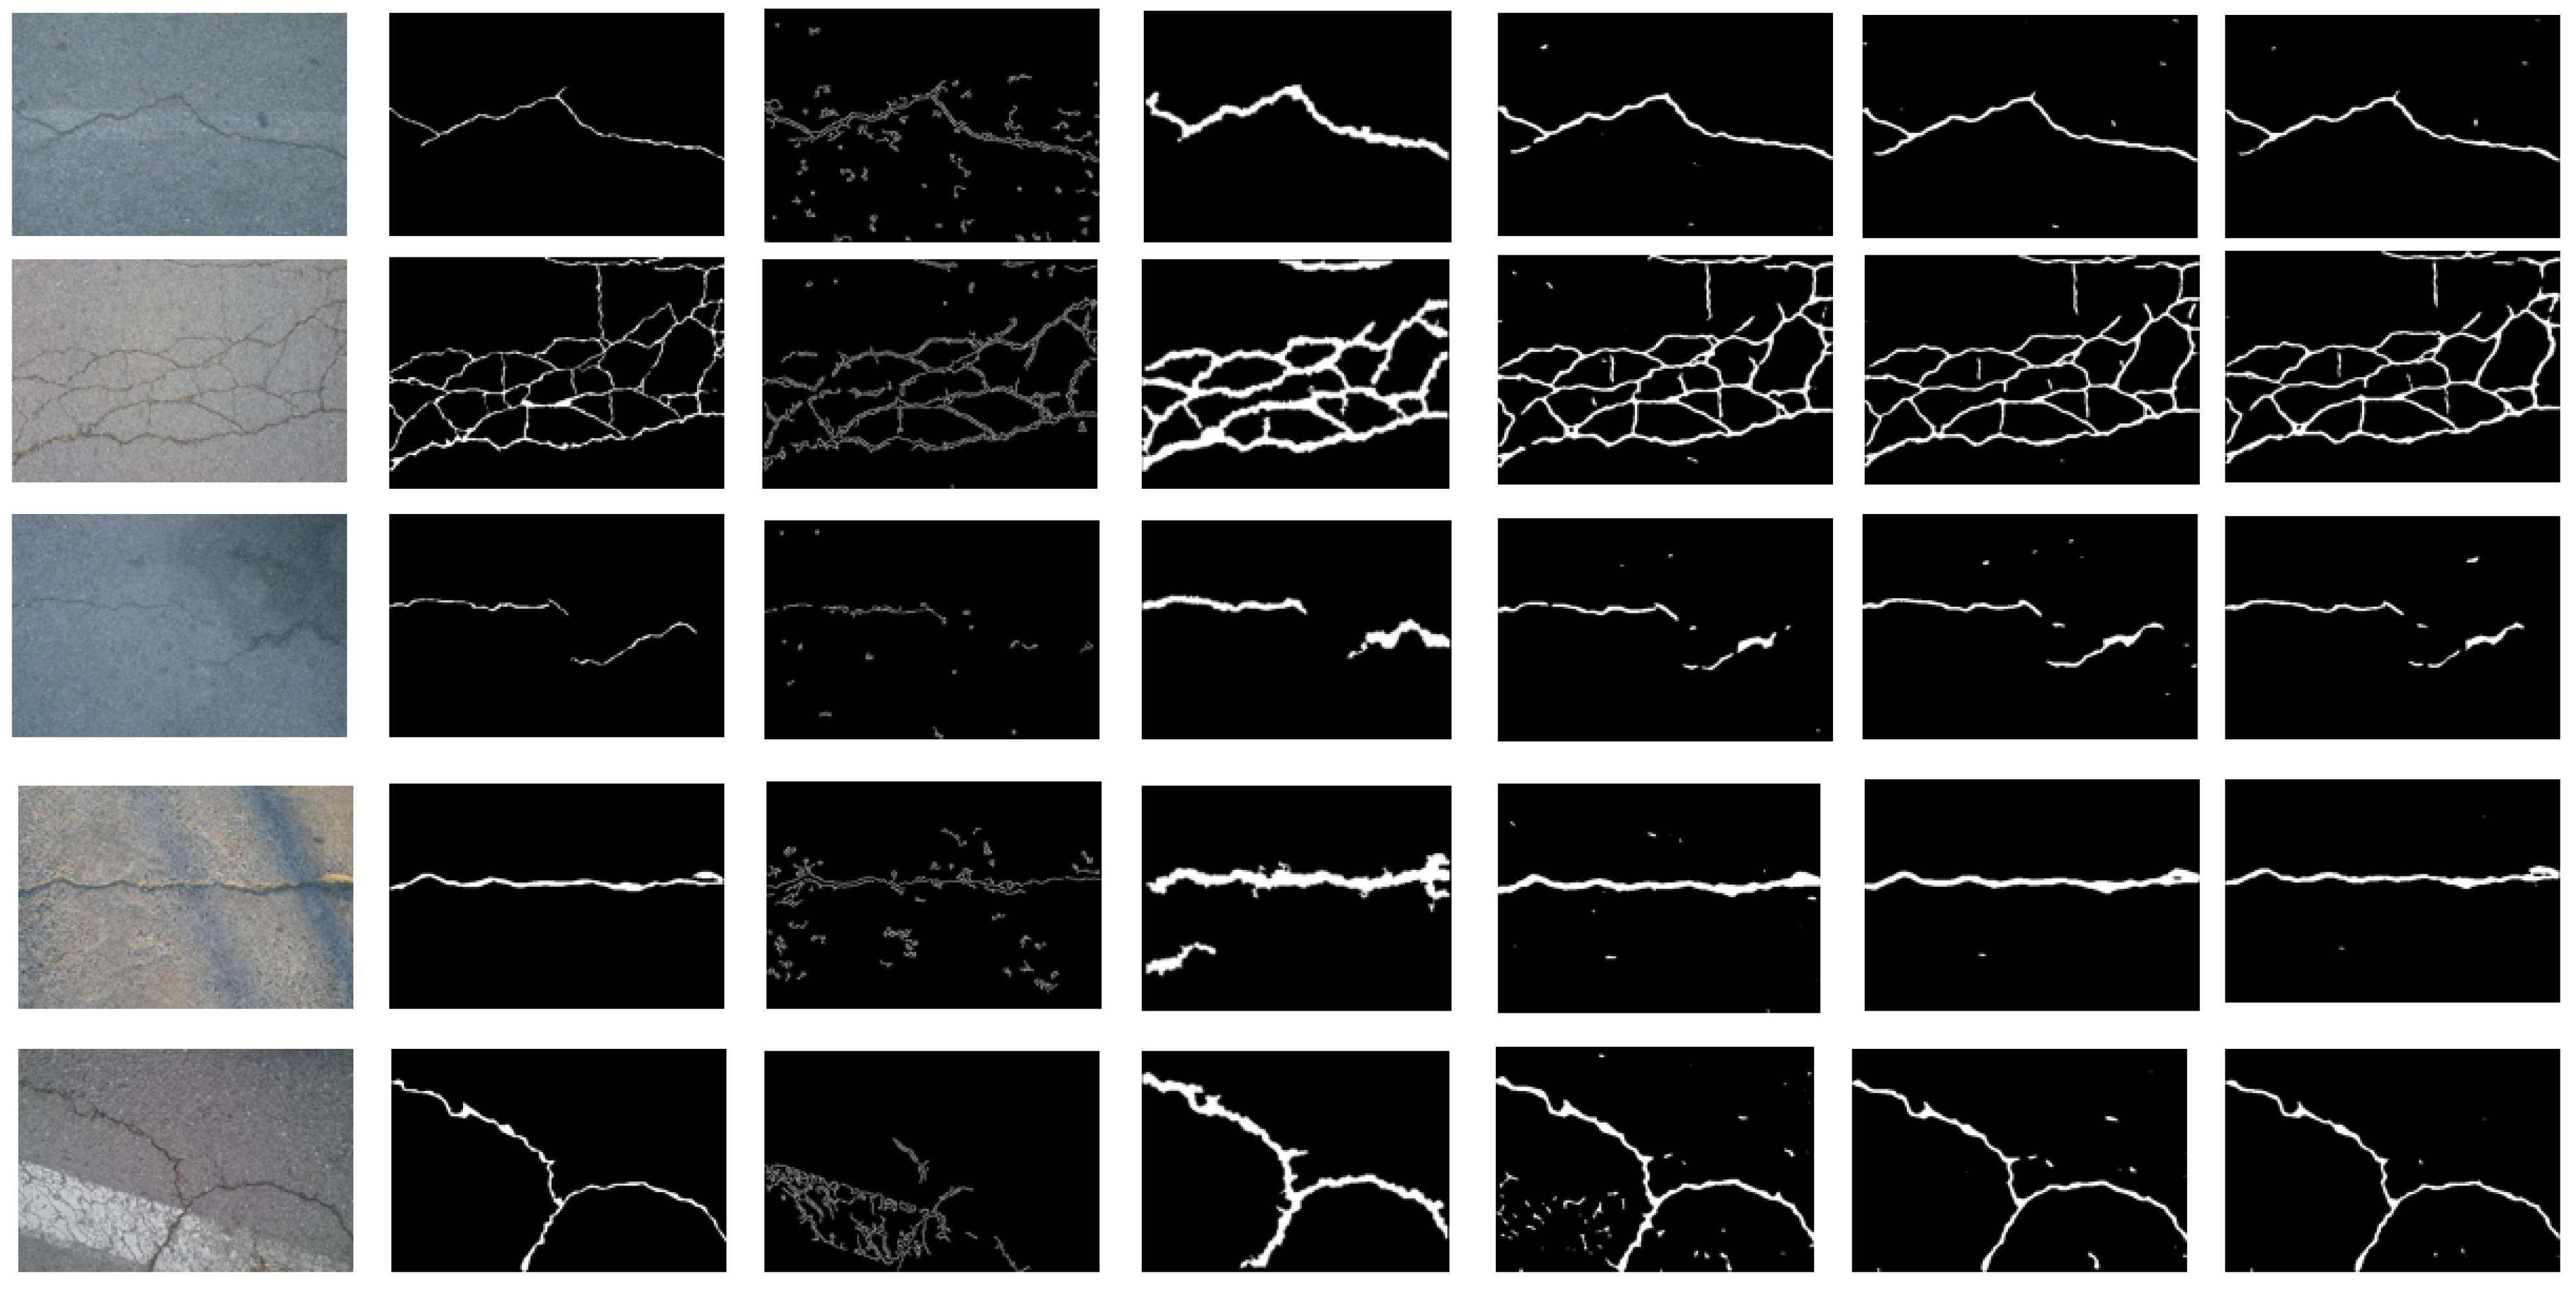
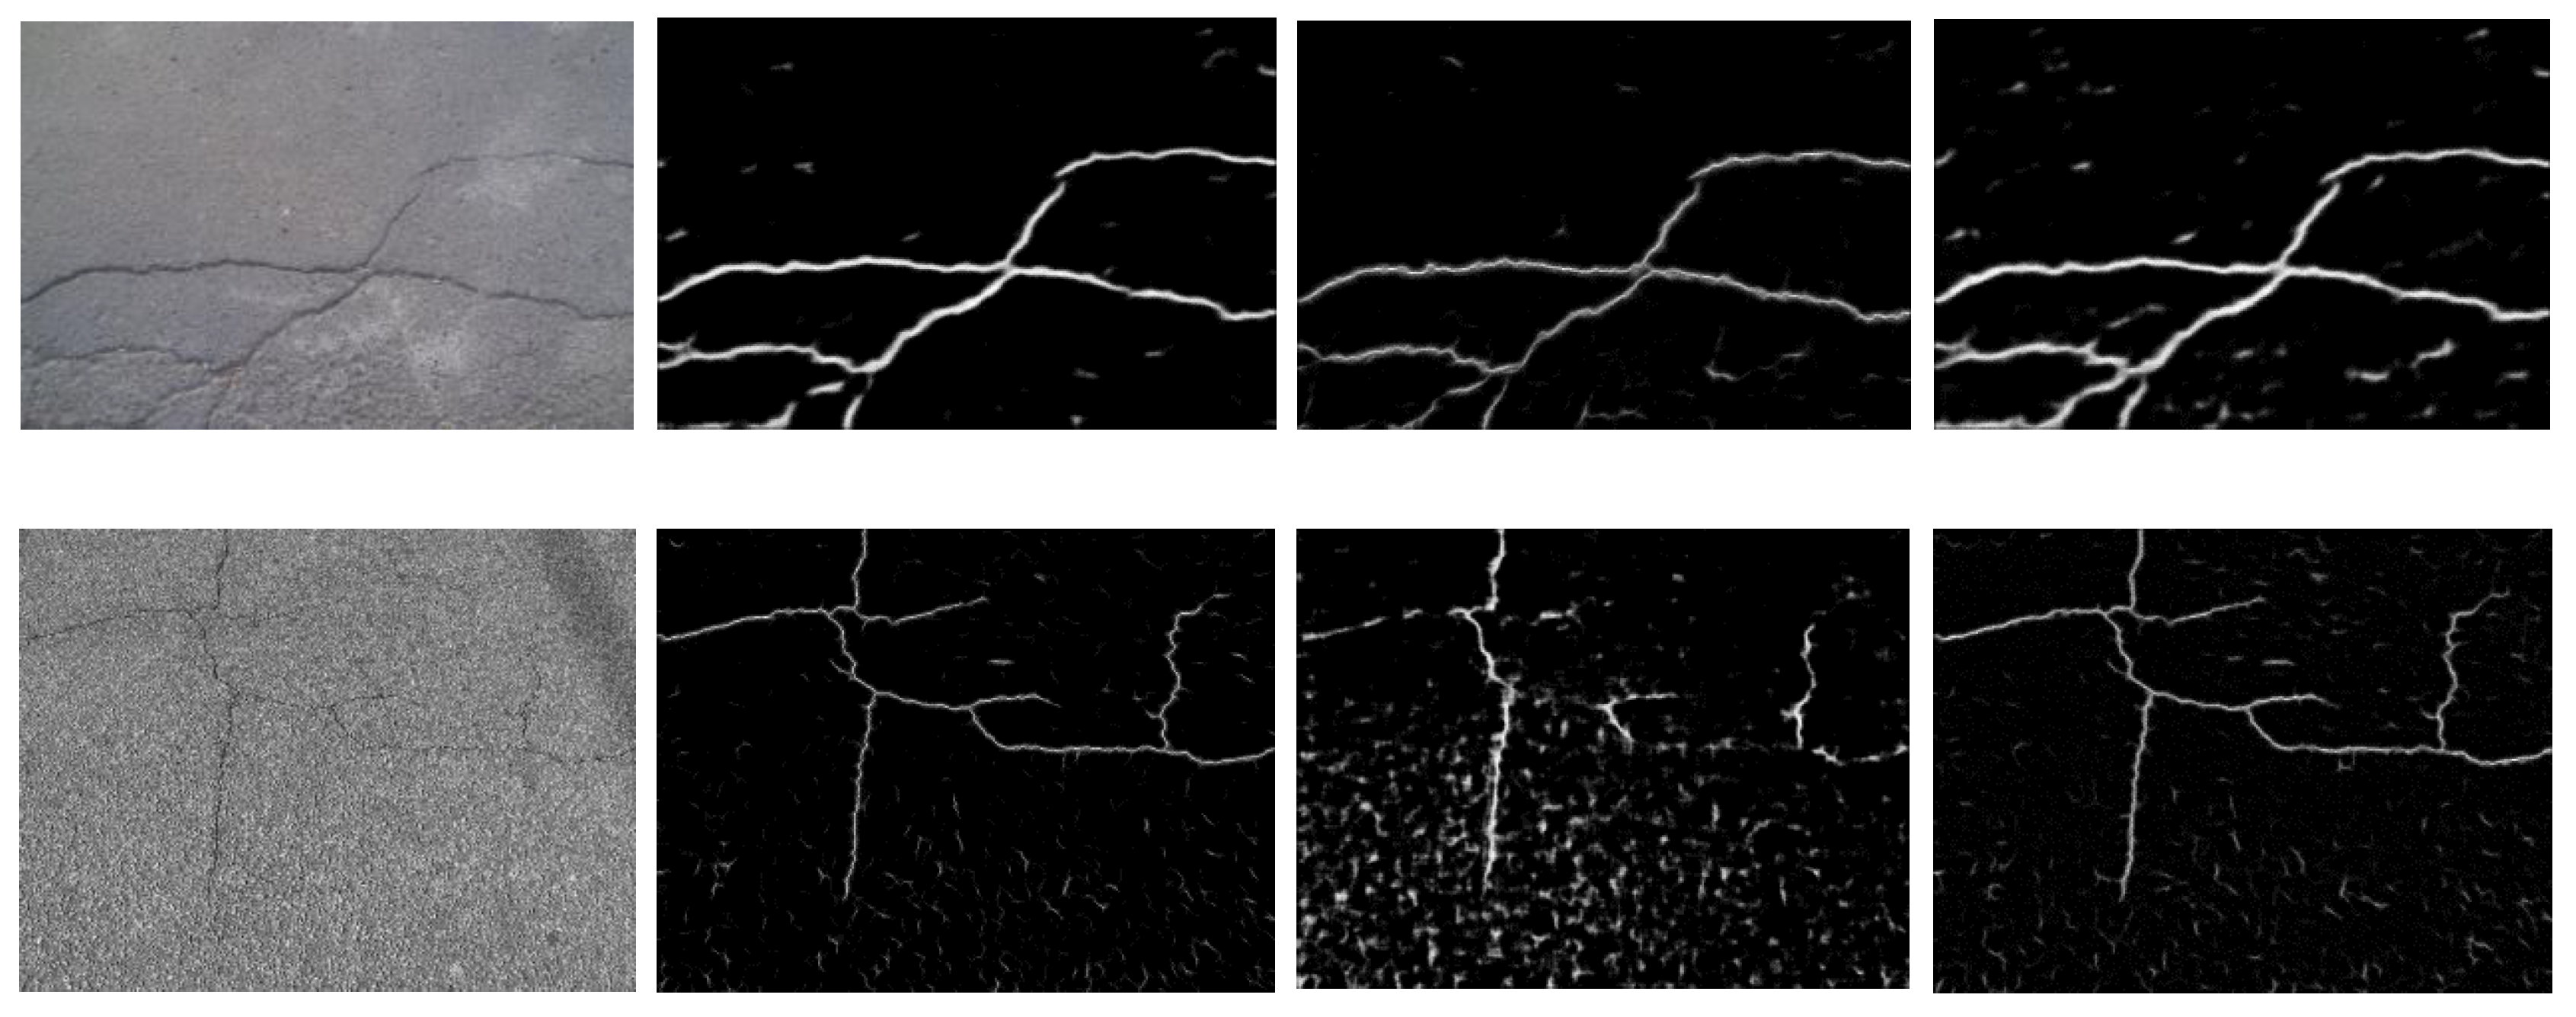
4.2. Experimental Results in Crack Detection

In order to validate Parallel ResNet as a reliable method in pavement crack image analysis, it was compared with six other competing methods defined in the literature, namely Canny, CrackForest, Modified VGG16, U-Net, Structured Prediction, and Ensemble Network. The Precision, Recall and F1 scores are reported in Table 6 for the CrackTree200 and CFD datasets.
Thus, the novel deep residual convolutional neural network, as compared with well-known literature methods, achieved the following results:
  • For the CrackTree200 dataset, the best scores in all performance metrics were found (Precision = 94.27%, Recall = 92.52%, F1 = 93.08%);
  • For the CFD dataset, the best scores were in Precision (96.21%) and F1 (95.63%); while the obtained value in Recall (95.12%) was a little bit smaller than that achieved by applying Ensemble Network (but fairly similar);
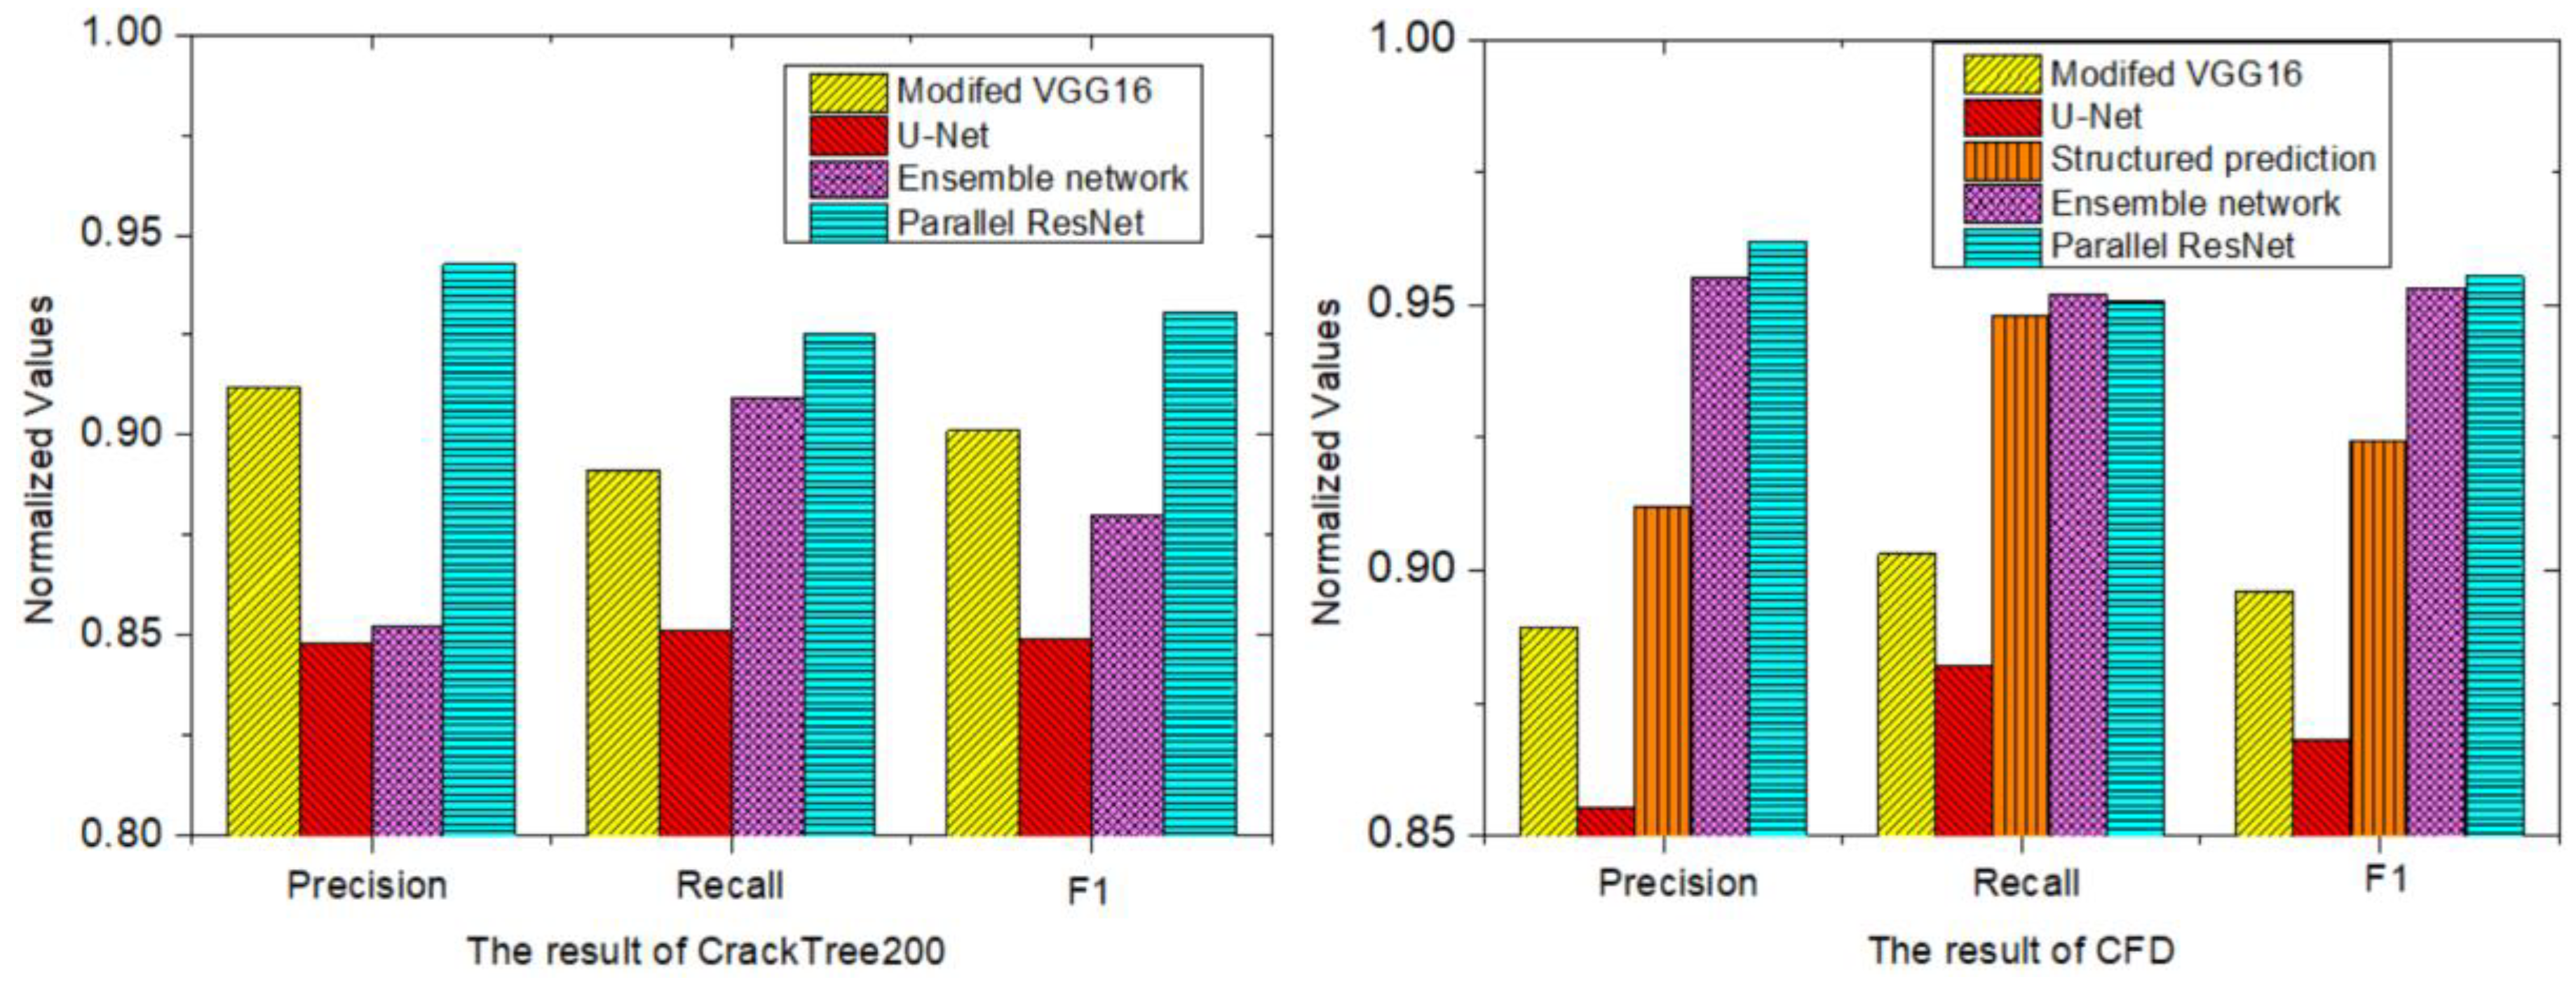
  • Problems also arose for Structured Prediction, which failed in cracks detection for the CrackTree200 database: the main reason may be that the crack width is very small, and the noise and crack pixels are very close in the raw image;
  • At the same time, it can also be found that the crack detection ability based on the deep learning is much better than the traditional machine learning and the edge extraction algorithms, such as CrackForest, Canny, and Structured Prediction;
  • The histogram in Figure 7 shows the results, in terms of evaluation parameters, limited to the deep learning-based methods considered in this paper.

4.2.1. Detection Analysis on the CrackTree200 Dataset

In Figure 8, four different methods (Canny, CrackForest, Ensemble Network, and Parallel ResNet) are compared on the CrackTree200 dataset. The traditional Canny edge detection algorithm was not found to be suitable for road crack detection due to its high sensitivity. CrackForest did not perform well on thin and complex topologies, as well as in the presence of crack images with noise inference. Regarding Ensemble Network, it detected most of the cracks, but there was still much noise left. The method proposed in this research showed promising results on the effective discernment of noise inference, especially in crack images with noises that have a similar texture to cracks. The example crack images in Figure 8 (second and fifth rows) include shadows very similar to cracks in pixels; the proposed method was able to minimize inference and identify cracks better than other crack detection methods.

4.2.2. Detection Analysis on the CFD Dataset

In Figure 9, five different methods (Canny, CrackForest, Structured prediction, Ensemble Network, Parallel ResNet) are compared on the CFD dataset. As can be intuitively observed, the method presented in this paper outperformed other algorithms, with the exception of Ensemble Network, which showed very similar detection results.

4.2.3. Performance Evaluation of Parallel ResNet under Cross-Dataset Scenarios

In this section, different cross-dataset scenarios are investigated in order to confirm the validation of the proposed model in terms of generalization. In particular, in this study the performance of Parallel ResNet merging the CFD and CrackTree200 datasets was further investigated in various ways:
  • Training on CFD and testing on CrackTree200;
  • Training on CrackTree200 and testing on CFD;
  • Training and testing on a hybrid dataset from CFD and CrackTree200.
For a better comprehension, Figure 10 shows an application of the above-discussed approach.
Cross-dataset results using Parallel ReseNet are listed in Table 7:
Hence, the Parallel ResNet model trained on CrackTree200 and tested on CFD led to high precision and low recall, while the model trained on CFD and tested on CrackTree200 achieved low scores. In addition, training with hybrid data and subsequent tests with each of the publicly available datasets returned results slightly lower than the best performances.

4.3. Experimental Results in Crack Measurement

The crack detection algorithm cannot automatically remove noise from pavement images. Therefore, road surface crack measurement requires a mathematical morphology approach to minimize noise and blur in order to ensure accurate crack skeleton extraction and measurement of road distress characteristics. Figure 11 presents the main morphological steps in crack measurement: original image (Figure 11a), ground truth image (Figure 11b), recognition image of Parallel ResNet (Figure 11c), crack skeleton (Figure 11d), crack outer contour image (Figure 11e), crack circumscribed quadrilateral image (Figure 11f). In particular, the crack circumscribed quadrilateral image shows more clearly that the topologically complex crack is divided into multiple connected regions.
Applying the methodology just discussed, the measurement results are shown for the CrackTree200 and CFD databases in Table 8 and Table 9, respectively.
The numbers of truth and predicted data are in pixels.
The experimental results show that the measurement error of crack length, average width and area on crack images of the CrackTree200 dataset is larger than the CFD dataset.
As for the crack length and average width measurement errors, they are mainly caused by the failure of crack edge segmentation.
There are relatively large errors in the measurement of crack areas. One reason is that when there are multiple crack domains in a digital image with complex topology, the predicted crack area is larger than the true area due to overlap. Another possible reason is that some thin cracks are not detected, so the predicted crack area is underestimated.
Especially when the crack boundary is not smooth, the measurement result of the maximum crack width will be worse, and the main reason is that the crack calculation error of the crack crossing position is large. The operations of mathematical morphology, expansion and closing, have been applied to segment cracks. These methods can smooth the contour lines, eliminate the smaller holes, fill the breaks in contour lines and eliminate the isolated pixels, which can reduce the number of predicted crack pixels. At the same time, different combinations or sequences of morphological operations may affect the extraction of crack skeletons and the number of pixels in the crack.

5. Conclusions

In this paper, a novel automatic pavement crack detection and measurement method was proposed. The main goal is to provide an effective solution that overcomes the limitations of established crack detection approaches based on image processing. Currently, segmenting cracks with complex topology, reducing noises with similar texture to the cracks, or identifying thin cracks is highly challenging. In addition, a measurement technique was developed to accurately evaluate crack characteristics.
The Parallel ResNet Module was proposed in order to improve the deep neural network structure, effectively minimize noise, and automatically identify thin and complex crack topology in numerical pavement images. Publicly available datasets (CFD and CrackTree200) were used to validate the methodology. F1 scores reported in the experiments were analyzed to identify the optimal number of branches in the Parallel ResNet Module; a number of branches equal to three was assumed for the CrackTree200 dataset, and equal to two for the CFD dataset.
Experimentally comparing Parallel ResNet with other competing methods suggested in the literature, the novel methodology reached, in terms of detection performance:
  • The maximum scores in Precision (94.27%), Recall (92.52%), and F1 (93.08%) using the CrackTree200 dataset;
  • High values in Precision (96.21%), Recall (95.12%), and F1 (95.63%) using the CFD dataset.
Therefore, an improved crack measurement method is presented that employs mathematical morphology techniques to eliminate noise inferences and accurately segment the cracks. The extracted crack skeleton was used to measure the characteristic parameters of road diseases. The mathematical results show that the novel method, compared with several competing methods, performs well, although it can be improved in future works, especially in the estimation of the area and the maximum width of the crack.
It should also be pointed out that the method was only performed on accurate static images; video streaming was not considered. Therefore, tests on video databases are planned for future projects. Another important issue concerns the computational speed in crack detection: it will be necessary to focus on the possibility of increasing it. It should also be noted that the adopted algorithm requires manually labeling each crack pixel of ground truth images, which makes data acquisition very expensive: unsupervised and semi-supervised learning-based techniques can mitigate this problem. The determination of the hyper parameter of the final module also takes a lot of time, and further studies will focus on evolutionary computation to optimize the hyper parameters of the deep learning module. Finally, other recent machine learning techniques and optimization methods (e.g., [58,59]) will be investigated and incorporated into the proposed approaches in order to obtain even more accurate results.

Author Contributions

Conceptualization, Z.F.; methodology, H.L.; software, H.L. and C.L.; validation, C.L.; formal analysis, H.L.; investigation, H.L. and J.S.; resources, H.L. and J.S.; data curation, H.L. and J.S.; writing—original draft preparation, H.L.; writing—review and editing, Z.F., G.L. and S.B.; visualization, H.L. and C.L.; supervision, Z.F., G.L. and S.B.; project administration, Z.F. and G.L. All authors have read and agreed to the published version of the manuscript.

Funding

This work was supported by the Science and Technology Planning Project of Guangdong Province of China under grant 180917144960530, by the Project of Educational Commission of Guangdong Province of China under grant 2017KZDXM032, by the State Key Lab of Digital Manufacturing Equipment and Technology under grant DMETKF2019020, and by the Project of Robot Automatic Design Platform combining Multi-Objective1 Evolutionary Computation and Deep Neural Network under grant 2019A 050519008. This research was funded in part by Sapienza, University of Rome, grant number RM11715C773C3779.

Institutional Review Board Statement

Not applicable.

Informed Consent Statement

Not applicable.

Data Availability Statement

CFD dataset is available online: https://github.com/cuilimeng/CrackForest-dataset. CrackTree200 dataset is also available online: https://github.com/fyangneil/pavement-crack-detection.

Acknowledgments

The authors are grateful to the Key Lab of Digital Signal and Image Processing of Guangdong Province, College of Engineering, Shantou University.

Conflicts of Interest

The authors declare no conflict of interest.

References

  1. Bruno, S.; Del Serrone, G.; Di Mascio, P.; Loprencipe, G.; Ricci, E.; Moretti, L. Technical Proposal for Monitoring Thermal and Mechanical Stresses of a Runway Pavement. Sensors 2021, 21, 6797. [Google Scholar] [CrossRef] [PubMed]
  2. Bonin, G.; Polizzotti, S.; Loprencipe, G.; Folino, N.; Oliviero Rossi, C.; Teltayev, B.B. Development of a road asset management system in kazakhstan. In Transport Infrastructure and Systems—Proceedings of the AIIT International Congress on Transport Infrastructure and Systems, TIS 2017; CRC Press/Balkema: Leiden, The Netherlands, 2017; pp. 537–545. ISBN 978-1-138-03009-1. [Google Scholar]
  3. Jiang, C.; Tsai, Y.J. Enhanced Crack Segmentation Algorithm Using 3D Pavement Data. J. Comput. Civ. Eng. 2016, 30, 04015050. [Google Scholar] [CrossRef]
  4. Loprencipe, G.; Pantuso, A. A Specified Procedure for Distress Identification and Assessment for Urban Road Surfaces Based on PCI. Coatings 2017, 7, 65. [Google Scholar] [CrossRef] [Green Version]
  5. Wang, W.; Wang, M.; Li, H.; Zhao, H.; Wang, K.; He, C.; Wang, J.; Zheng, S.; Chen, J. Pavement crack image acquisition methods and crack extraction algorithms: A review. J. Traffic Transp. Eng. 2019, 6, 535–556. [Google Scholar] [CrossRef]
  6. Dong, Q.; Huang, B. Evaluation of Influence Factors on Crack Initiation of LTPP Resurfaced-Asphalt Pavements Using Parametric Survival Analysis. J. Perform. Constr. Facil. 2014, 28, 412–421. [Google Scholar] [CrossRef]
  7. ASTM. ASTM D6433-20; Standard Practice for Roads and Parking Lots Pavement Condition Index Surveys. ASTM International: West Conshohocken, PA, USA, 2020.
  8. Cheng, H.D.; Wang, J.; Hu, Y.G.; Glazier, C.; Shi, X.J.; Chen, X.W. Novel approach to pavement cracking detection based on neural network. Transp. Res. Rec. 2001, 1764, 119–127. [Google Scholar] [CrossRef]
  9. Subirats, P.; Dumoulin, J.; Legeay, V.; Barba, D. Automation of pavement surface crack detection using the continuous wavelet transform. In Proceedings of the International Conference on Image Processing, Atlanta, GA, USA, 8–11 October 2006; pp. 3037–3040. [Google Scholar] [CrossRef]
  10. Nguyen, T.S.; Avila, M.; Begot, S. Automatic detection and classification of defect on road pavement using anisotropy measure. In Proceedings of the European Signal Processing Conference, Glasgow, UK, 24–28 August 2009; pp. 617–621. [Google Scholar]
  11. Najafi Moghaddam Gilani, V.; Hosseinian, S.M.; Behbahani, H.; Hamedi, G.H. Prediction and pareto-based multi-objective optimization of moisture and fatigue damages of asphalt mixtures modified with nano hydrated lime. Constr. Build. Mater. 2020, 261, 120509. [Google Scholar] [CrossRef]
  12. Oliveira, H.; Correia, P.L. Automatic road crack detection and characterization. IEEE Trans. Intell. Transp. Syst. 2013, 14, 155–168. [Google Scholar] [CrossRef]
  13. Hosseinian, S.M.; Najafi Moghaddam Gilani, V.; Mehraban Joobani, P.; Arabani, M. Investigation of Moisture Sensitivity and Conductivity Properties of Inductive Asphalt Mixtures Containing Steel Wool Fiber. Adv. Civ. Eng. 2020, 2020, 1–9. [Google Scholar] [CrossRef]
  14. Loprencipe, G.; de Almeida Filho, F.G.V.; de Oliveira, R.H.; Bruno, S. Validation of a low-cost pavement monitoring inertial-based system for urban road networks. Sensors 2021, 21, 3127. [Google Scholar] [CrossRef]
  15. Dong, L.; Yu, G.; Ogunbona, P.; Li, W. An efficient iterative algorithm for image thresholding. Pattern Recognit. Lett. 2008, 29, 1311–1316. [Google Scholar] [CrossRef]
  16. Oliveira, H.; Correia, P.L. Automatic road crack segmentation using entropy and image dynamic thresholding. In Proceedings of the European Signal Processing Conference, Glasgow, UK, 24–28 August 2009; pp. 622–626. [Google Scholar]
  17. Tanaka, N.; Uematsu, K. A Crack Detection Method in Road Surface Images Using Morphology. In Proceedings of the IAPR Workshop on Machine Vision Applications, Chiba, Japan, 17–19 November 1998; pp. 1–4. [Google Scholar]
  18. Yang, C.; Wang, X.; Cheng, L.; Ma, H. Neural-Learning-Based Telerobot Control with Guaranteed Performance. IEEE Trans. Cybern. 2017, 47, 3148–3159. [Google Scholar] [CrossRef] [PubMed] [Green Version]
  19. Zhao, H.; Qin, G.; Wang, X. Improvement of canny algorithm based on pavement edge detection. In Proceedings of the 2010 3rd International Congress on Image and Signal Processing, CISP 2010, Yantai, China, 16–18 October 2010; pp. 964–967. [Google Scholar] [CrossRef]
  20. Wang, C.; Wang, X.; Zhou, X.; Li, Z. The Aircraft Skin Crack Inspection Based on Different-Source Sensors and Support Vector Machines. J. Nondestruct. Eval. 2016, 35, 46. [Google Scholar] [CrossRef]
  21. Kumar, A.; Kim, J.; Lyndon, D.; Fulham, M.; Feng, D. An Ensemble of Fine-Tuned Convolutional Neural Networks for Medical Image Classification. IEEE J. Biomed. Health Inform. 2017, 21, 31–40. [Google Scholar] [CrossRef] [PubMed] [Green Version]
  22. Szegedy, C.; Vanhoucke, V.; Ioffe, S.; Shlens, J.; Wojna, Z. Rethinking the Inception Architecture for Computer Vision. In Proceedings of the IEEE Computer Society Conference on Computer Vision and Pattern Recognition, Las Vegas, NV, USA, 27–30 June 2016; pp. 2818–2826. [Google Scholar] [CrossRef] [Green Version]
  23. Qu, Z.; Mei, J.; Liu, L.; Zhou, D.-Y. Crack Detection of Concrete Pavement With Cross-Entropy Loss Function and Improved VGG16 Network Model. IEEE Access 2020, 8, 54564–54573. [Google Scholar] [CrossRef]
  24. Shi, Y.; Cui, L.; Qi, Z.; Meng, F.; Chen, Z. Automatic road crack detection using random structured forests. IEEE Trans. Intell. Transp. Syst. 2016, 17, 3434–3445. [Google Scholar] [CrossRef]
  25. Wu, S.; Fang, J.; Zheng, X.; Li, X. Sample and Structure-Guided Network for Road Crack Detection. IEEE Access 2019, 7, 130032–130043. [Google Scholar] [CrossRef]
  26. Fujita, Y.; Hamamoto, Y. A robust automatic crack detection method from noisy concrete surfaces. Mach. Vis. Appl. 2011, 22, 245–254. [Google Scholar] [CrossRef]
  27. Jahanshahi, M.R.; Masri, S.F. A new methodology for non-contact accurate crack width measurement through photogrammetry for automated structural safety evaluation. Smart Mater. Struct. 2013, 22, 035019. [Google Scholar] [CrossRef]
  28. Yang, X.; Li, H.; Yu, Y.; Luo, X.; Huang, T.; Yang, X. Automatic Pixel-Level Crack Detection and Measurement Using Fully Convolutional Network. Comput.-Aided Civ. Infrastruct. Eng. 2018, 33, 1090–1109. [Google Scholar] [CrossRef]
  29. He, K.; Zhang, X.; Ren, S.; Sun, J. Deep residual learning for image recognition. In Proceedings of the IEEE Computer Society Conference on Computer Vision and Pattern Recognition, Las Vegas, NV, USA, 27–30 June 2016; pp. 770–778. [Google Scholar] [CrossRef] [Green Version]
  30. Fan, Z.; Li, C.; Chen, Y.; Di Mascio, P.; Chen, X.; Zhu, G.; Loprencipe, G. Ensemble of deep convolutional neural networks for automatic pavement crack detection and measurement. Coatings 2020, 10, 152. [Google Scholar] [CrossRef] [Green Version]
  31. Hilditch, C. Comparison of thinning algorithms on a parallel processor. Image Vis. Comput. 1983, 1, 115–132. [Google Scholar] [CrossRef]
  32. Kamaliardakani, M.; Sun, L.; Ardakani, M.K. Sealed-Crack Detection Algorithm Using Heuristic Thresholding Approach. J. Comput. Civ. Eng. 2016, 30, 04014110. [Google Scholar] [CrossRef]
  33. Katiyar, S.K.; Arun, P.V. Comparative analysis of common edge detection techniques in context of object extraction. IEEE Trans. Geosci. Remote Sens. 2014, 50, 68–79. [Google Scholar]
  34. Qu, Z.; Lin, L.; Guo, Y. Algorithm of Image Crack Detection Based on Morphology and Region Extends. Comput. Sci. 2014, 41, 297–300. [Google Scholar]
  35. Fan, Z.; Li, C.; Chen, Y.; Wei, J.; Loprencipe, G.; Chen, X.; Di Mascio, P. Automatic crack detection on road pavements using encoder-decoder architecture. Materials 2020, 13, 2960. [Google Scholar] [CrossRef]
  36. Kass, M.; Witkin, A.; Terzopoulos, D. Snakes: Active contour models. Int. J. Comput. Vis. 1988, 1, 321–331. [Google Scholar] [CrossRef]
  37. Amhaz, R.; Chambon, S.; Idier, J.; Baltazart, V. A new minimal path selection algorithm for automatic crack detection on pavement images. In Proceedings of the 2014 IEEE International Conference on Image Processing, ICIP 2014, Paris, France, 27–30 October 2014; pp. 788–792. [Google Scholar] [CrossRef] [Green Version]
  38. Nguyen, T.S.; Begot, S.; Duculty, F.; Avila, M. Free-Form Anisotropy: A New Method for Crack Detection on Pavement Surface Images. In Proceedings of the 18th IEEE International Conference On Image Processing, Brussels, Belgium, 11–14 September 2011; pp. 1093–1096. [Google Scholar]
  39. Acosta, J.A.; Figueroa, J.L.; Mullen, R.L. Low-Cost Video Image Processing System for Evaluating Pavement Surface Distress. Transp. Res. Rec. 1992, 1348, 63–72. [Google Scholar]
  40. Deutschl, E.; Gasser, C.; Niel, A.; Werschonig, J. Defect detection on rail surfaces by a vision based system. In Proceedings of the IEEE Intelligent Vehicles Symposium, Parma, Italy, 14–17 June 2004; pp. 507–511. [Google Scholar] [CrossRef]
  41. Delagnes, P.; Barba, D. Markov random field for rectilinear structure extraction in pavement distress image analysis. IEEE Int. Conf. Image Processing 1996, 1, 446–449. [Google Scholar] [CrossRef]
  42. Bray, J.; Verma, B.; Li, X.; He, W. A Neural Network based Technique for Automatic Classification of Road Cracks. IEEE Xplore 2006, 907–912. [Google Scholar] [CrossRef]
  43. Chambon, S.; Moliard, J.M. Automatic road pavement assessment with image processing: Review and comparison. Int. J. Geophys. 2011, 2011, 989354. [Google Scholar] [CrossRef] [Green Version]
  44. Liu, Z.; Cao, Y.; Wang, Y.; Wang, W. Computer vision-based concrete crack detection using U-net fully convolutional networks. Autom. Constr. 2019, 104, 129–139. [Google Scholar] [CrossRef]
  45. Liu, J.; Yang, X.; Lau, S.; Wang, X.; Luo, S.; Lee, V.C.; Ding, L. Automated pavement crack detection and segmentation based on two-step convolutional neural network. Comput.-Aided Civ. Infrastruct. Eng. 2020, 35, 1291–1305. [Google Scholar] [CrossRef]
  46. Lau, S.L.H.; Chong, E.K.P.; Yang, X.; Wang, X. Automated Pavement Crack Segmentation Using U-Net-Based Convolutional Neural Network. IEEE Access 2020, 8, 114892–114899. [Google Scholar] [CrossRef]
  47. Song, W.; Jia, G.; Jia, D.; Zhu, H. Automatic Pavement Crack Detection and Classification Using Multiscale Feature Attention Network. IEEE Access 2019, 7, 171001–171012. [Google Scholar] [CrossRef]
  48. Veit, A.; Wilber, M.; Belongie, S. Residual networks behave like ensembles of relatively shallow networks. In Proceedings of the Advances in Neural Information Processing Systems, Barcelona, Spain, 5–10 December 2016; pp. 550–558. [Google Scholar]
  49. Shan, B.; Zheng, S.; Ou, J. A stereovision-based crack width detection approach for concrete surface assessment. KSCE J. Civ. Eng. 2016, 20, 803–812. [Google Scholar] [CrossRef]
  50. Cho, H.; Yoon, H.J.; Jung, J.Y. Image-Based Crack Detection Using Crack Width Transform (CWT) Algorithm. IEEE Access 2018, 6, 60100–60114. [Google Scholar] [CrossRef]
  51. Peleg, S.; Rosenfeld, A. A Min-Max Medial Axis Transformation. IEEE Trans. Pattern Anal. Mach. Intell. 1981, PAMI-3, 208–210. [Google Scholar] [CrossRef]
  52. Thawonmas, R.; Hirano, M.; Kurashige, M. Cellular automata and Hilditch thinning for extraction of user paths in online games. In Proceedings of the 5th ACM SIGCOMM Workshop on Network and System Support for Games, NetGames ’06. Singapore, 30–31 October 2006. [Google Scholar] [CrossRef]
  53. Zhang, T.Y.; Suen, C.Y. A fast parallel algorithm for thinning digital patterns. Commun. ACM 1984, 27, 236–239. [Google Scholar] [CrossRef]
  54. Akhavan, A.; Shafaatian, S.M.H.; Rajabipour, F. Quantifying the effects of crack width, tortuosity, and roughness on water permeability of cracked mortars. Cem. Concr. Res. 2012, 42, 313–320. [Google Scholar] [CrossRef]
  55. Zou, Q.; Cao, Y.; Li, Q.; Mao, Q.; Wang, S. CrackTree: Automatic crack detection from pavement images. Pattern Recognit. Lett. 2012, 33, 227–238. [Google Scholar] [CrossRef]
  56. Fan, Z.; Wu, Y.; Lu, J.; Li, W. Automatic Pavement Crack Detection Based on Structured Prediction with the Convolutional Neural Network. arXiv 2018, arXiv:1802.02208. [Google Scholar]
  57. Amhaz, R.; Chambon, S.; Idier, J.; Baltazart, V. Automatic Crack Detection on Two-Dimensional Pavement Images: An Algorithm Based on Minimal Path Selection. IEEE Trans. Intell. Transp. Syst. 2016, 17, 2718–2729. [Google Scholar] [CrossRef] [Green Version]
  58. Moghaddam Gilani, V.N.; Hosseinian, S.M.; Hamedi, G.H.; Safari, D. Presentation of Predictive Models for Two-objective Optimization of Moisture and Fatigue Damages Caused by Deicers in Asphalt Mixtures. J. Test. Eval. 2021, 49, 20200448. [Google Scholar] [CrossRef]
  59. Najafi Moghaddam Gilani, V.; Hosseinian, S.M.; Safari, D.; Bagheri Movahhed, M. Investigation of the Impact of Deicer Materials on Thermodynamic Parameters and Its Relationship with Moisture Susceptibility in Modified Asphalt Mixtures by Carbon Nanotube. Arab J. Sci. Eng. 2021, 46, 4489–4502. [Google Scholar] [CrossRef]
Figure 1. Overview of the proposed automated pavement crack detection and measurement approach.
Sustainability 14 01825 g001
Figure 2. An example of parallel structure learning explained in terms of real-life situation.
Sustainability 14 01825 g002
Figure 3. Parallel Residual Convolutional Neural Network for crack detection: (a) the architecture of Parallel ResNet; (b) exploded view.
Sustainability 14 01825 g003
Figure 4. Parallel ResNet module: (a) standard convolutional layer; (b) skip connected convolutional layer; (c) Parallel ResNet module of 3 ResNets.
Sustainability 14 01825 g004
Figure 5. Crack skeleton and crack connected domain. (a) Predicted image crack medial-axis skeleton, (b) predicted image crack connected domain, (c) partial enlarged image of crack connected domain, include four independent and disconnected cracks.
Sustainability 14 01825 g005
Figure 6. The Precision (a), Recall (b) and F1 (c) value variations with a different number of branches of Parallel ResNet for CrackTree200 (red curves) and CFD (black curves) databases.
Sustainability 14 01825 g006
Figure 7. Detection results of different deep learning-based methods.
Sustainability 14 01825 g007
Figure 8. Results of different methods on the CrackTree200 dataset (from left to right: original image, ground truth, Canny, CrackForest, Ensemble Network, Parallet ResNet).
Sustainability 14 01825 g008
Figure 9. Results of different methods on CFD (from left to right: original image, ground truth, Canny, CrackForest, Structured Prediction, Ensemble Network, Parallet ResNet).
Sustainability 14 01825 g009
Figure 10. Cross-dataset scenarios. From left to right on the top: original image, CFD/CFD (training/testing), CrackTree200/CFD, Hybrid/CFD. From left to right on the bottom: original image, CrackTree200/CrackTree200, CFD/CrackTree200, Hybrid/CrackTree200. The outputs are in terms of probability maps.
Sustainability 14 01825 g010
Figure 11. The proposed road crack detection and measurement method apply on CFD and CrackTree200: (a) original image, (b) ground truth, (c) recognition image of Parallel ResNet, (d) crack skeleton, (e) crack outer contour image, lines of the same color represent connected crack outer contour lines, (f) crack circumscribed quadrilateral image, the red box indicates the circumscribed quadrilateral of each connected crack.
Sustainability 14 01825 g011
Table 1. The architecture of Parallel ResNet (branches = 3).
Architecture of Parallel ResNet
Input (27 × 27 RGB image)
Conv16 [3 × 3, 1, 1]
Conv_A_1 16 [3 × 3, 1, 1]Conv_A_2 16 [3 × 3, 1, 1]Conv_A_3 16 [3 × 3, 1, 1]
Conv_B_1 16 [3 × 3, 1, 1]Conv_B_2 16 [3 × 3, 1, 1]Conv_B_3 16 [3 × 3, 1, 1]
Conv16 Conv16 Conv16
Conv_1 16 [3 × 3, 2, 1]Conv_2 16 [3 × 3, 2, 1]Conv_3 16 [3 × 3, 2, 1]
Conv32 [3 × 3, 1, 1]
Conv_A_1 32 [3 × 3, 1, 1]Conv_A_2 32 [3 × 3, 1, 1]Conv_A_3 32 [3 × 3, 1, 1]
Conv_B_1 32 [3 × 3, 1, 1]Conv_B_2 32 [3 × 3, 1, 1]Conv_B_3 32 [3 × 3, 1, 1]
Conv32 Conv32 Conv32
Conv_1 32 [3 × 3, 2, 1]Conv_2 32 [3 × 3, 2, 1]Conv_3 32 [3 × 3, 2, 1]
FC-64
FC-64
FC-25
Output (5 × 5 structured prediction)
Table 2. Common operations in mathematical morphology.
Operation NameFunctionAction
Dilation I P = { x | ( P ^ ) x I φ } Remove gaps and holes.
Erosion I Θ P = { x | ( P ^ ) x I } Minimize the inference of noise points.
Opening I P = ( I Θ P ) P The contour becomes smooth, the narrow discontinuity is broken, and the elongated crack is eliminated.
Closing I P = ( I P ) Θ P Smooth contour lines, remove smaller holes and fill up the breaks in contour lines
Table 3. Crack measurement process.
Step NumberCrack Measurement Process
1The cracks are segmented by mathematical morphology, and the contour of the cracks in the connected region is extracted.
2Parallel thinning algorithm for crack thinning.
3Crack skeleton extraction based on single pixel width.
4The crack length is calculated according to Equation (14).
5Calculation of maximum width of crack by vertical line method of crack skeleton.
6Based on the pixel statistics, the area of the crack and circumscribed quadrilateral is calculated, and the average width of the crack is calculated according to Equation (15).
Table 4. The evaluation parameters calculation.
Evaluation ParameterFormula
Precision P r = T P T P + F P
Recall R e = T P T P + F N
F1 F 1 = 2 × P r × R e P r + R e
TP, true positive; FP, false positive; FN, false negative.
Table 5. Statistical parameter evaluation varying the number of branches in Parallel ResNet.
Number of BranchesCrackTree200CFD
PrecisionRecallF1PrecisionRecallF1
10.89360.93890.91260.80950.97430.8716
20.90330.94290.91890.96210.95120.9563
30.94270.92520.93080.92370.97230.9465
40.94760.90460.92350.93230.95810.9436
50.90210.92840.91120.92400.95240.9352
Table 6. Detection performance of different methods for CFD and CrackTree200 databases.
MethodCrackTree200CFD
PrecisionRecallF1PrecisionRecallF1
Canny0.300.210.250.43770.73070.4570
CrackForest0.76560.91330.83300.74660.95140.8318
Modified VGG160.9120.8910.9010.8890.9030.896
U-Net0.8480.8510.8490.8550.8820.868
Structured Prediction---0.91190.94810.9244
Ensemble Network0.85250.90910.87990.95520.95210.9533
Parallel ResNet0.94270.92520.93080.96210.95120.9563
Table 7. Cross-dataset results.
CrackTree200
Testing
CFD
Testing
CrackTree200
(Training)
Pr = 0.9427Pr = 0.9792
Re = 0.9252Re = 0.8992
F1 = 0.9308F1 = 0.9346
CFD
(Training)
Pr = 0.4658Pr = 0.9237
Re = 0.6975Re = 0.9723
F1 = 0.5139F1 = 0.9465
Hybrid dataset
(Training)
Pr = 0.9335Pr = 0.9288
Re = 0.9006Re = 0.9483
F1 = 0.9131F1 = 0.9369
Table 8. Measurement results for the CrackTree200 dataset.
Original Image
(CrackTree200)
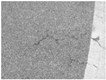
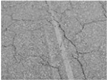
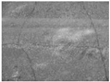
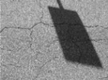
Sustainability 14 01825 i001 Sustainability 14 01825 i002 Sustainability 14 01825 i003 Sustainability 14 01825 i004 Sustainability 14 01825 i005
Morphological FeaturesTruthPredictedTruthPredictedTruthPredictedTruthPredictedTruthPredicted
Length1474126514681045438342412000181030632600
Max Width8.05.78.26.3145.667.28.010.85.7
Mean Width4.53.74.53.84.83.74.64.04.83.7
Area661244906930391722,33415,5689372731015,1279197
Table 9. Measurement results for the CFD dataset.
Original Image
(CFD)
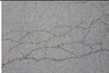
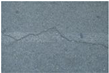
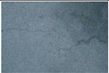
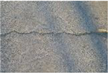
Sustainability 14 01825 i006 Sustainability 14 01825 i007 Sustainability 14 01825 i008 Sustainability 14 01825 i009 Sustainability 14 01825 i010
Morphological FeaturesTruthPredictedTruthPredictedTruthPredictedTruthPredictedTruthPredicted
Length33302833540539697689523535451455
Max Width14.611.77.28.914.414.614.612.47.210
Mean Width4.75.74.46.16.67.38.29.64.55.7
Area1538316,23724033527489454204325505620682656
Publisher’s Note: MDPI stays neutral with regard to jurisdictional claims in published maps and institutional affiliations.

