Article

Optimization of Water and Energy Spatial Patterns in the Cascade Pump Station Irrigation District

1
State Key Laboratory of Eco-Hydraulics in Northwest Arid Region, Xi’an University of Technology, Xi’an 710048, China
2
Department of Electronics and Information, Xi’an Polytechnic University, Xi’an 710048, China
3
Key Laboratory of Oasis Town and Mountain-Basin System Ecology of Xinjiang Bingtuan, Shihezi University, Shihezi 832003, China
4
Water Resources and Hydroelectric Investigation and Design and Research Institute Corporation Limited, Lanzhou 730000, China
5
Jingtaichuan Electric Lifting Irrigation Water Resources Utilization Center, Jingtai, Baiyin 730400, China
*
Author to whom correspondence should be addressed.
Sustainability 2022, 14(9), 4943; https://doi.org/10.3390/su14094943
Submission received: 26 February 2022 / Revised: 7 April 2022 / Accepted: 11 April 2022 / Published: 20 April 2022

Abstract

:
Cascade pump station irrigation districts (CPSIDs) consume large quantities of water and energy. Water- and energy-saving results and income increases are guaranteed under the sustainable development of the CPSID. The CPSID is divided into several sub-districts based on the elevation difference of topography and pump station distributions. The spatial patterns of crops and irrigation technologies can be changed by adjusting crop planting structures and developing drip irrigation in each sub-district. Its optimization will change the spatial patterns of irrigation water and energy consumption to achieve water- and energy-saving results, increase income, and provide an ecological advantage. To obtain the optimal spatial patterns of water and energy in the CPSID, a multi-objective linear programming model of minimum irrigation water consumption, minimum energy consumption, and highest crop output value was established. This model was applied to the Jingdian Phase I Irrigation District in northwest China, and an optimal scheme of water and energy spatial patterns was obtained. Compared with the present situation, the optimal scheme could save water by 26.18%, save energy by 29.38%, and increase income by 29.55%. The increased investment in the drip irrigation project would lead to reduced irrigation water and energy consumption and increased crop output value. The research results provide a scientific basis for the sustainable development of agriculture and ecological environment protection in the CPSID.

1. Introduction

Cascade pump stations irrigation district (CPSID) is divided into several sub-districts according to the topography elevation difference and the distribution of pump stations. The CPSID is a complex system consisting of cascade pump stations (CPSs), channels, pipes, and sub-districts, in which each part has a close water-energy nexus. The spatial patterns of water and energy are determined by the spatial patterns of irrigation technologies and crops in each sub-district. Thus, the research objective of this paper is to obtain the optimal spatial pattern of crops and irrigation technologies, in which energy and irrigation water use are minimal, but the crop value is the highest in the CPSID.
Due to population growth and economic development, there is an expected increased demand of 50% more food, 40% more energy, and 30% more water by 2030 [1]. Agriculture is the key link to ensure crop growth, but it consumes large quantities of water and energy. Therefore, much research has been carried out on the water-food-energy nexus in agricultural irrigation to achieve higher crop yields with less water and energy consumption [2,3,4,5,6,7]. Meanwhile, developing agricultural water and energy saving methods is conducive to protecting the ecological environment [1,8], because the saved water can be used to improve the environment [9,10]. Agricultural water and energy saving in irrigation pump stations can reduce greenhouse gas emissions [11,12].
At present, many studies have been carried out on the optimal design and scheduling of irrigation systems. The purpose of optimal design of systems is to reduce operation costs and project investment [13,14]. Irrigation pump station optimization scheduling can save a lot of energy [5,15,16,17]. The energy-saving effect of the optimal operation of the CPS in a long-distance water conveyance system is more significant [18,19,20]. The optimization of the multi-objective scheduling model in the CPSID provides the optimal scheduling scheme with the lowest energy consumption under the constrain of irrigation water [6].
In arid regions at high altitudes, water from rivers is diverted to the irrigation district (ID) through the CPS, into the pipes and channels of the water conveyance, and is distributed within an ID. In this type of the ID [6,21], the cumulative head of the CPS can reach hundreds of meters, necessitating heavy consumption of energy and water to irrigate crops. Therefore, researchers face the challenge of optimizing the CPSID model in a manner that saves water and energy, increases the output value of crops, and achieves optimal allocation within the water-food-energy nexus. This challenge may be achieved through two methods: the use of drip irrigation in place of surface irrigation and the adjustment of crop planting structures [22,23,24]. Drip irrigation offers the advantages of conserving water, increasing crop income, and protecting the environment [25,26]. Adjustments of crop planting structure can exchange crops with high water consumption and low output value with crops with low water consumption and high output value [27,28,29,30,31]. The water-saving irrigation in the ID with pump stations will also bring remarkable energy-saving effects [24]. Based on the topographic characteristics and the present engineering facilities of the CPSID, the problem is how to combine the two aforementioned methods to obtain the optimization scheme of the spatial patterns of crops and irrigation technologies in the CPSID, to reduce energy and water consumption, and to improve crop output value. More research is required on this issue.
We need to consider three optimization objective functions: the minimum annual irrigation water consumption, minimum annual energy consumption, and maximum crop output value in the ID. An example of an optimization mathematical model is multi-objective linear programming (MOLP). Fuzzy set theory is an ideal approach for obtaining the compromised solution of multi-objective linear programming [32]. In order to obtain the non-inferior solution of multi-objective linear programming, a two-stage algorithm based on fuzzy sets is proposed [33,34]. The solution obtained by using the two-stage algorithm of multi-objective linear programming is better than that obtained by using the maximum (minimum) algorithm, which indicates that the solution obtained by the two-stage algorithm of multi-objective linear programming is valid. Interval linear programming (ILP) is one method for modeling problems under uncertainty [35]. The ILP models can assess problems under uncertainty much better, due to the use of the qualitative concepts in the form of an interval. The MOLP for solving models includes interactive approaches, optimization methods, goal programming, and fuzzy method [35,36,37]. Thereafter, some modified maximum regret approaches were presented to find a necessary efficient solution to an interval MOLP problem [38,39,40]. In a multiple objective linear programming problem, parameters such as coefficients and right-hand side values of the constraints are uncertain. To cope with such uncertainties, a multi-choice goal programming model with a limited number of choices for a parameter is presented [41,42]. The general mathematical programming model for a multi-choice multi-objective linear programming problem as an extension of recent work is established [35,43]. Inverse optimization (IO) is a field of optimization dealing with problems in which some of the parameters may not be precisely known, and only estimates of these parameters may be known [44]. Mostafa Naghavi [45] put forwards the inverse optimization method of multi-objective linear programming for the least problem modifications to make a given feasible solution for a weakly efficient solution. A KKM approach is the new algorithm for IO based on capacitated transportation problems in a neutrosophic environment [46]. In application problems, the decision-maker may often encounter a problem to optimize the ratio with both the denominator and numerator being linear. If the ratio is considered as an objective function, then under linear constraints the problem is said to be linear fractional programming (LFP). In recent years, some algorithms have been proposed to solve LFP problems [47,48,49].
This paper is organized as follows. In Section 2, The information of the study area is introduced. The multi-objective linear programming and calculation of water and energy spatial patterns in the CPSID are introduced in Section 3. In Section 4, we obtain the optimal scheme of water and energy spatial patterns of the Jingdian Phase I Irrigation District. Then, we analyze changes in various indexes of the optimal scheme under different drip irrigation project investment, and we further discuss the sustainable development of the CPSID. Section 5 presents the conclusion.

2. Study Area

Data for the Jingdian Phase I Irrigation District were obtained from the administrative department of the district, namely the Jingtaichuan Electric Lifting Irrigation Water Resources Utilization Center of Gansu Province.
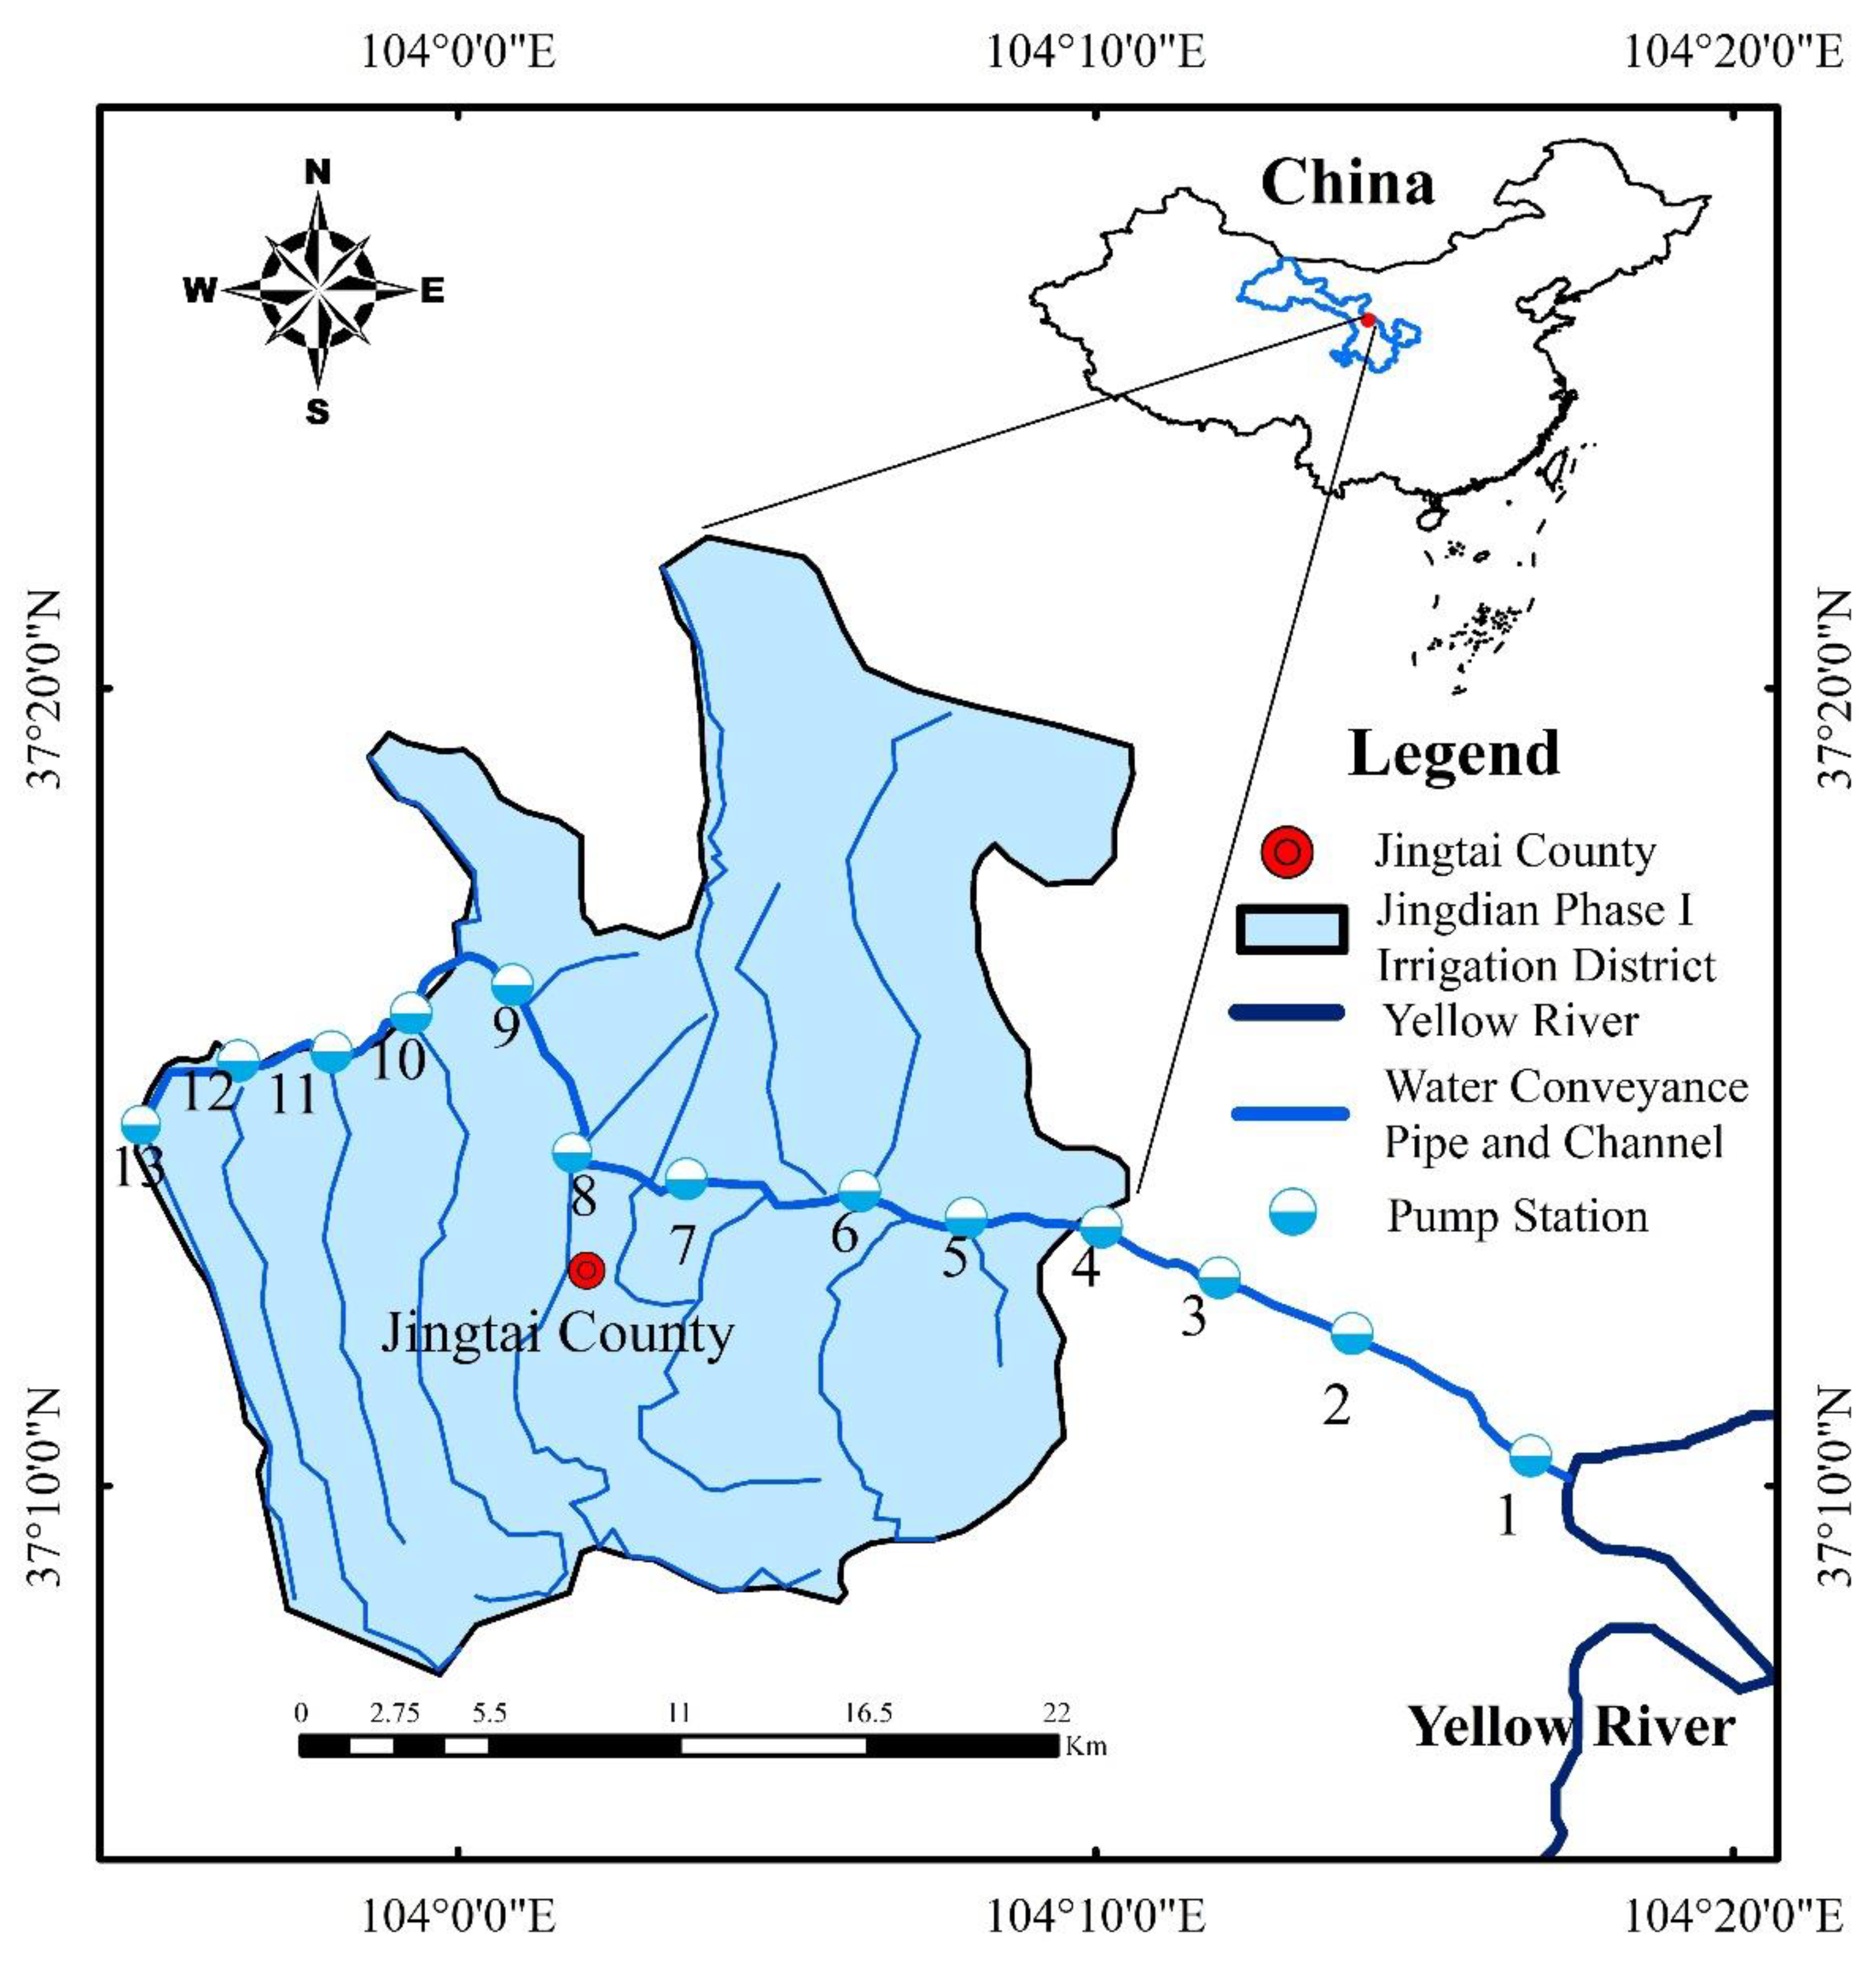
The Jingdian Phase I Irrigation District is located in the central region of Gansu Province, in northwest China (103°20′–104°04′ E and 37°26′–38°41′ N). Figure 1 shows the location of the ID, with an elevation of 1561 to 1757 m. The average annual rainfall is 184 mm, and the average annual evaporation is 2290 mm. Therefore, the Jingdian Phase I Irrigation District is located in an extremely arid area, and irrigation is the primary crop water source.
The terrain elevation difference is very large in the Jingdian Phase I Irrigation District. According to the elevation difference and the distribution of CPS, the ID is divided into 10 sub-districts (
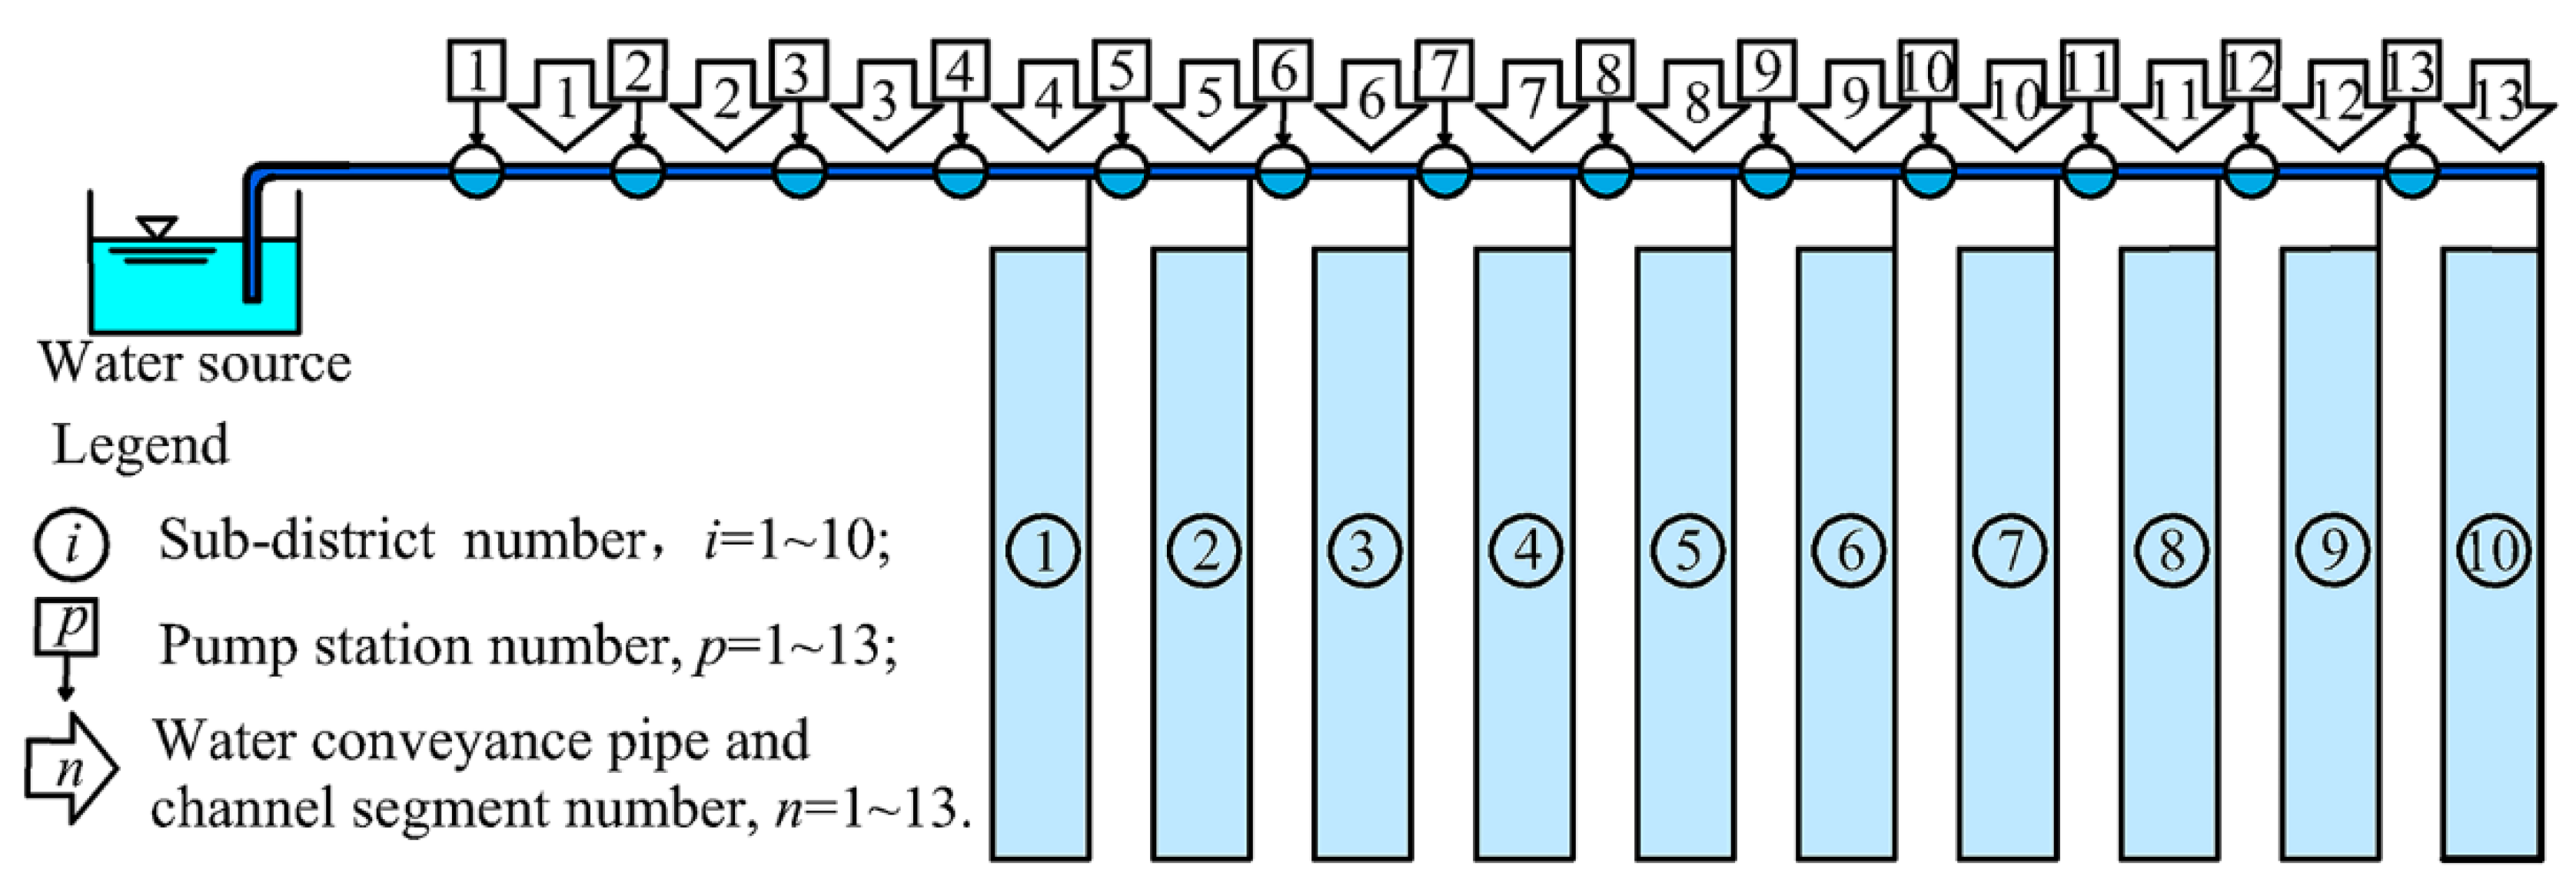
Table 1). Water from the Yellow River is transported to the farmland through the CPS, water conveyance pipe and channel (WCP&C), as well as the water distribution pipe and channel system (WDP&CS) of each sub-district. The main crop irrigation techniques for the farmland in the ID are surface and drip irrigation. The Jingdian Phase I Irrigation District comprises a complex system (Figure 2) of a water source (the Yellow River), 13 CPSs, 13 WCP&C segments, and 10 sub-districts. The WCP&C is composed of pressure pipes and open channels. Each sub-district contains farmland and WDP&CS; the WDP&CS consists of open channel systems and pipe networks. The water from the WCP&C is diverted to the farmland by the open channel system for surface irrigation. The water from the WCP&C is sent to the drip irrigation emitter near the crops through pipe networks.
The parameters of the pump stations are shown in Table 2. Table 1 shows the irrigation water use efficiency of different irrigation technologies in each sub-district. The water use efficiency of the WCP&C segment is shown in Table 3. The parameters of the irrigation technologies are shown in Table 4.
The spatial patterns of crops and irrigation technologies for the Jingdian Phase I Irrigation District in 2020 are listed in Table 5. The annual irrigation water consumption was 14,219 × 104 m3, the annual energy consumption was 18,770 × 104 kWh. The crop output value was 65,244 × 104 yuan, and the irrigated area was 21,952 ha. The drip irrigation area comprised 7.56% of the total irrigated area.

3. The Mathematical Model and Calculation

3.1. The Multi-Objective Linear Programming Model

3.1.1. Decision Variables

To reduce the investment, two principles were used to optimize the spatial patterns of crops and irrigation technologies in the CPSID. The first principle was to keep the present situation of each pump station and WCP&C unchanged; the second principle was to keep the area of various crops in the present drip irrigation of each sub-district unchanged.
According to the type of irrigation technology, each sub-district is divided into several parts (Figure 3). The present area of the sub-district consists of two parts—one is the present area of surface irrigation and the other is the present area of drip irrigation k = 1 K d i k , where dik is the area of crop k in sub-district i, and dik is a constant. In the optimization scheme, xijk is taken as the decision variable, which is the area of crops k of types of irrigation technologies j (j = 1 for surface irrigation, j = 2 for drip irrigation) in sub-district i. Thus, in the optimization scheme, the sub-district comprises three parts, the optimized surface irrigation area, the optimized drip irrigation area, and the unchanged present drip irrigation area.

3.1.2. The Water–Energy–Crops–Irrigation Nexus in the CPSID

As shown in Figure 2, the first pump station pumps water from the Yellow River, and the design discharge of each pump station decreases successively (Table 2) due to two reasons. One reason is the loss of water that occurs in each WCP&C segment connecting the two pump stations. Another reason is that the WCP&C supplies water to various sub-districts for crop irrigation. The water use efficiency of the WCP&C segment represents the water loss degree of the segment between pump stations (Table 3), which can be represented as the ratio of its outflow and inflow. From the fourth pump station, water from the WCP&C is fed into the WDP&CS of the sub-districts to irrigate the crops in the farmland. The water supply of each sub-district should cover two parts. The first part is the irrigation water for crop growth in the sub-district, which is related to both the type of irrigation technologies and the type of crops. The other part is the water loss through the WDP&CS in the sub-district and the water loss in the farmland, which is related to the irrigation technology.
The annual irrigation water consumption in the CPSID is related to crop, irrigation technology, the irrigated area, and irrigation water use efficiency. The annual irrigation water consumption W1 of the CPSID is calculated by Equation (1):
F 1 = i = 1 I j = 1 J k = 1 K q j k x i j k γ i j n = 1 i + s η n + i = 1 I k = 1 K q 2 k d i k γ i 2 n = 1 i + s η n ,
where −F1 is the annual irrigation water consumption of the CPSID (m3); i is the sub-district number; I is the total number of sub-districts; j is the number of irrigation technology types, j = 1 is surface irrigation, j = 2 is drip irrigation; J is the total number of irrigation technology types; k is the number of crop types; K is the total number of crop types; qjk is the net irrigation quota (m3/ha); n is the number of WCP&C segments; ηn is the water use efficiency of WCP&C segments; and γij is the water use efficiency of the sub-district (which is related to the irrigation technology).
The annual energy consumption of the CPSID is related to crop, irrigation technology, irrigated area, irrigation water efficiency, pump station efficiency, and pump station head. The annual energy consumption W2 of the CPSID is calculated according to Equation (2):
F 2 = 1 367.34 [ i = 1 I k = 1 K p = 1 P q 1 k H p x i 1 k γ i 1 α p n = p i + s η n + i = 1 I k = 1 K p = 1 P 1 γ i 2 ( H p α p n = p i + s η n + h d ε d ) q 2 k x i 2 k + i = 1 I k = 1 K p = 1 P 1 γ i 2 ( H p α p n = p i + s η n + h d ε d ) d i k ] ,
where F2 is the annual irrigation water consumption of the CPSID (kWh); p is the pump station number; P is the total number of pump stations; Hp is the pump station head (m); αp is the pump station efficiency (%); hd is the pump station head in the drip irrigation system in the sub-district (m; hd = 50 m), which comprises a head drip irrigation emitter of 10 m and a head loss in the drip irrigation system of 40 m; and εd is the efficiency of the pump station of the drip irrigation system (%; εd = 82%).
The total output value of various crops F3 in the CPSID is calculated according to Equation (3):
F 3 = i = 1 I j = 1 J k = 1 K u j k x i j k + i = 1 I k = 1 K u 2 k d 2 k ,
where ujk is the output value of the crops per unit area (yuan/ha), which is related to the type of crop and irrigation technology.

3.1.3. Objective Function

The irrigation water amount, energy consumption, and crop output value in an ID depend on the spatial patterns of crops and irrigation technologies; in other words, the area distribution of crops and irrigation technologies in each sub-district. In the CPSID, the irrigation water consumption, pump station energy consumption, and crop output value vary with different crops and irrigation technologies. Because of differences in planting density of different crops, the investment per unit area of drip irrigation also varies. Thus, improving the investment efficiency of the drip irrigation project could be a solution. The research objective of this paper is to seek an optimal scheme of the spatial patterns of crops and irrigation technologies by making full use of existing engineering facilities in the ID. The optimal scheme should improve the efficiency of drip irrigation project investment: minimize the annual irrigation water and energy consumption and maximize the crop output value in IDs. These conditions indicate a multi-objective optimization problem.
The first objective function W1(X) is the minimum annual irrigation water consumption in the CPSID. The second term in Equation (1) is a constant. Therefore, W1(X) is calculated according to Equation (4):
min W 1 ( X ) = i = 1 I j = 1 J k 1 K q j k x i j k γ i j n = 1 i + s η n ,
where X = {xijk}, X is the set of decision variables.
The second objective function W2(X) is the minimum annual energy consumption in the CPSID, and the third term in Equation (2) is a constant, so W2(X) is expressed as Equation (5):
min W 2 ( X ) = 1 367.34 [ i = 1 I k = 1 K p = 1 P q 1 k H p x i 1 k γ i 1 α p n = p i + s η n + i = 1 I k = 1 K p = 1 P 1 γ i 2 ( H p α p n = p i + s η n + h d ε d ) q 2 k x i 2 k ] .
The third objective function Z1(X) is the maximum output value of crops in the CPSID, since the second term in Equation (3) is a constant, Z1(X) is expressed as Equation (6):
max Z 1 ( X ) = i = 1 I j = 1 J k = 1 K u j k x i j k .

3.1.4. Constraints

(1)
Area constraint of each sub-district
To prevent the ecological environment degradation caused by blindly expanding the farmland area, the area of each sub-district in the CPSID remains unchanged, as demonstrated in Equation (7):
j = 1 J k = 1 K x i j k = S i k = 1 K d i k     i = 1 ,   2 ,   ,   I .
(2)
Constraints of the annual water amount for a sub-district
The annual water amount for the sub-district is limited by the amount of water from the source, as well as by the capacity of the CPS, the WCP&C, and the WDP&CS of the sub-district. The constraint on the upper limit of annual water amount for the sub-district is shown in Equation (8).
j = 1 J k = 1 K q j k x i j k γ i j n = 1 i + s η n Q i k = 1 K q 2 k d i k γ i 2 n 1 i + s η n   i = 1 ,   2 ,   ,   I ,
where Qi is the upper limit of annual water amount for the sub-district (m3), as shown in Table 1.
(3)
Area constraints of various crops in the CPSID
To both ensure food security and consider the supply and demand relationship of the agricultural products market, the planting area of each crop in the ID should be controlled between its upper and lower limits, as shown in Equations (9) and (10).
i = 1 I j = 1 J x i j k b k max i = 1 I d i k     k = 1 ,   2 ,   . . . . . . ,   K ,
i = 1 I j = 1 J x i j k b k min i = 1 I d i k     k = 1 ,   2 ,   . . . . . . ,   K ,
where b k max and b k min are the upper limit and lower limit of crop k planting area, respectively (Table 6).
(4)
Constraint conditions of drip irrigation project investment
The investment of new drip irrigation projects in the ID is constrained by the total investment.
i = 1 I k = 1 K c k x i 2 k T ,
where ck is the investment per unit area of the new drip irrigation project (yuan/ha), which depends on the crop type, because different crops are planted in different densities. T is the total investment quota of the drip irrigation projects in the ID (yuan).
(5)
Non-negative constraint:
x i j k 0 .

3.2. The Algorithm of the Model Solution

This is a multi-objective linear programming model. The objective functions are Equations (4)–(6). The equality constraint is Equation (7), and the inequality constraints are Equations (8)–(12). The decision variable is xijk. The multi-objective linear programming model is as follows:
max Z 1 = Z 1 ( X ) ,
min W 1 = W 1 ( X ) ,
min W 2 = W 2 ( X ) ,
subject   to   A X B ,
X 0 ,
where A X B represents the inequality constraints (7)–(11), and X 0 represents the non-negative constraints (12). Zimmerman solved the above multiple objective programming problem by using the concept of fuzzy set [32]. The membership functions for the objective are defined as
μ 1 ( Z 1 ) = Z 1 ( X ) Z 1 Z 1 * Z 1 ,
μ 2 ( W 1 ) = W 1 W 1 ( X ) W 1 W 1 * ,
μ 3 ( W 2 ) = W 2 W 2 ( X ) W 2 W 2 * ,
where Z 1 * , W 1 * , W 2 * are the ideal solutions of problems (13)–(15) and (16), (17); Z 1 , W 1 , W 2 are the anti-ideal solutions of problems (13)–(15) and (16), (17).
The two-stage algorithm of multi-objective linear programming is used to solve Equations (13) and (14). The experimental environment is Windows 10 and MATLAB R2014a. The algorithm steps are as follows:
Step 1:
Obtain the ideal and the anti-ideal solutions.
According to the objective functions (4)–(6) and constraint conditions (7)–(12), the data in Table 1, Table 2, Table 3, Table 4, Table 5 and Table 6 were substituted into MATLAB linear programming toolbox, and obtained both the ideal solutions Z 1 * , W 1 * , W 2 * and the anti-ideal solutions Z 1 ,   W 1 , W 2 .
Step 2:
First stage of the algorithm.
Based on the membership functions (18)–(20), problems (13) and (17) are transformed to [33,34].
max λ ,
subject   to   λ ( Z 1 ( X ) Z 1 ) / ( Z 1 * Z 1 ) ,
λ ( W 1 W 1 ( X ) ) / ( W 1 W 1 * ) ,
λ ( W 2 W 2 ( X ) ) / ( W 2 W 2 * ) ,
A X B ; X 0 ; λ [ 0 , 1 ] ,
where the problems (21)–(25) are a linear programming problem. The objective function is problem (21). The constraints are problems (22)–(25). The data in Table 1, Table 2, Table 3, Table 4, Table 5 and Table 6 were substituted into MATLAB linear programming toolbox, and obtained the values of λ and xijk.
Step 3:
Second stage of the algorithm.
Based on the λ calculated in Step 2, problems (21)–(24) are transformed to [33,34].
max λ ¯ = 1 3 ( λ 1 + λ 2 + λ 3 ) ,
subject   to   λ λ 1 ( Z 1 ( X ) Z 1 ) / ( Z 1 * Z 1 ) ,
λ λ 2 ( W 1 W 1 ( X ) ) / ( W 1 W 1 * ) ,
λ λ 3 ( W 2 W 2 ( X ) ) / ( W 1 W 1 * ) ,
A X B ; X 0 ; λ [ 0 , 1 ] ; λ l [ 0 , 1 ] , l = 1 , 2 , 3 ,
where the problems (26)–(30) are a linear programming problem. The objective function is problem (26). The constraints are problems (27)–(30). The data in Table 1, Table 2, Table 3, Table 4, Table 5 and Table 6 were substituted into MATLAB linear programming toolbox, and obtained the values of λ1, λ2, λ3, and xijk.
According to the above algorithm steps, the flowchart of the algorithm is shown in Figure 4.

4. Results and Discussion

The drip irrigation investment in the Jingdian Phase Irrigation District was 40,000 × 104 yuan, and the value and data presented in Table 1, Table 2, Table 3, Table 4, Table 5 and 
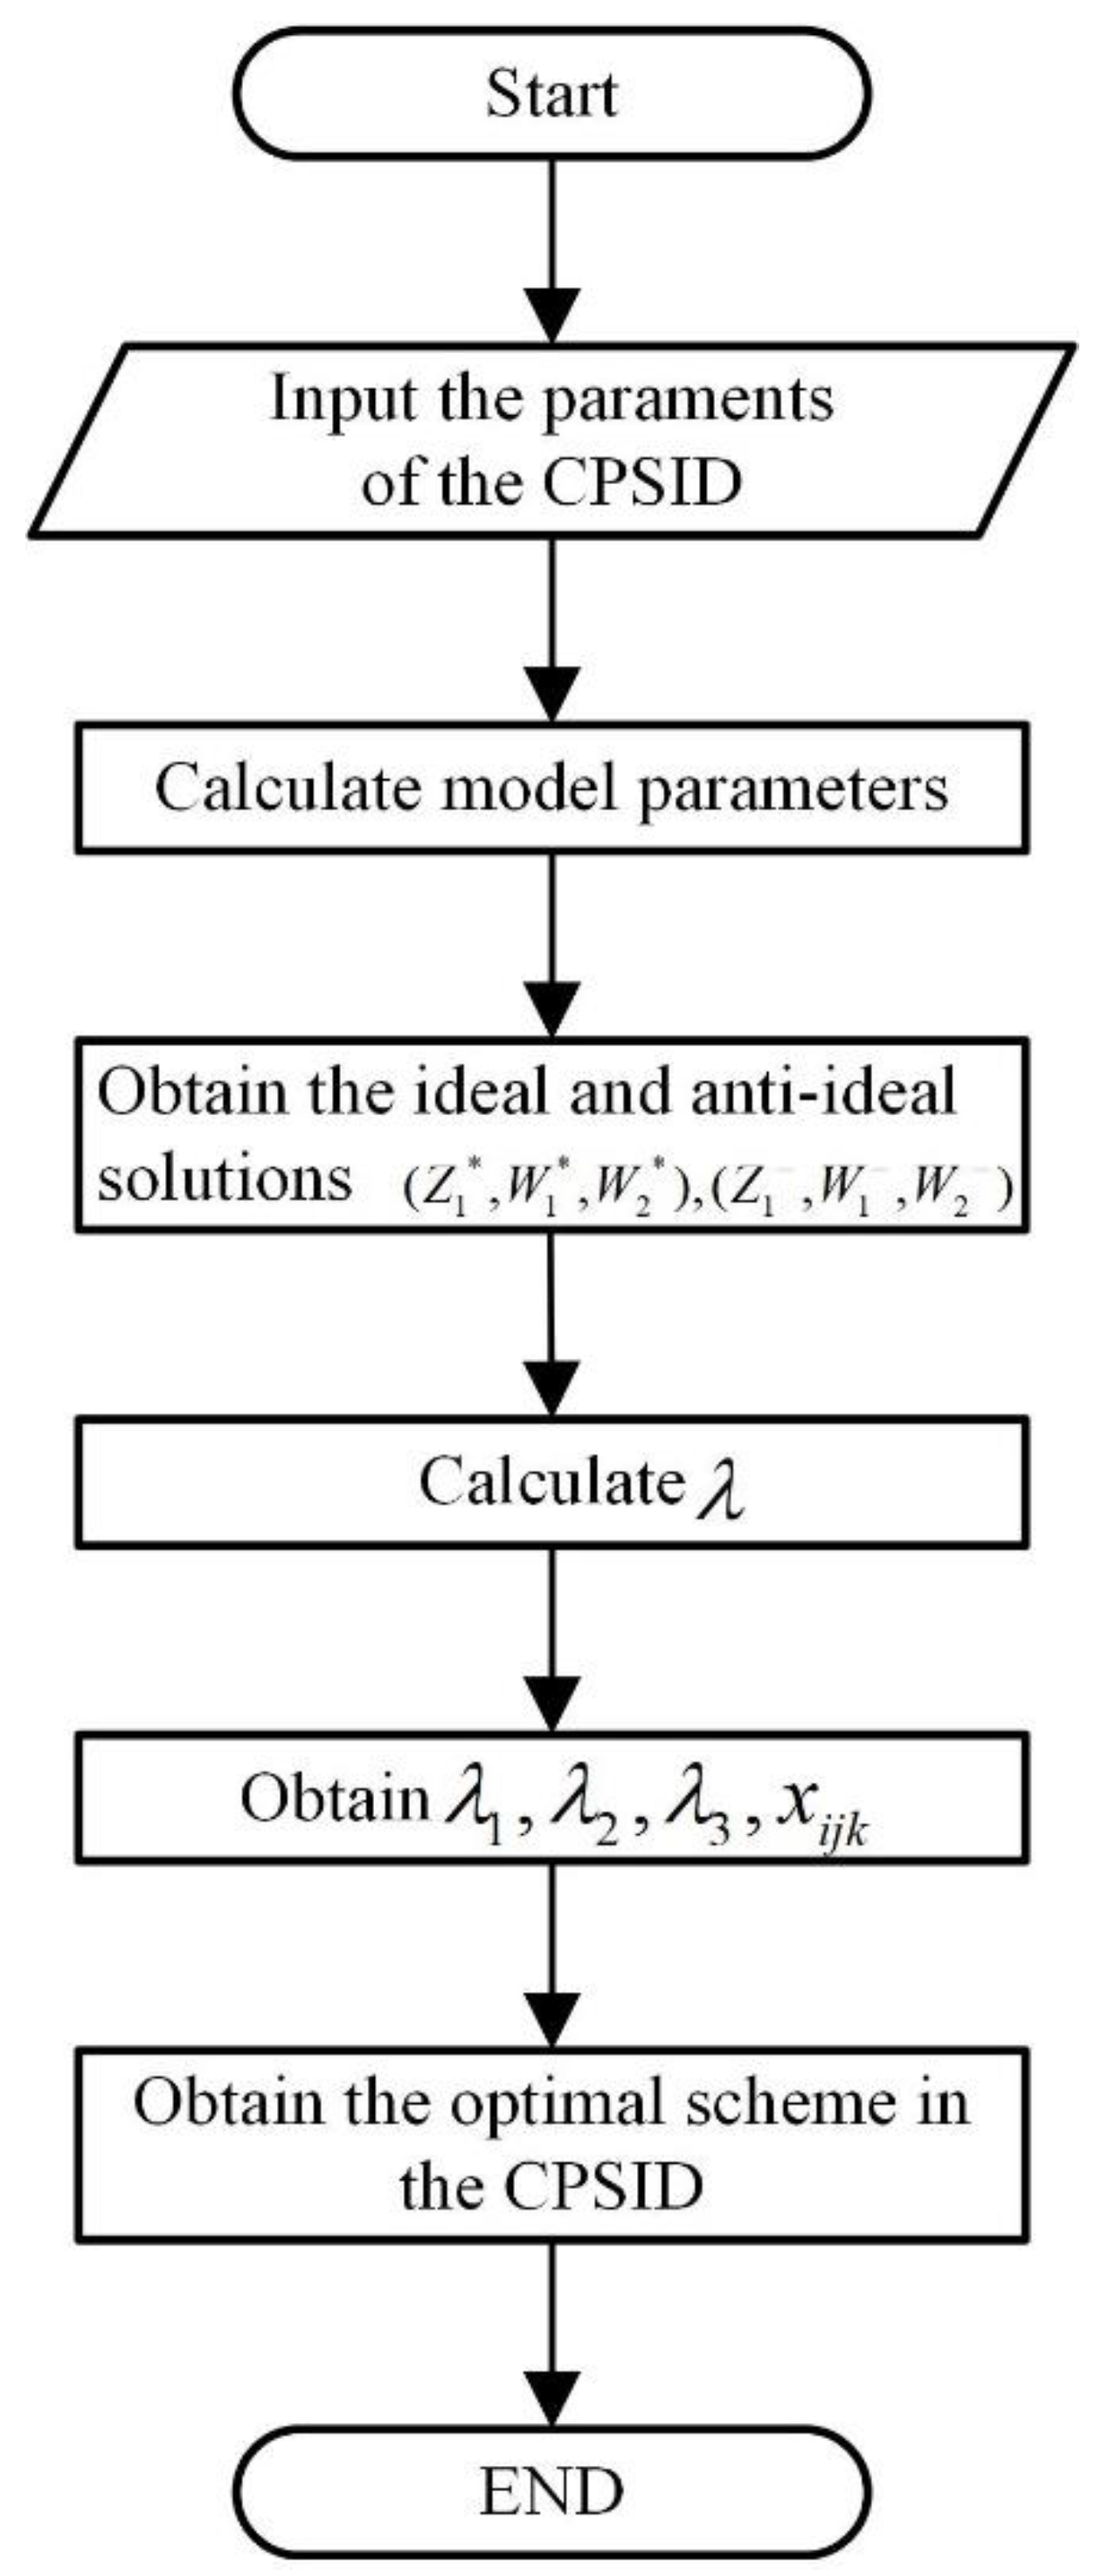
Table 6 were input to the objective functions (4)–(6) and the constraint conditions (7)–(12). The ideal solutions ( Z 1 * , W 1 * , W 2 * ) and the anti-ideal solutions ( Z 1 , W 1 , W 2 ) were (765,307,095, 97,249,784, 122,606,014) and (510,911,364, 146,310,129, 192,864,931), respectively.
In the first step, the problems (18)–(22) are a linear programming problem, calculated with MATLAB toolbox, Z1 = 761,502,174 yuan, W1 = 102,258,392 m3, and W2 = 129,099,716 kWh, λ = 0.49.
In the second step, the problems (23)–(26) are also a linear programming problem, calculated with MATLAB toolbox, Z1 = 766,902,174 yuan, W1 = 100,353,658 m3, W2 = 126,016,650 kWh, and λ1 = 0.52, λ2 = 0.81, λ3 = 0.62.
The calculation result of the second step is better than that of the first step. The calculation results of the example in literature [34,35] are similar to those in our paper, so we choose the calculation results of the second step.
According to the xijk obtained in the second step and the present area of various crops in drip irrigation (Table 5). The optimal scheme of the spatial patterns of crops and irrigation technologies in the Jingdian Phase I Irrigation District were obtained (Table 7).
The data for the optimal scheme (Table 7) can be substituted into Equations (1)–(3) for calculation of the annual irrigation water consumption, annual energy consumption, and crop output value of the ID (Table 8). Compared with the 2020 conditions (Table 5), the optimal scheme could reduce the annual irrigation water and energy consumption by 3722 × 104 m3 and 5515 × 104 kWh, respectively. Furthermore, it could increase the crop output value by 19,277 × 104 yuan; that is, the scheme could reduce water and energy consumption by 26.18% and 29.38%, and increase income by 29.55%.
A comparison of the spatial patterns in 2020 (Table 5) and that of the optimal scheme (Table 7) reveals that: (1) The spatial distribution of crops in each sub-district of the present situation is less concentrated than that of the optimal scheme. For example, there are currently eight crops in surface irrigation in sub-district 7, but only one crop in surface irrigation in the optimal sub-district 7 (Table 7). The centralized distribution of crops in the optimal scheme is beneficial to modern agriculture’s large-scale and intensive management. (2) In the optimal scheme, the area of drip irrigation increased from 1660 ha to 9810 ha (Table 8), which is 44.7% of the ID’s total area. After the optimization, the areas of drip irrigation in the low elevation sub-districts 1–4 remained almost unchanged, while those in the high elevation sub-districts 5–10 increased obviously (Table 8). The increase of the drip irrigation area in the high elevation sub-districts was much bigger than in the low elevation sub-districts. The reason is that the higher the elevation of the sub-district, the longer the distance of water transportation, which leads to a greater water loss. For the same crop, the net irrigation quota of drip irrigation is lower than that of surface irrigation (Table 4); therefore, the area of drip irrigation is greatly increased in the high elevation sub-districts, resulting in significant water saving and energy saving effects. (3) In the optimal scheme, the planting structure changed considerably (Table 7). The areas of grain crops with high water consumption and low output values decreased significantly. For example, the areas of wheat and corn reached the lower limits of the constraint conditions (Table 6 and Table 7). By contrast, the areas of crops with low water consumption and high output values increased significantly. For example, the areas of fruit trees, vegetables, and potatoes all reached their upper limits (Table 6 and Table 7). In the optimal scheme, the spatial patterns of crops and irrigation technologies were adjusted synchronically. For instance, fruit trees provide a high output value with a low net irrigation quota per unit area and low investment in drip irrigation per unit area (Table 3). Therefore, drip irrigation was applied to all fruit trees while the area reached the upper limits of constraint conditions (Table 6). The above adjustment is beneficial to water saving, energy saving, and output increasing.
A comparison of the indicators (Table 8) from the present situation (Table 5) and those of the optimal scheme (Table 7) reveals that: (1) For sub-districts 1 and 2, the two indexes of each sub-district (irrigation water consumption and annual energy consumption) increased after the optimization. However, for sub-districts 3–10, these two indexes were smaller than the present situation (Table 8). If the whole ID is taken into consideration, the two indexes were lower than the present situation. The optimal scheme can save 26.18% water and 29.38% energy compared with the present situation. (2) For sub-districts 2–4, the output value of crops in each sub-district for the optimal scheme was lower than the present situation, while for sub-districts 5–10, the output value of crops increased after the optimization (Table 8). From the perspective of the whole ID, the output value of crops in the optimal scheme was higher than the present situation (Table 8), indicating that the optimal scheme adjusts crops with a high output value to the high elevation sub-districts. (3) Although the three indexes of the optimal scheme (annual irrigation water consumption, annual energy consumption, and crop output value) were not as good as the present situation in some sub-districts, they were better than the present situation in the rest of the sub-districts (Table 8). From the perspective of the whole ID, the three indexes of the optimal scheme were better than the present situation (
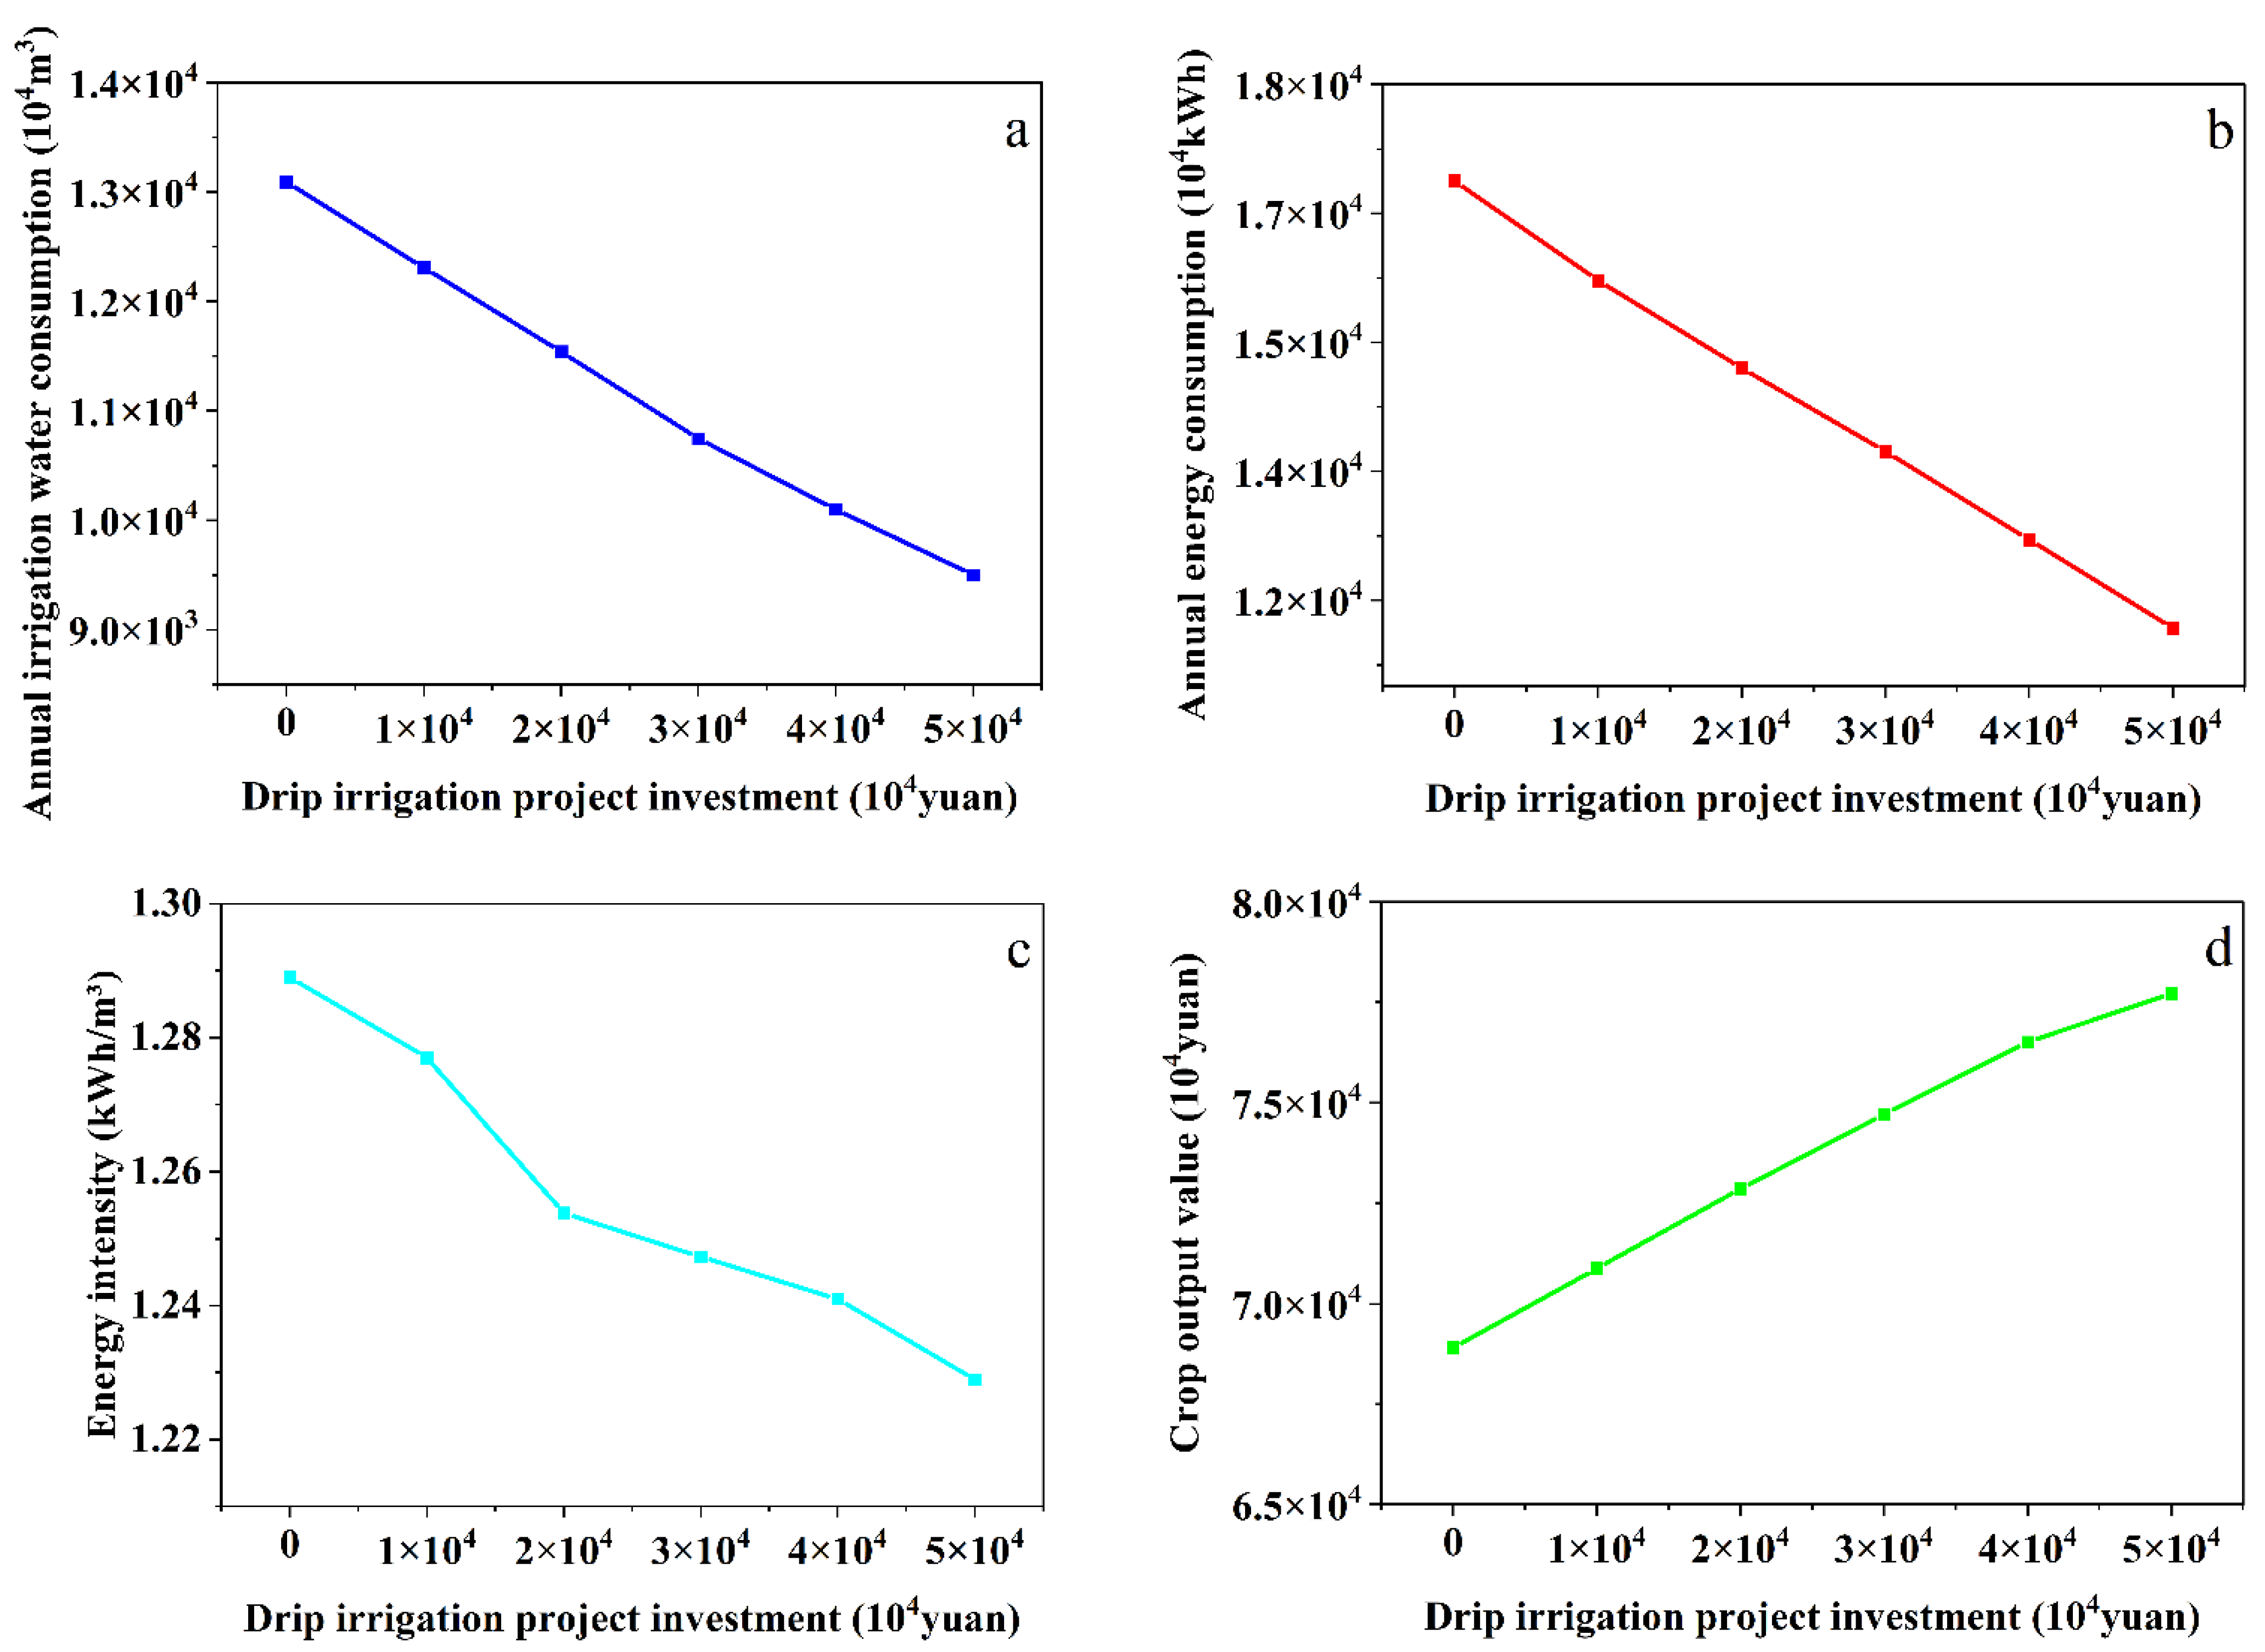
Table 8), indicating that the optimization reached a global solution instead of a local one, which also shows the rationality and correctness of the optimization model and solution method. To increase the drip irrigation area, it is necessary to increase drip irrigation project investment. Different optimal schemes can be obtained when the drip irrigation project investment is 10,000 × 104 yuan, 20,000 × 104 yuan, 30,000 × 104 yuan, 40,000 × 104 yuan, and 50,000 × 104 yuan, respectively. The annual irrigation water consumption, annual energy consumption, and crop output value of different investment optimization schemes can be obtained by using Equations (1)–(3). The annual irrigation water and energy consumption in the ID demonstrated a decreasing trend with an increase in drip irrigation investment (Figure 5a,b). Energy intensity is an important indicator to measure energy conservation in the CPSID [7]. The energy intensity in the ID demonstrated a downward trend with an increase in drip irrigation investment (Figure 5c), indicating that the CPSID can achieve significant energy conservation by saving water. The crop output value demonstrated a rising trend (Figure 5d).
The whole Jingdian Irrigation District consists of two-phase projects: Jingdian Phase I Irrigation District and Jingdian Phase II Irrigation District. The two projects are independent irrigation systems adjacent to each other. Non-point source pollution and soil salinization are environmental problems closely related to irrigation [50], especially in semi-arid areas where water resources are scarce due to excessive irrigation. The Jingdian Phase I Irrigation District drainage is into the Yellow River. The Jingdian Phase II Irrigation District drainage is into the desert. The irrigation water consumption of the Jingdian Phase I Irrigation District is relatively large, mainly due to the large proportion of high water-consuming crops planted by surface irrigation. In addition, the ID uses many chemical fertilizers; part of the chemical fertilizers enters the Yellow River with the drainage of the ID and pollutes the water source. By optimizing the crop planting structure in Jingdian Irrigation District [27,28], irrigation water consumption can be reduced, and farmland drainage can be reduced by 5.21~8.93%, effectively reducing agricultural non-point source pollution and soil salinization. In the Violada Irrigation District, the nitrate load decreased by 70.4% after replacing the surface irrigation with sprinkler irrigation [51]. If the model proposed here is adopted to optimize crop planting structures and the spatial patterns of irrigation technologies are considered simultaneously, the agricultural irrigation water consumption and farmland drainage in the Jingdian Irrigation District will be reduced, and the pollution degree of farmland drainage to the Yellow River will also be reduced.
Drip irrigation can reduce harmful gas emissions [52]. The experimental results show that drip irrigation reduced nitrous oxide and nitric oxide by 13.0% and 16.7%, respectively, compared with surface irrigation [26,53].
Developing a water-saving irrigation method and controlling water consumption are effective measures to protect the environment in arid regions [8,9,10]. Moreover, the area constraint of each sub-district in the optimization model in this paper avoids the trend of ecological deterioration caused by blindly expanding irrigation areas in arid regions [10,11]. The research shows that under the condition of keeping the irrigation area unchanged, the optimization scheme can save water, save energy, and increase crop income. This is conducive to the simultaneous improvement of economic, social, and ecological benefits and to guarantee the sustainable development of the CPSID.
The quantitative analysis of the ecological and environmental benefits of the optimized spatial patterns of crops and irrigation technologies in the Jingdian Phase I Irrigation District should be further explored. The contents to be further studied include soil salinization, non-point source pollution, and harmful gas emissions reduction by drip irrigation in the CPSIDs. These problems are also the limitations of this study. Further study could supplement the ecological environment benefit maximization of the target function. Drip irrigation has the effect of reducing the salt alkalinity, non-point source pollution, and harmful gas discharge. Based on this effect, the constraint is added in the model. Of course, these further studies require a lot of experiments, using measured data, obtaining the parameters required in the model, and improving the model. We will also carry out further research regarding the uncertainty of the model parameters [35,36,37,44,45,46].

5. Conclusions

The multiple objective programming problem models is applied to the Jingdian Phase I Irrigation District. Under the condition of 40,000 × 104 yuan of drip irrigation project investment, the optimal scheme of the spatial pattern of crops and irrigation technologies in the ID was obtained. Compared with the present situation, the annual irrigation water consumption was reduced by 3722 × 104 m3, and the energy consumption was reduced by 5515 × 104 kWh, whereas the crop output value was increased by 19,277 × 104 yuan. This optimization saves water by 26.18%, saves energy by 29.38%, and increases income by 29.55%. The optimal spatial pattern of the ID suggested that crops with low water consumption and high output values should be distributed in the sub-districts with high elevations. Meanwhile, crops with high water consumption and low output values should be distributed in the sub-districts with low elevations. The results showed that the annual irrigation water consumption, energy consumption, and energy intensity decreased with the increasing investment in drip irrigation projects, while the crop output value increased.
Optimizing the spatial patterns of crops and irrigation technologies in the CPSID is vital to promoting the sustainable development of agriculture and ecological environment protection in arid regions.

Author Contributions

Data curation, C.B., Y.Z. and W.P.; writing—original draft preparation, C.B.; writing—review and editing, C.B., L.Y., C.W., Y.Z. and W.P.; conceptualization, methodology, supervision, L.Y. All authors have read and agreed to the published version of the manuscript.

Funding

This study is supported by National Natural Science Foundation of China (41571222).

Institutional Review Board Statement

Not applicable.

Informed Consent Statement

Not applicable.

Data Availability Statement

The data are available on request.

Acknowledgments

The authors are thankful to the editor and anonymous reviewers for their constructive comments and suggestions on the revision of this paper.

Conflicts of Interest

The authors declare no conflict of interest.

References

  1. Yang, Y.C.E.; Ringler, C.; Brown, C.; Mondal, A.H. Modeling the Agricultural Water-Energy-Food Nexus in the Indus River Basin, Pakistan. J. Water Resour. Plan. Manag. 2016, 142, 04016062. [Google Scholar] [CrossRef]
  2. Li, M.; Fu, Q.; Singh, V.P.; Liu, D.; Li, T. Stochastic multi-objective modeling for optimization of water-food-energy nexus of irrigated agriculture. Adv. Water Resour. 2019, 127, 209–224. [Google Scholar] [CrossRef]
  3. Espinosa-Tasón, J.; Berbel, J.; Gutiérrez-Martín, C. Energized water: Evolution of water-energy nexus in the Spanish irrigated agriculture, 1950–2017. Agric. Water Manag. 2020, 233, 106073. [Google Scholar] [CrossRef]
  4. Hardy, L.; Garrido, A.; Juana, L. Evaluation of Spain’s Water-Energy Nexus. Int. J. Water Resour. Dev. 2012, 28, 151–170. [Google Scholar] [CrossRef] [Green Version]
  5. García, I.F.; Montesinos, P.; Poyato, E.C.; Díaz, J.A.R. Optimal Design of Pressurized Irrigation Networks to Minimize the Operational Cost under Different Management Scenarios. Water Resour. Manag. 2017, 31, 1995–2010. [Google Scholar] [CrossRef]
  6. Jiang, Y.; Xiong, L.; Yao, F.; Xu, Z. Optimizing regional irrigation water allocation for multi-stage pumping-water irrigation system based on multi-level optimization-coordination model. J. Hydrol. X 2019, 4, 100038. [Google Scholar] [CrossRef]
  7. Karimov, A.K.; Toshev, R.H.; Karshiev, R.; Karimov, A.A. Water-energy nexus in Central Asia’s lift irrigation schemes: Multi-level linkages. Renew. Sustain. Energy Rev. 2021, 147, 111148. [Google Scholar] [CrossRef]
  8. Ma, L.; Bo, J.; Li, X.; Fang, F.; Cheng, W. Identifying key landscape pattern indices influencing the ecological security of inland river basin: The middle and lower reaches of Shule River Basin as an example. Sci. Total Environ. 2019, 674, 424–438. [Google Scholar] [CrossRef]
  9. Cheng, B.; Li, H. Improving water saving measures is the necessary way to protect the ecological base flow of rivers in water shortage areas of Northwest China. Ecol. Indic. 2021, 123, 107347. [Google Scholar] [CrossRef]
  10. Zhang, Z.; Zheng, Y.; Han, F.; Xiong, R.; Feng, L. Recovery of an endorheic lake after a decade of conservation efforts: Mediating the water conflict between agriculture and ecosystems. Agric. Water Manag. 2021, 256, 107107. [Google Scholar] [CrossRef]
  11. Fan, X.; Zhang, W.; Chen, W.; Chen, B. Land–water–energy nexus in agricultural management for greenhouse gas mitigation. Appl. Energy 2020, 265, 114796. [Google Scholar] [CrossRef]
  12. Hosseinzadeh-Bandbafha, H.; Nabavi-Pelesaraei, A.; Khanali, M.; Ghahderijani, M.; Chau, K.-W. Application of data envelopment analysis approach for optimization of energy use and reduction of greenhouse gas emission in peanut production of Iran. J. Clean. Prod. 2018, 172, 1327–1335. [Google Scholar] [CrossRef]
  13. Moradi-Jalal, M.; Rodin, S.I.; Mariño, M.A. Use of Genetic Algorithm in Optimization of Irrigation Pumping Stations. J. Irrig. Drain. Eng. 2004, 130, 357–365. [Google Scholar] [CrossRef]
  14. Moradi-Jalal, M.; Karney, B.W. Optimal design and operation of irrigation pumping stations using mathematical programming and Genetic Algorithm (GA). J. Hydraul. Res. 2008, 46, 237–246. [Google Scholar] [CrossRef]
  15. Fernández García, I.; Moreno, M.A.; Rodríguez Díaz, J.A. Optimum pumping station management for irrigation networks sectoring: Case of Bembezar MI (Spain). Agric. Water Manag. 2014, 144, 150–158. [Google Scholar] [CrossRef]
  16. Córcoles, J.I.; Tarjuelo, J.M.; Moreno, M.A. Methodology to improve pumping station management of on-demand irrigation networks. Biosyst. Eng. 2016, 144, 94–104. [Google Scholar] [CrossRef]
  17. Reca, J.; García-Manzano, A.; Martínez, J. Optimal Pumping Scheduling for Complex Irrigation Water Distribution Systems. J. Water Resour. Plan. Manag. 2014, 140, 630–637. [Google Scholar] [CrossRef]
  18. Liu, X.; Tian, Y.; Lei, X.; Wang, H.; Liu, Z.; Wang, J. An improved self-adaptive grey wolf optimizer for the daily optimal operation of cascade pumping stations. Appl. Soft Comput. 2019, 75, 473–493. [Google Scholar] [CrossRef]
  19. Zhang, Z.; Lei, X.; Tian, Y.; Wang, L.; Wang, H.; Su, K. Optimized Scheduling of Cascade Pumping Stations in Open-Channel Water Transfer Systems Based on Station Skipping. J. Water Resour. Plan. Manag. 2019, 145, 05019011. [Google Scholar] [CrossRef]
  20. Gong, Y.; Cheng, J. Optimization of Cascade Pumping Stations’ Operations Based on Head Decomposition-Dynamic Programming Aggregation Method Considering Water Level Requirements. J. Water Resour. Plan. Manag. 2018, 144, 04018034. [Google Scholar] [CrossRef]
  21. Karimov, A.K.; Smakhtin, V.; Karimov, A.A.; Khodjiev, K.; Yakubov, S.; Platonov, A.; Avliyakulov, M. Reducing the energy intensity of lift irrigation schemes of Northern Tajikistan- potential options. Renew. Sustain. Energy Rev. 2018, 81, 2967–2975. [Google Scholar] [CrossRef]
  22. Huang, Q.; Wang, J.; Li, Y. Do water saving technologies save water? Empirical evidence from North China. J. Environ. Econ. Manag. 2017, 82, 1–16. [Google Scholar] [CrossRef]
  23. Soto-Garcia, M.; Martínez-Alvarez, V.; García-Bastida, P.; Alcon, F.; Martin-Gorriz, B. Effect of water scarcity and modernisation on the performance of irrigation districts in south-eastern Spain. Agric. Water Manag. 2013, 124, 11–19. [Google Scholar] [CrossRef]
  24. Cobo, M.T.C.; Díaz, J.A.R.; Montesinos, P.; Luque, R.L.; Poyato, E.C. Low energy consumption seasonal calendar for sectoring operation in pressurized irrigation networks. Irrig. Sci. 2010, 29, 157–169. [Google Scholar] [CrossRef]
  25. Meshram, D.; Gorantiwar, S.; Singh, N.; Babu, K. Response of micro-irrigation systems on growth, yield and WUE of Pomegranate (Punica granatum L.) in semi-arid regions of India. Sci. Hortic. 2019, 246, 686–692. [Google Scholar] [CrossRef]
  26. Tian, D.; Zhang, Y.; Mu, Y.; Zhou, Y.; Zhang, C.; Liu, J. The effect of drip irrigation and drip fertigation on N2O and NO emissions, water saving and grain yields in a maize field in the North China Plain. Sci. Total Environ. 2017, 575, 1034–1040. [Google Scholar] [CrossRef]
  27. Li, J.; Fei, L.; Li, S.; Xue, C.; Shi, Z.; Hinkelmann, R. Development of “water-suitable” agriculture based on a statistical analysis of factors affecting irrigation water demand. Sci. Total Environ. 2020, 744, 140986. [Google Scholar] [CrossRef]
  28. Li, J.; Fei, L.; Li, S.; Shi, Z.; Liu, L. The influence of optimized allocation of agricultural water and soil resources on irrigation and drainage in the Jingdian Irrigation District, China. Irrig. Sci. 2020, 38, 37–47. [Google Scholar] [CrossRef]
  29. Sun, S.K.; Wu, P.T.; Wang, Y.B.; Zhao, X.N. Impact of changing cropping pattern on the regional agricultural water productivity. J. Agric. Sci. 2015, 153, 767–778. [Google Scholar] [CrossRef]
  30. Wang, Y.B.; Wu, P.T.; Engel, B.A.; Sun, S.K. Application of water footprint combined with a unified virtual crop pattern to evaluate crop water productivity in grain production in China. Sci. Total Environ. 2014, 497–498, 1–9. [Google Scholar] [CrossRef]
  31. Zhang, C.; McBean, E.A.; Huang, J. A Virtual Water Assessment Methodology for Cropping Pattern Investigation. Water Resour. Manag. 2014, 28, 2331–2349. [Google Scholar] [CrossRef]
  32. Zimmermann, H.-J. Fuzzy programming and linear programming with several objective functions. Fuzzy Sets Syst. 1978, 1, 45–55. [Google Scholar] [CrossRef]
  33. Li, R.-J.; Lee, E. Fuzzy approaches to multicriteria de Novo programs. J. Math. Anal. Appl. 1990, 153, 97–111. [Google Scholar] [CrossRef] [Green Version]
  34. Lee, E.S.; Li, R. Fuzzy multiple objective programming and compromise programming with Pareto optimum. Fuzzy Sets Syst. 1993, 53, 275–288. [Google Scholar] [CrossRef]
  35. Batamiz, A.; Allahdadi, M.; Hladík, M. Obtaining Efficient Solutions of Interval Multi-objective Linear Programming Problems. Int. J. Fuzzy Syst. 2020, 22, 873–890. [Google Scholar] [CrossRef]
  36. Allahdadi, M.; Deng, C. An improved three-step method for solving the interval linear programming problems. Yugosl. J. Oper. Res. 2018, 28, 435–451. [Google Scholar] [CrossRef]
  37. Ashayerinasab, H.A.; Nehi, H.M.; Allahdadi, M. Solving the interval linear programming problem: A new algorithm for a general case. Expert Syst. Appl. 2018, 93, 39–49. [Google Scholar] [CrossRef]
  38. Inuiguchi, M.; Sakawa, M. Minimax regret solution to linear programming problems with an interval objective function. Eur. J. Oper. Res. 1995, 86, 526–536. [Google Scholar] [CrossRef]
  39. Rivaz, S.; Yaghoobi, M. Weighted sum of maximum regrets in an interval MOLP problem. Int. Trans. Oper. Res. 2018, 25, 1659–1676. [Google Scholar] [CrossRef]
  40. Rivaz, S.; Yaghoobi, M.A.; Hladík, M. Using modified maximum regret for finding a necessarily efficient solution in an interval MOLP problem. Fuzzy Optim. Decis. Mak. 2015, 15, 237–253. [Google Scholar] [CrossRef]
  41. Chang, C.-T. Multi-choice goal programming. Omega 2007, 35, 389–396. [Google Scholar] [CrossRef]
  42. Chang, C.-T. Revised multi-choice goal programming. Appl. Math. Model. 2008, 32, 2587–2595. [Google Scholar] [CrossRef]
  43. Pérez-Cañedo, B.; Verdegay, J.L.; Pérez, R.M. An epsilon-constraint method for fully fuzzy multiobjective linear programming. Int. J. Intell. Syst. 2020, 35, 600–624. [Google Scholar] [CrossRef]
  44. Burton, D.; Toint, P.L. On an instance of the inverse shortest paths problem. Math. Program. 1992, 53, 45–61. [Google Scholar] [CrossRef] [Green Version]
  45. Naghavi, M.; Foroughi, A.; Zarepisheh, M. Inverse optimization for multi-objective linear programming. Optim. Lett. 2019, 13, 281–294. [Google Scholar] [CrossRef]
  46. Khalifa, H.A.E.-W.; Kumar, P.; Mirjalili, S. A KKM approach for inverse capacitated transportation problem in neutrosophic environment. Sadhana 2021, 46, 166. [Google Scholar] [CrossRef]
  47. Khalifa, H.A.E.W.; Kumar, P. A goal programming approach for multi-objective linear fractional programming problem with LR possibilistic variables. Int. J. Syst. Assur. Eng. Manag. 2022, 1–9. [Google Scholar] [CrossRef]
  48. Khalifa, H.A.E.-W.; Alharbi, M.; Kumar, P. A new method for solving quadratic fractional programming problem in neutrosophic environment. Open Eng. 2020, 11, 880–886. [Google Scholar] [CrossRef]
  49. Dutta, D.; Kumar, P. Application of fuzzy goal programming approach to multi-objective linear fractional inventory model. Int. J. Syst. Sci. 2015, 46, 2269–2278. [Google Scholar] [CrossRef]
  50. Ibrikci, H.; Cetin, M.; Karnez, E.; Flügel, W.A.; Tilkici, B.; Bulbul, Y.; Ryan, J. Irrigation-induced nitrate losses assessed in a Mediterranean irrigation district. Agric. Water Manag. 2015, 148, 223–231. [Google Scholar] [CrossRef]
  51. Jiménez-Aguirre, M.; Isidoro, D. Hydrosaline Balance in and Nitrogen Loads from an irrigation district before and after modernization. Agric. Water Manag. 2018, 208, 163–175. [Google Scholar] [CrossRef] [Green Version]
  52. Li, Y.; Gao, X.; Tenuta, M.; Gui, D.; Li, X.; Xue, W.; Zeng, F. Enhanced efficiency nitrogen fertilizers were not effective in reducing N2O emissions from a drip-irrigated cotton field in arid region of Northwestern China. Sci. Total Environ. 2020, 748, 141543. [Google Scholar] [CrossRef] [PubMed]
  53. Ding, J.; Fang, F.; Lin, W.; Qiang, X.; Xu, C.; Mao, L.; Li, Q.; Zhang, X.; Li, Y. N2O emissions and source partitioning using stable isotopes under furrow and drip irrigation in vegetable field of North China. Sci. Total Environ. 2019, 665, 709–717. [Google Scholar] [CrossRef] [PubMed]
Figure 1. Location of the Jingdian Phase I Irrigation District.
Sustainability 14 04943 g001
Figure 2. The Jingdian Phase I Irrigation District system.
Sustainability 14 04943 g002
Figure 3. Composition of area for present situation and optimal scheme in sub-district.
Sustainability 14 04943 g003
Figure 4. The flowchart of the algorithm.
Sustainability 14 04943 g004
Figure 5. Relationship between the drip irrigation project investment and the (a) annual irrigation water consumption, (b) annual energy consumption, (c) energy intensity and (d) crop output value in the CPSID.
Sustainability 14 04943 g005
Table 1. The parameters of the sub-districts.
Sub-DistrictUpper Limit of Annual Water Amount (104 m3)Elevation Range (m)Water Use Efficiency of Surface Irrigation Unit (%)Water Use Efficiency of Drip Irrigation Unit (%)Area (ha)
12371561–15807294357
215501580–159669932306
344391596–162067936533
417071620–163870952375
56001638–16586994806
631401658–167668924054
723191676–169471933454
815451694–171172941943
9311711–1738749535
10731738–1757739589
Table 2. The parameters of the pump stations.
Pump StationPump Station Head (m)Pump Station Efficiency (%)Design Discharge of Pump Station (m3/s)
1818413.17
2808313.14
3808313.13
4308413.12
5278412.96
6378311.57
729757.70
832756.27
927755.79
1029753.36
1127701.45
1243600.20
1330600.10
Table 3. The water use efficiency of the water conveyance pipe and channel segment.
Water Conveyance Pipe and Channel Segment12345678910111213
Water Use Efficiency0.970.980.970.970.980.990.950.960.960.990.990.990.99
Table 4. The parameters of irrigation technologies.
Irrigation TechnologiesSurface IrrigationDrip Irrigation
CropWMF1CF2VPOCF2VPO
Net Irrigation Quota (m3/ha)4080413534165200308445403426375031201696249718842070
Output Value per Unit Area (yuan/ha)18,24022,26029,70024,00044,62554,00025,20025,20028,80053,55064,80030,24030,240
Investment per Unit Area of Drip Irrigation (yuan/ha)--------46,50045,00060,00057,00052,500
Crop abbreviation: W, wheat; M, Maize; F1, Flax; C, Chinese wolfberry; F2, Fruit tree; V, Vegetable; P, Potato; O, Oil sunflower. There are 8 crops (on the left) for Surface Irrigation Unit and 5 crops (on the right) for Drip Irrigation Unit.
Table 5. The present situation of the spatial patterns of crops and irrigation technologies in the Jingdian Phase I Irrigation District (in 2020, ha).
Sub-DistrictSurface Irrigation Drip Irrigation
WMF1CF2VPOCF2VPO
164112201242273618026000
2415726127393101742331160166000
311762058359608784946593295002002700
4428748131403191792391200000171
51452534414109618141058000
67301277223385453064092043018211000
7622108819058464261348174010001490
8372503114352781712181040014800
9221300000000000
10450440000000000
Crop abbreviation as shown in Table 4.
Table 6. Area constraints and scheme comparison of crops (ha).
CropCrop Area ConstraintScheme Comparison
Upper LimitLower LimitPresentOptimal
Wheat6029201040192010
Maize10,167338967783389
Flax187862612521878
Chinese wolfberry564188376268
Fruit tree5748173934775748
Vegetable3654106621313654
Potato4196132126424196
Oil sunflower19166391277809
Table 7. The optimal scheme of spatial patterns of crops and irrigation technologies in the Jingdian Phase Irrigation District (ha).
Sub-DistrictSurface Irrigation Drip Irrigation
WMF1CF2VPOCF2VPO
10 0 0 131 0 143 0 0 57 26 0 0 0
20 1964 0 0 0 176 0 0 0 166 0 0 0
32009 1425 0 0 0 0 1940 638 50 0 200 270 0
40 0 367 0 0 0 1837 0 0 0 0 0 171
50 0 0 0 0 0 0 0 0 58 748 0 0
60 0 0 0 0 0 0 0 30 1785 2239 0 0
70 0 1511 0 0 0 0 0 0 1794 0 149 0
80 0 0 0 0 0 0 0 0 1795 148 0 0
90 0 0 0 0 0 0 0 0 35 0 0 0
100 0 0 0 0 0 0 0 0 89 0 0 0
Crop abbreviation as shown in Table 4.
Table 8. Comparison of the indicators between the present situation and the optimal scheme.
Sub-DistrictDrip Irrigation Area (ha)Annual Irrigation Water Consumption (104 m3)Annual Energy
Consumption (104 kWh)
Crop Output (104 Yuan)
PresentOptimalPresentOptimalPresentOptimalPresentOptimal
12683 21624219020910631390
2166166 140915101372147069356212
3520520 403540094423439419,26815,592
4171171 155213731863165067436236
558806 54627071939024265158
63224054 285412464047191912,33124,154
72491943 210913173749229910,04114,544
81481943 14054982257860615510,571
9035 289451769187
10089 662210646213477
Irrigation district indicators1660981014,21910,49718,77013,25565,24484,521
Publisher’s Note: MDPI stays neutral with regard to jurisdictional claims in published maps and institutional affiliations.

