1. Introduction
Molybdenum dioxide (MoO
2) is an important transition metal oxide with versatile properties, such as high thermal and chemical stability [
1,
2,
3], high theoretical capacitance for supercapacitors [
4,
5], high theoretical capacity for lithium ion batteries [
6,
7], efficient catalytic performance [
8,
9], diverse optical properties [
10,
11] and being good precursor to prepare other molybdenum compounds [
12]. In addition to the intrinsic properties of their bulk form, MoO
2 quantum dots (QDs), with size limited to several nanometers, could exhibit other novel physical and chemical properties thanks to strong quantum effects. For example, MoO
2 QDs could be applied in surface-enhanced Raman scattering analysis, photothermal conversion and photothermal therapy thanks to their intense localized surface plasmon resonance effect in the near-infrared region [
13]. Of course, MoO
2 QDs still could be used for energy storage [
6,
14] and electrocatalytic reactions [
15], and so on. Therefore, the preparation of MoO
2 QDs inevitably becomes critical and has attracted widespread attention and research.
Researchers have developed some methods to prepare MoO
2 QDs, such as photo-induced method [
13], thermal decomposition reaction [
14], solvothermal method [
6] and hydrothermal method [
15]. For example, Haihong Yu et al. [
13] synthesized MoO
2 QDs through a photo-induced method, taking advantage of Mo (CO)
6 as the structural guiding agent and molybdenum source. In this photo-induced method, the solution containing Mo (CO)
6 and dimethyl formamide was held at 80 °C for 1 h in nitrogen atmosphere to obtain a kind of yellow intermediate, and then the yellow intermediate, after being freeze dried, was dispersed into ethanol aquepus solution followed simulated solar irradiation for 10 h to get MoO
2 QDs, but it can be seen from the blurred TEM images in this study that there still existed lots of organic substance mixed with the MoO
2 QDs, which maybe resulted from the dimethyl formamide absorbed on MoO
2 QDs, and which also demonstrated that it’s difficult to separate MoO
2 QDs from organic substance with high boiling point through simple washing processes. Yan Zhan et al. [
16] prepared MoO
2 QDs using a solvothermal method, in which hydrogen peroxide was added into ethanol containing MoS
2 powder with a further reaction process at 180 °C for 5 h, and the resulting suspension containing MoO
2 QDs was dialyzed for 48 h by putting the dialysis bag in deionized water many times. Obviously, besides the waste of deionized water, dialysis was an inefficient way for the purification and then would result in failure to mass production. In addition, from the TEM images of the obtained MoO
2 QDs, it can be seen that the particle size distribution of the MoO
2 QDs was broad. Shitong Wang et al. [
14] chose a thermal decomposition way to prepare MoO
2 QDs, in which the authors mixed hydrogen titanate nanowires precursor, ammonium molybdate, dopamine hydrochloride and ammonium hydroxide together in ethanol aqueous solution with vigorous stirring for 6 h, and then, after calcination at 450 °C for 2 h in a nitrogen atmosphere, MoO
2 QDs were obtained and firmly deposited on TiO
2 nanowires to form hierarchical TiO
2/MoO
2@C. Yuchi Wan et al. [
15] developed a two-step method to synthesize MoO
2 QDs, in which rGO suspension was mixed with the aqueous solution of ammonium molybdate hydrate and glucose and then maintained at 180 °C for 12 h, followed a freeze drying process and a carbonization process at 750 °C to get the final product (Mo
2C-MoO
2@rGO). In another study by Chundong Wang et al. [
6], a one-step solvothermal approach was developed to prepare MoO
2 QDs, in which sodium molybdate, ammonium chloride, nitric acid and ethanol were added in aqueous suspension of reduced graphene oxide (rGO) with continuous stirring, and then the obtained mixture was maintained at 180 °C for 10 h in the solvothermal process to get the MoO
2 QDs/rGO, in which graphene played a crucial role in the formation of MoO
2 QDs. Obviously, clean and pure MoO
2 QDs cannot be obtained from these composites, containing the substrates firmly bonded with the MoO
2 QDs. To sum up, efficient, scalable and environmentally-friendly preparation methods still need to be studied to obtain clean and pure MoO
2 QDs.
Herein, a facile, scalable and sustainable approach with two steps is proposed to prepare MoO2 QDs without surfactants or other impurities. Firstly, a hydrothermal reaction is carried out to obtain MoO2 QDs dispersed in the solution containing ethylene glycol (EG) and its derivatives, which serve as surfactants with low boiling point and molecular weight. After the hydrothermal reaction, further freeze-drying and calcination processes in vacuum are conducted to remove the surfactants wrapping on the MoO2 QDs, taking advantage of the difference in the boiling points of MoO2 QDs and the surfactants. And the effects of other calcination atmosphere (air and nitrogen) with different calcination temperature and time are also systematically studied. In addition, the pseudocapacitive performance of the samples before and after calcination is tested and compared.
2. Materials and Methods
Molybdenum trioxide (MoO3), ethylene glycol were purchased from Shanghai Aladdin Biochemical Technology Co., Ltd., Shanghai, China. The chemicals used in this study were analytical grade without further purification.
The MoO
2 QDs wrapped in surfactants were prepared by a hydrothermal reaction. Specifically, 0.3 g of MoO
3 was added into the mixed solution of 25 mL of deionized water and 15 mL of EG under vigorous stirring, in which EG works as a reducing agent and surfactant. Then, the mixed solution was transferred into a Teflon-lined stainless-steel autoclave (100 mL) and maintained at 180 °C for 24 h in an electric oven. After being washed and freeze-dried, the MoO
2 QDs wrapped in a small amount of EG and its derivatives were obtained in powder form, and this un-calcined sample is denoted as Sample-U. Then, the MoO
2 QDs wrapped in surfactants were put into a tube furnace for calcination under different conditions. Due to the boiling points of EG and its possible derivatives are lower than 300 °C, the calcination in air was performed at different temperatures (300, 350, 400, 450 and 500 °C) for a certain time (0.25~2 h), and the obtained samples are denoted as Sample-A (calcination temperature/calcination time). For example, Sample-A (400 °C/2 h) means the sample after calcination in air at 400 °C for 2 h. At the same time, the calcination in nitrogen and vacuum (~several Pascals) was conducted at 400 °C for 2 h, and the obtained samples are denoted as Sample-N and Sample-V, respectively. The schematic diagram of the preparation and calcination processes of the MoO
2 QDs wrapped in surfactants are shown in
Figure 1.
X-ray diffraction (XRD) patterns of the samples were collected to characterize their crystalline phase by an X-ray powder diffractometer (D/Max 2200, Rigaku, Tokyo, Janpan) with Cu Kα radiation. The size and morphology were studied by a field-emission scanning electron microscope (FESEM, Nova-Nano 450, FEI). And the crystal structure and chemical composition were characterized by a transmission electron microscope (TEM, Tecnai G2 F30 S-Twin, FEI) equipped an energy-dispersive X-ray spectrometer (EDS, Oxford, UK).
All electrochemical measurements were carried out in a conventional three-electrode configuration using CHI 660E (Shanghai, China) electrochemical workstation. 0.5 M Na
2SO
4 solution was used as the electrolyte, and a platinum foil and a saturated calomel electrode were used as the counter electrode and reference electrode, respectively. The working electrode was fabricated by mixing the active materials, conductive carbon black and polytetrafluoroethylene in a weight ratio of 8:1:1 to form slurry and then sandwiching the slurry between two strips of clean nickel foam with a further press (10 MPa). Electrochemical impedance spectra (EIS), cyclic voltammetry (CV) and galvanostatic charge-discharge (GCD) curves were carried out. All the experiments were conducted at room temperature (~25 °C). The specific capacitance (Cs) of the electrodes were calculated according to the following equation [
17,
18,
19,
20,
21]:
Cs = and
Cs = IΔ
t/mΔ
V, where
I is the current, Δ
V is the voltage window,
ν is the scan rate, Δ
t is the discharging time and
m is the mass of the active materials.
3. Results
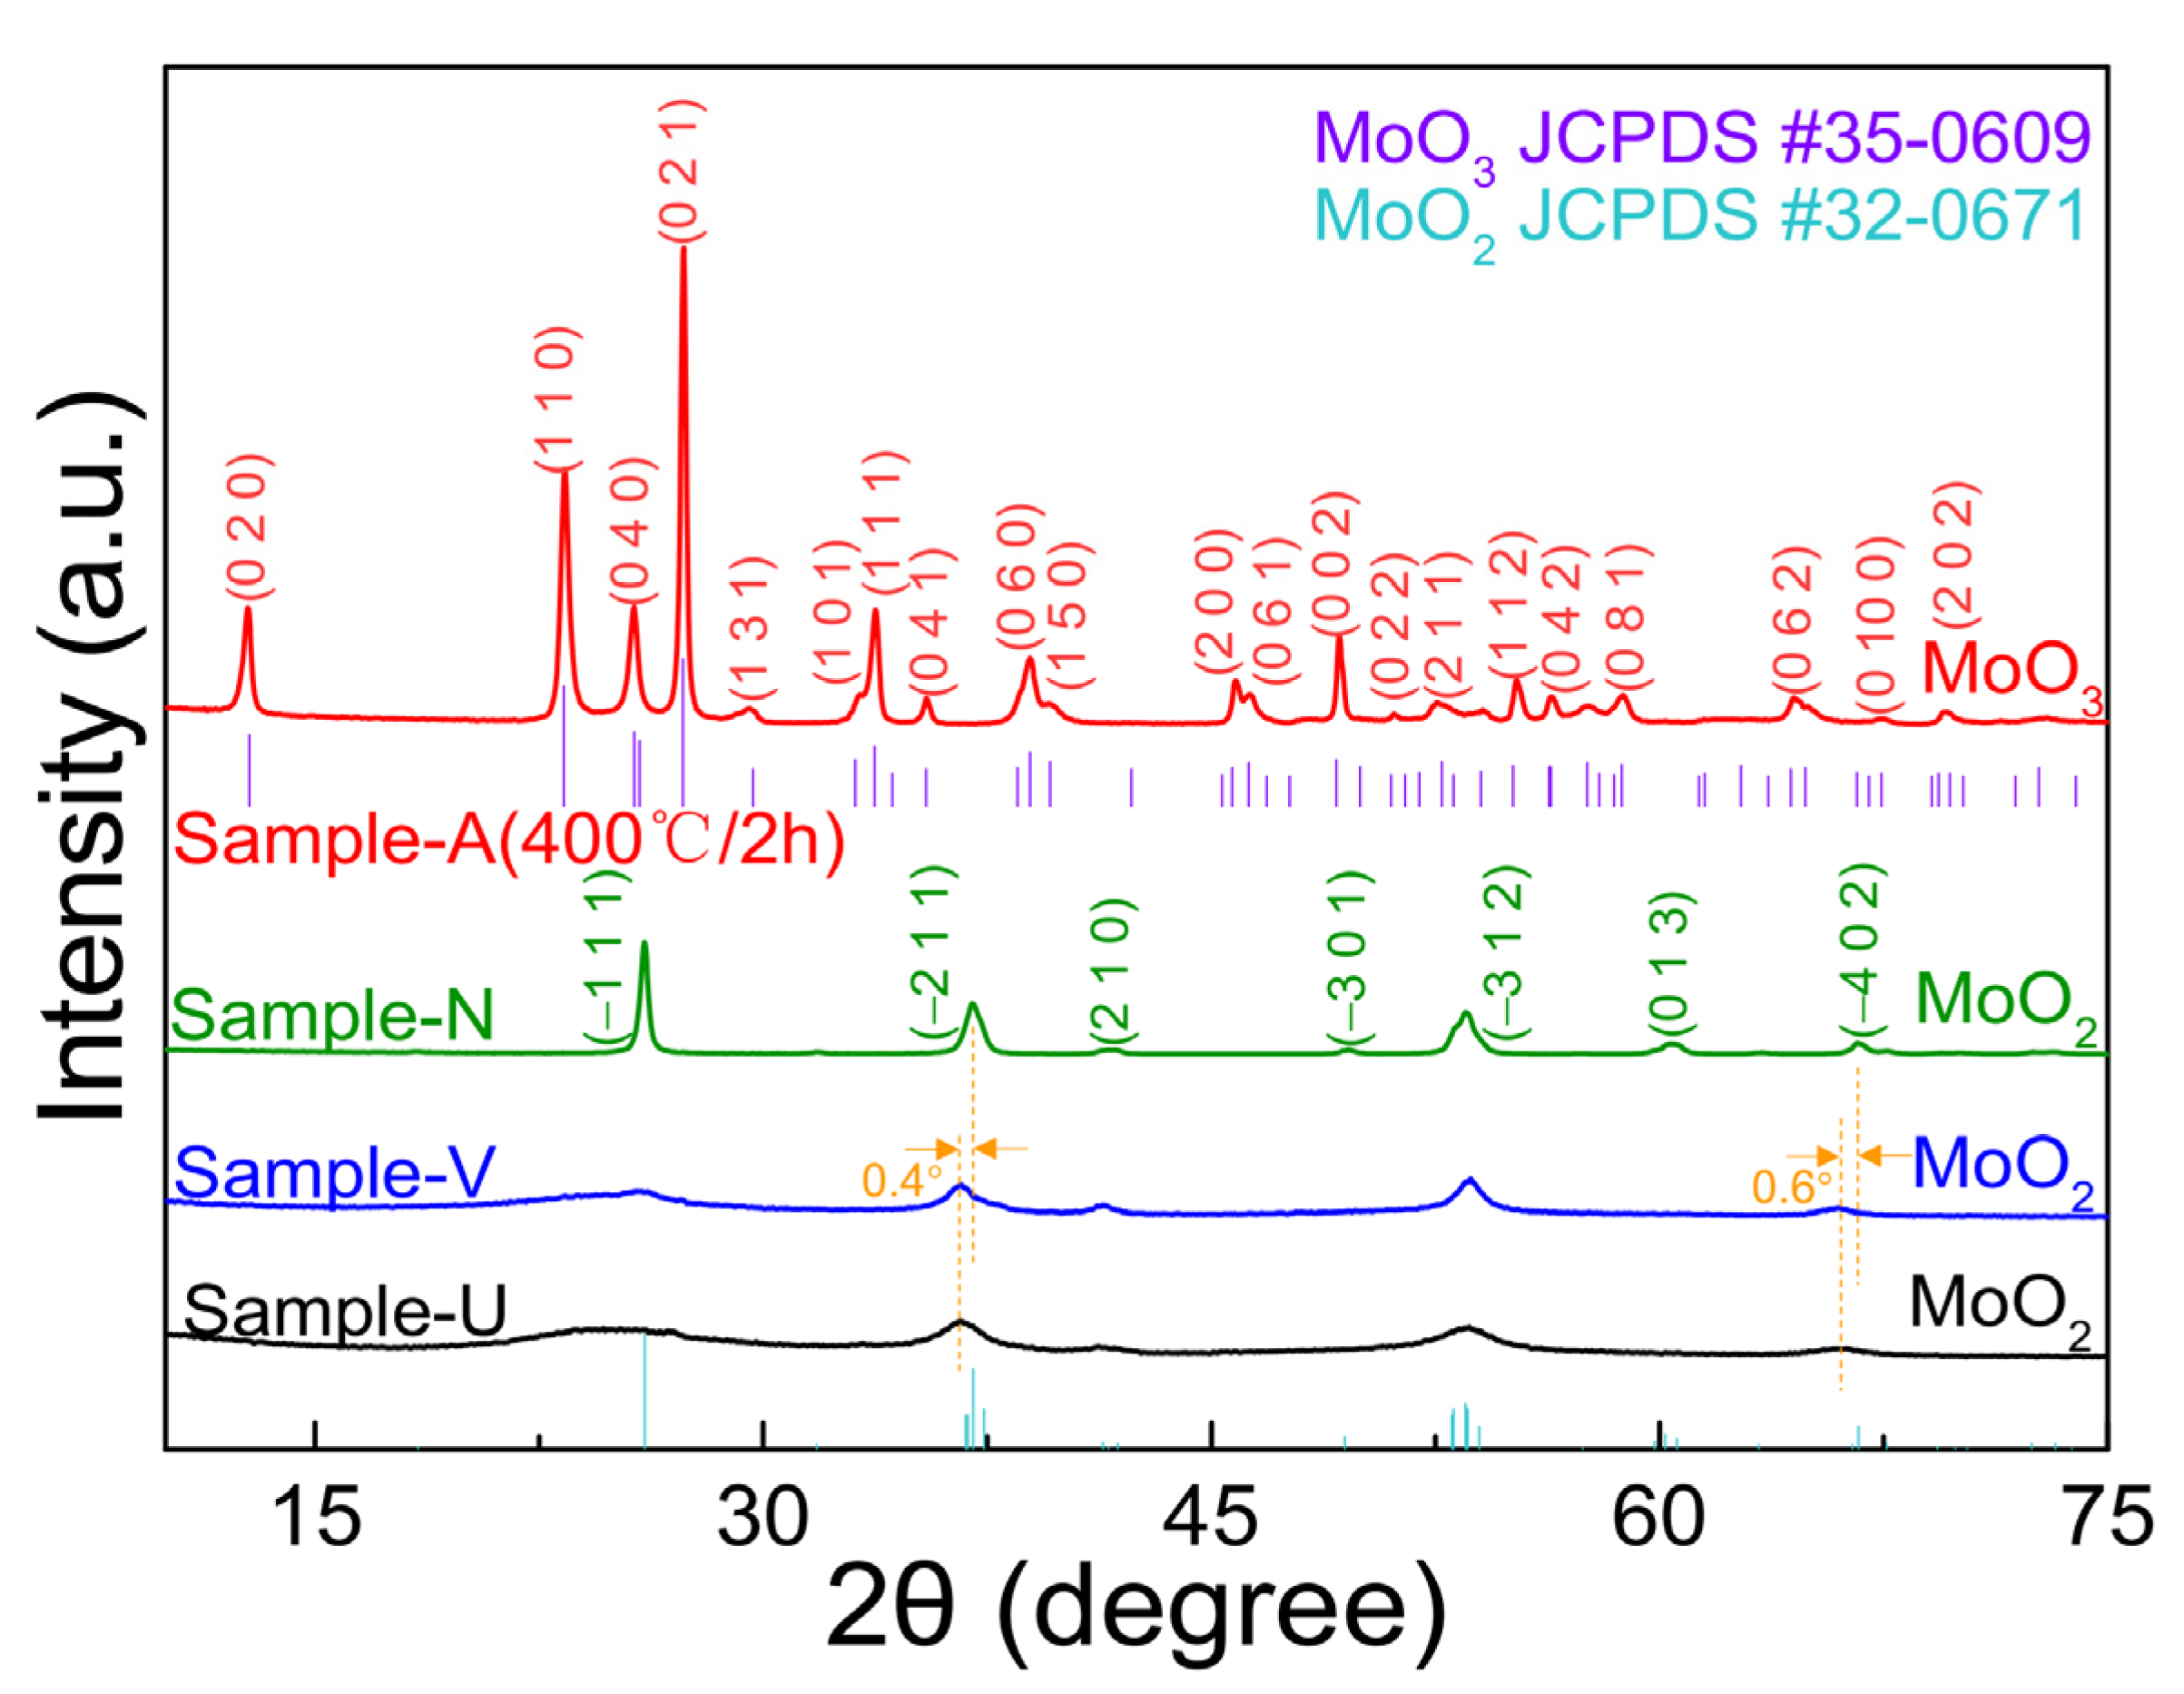
The XRD patterns of the prepared samples are employed to investigate their crystalline phase, as shown in
Figure 2 and
Figure S1. The diffraction peaks of the Sample-U, Sample-V and Sample-N could be indexed to the monoclinic structure of MoO
2 (JCPDS 32-0671), which demonstrates that the MoO
2 with monoclinic phase could be maintained after calcination in vacuum and nitrogen at 400 °C for 2 h. However, the diffraction peaks of the Sample-A (300 °C/2 h), Sample-A (400 °C/2 h) and Sample-A (500 °C/2 h) are all indexed to the orthorhombic structure of MoO
3 (JCPDS 35-0609), which means MoO
2 would be transformed into MoO
3 with orthorhombic phase after calcination in air for 2 h in the temperature range from 300–500 °C, and which also reveals that MoO
2 QDs could be oxidized by oxygen in air under the experiment conditions after the removal of surfactants. Furthermore, based on the Scherrer formula [
22,
23], it can be concluded that the Sample-V and Sample-U are similar in particle size, whereas the Sample-N calcined in nitrogen shows a slight increase in size and the samples calcined in air for 2 h all exhibit much larger size, and their sizes are observed directly by TEM and FESEM later, flowed mechanism discussion. In addition, it is worth noting that the diffraction peak position of the (−2 1 1) crystallographic plane of the Sample-V shifts to a smaller angle with an offset of 0.4°, which indicates that the interplanar spacing of the (−2 1 1) crystallographic plane increases by about 0.93% based on the Bragg’s law [
24,
25,
26], and the angle offset to the left is 0.6° for its (−4 0 2) crystallographic plane with about 0.46% lattice expansion. For the Sample-U, same angle shifts and same increase in interplanar spacing can be observed, which also indicates the high degree of similarity between the Sample-U and Sample-N in particle size. In order to get a clear understanding of the morphologies of the un-calcined sample and the samples calcined in air, their FESEM images are presented in
Figures S2, S3 and
Figure 3. It can be seen from
Figure S2 that the Sample-U shows very small nanoparticles with blurred characteristics, resulting from the surfactants wrapping on the MoO
2. After calcination in air for 2 h from 300–500 °C, as shown in
Figure 3a–e, the very small nanoparticles obviously grow with the increase of temperature by reacting with oxygen after getting rid of the surfactants and are transformed into MoO
3 according to the XRD results. When the calcination temperature rises from 300 °C (
Figure 3a) to 350 °C (
Figure 3b), the shapes of the MoO
3 nanoparticles keep spherical, which means that the growth speed of each crystallographic plane is similar in the temperature range. When the calcination temperature is held at 400 °C, relatively uniform MoO
3 nanoplates are obtained with thickness of 100~160 nm and width of 600~1200 nm, as shown in
Figure 3c and its inset, which indicates that the growth speed of the crystallographic plane along the plane of the nanoplate is faster than those of other crystallographic planes, which also demonstrates that the calcination temperature affects the growth speed of the crystallographic plane and then the morphologies of MoO
3. With the increase of the calcination temperature, the thickness and width of the MoO
3 nanoplates would grow non-uniformly, because of higher growth speed resulting in fierce competition of limited molybdenum source, as presented in
Figure 3d (450 °C) and
Figure 3e (500 °C). In addition, in order to make clear the growth process of MoO
3, the FESEM images of the samples with shorter calcination time in air are presented in
Figure 3f–h and
Figure S3a–d. With the increase of calcination time from 0.25 to 1 h in
Figure 3f–h, it can be noticed that the particles not only grow little by little, but also could directly form several nanoplates locally. In
Figure S3a–d, the calcination time is all 1 h. Some surfactant-like areas still exist in the Sample-A (300 °C/1 h) (
Figure S3a) and disappear in the Sample-A (350 °C/1 h) (
Figure S3b), and the two samples both display smaller particle size than the corresponding samples calcined for 2 h at the same temperature. When the calcination temperature is hold at 450 °C (
Figure S3c) or 500 °C (
Figure S3d) for 1 h, the MoO
3 nanoplates already could be formed non-uniformly in the whole area, which also indicates that higher calcination temperature possesses higher growth speed for all crystallographic planes.
Besides calcination temperature and time, calcination atmosphere also affects the calcination process tremendously. In order to conveniently compare the Sample-N and Sample-V with the Sample-U and Sample-A (400 °C/2 h), their TEM characterization is all presented in
Figure 4. Both
Figure 4a,b are the TEM images of the Sample-U, which clearly display that the MoO
2 QDs with particle size of 1.5~3 nm are wrapped by surfactants, and the surfactants are EG and its possible derivatives with low boiling points, which cannot be totally removed through conventional washing and drying processes. But, it can be seen that there are no surfactants any more in the Sample-A (400 °C/2 h), Sample-N and Sample-V, which means that the surfactants wrapping on the MoO
2 QDs are totally removed after calcination under the corresponding conditions, as shown in
Figure 4c–h.
Figure 4c presents a MoO
3 nanoplate of the Sample-A (400 °C/2 h), and its inset is the corresponding SAED pattern, which demonstrates its good crystallinity corresponding to its XRD result and lattice image in
Figure 4d, and which also reveals that the thickness direction of the MoO
3 nanoplate is parallel to the [
1,
2,
3,
4,
5,
6,
7,
8,
9,
10,
11,
12,
13,
14,
15,
16,
17,
18,
19,
20,
21] direction and the crystallographic planes grow faster along the direction perpendicular to the [
1,
2,
3,
4,
5,
6,
7,
8,
9,
10,
11,
12,
13,
14,
15,
16,
17,
18,
19,
20,
21] direction.
Figure 4e presents the clear TEM image of the clean Sample-N with particle size of 5~11 nm, which demonstrates a slightly larger size than Sample-U, and the corresponding circular SAED pattern consisting of discrete bright spots in the inset is indexed to the (−1 1 1), (2 1 0) and (0 1 3) planes of the monoclinic MoO
2, consistent with its XRD result. The possible formation mechanism is as following: when the Sample-N is being calcined in nitrogen (@1 atm), the surfactants wrapping on the MoO
2 QDs will be continuously evaporated and a space with much lower pressure will be continuously formed simultaneously, and the pressure difference between small particles will push the particles together to grow larger. The lattice image of the Sample-N in
Figure 4f shows a clear fringe spacing of 0.243 nm, which indicates the (−2 1 1) plane of the monoclinic MoO
2. In
Figure 4g, it is the clear TEM image of the clean Sample-V with particle size similar to that of the Sample-U, in which the inset is the corresponding SAED pattern with continuous circular line indexed to the (−1 1 1), (2 1 0) and (0 1 3) planes of the monoclinic MoO
2, consistent with its XRD result. The possible mechanism is as following: during the calcination process of the Sample-V in vacuum, the surfactants wrapping on the MoO
2 QDs are continuously evaporated without forming any pressure difference, which contributes to maintaining the initial positions of the MoO
2 QDs and keeping them separate from each other, just like the surfactants do before the calcination. The lattice image of the Sample-V in
Figure 4h shows a clear fringe spacing of 0.218 nm, which indicates the (2 1 0) plane of the monoclinic MoO
2. In addition, an EDS result is collected in
Figure S4 to verify the elements containing in the Sample-V, which are Mo and O except for Cu arising from the sample holder for TEM characterization, consistent with the XRD result. Based on the results above, it can be concluded that the calcination at 400 °C for 2 h is already proper in both nitrogen and vacuum to remove the possible surfactants, and vacuum is the best calcination atmosphere without changing the sizes of the MoO
2 QDs.
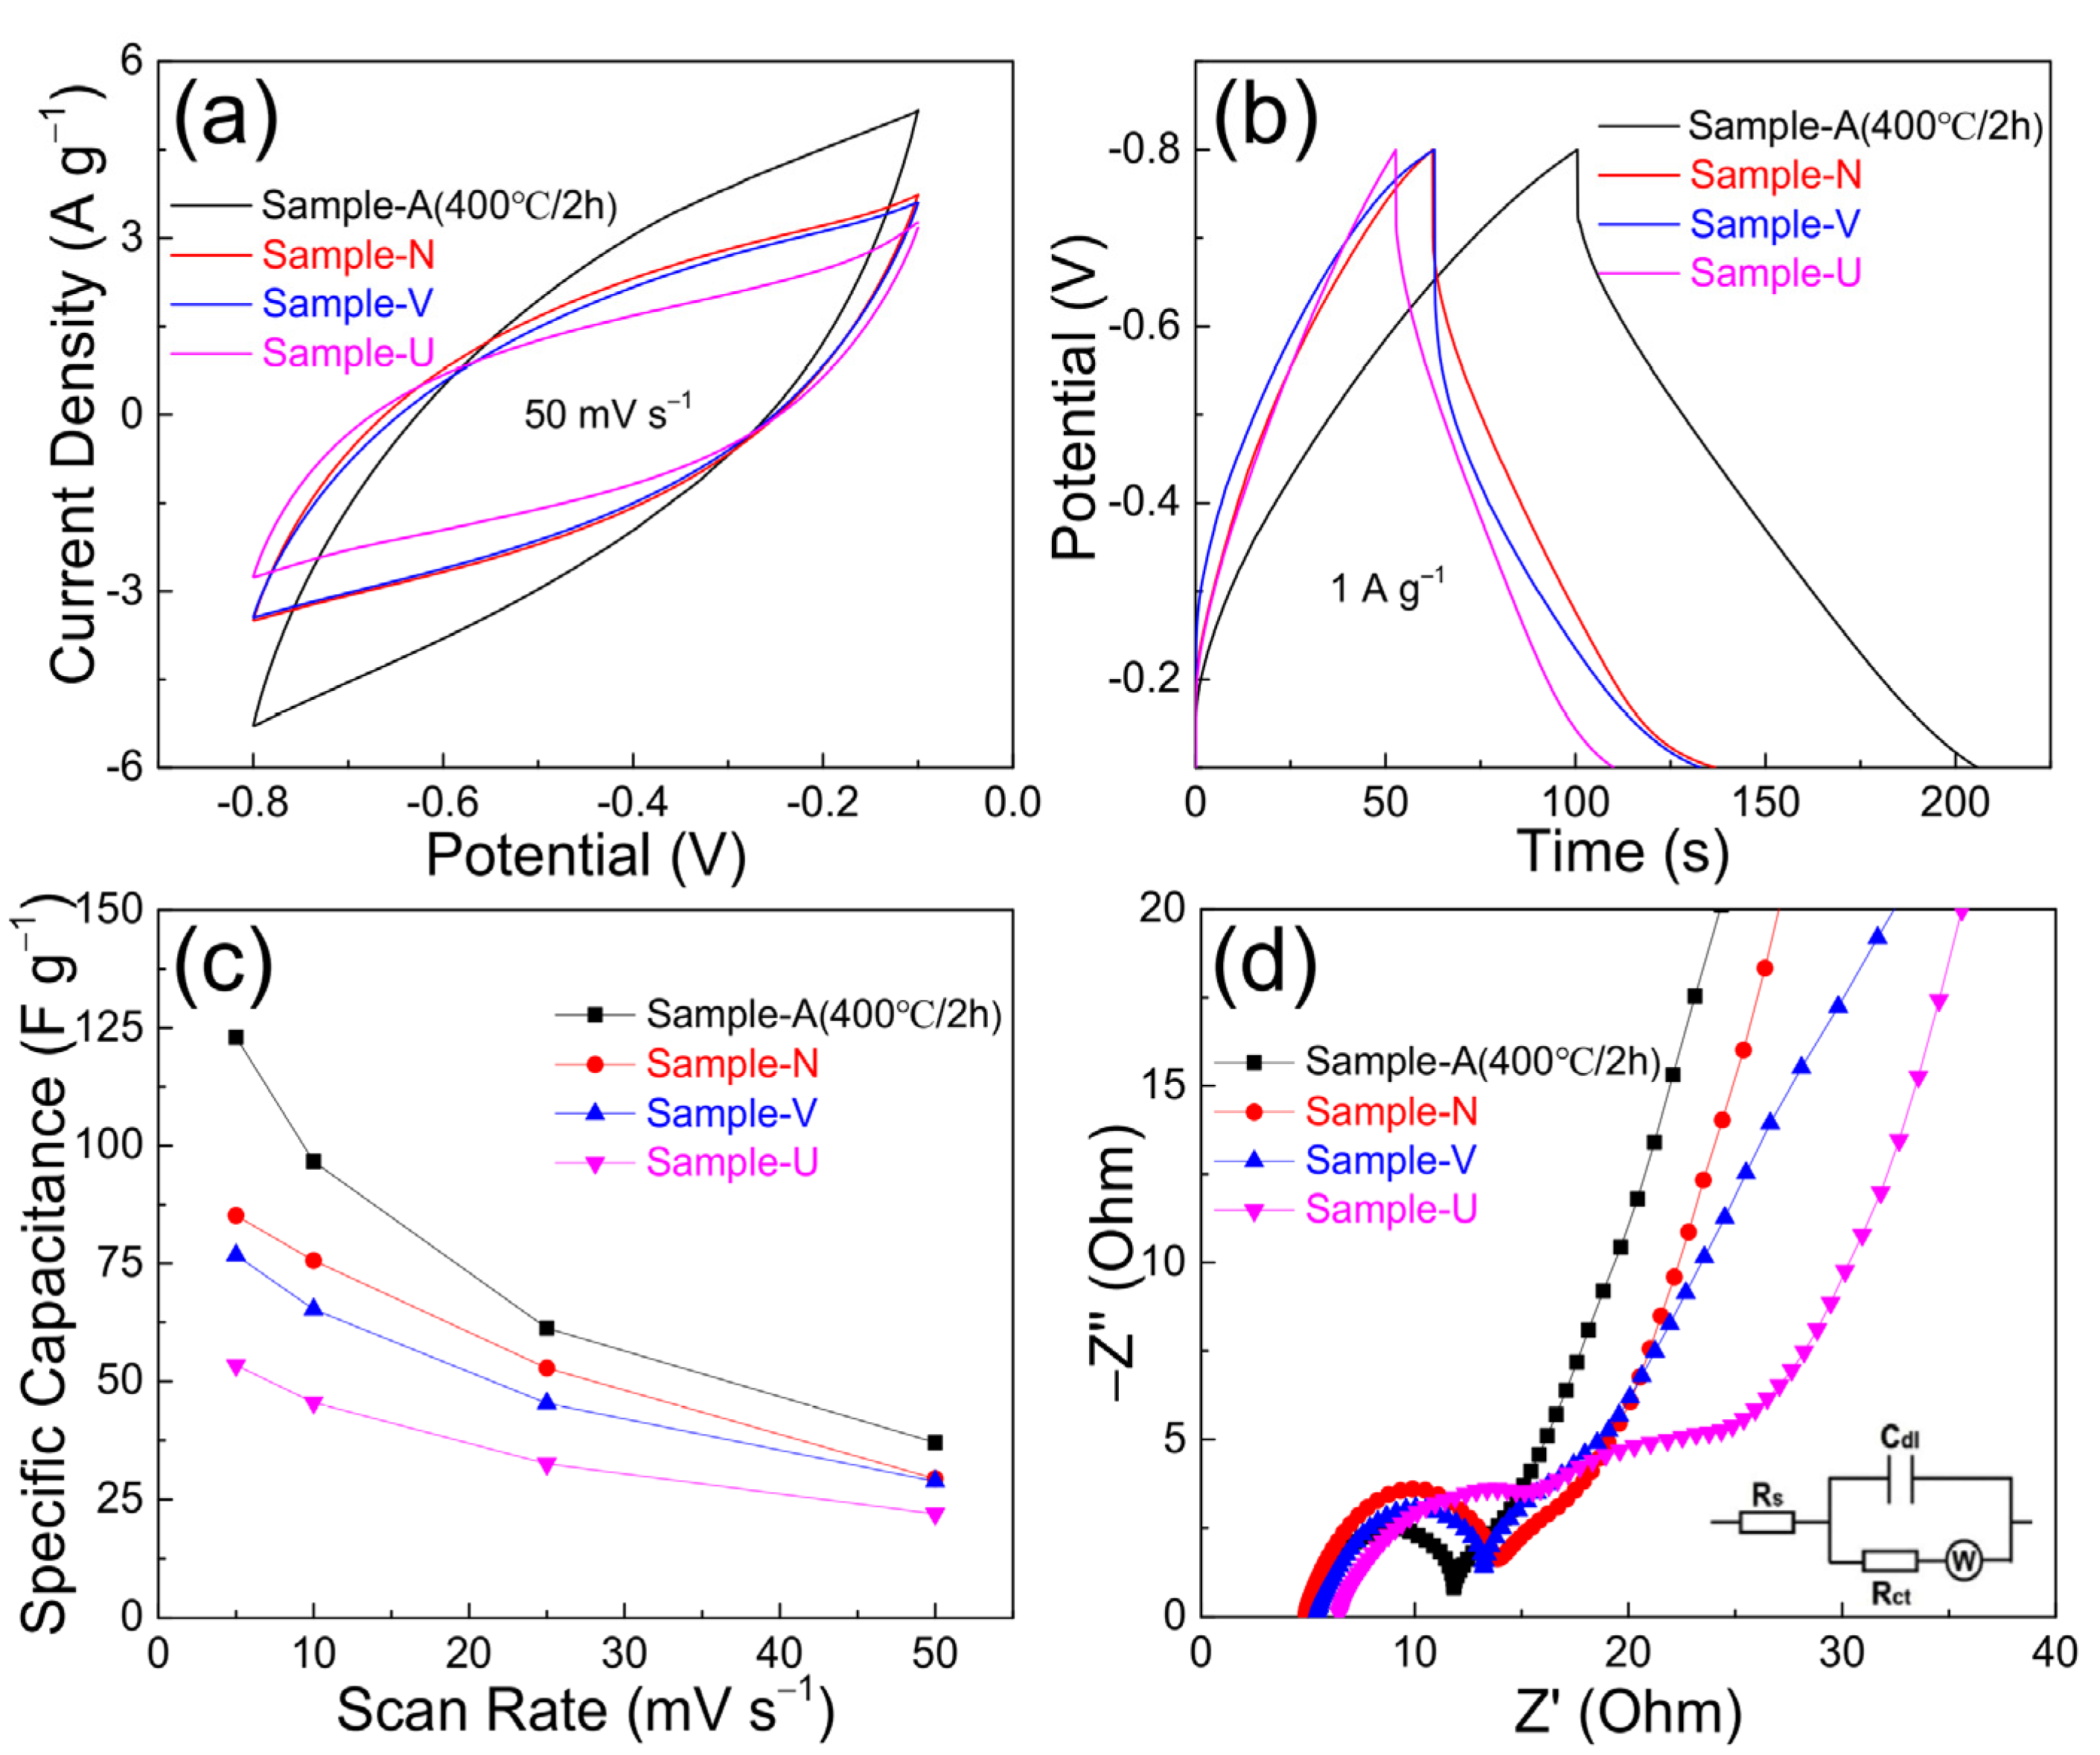
After removing the surfactants under different calcination conditions, the intercalation pseudocapacitive performance of the Sample-U, Sample-A (400 °C/2 h), Sample-N and Sample-V are investigated and compared in a three-electrode configuration in 0.5 M Na2SO4 aqueous solution. Their CV curves (@50 mV s
−1) are presented in
Figure 5a in the negative potential window owing to the energy-storage feature of molybdenum oxides, in which the Sample-A (400 °C/2 h) exhibits the largest CV area and the Sample-U owns the smallest one, indicating the best and worst intercalation pseudocapacitance respectively, mainly attributed to the large interplanar spacing and high-resistance surfactants respectively. In addition, the Sample-N has slightly larger CV area than the Sample-V due to its slightly larger particle size, but the area is still not much larger than that of the Sample-U even though the surfactants are already totally removed, maybe because of high contact resistance.
Figure 5b shows the GCD curves (@1 A g
−1) of the Sample-A (400 °C/2 h), Sample-N, Sample-V and Sample-U with linear charging and discharging profiles, from which their specific capacitance is 168.1, 126.8, 125.0 and 93.0 F g
−1 respectively, consistent with their CV curves. As shown in
Figure S5a–d, the Sample-A (400 °C/2 h), Sample-N, Sample-V and Sample-U exhibit their CV curves respectively, with rectangular shapes at 5, 10 and 25 mV s
−1. Based on the CV curves, their specific capacitance is calculated and presented in
Figure 5c, from which it could be seen that the specific capacitance of the Sample-V without surfactants is about 1.4 times larger than that of the Sample-U with surfactants at 5 mV s
−1, and the specific capacitance of the Sample-A (400 °C/2 h), Sample-N, Sample-V and Sample-U is in descending order with the Sample-A (400 °C/2 h) being the biggest and the Sample-U being the smallest throughout the range of the scan rates, except the specific capacitance of the Sample-N and Sample-V becomes very close at 50 mV s
−1. The specific capacitance of each sample decreases with the increase of the scan rate, exhibiting poor rate capability, which probably results from the poor intrinsic electrical conductivity of monoclinic MoO
2 and orthorhombic MoO
3. In
Figure 5d, their electrochemical impedance spectra are presented at open circuit potentials with 5 mV ac voltage in the frequency range of 100 kHz to 10 mHz. An equivalent circuit based on the experimental impedance spectra is proposed in the inset of
Figure 5d, in which R
s is the ohmic resistance, R
ct is the electron transfer resistance, W is the Warburg impedance and C
dl is the double layer capacitance. And the corresponding fitting curves are presented in
Figure S6, from which it could be seen that the ohmic internal resistance (6.5 Ω) and interface charge-transfer resistance (10.0 Ω) of the Sample-U are both the highest due to the high-resistance coating of surfactants, which are much larger than those of the other three samples, and which also demonstrates the significance of the removal of the surfactants. In addition, the Sample-A (400 °C/2 h) (4.8 Ω), Sample-N (5.0 Ω) and Sample-V (5.4 Ω) exhibit similar ohmic internal resistance, but the Sample-N (7.4 Ω) and Sample-V (7.5 Ω) both exhibit larger interface charge-transfer resistance than that of the Sample-A (400 °C/2 h) (7.0 Ω), which reveals their lower availability of electrolyte ions. In addition, there were some extremely small active materials dispersing into the electrolyte solution during the charging-discharging processes of the Sample-N, Sample-V and Sample-U, which reveals the collapse of their crystalline structures, and which also indicates that MoO
2 QDs may be not appropriate for intercalation pseudocapacitance in simple powder form, though a few crystallographic planes of MoO
2 own lattice expansion in the form of quantum dots with extremely large specific surface area and spacious ion channels.


