1. Introduction
The worldwide rise in demand for electricity, the consequences of deforestation and the reserve limitation of fossil fuels induce humanity to look for other alternatives, such as renewable energy sources. The transition in the distribution system (DS) model from a traditional to a smart grid considering the integration of renewable energy sources (RESs) is prominent and appears to be very helpful in the near future despite its limitations [
1,
2,
3,
4,
5]. The DSs incorporate distributed energy resources (DER) to boost voltage profiles, power efficiency and device output [
6,
7,
8,
9]. The conventional DSs are therefore heading into new networks, including PVs, small hydropower stations (SHP), and energy storage systems (ESS), combined with intelligent applications. A hybrid green energy system is called the agglomeration of different, but compatible, technologies for RES. Due to its capacity relative to the main grid, its unit is often known as a microgrid (MG) [
10]. The generation of PV is fascinating and common all over the world, but the lack of continuous electricity sources remains a major issue. The environment relies on technological problems such as oil volatility and instability. Different methods such as demand response programs and incentive programs, day-to-day programming, power back-up, and complementary RESs, lead to the alleviation of special issues [
11]. The MPPT method is often used for monitoring outputs, but some technologies are restricted due to slow monitoring and lower performance. Dynamic support for the intelligent distribution network (DN) is also important. The reliability and high inertia of the centralized power generator can be recreated with a synchronous device configuration. The power-factor and efficiency were outstanding, and the prices were better than wind and solar variability. A significant aspect of current DNs is the integration of electric vehicles (EVs). The DNs are characterized by deficit generation (space time) and surplus generation (off-peak time). The inclusion of EVs as a load control is nevertheless one of the strategies for stabilizing the system off-peak. The inclusion of compatible and complementary RESs in a microgrid configuration uses upgraded smart delivery networks to deliver substantial opportunities. Nevertheless, EVs are considered a good option to stabilize the generation-to-demand ratio, especially during peak hours when the power demand is higher than the generation [
12].
The electric power system is one of the most vibrant solutions in enlightening the social and financial living circumstances. This development has created a huge demand for electric power nowadays. More industrial progressions and service productions have become reliant on physical labor being exchanged for electric power-driven equipment. At the moment, the energy system has appeared as the most serious substructure which permits all other organizations [
13]. This is related to power quality complications and is occasionally unpredictable to the customers provided by the conventional grid. Consequently, the idea of transporting power only over fundamental power systems to inaccessible clients fails to endure and remain feasible with the chosen dependability in the 21st century. This results in quickening the alteration of the power delivery substructure into the intellectual grid [
14]. So as to overcome these problems, the idea of dispersed power delivery schemes has arisen as a novel alternative. The perception of the microgrid was introduced as part of creating distributed energy. Energy is an essential part of today’s modern lifespan. However, energy generation requires natural properties which are diminishing day-to-day life. On the other hand, the usage of energy is growing exponentially. In emergent nations like India, around 49% of total profitable energy is expended in trades and functions like the below-mentioned ones which devour an extensive portion of total energy in these industries such as [
15]: air conditioning, compressed air, hot water, steam, water systems, electrical systems, and fuel. As there is a limited amount of fuel on earth, the demand for energy is still growing exponentially. If this situation persists, then there is no doubt that one day entire fuel sources will be exhausted which results in the switching from fuels to alternative sources of energy. As a substantial share of energy resources is consumed in the utilization, generation, and distribution of thermal and electrical utilities, the first step in the energy management system (EMS) is to improve the efficiency of energy in industrial utilities. This is termed the “Management of energy in industrial utilities”.
In recent years, the use of renewable energy systems and electric cars has grown ex-potentially [
16]. The Plug-in Electric Vehicle (PEV) is a state-of-the-art technology that supports efficient energy storage and conversion. In conventional networks, weak grids are normally available in medium or low-voltage feeders. Weak networks have less inertia and higher strength in comparison to large networks and traditional low-power ranges. EVs can not only reduce the peak loads capacity but can also control the distribution system frequency [
17]. The frequency modulation can be accomplished locally, thanks to the active power transfer between the EV’s battery and the distribution network operated by bidirectional converters. Clearly, massive loading and unloading are not only the cause of network shocks but can also have a substantial effect on the efficiency of the grid, network failure and equipment use. Several techniques have been presented so far. However, deep reinforcement learning is a fascinating approach these days [
18].
Energy systems inertia can compensate for intermittent renewable energy sources or load disruptions for imbalances [
19]. However, frequency variations under reasonable limits are also difficult to maintain. It is necessary to minimize frequency fluctuations and to return back the energy level as early as possible in certain transient situations to the normal state of the network. In Vehicle-to-Grid (V2G) methodology, the frequency control of a microgrid (MG)/weak grid was evaluated with various penetrated EVs. The potential elimination of greenhouse gas emissions (GHG) will be supported by EVs. In 2018, the sales of EVs were increased by 63 percent relative to the previous year, according to IEA Global EV Outlook 2019. Thanks to the driving range fear, the public use of EVs is rather subdued. The lack of adequate charging infrastructures, leading to longer charging periods, is another obstacle [
20].
It is necessary to examine the possible detrimental effects of charging EVs on electrical power systems, primarily because of unregulated charging and how these impacts can be minimized, and even beneficial, by supervised charging and dumping. Impacts on the rise in peak demand from unregulated EVs, voltage deviations from the appropriate limits, phased imbalance due to single-phase loaders, harmonic distortions, power system overload and increased energy losses have been recorded [
21]. The harmonic levels can be elevated to excessive levels that maximize grid stress depending on the charging profile or mode of one or more EV users. EVs charging process can cause inappropriate voltage deviations, as well as additional real and harmonic power losses and harmonic distortions.
The main intention of this work is to propose a multi-objective approach for optimal energy management in EVs using a reinforcement learning mechanism.
The remaining portion of the manuscript is structured as follows.
Section 2 is the depiction of various existing methods employed so far. A detailed explanation of the proposed methodology is projected in
Section 3. The performance estimation of the proposed scheme is shown in
Section 4. Finally,
Section 5 concludes the overall workflow of the proposed system.
2. Literature Review and Related Works
In reference [
22], the authors introduced the implementation and deployment of a smart, Vehicle-to-Grid, Vehicle-to-Build (VT) charging scheme, sustainable demand response and power quality potential for grid stability and economic gain for EV fleet owners in Santa Monica, California. The research team from the “Smart Grid Energy Research Center”, University of California, has used their wireless connectivity system and bidirectional EV loading technologies to demonstrate grid needs such as long-range shaving, load leveling and smoothing for renewable sources. In [
23], the authors presented a thorough report on the effect of grid convergence of PVs and EVs on the grid reliability, power efficiency and energy economy dimensions on a single basis, accompanied by the joint impact of PVs and EVs. In the literature review, the transient existence of the PV energy and the volatility of the EV charges have demonstrated that individual PVs and EVs may have adverse effects on grid reliability and power efficiency. In [
24], as home energy usage was growing and renewable energy systems were organized, the home energy management system (HEMS) attempts to deliberate both the generation and consumption of energy instantaneously to diminish the energy rate. This approach presents a smart construction that deliberates both energy generation and consumption at the same time. The home-based attendant collects the generation and energy consumption information, examines them for energy assessment, and regulates the home energy custom plan to diminish the cost of energy. The isolated energy managing server collects the energy information from abundant home servers, associates them, and generates valuable statistical analysis data. The authors in [
25] designed a real-time implementation of the optimum management of the energy system in the standalone microgrid with the use of multi-layer Ant Colony Optimization (ACO). This has been made in order to identify the scheduling of energy in the microgrid. The intention of this mechanism was to discover the best process of micro sources for diminishing the power manufacture rate by means of the hourly day-ahead and actual time development. This procedure was based on the ACO technique and equipped to examine the practical and financial time-independent constrictions. Moreover, this approach has some limitations. In [
26], the authors presented a centralized Energy Management System (EMS) for the isolated microgrids. In [
27], the authors focused on the optimum configuration of a renewable energy system (RES) based on the on- and off-grid mix. Photovoltaic (PV), Wind Turbine (WT) and Fuel Cell (FC) are the components of this device with a gaseous hydrogen tank for the chemical storage of the electricity. Using a new meta-heuristic optimization strategy, the optimum size of the proposed hybrid generation system is obtained. This optimization technique is intended to boost the efficiency of the traditional Artificial Ecosystem Optimization (AEO) algorithm, called Enhanced Artificial Ecosystem Optimization (EAEO).
In [
28], the authors presented a performance optimization associate degree planning of the distributed generation (DG) square measure relevant to implementing an EMS inside a Microgrid (MG). Moreover, optimization methods were applied to attain the most potency, improve economic dispatch and feat the simplest performance. The paper proposed a methodology of associate degree optimization that supports the attractive force search rule for resolving such downsides in a MG together with varying kinds of metric weight units with explicit attention with respect to the technical constraints. Moreover, this rule, which is possible from a process viewpoint, has several benefits such as peak consumption reduction and electricity generation price reduction among alternatives. In [
29], the authors stated an EMS that was based on the fuzzy logic for the design of residential grid-related microgrids. As an alternative to consuming forecasting-dependent approaches, the presented method uses both the microgrid energy rate-of-change and the battery-operated State of Charge (SOC) to grow, reduce or keep the power transported/fascinated through the mains. In [
30], the authors suggested a new Smart Charging Planning Algorithm (SCS-Algorithm) for charging by coordination in a smart grid (SG) scheme of multiple plug-in-hybrid electric vehicles (PHEVs). The services became concerned about voltage pressures, smart grid output losses and overloads in delivery networks with abundant PHEV charging cases. Via the inclusion of Grid-to-Vehicle (G2V), Vehicle-to-Grid (V2G), and RTT technology on parking, managed by several aggregators, there is therefore a proposed and built intelligent charging strategy for charge synchronization of PHEVs (e.g., every 30 min). SCSA integrates the optimization strategy to determine the optimum cost-benefit and the charge schedule. In [
31], the authors described the major grid-connected PV systems challenges exclusive of galvanic separation. The review on converter topology was mainly focused on the contest among various converter kinds and several technologies of PV panels. The efficiency of the conversion process was examined by means of comparing semiconductor power losses qualitatively. In [
32], the authors presented EMSs that are utilized by operators to monitor, optimize, and regulate the performance of a power system. In microgrids, the EMS repeatedly manages the energy causes directing to stream the demand. The management is supported by the functioning charges, the accessible energy, and the generation and communication capabilities of the grid.
In [
33], the authors stated a renewable energy source (RES) that was becoming a significant portion of energy endurance for the current electrical power network, meanwhile RES was recurrent and unbalanced. In [
34], the authors stated the strategies of configuration, concept, and scheduling of the smart HEMS. With the advent of the smart grid period and the arrival of progressive information infrastructures and communication, advanced metering infrastructure, energy storage systems, bidirectional communication, and home-based area systems would transfigure the shapes of energy convention and energy preservation at the premises of consumption. In [
35], the authors stated the opportunities and challenges of the enhancement of smart grids with microgrids. A current system of electrical power was working over a ground-breaking variation of growing demand for all-inclusive electrical power, evolving radical compression and public consciousness of incorporating large scale renewable power penetration, carbon emission, and a combination of communication and information skills with power system processes. In [
36], the authors deliberated the realism of a power electronics-dependent energy management scheme. The EMS includes sequences and a numerically measured single-phase voltage supply electrical converter (VSI), which might be measured as a recent stream, or a power stream included on the standing of the AC network and consequently the handler’s partiality. In [
37], a scheme was presented for the energy management of the hybrid electric bus depending on the deterministic policy gradient approach (DDPG). This approach of DDPG is integrated with the expert-assisted system for enhancing the cold start performance and thus optimizing the allocation of power. In [
38], a knowledge-dependent, multi-physics constrained fast charging policy was presented for lithium-ion batteries (LIB), by means of a realization of the degradation and thermal safety. A framework of universal algorithmic that integrates the model-based observer state and a deep reinforcement learning (DRL) dependent optimizer was suggested, initially, for offering a solution to LIB fast charging. In [
39,
40], the authors presented a new data-dependent, multi-constraint strategy of energy management for the hybrid electric bus (HEBs) emphasizing the consciousness of degradation and thermal safety of the onboard lithium-ion battery (LIB) system.
3. Proposed Work
This section is the illustration of a detailed explanation of the proposed system. In this portion, a comprehensive explanation of the proposed system is given. The presented system flow, on the whole, is depicted in
Figure 1. The implementation of a multi-renewable energy source (battery, fuel cell, and PV panel) based dc bus system along with an optimization approach is presented. In the presented technique the power efficacy of the DC system is further enhanced by introducing an RL-ICSO-based MPPT algorithm. The RL-ICSO MPPT method incorporated is predictable for the purpose of adjusting the parameters of MPC controllers. In this approach, compensating voltage harmonics and current harmonics liability properly is made by connecting series and shunt controllers. Hence, in this approach, an intelligent power and energy management system is presented with the use of a reinforcement learning-based optimization strategy that can learn the optimal policy. The generated energy is checked for any liabilities by adding some fault in the transmission line and thereby rectifying the fault by means of the UPQC device. The fault-rectified power is stored in the grid and the transmitting power can be used for electric vehicle charging. Then, the load is stored in the grid which can be used for further usage. The overall flow of the proposed system is shown below:
3.1. Multi-Renewable Source of Energy
The multi-hybrid system consists of two various energy systems that work in a simultaneous manner. Hence, a multi-hybrid renewable energy system consists of two different renewable energy systems that work together. Moreover, the battery bank is employed for storing excess energy generation. Therefore, it offers power supply to the load in case of insufficient power generation from the hybrid renewable energy source system. The modeling of the battery is expressed in Equation (1). Where,
and
are the minimum and maximum state of charge levels of the battery, respectively.
DOD refers to the depth of discharge of the battery.
The modeling of the fuel cell is expressed as shown:
The expected output of the fuel cell system is presented in Equation (3). Where,
refers to current light generated,
is the co-efficient of the temperature of the cell’s short-circuit current,
is the reference temperature,
G is the solar radiation,
is the short-circuit current of the cell,
signifies the electric charge (1.6 × 10
−19 C),
refers to the Boltzmann’s constant, C refers to the fuel cell,
denotes the cell idealizing factor,
Tc is the absolute temperature of the cell,
refers to diode voltage,
is the series resistance, and
is the shunt resistance with Boltzmann’s constant.
A PV cell produces energy once illuminated by photons. The P-N junction is a photovoltaic cell’s core feature, which could consume solar radiation. It rises once a photon crosses a gap from a substantial part. The protected loads convey over an array unswervingly since a load of solar cells is associated with them preceding the light stopovers. The archetypal consists of a diode, some resistance and a current source; the following equation encompasses that the current offered by a solar cell connected in a series resistance of
Rs is very small relatively and that the shunt one of
Rsh is high relatively. These two resistors are not taken into consideration so as to make the simulation simpler.
The power and voltage levels display as follows:
where
ptheoretical is the PV system output theory,
p(measured) is the calculated PV chain output strength, the PV theoretical output voltage
ptheoretical is the DC output voltage of the PV chain calculated and
V(measured) is the calculated output.
For the analyzed PV unit, the controller ratio is estimated at a theoretical 4% output error tolerance intended for internal
MPPT sensors at a conversion error rate of 97%, thereby offering the maximum error hypothetically.
The above calculations specify the MPPT unit’s resistance, and the PV modules amount in the sequence of PV at a maximum and minimum power/voltage ratio.
3.2. MPPT-Based RL-ICSO Scheme
The optimization algorithm is employed for monitoring the MPPT of the PV device that includes the local MPPs number in the characteristics of P-V. If the series connections were made to the PV modules, the number of modules N in the list of PVs, each module should also be regulated by the voltage. Then the service cycle is then determined by the best optimal values.
The procedure for RL-based optimization is as follows:
- (i)
The procedure starts at a random objective function point having N variable V = f (p1, p2,…, pN). This will make a series of moves for getting closer to the global optimum point value.
- (ii)
For changing the current location, step size dpi (i = 1, 2,…, N) and a standard deviation σpi (i = 1, 2,…, N) were intended for each coordinate that was generated from a uniform distribution probability.
- (iii)
The dpi (i = 1, 2,…, N) step size in turn estimates the search area center. All coordinate deviations in turn determine the searching area size. Various points Ps at this range were chosen in a random manner from the Gaussian distribution by means of dpi as the mean value and the standard deviation as σpi.
- (iv)
The values of the objective function were estimated at those points. The values of the objective function were compared on the random points having current locations.
- (v)
In the case of the new points generated in step (iii) having no better values on comparing current positions, step (iii) is repeated till M trials until the points with a better value of function is found.
- (vi)
In case the search fails after the M trials, the searching area size, in turn, enlarges and reduces the size of the step.
- (vii)
In case the search with the updated size of the searching area and the step sizes from step (vi) was not successful, the step size and range might keep adjusting till either some points with better values are found, the present step sizes are smaller on comparing previous step sizes or the values of function changes by lesser than the pre-specified threshold. If any of these conditions happen, the algorithm in turn terminates. It also indicates the optimum point value that has been reached.
- (viii)
The search particle to the point was moved with the best functional value vb a local maximum and minimum based optimization objective. The distance among prior best point pprev (p1 prev, p2 prev) and the current best point p p1, p2) offers the definite step size dpi (i = 1, 2,…, N). The information was collected during the search process
The results obtained are optimized again for enhancing the process further. In this, the optimization process is carried out with the use of a reinforcement learning-based iterative cuckoo search optimization scheme. Let us review the frameworks of the cuckoo search first before expanding the cuckoo search optimization into multi-target problems. The new bioinspired algorithm for single goal optimization is iterative cuckoo search optimization (ICSO). ICSO simulates the hierarchical order and actions of cuckoo agents in the food quest, where any cuckoo receives an optimization problem as a possible solution.
While a population-dependent RL-ICSO technique, n cuckoos are employed as the agent of search in a question field. This algorithm implementation thus identifies the solutions that are optimal in an appropriate means to elevate them. Agents having the highest fitness value might find food in a broader location number on comparing agents having the worst fitness function value. They are defined in Equation (8):
Here Ni denotes the Gaussian distribution function, P refers to an index of cuckoo that is selected randomly from the group of cuckoos and fi refers to the fitness value of the cuckoo .
A hen’s action opposes its partner’s nurturing. In contrast, the best food which other cuckoos determine, though suppressed by other cuckoos, they might often rob irregularly. Statistically, the search agent’s movement is formulated as:
where
σkm is the search agent’s movement.
Gp is the movement of cukoo search agents, k is the cuckoo index, the health values are denoted as
m, x, y, and
l. The upgrade of hierarchical relationships offers search agents an ability to turn out to be search agents for a correct solution (that is, it offers more insistence to discover the best solutions for the search agents). The appropriate values at every iteration after altering the list of parameters are then classified consistently with health values. The optimum use will be identified upon the completion of optimization. The calculation of fitness value of the optimal paths is given in Equation (10).
where 1 is the iteration number,
M is the number of optimal paths, and
T is the maximum of iterations.
After that, the best fitness value can be calculated using optimization, finding the maximum fitness concentration value and its corresponding position. For each optimization algorithm, the fitness value can be calculated.
where
OS is the optimal solution having an
ith iteration number.
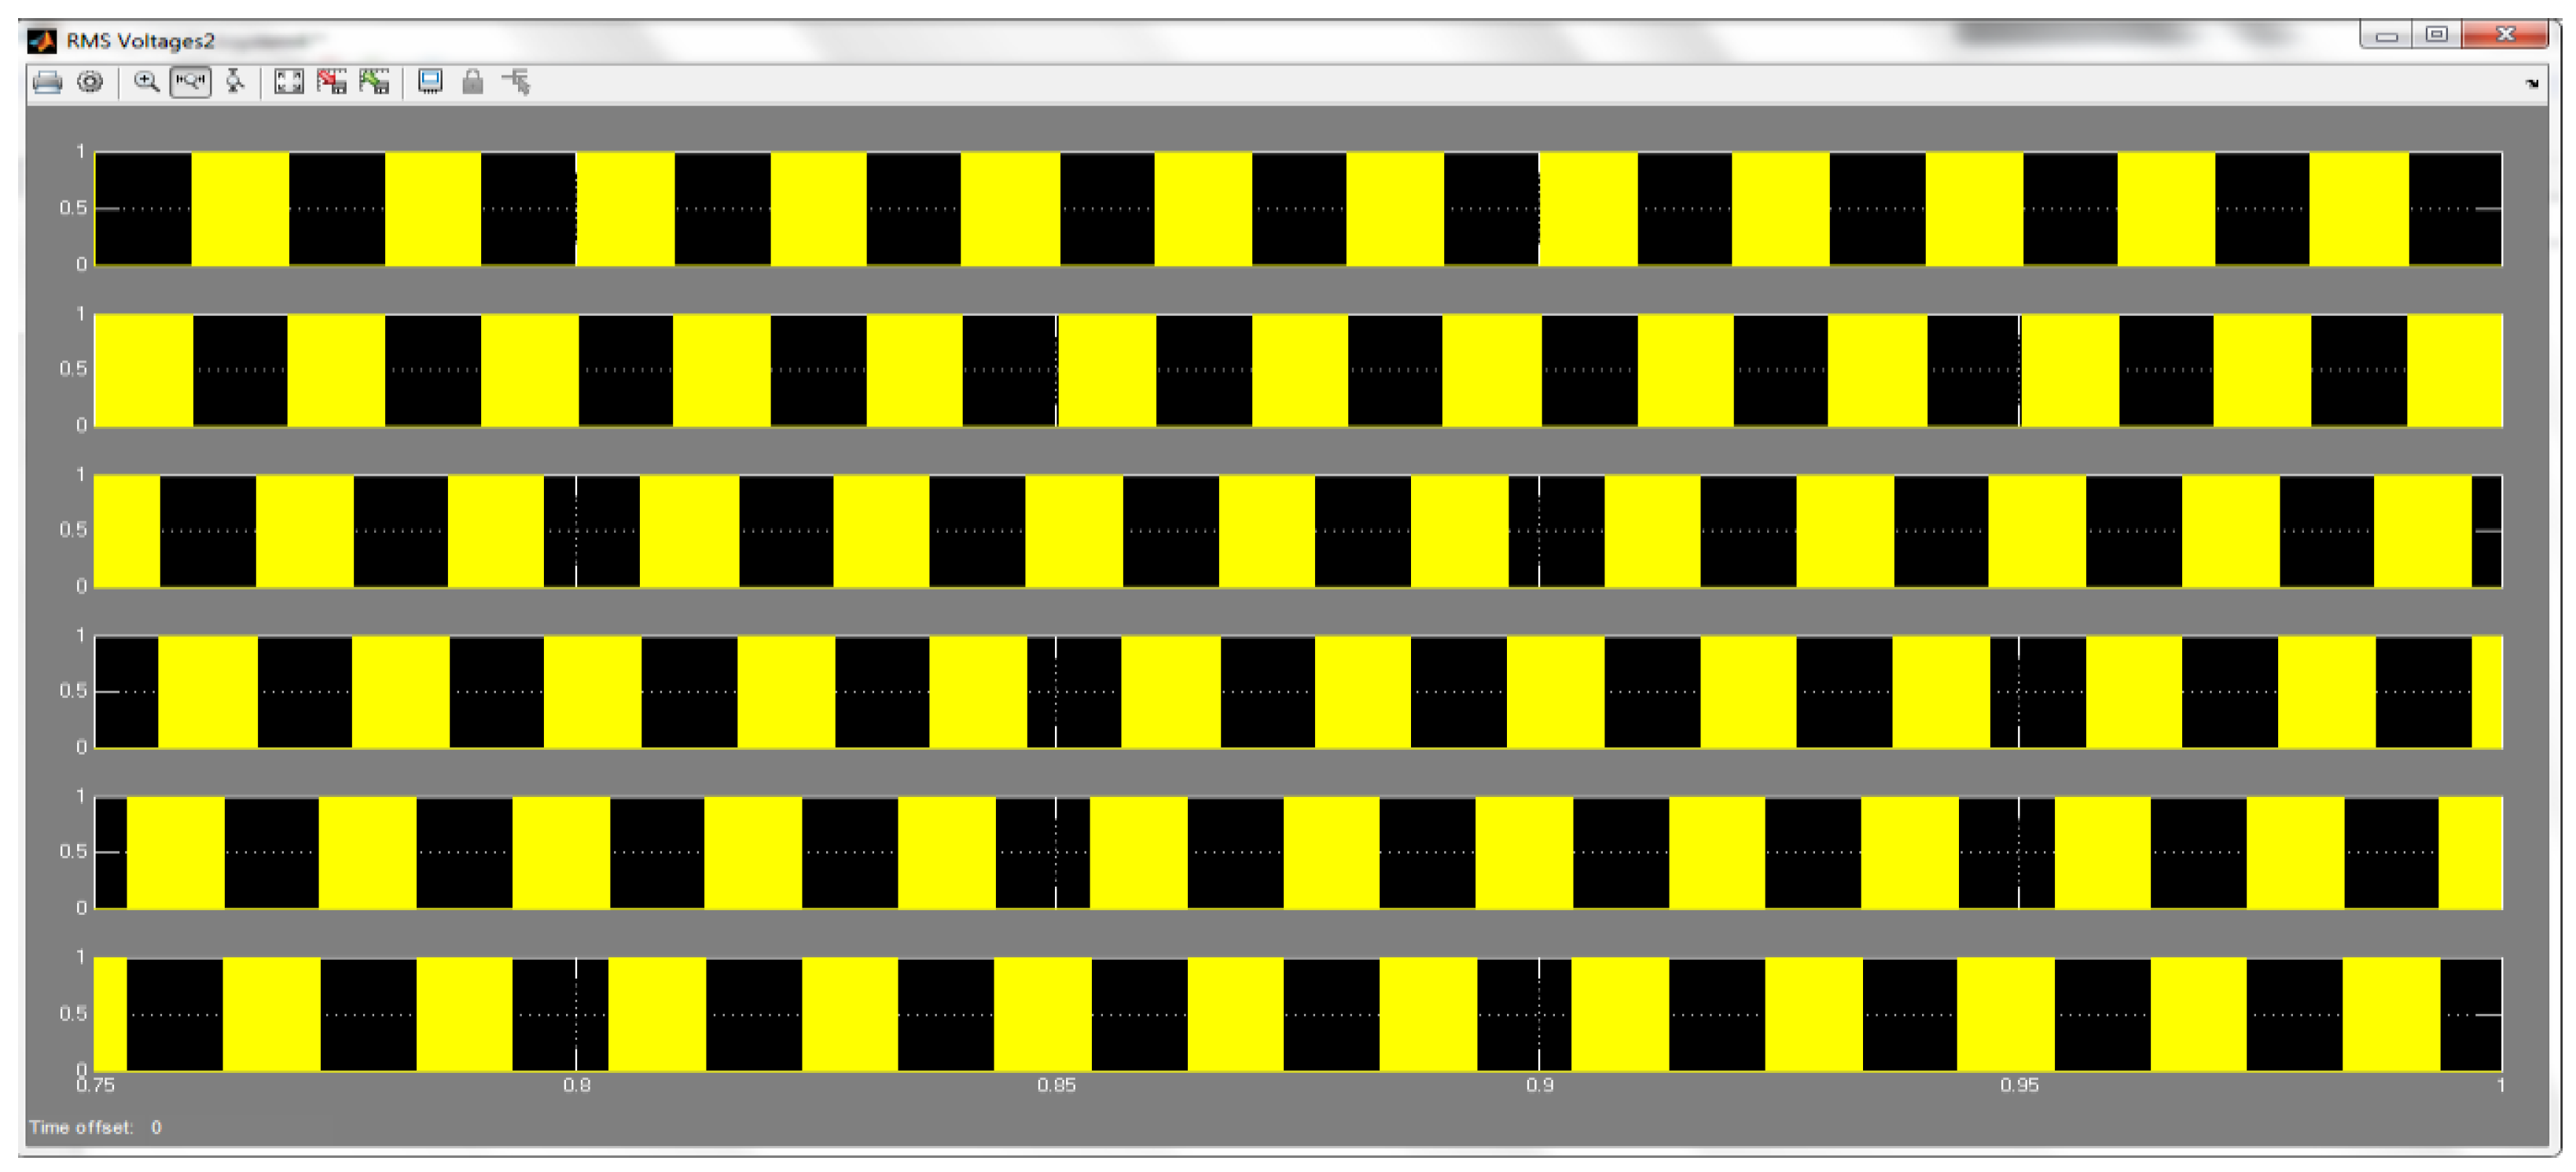
3.3. MPC Controller and PWM Generation
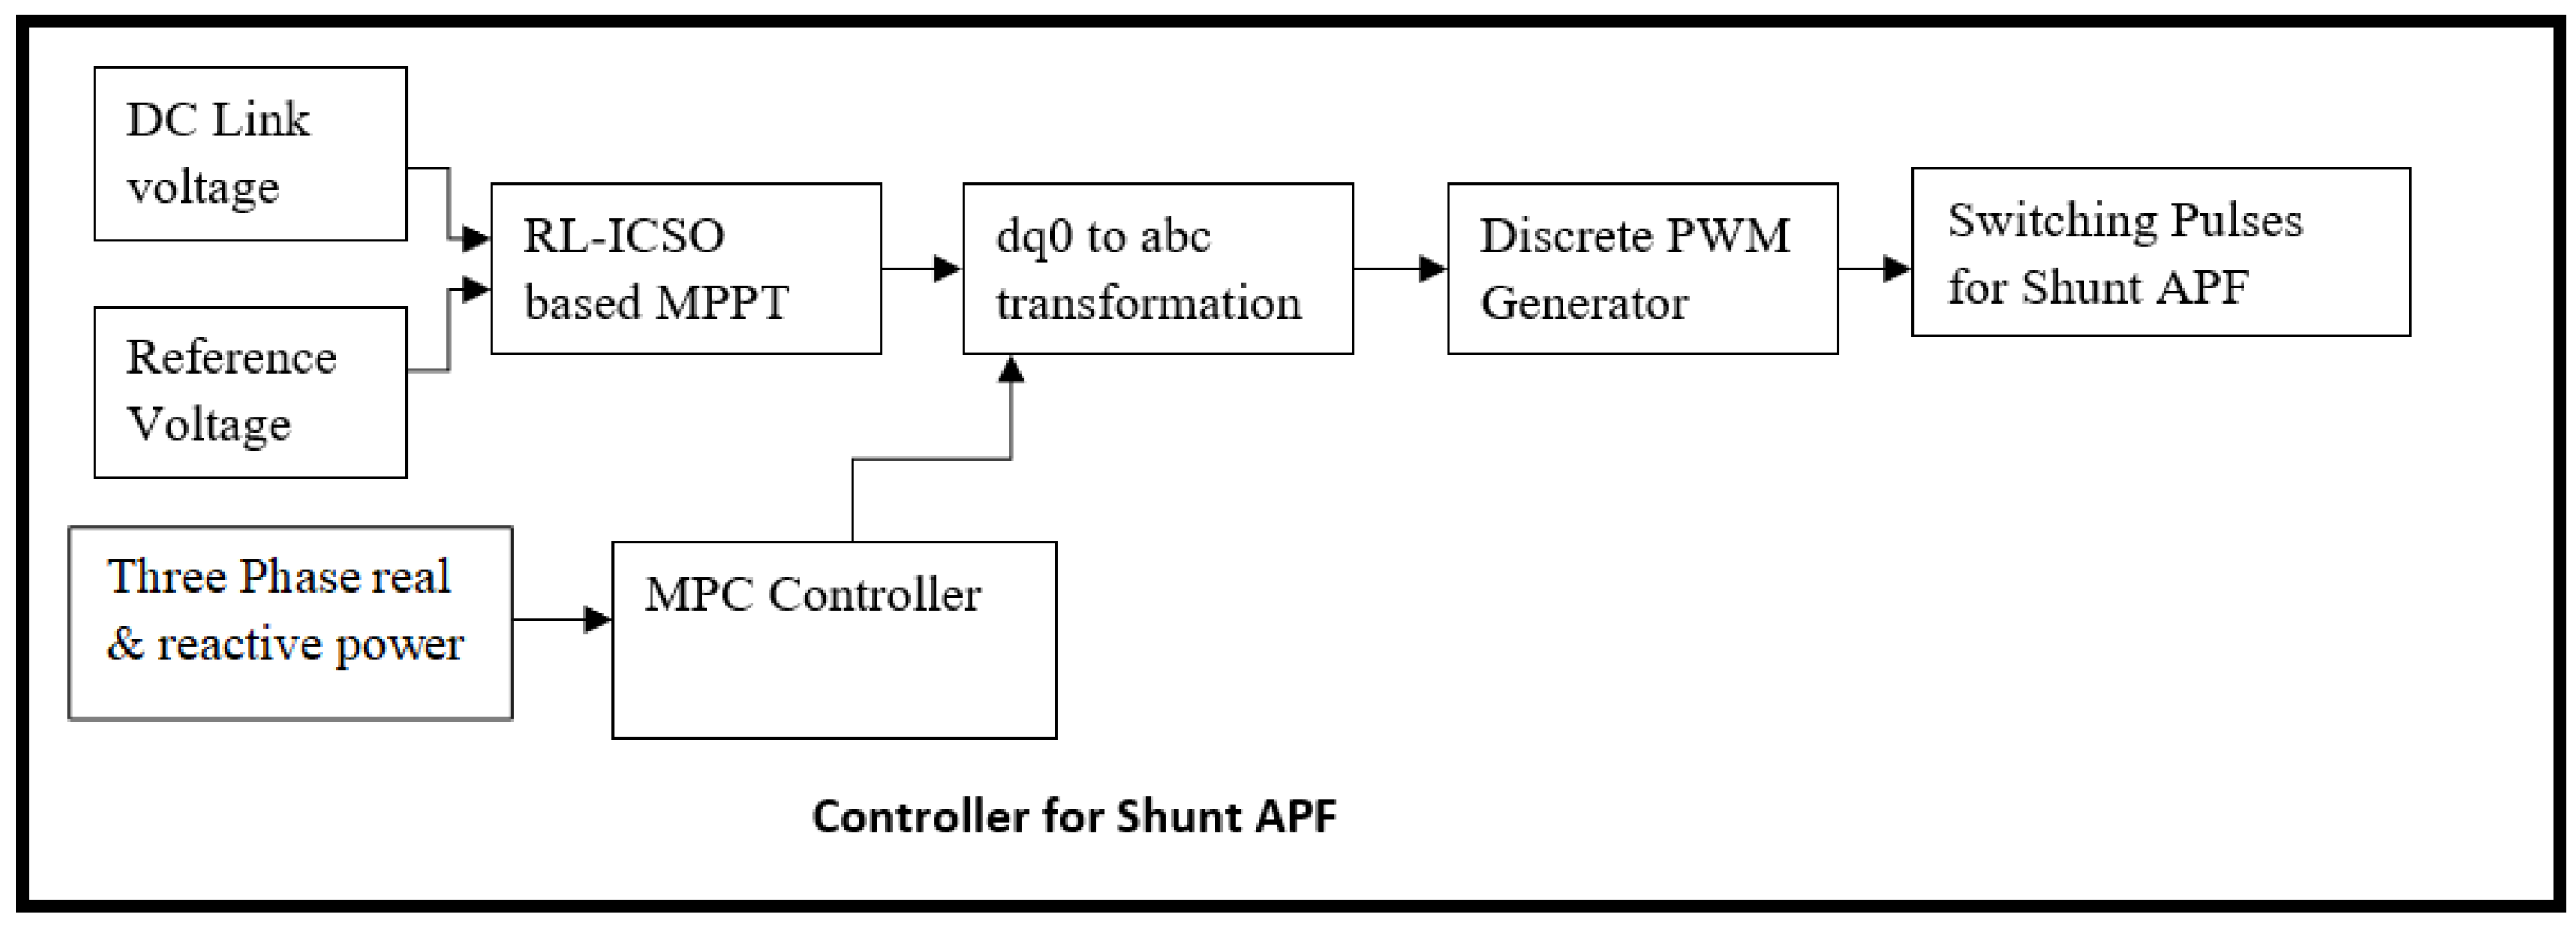
The Pulse Width Modulation (PWM) pulses converters can be produced with a topology of two levels by the PWM generator block. The pulses are formed by contrasting a triangular waveform with a modulating signal of comparison. The secondary switches are driven by a PWM signal in the grid-connected operating mode, determined by the PWM generator of the gridline frequency. It is possible to produce modulation signals by the PWM generator itself, or they can be related by a vector of external signals at the block input. To produce the pulses, one reference signal is required. The phase, frequency, and amplitude (modulation) of the reference signals are controlled by output voltage on the AC terminals of the inverter associated with the block of the PWM Generator.
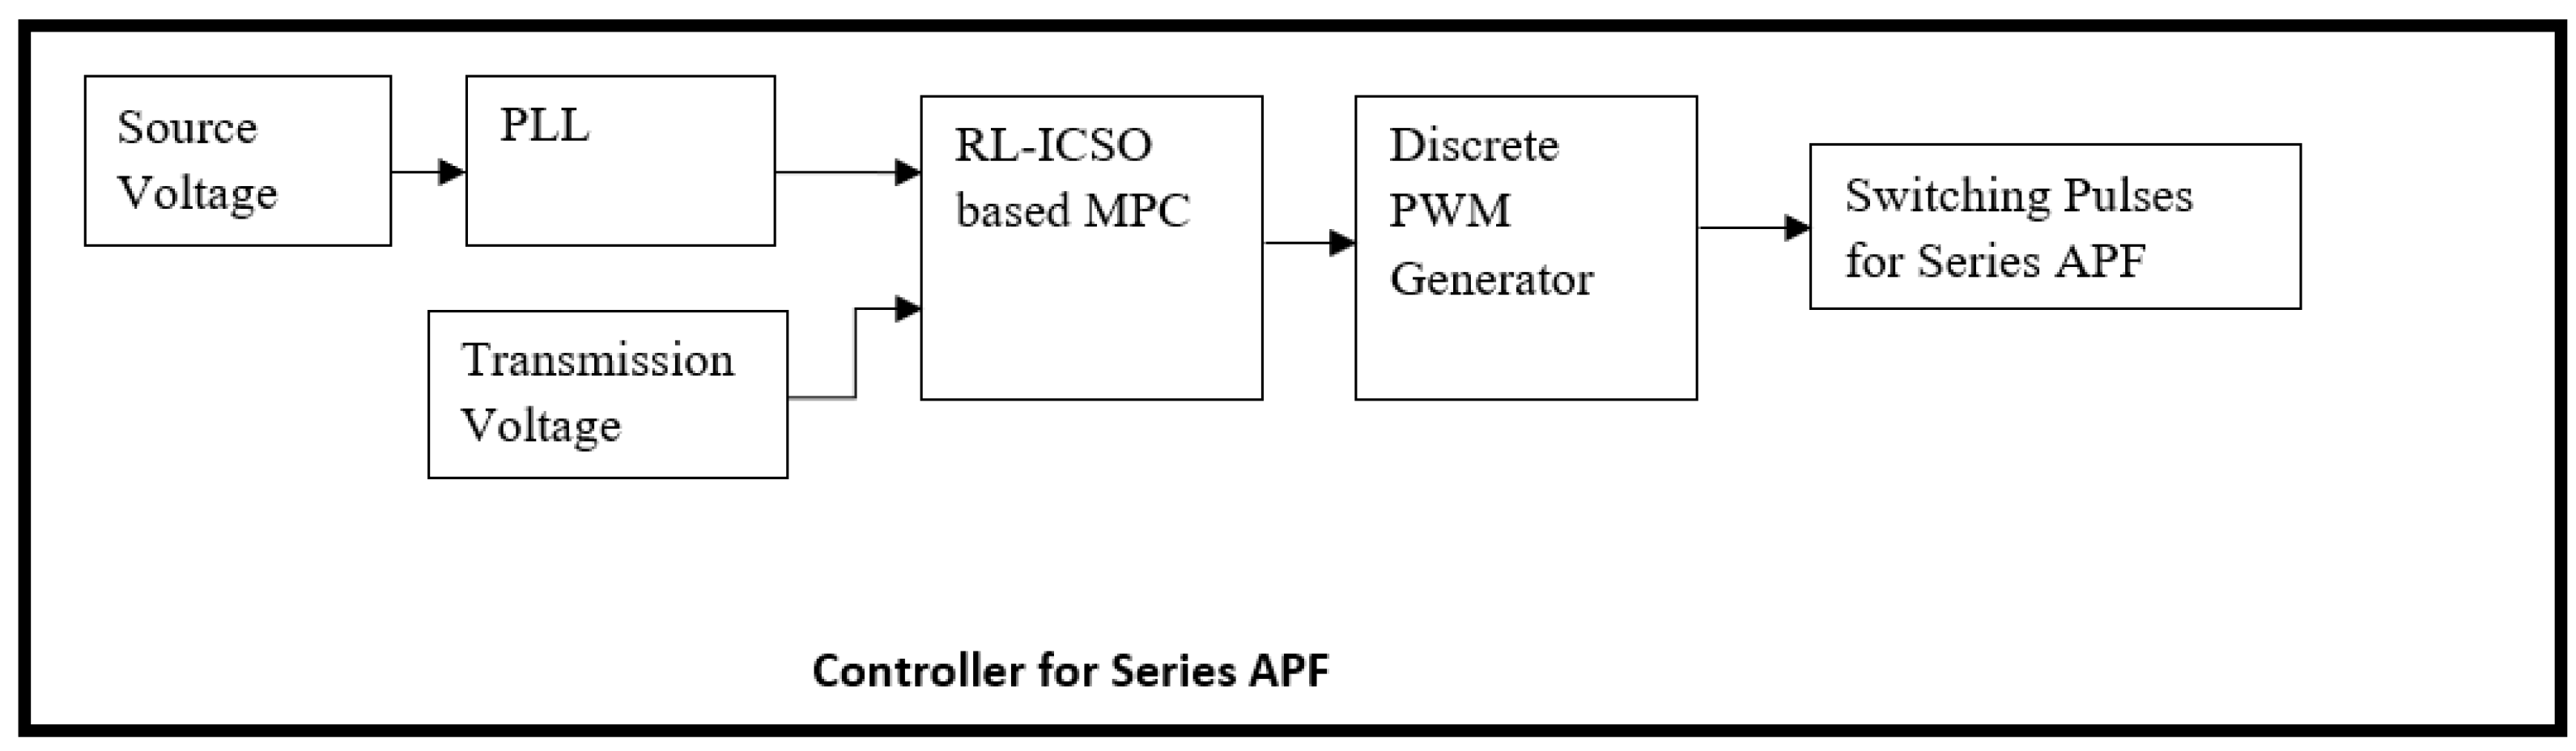
Figure 2 and
Figure 3 depicts the Shunt and Series APF Controller.
Model Predictive Control (MPC) is a controller design approach that also includes optimization. The optimization takes the system dynamics into account, as well as control objectives and constraints. The foremost objectives of employing MPC are as follows: It is capable of utilizing the state-space model entirely that is being developed. Moreover, this state-space representation is time-invariant, linear with low order that is suitable particularly for the optimization needed by MPC. Furthermore, the MPC controller is capable of handling hard constriction of the process variables in an explicit manner. In this, the manipulated variable is employed with the technique of Pulse Width Modulation (PWM), which was to be restricted to ±1, as a result, active filters will function in the region of linear modulation. Traditional linear controllers must evade such restrictions, or else there will be the occurrence of instability. This results in a more conservative plan accordingly limiting the compensation ability.
3.4. Battery Charging Condition for Electric Vehicle and Three Phase Grid System
3.4.1. Battery Charging Condition for Electric Vehicle
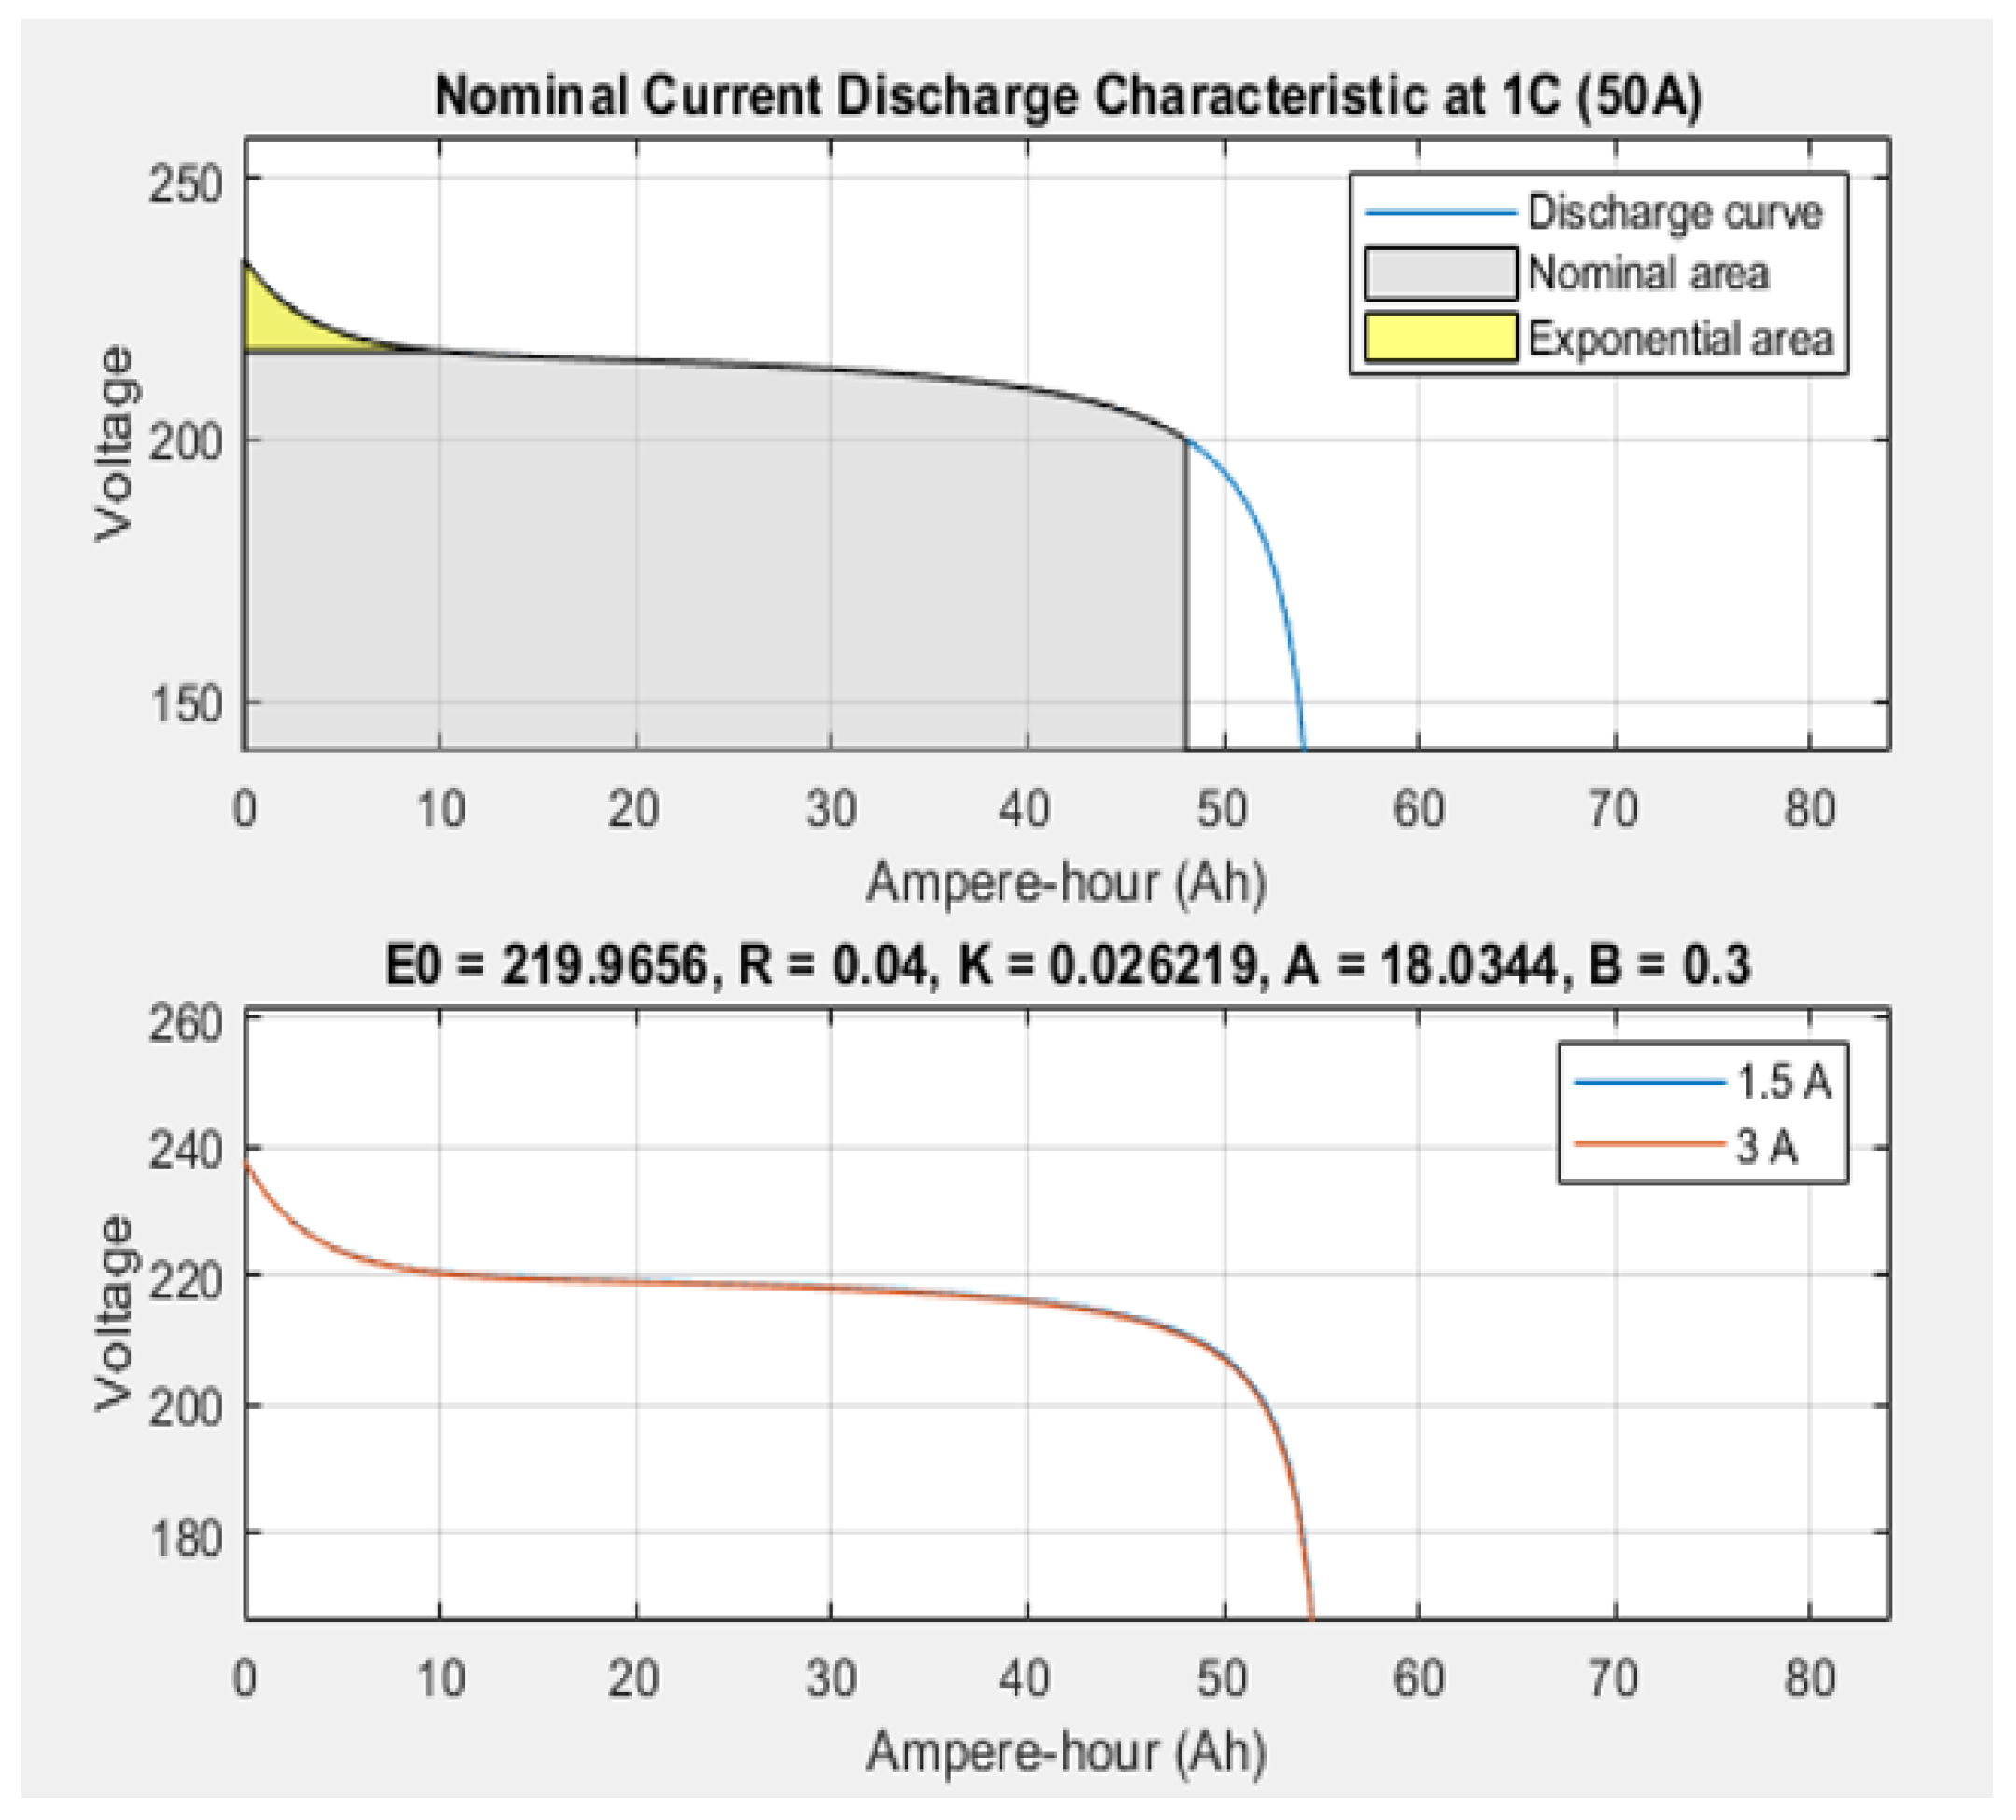
The total loads are 3.72 MW and 2.3 MVAr. PV stores electricity throughout the day, as well as at night, and functions as an energy source back-up at peak periods of the day. The PV provides the PEV energy storage charge device with charging capacity. The demand for electricity from different vehicle types, the number of vehicles and batteries are often measured and evaluated in real-time. The findings are analyzed using the PV smart DN and PEV charging system disconnected from the grid.
When the PV plant cannot satisfy load demand at any time of the day, the microgrid backs and protects the main grid. The present is higher at the hour of loading. The Inet turned positive at 05.00 h; the PV re-injects power, and the EV is loaded. Around 21:00 h a day, another battery is being discharged. The battery is held at an optimum level at all times of day and the microgrid experiences continuous positive Inet. For storage in the PEV loading system, the excess loading current is redirected at full battery. The EV battery charging device and EV charging link are concurrently set up to begin with the minimum initial battery state of charge (SOC) for PEV battery storage. The regular loading of batteries is tracked to verify the storage levels of each hour and how many car forms can be charged comfortably. This process is replicated when the initial SOC battery is 80% charged The EVs for charging are presented in three cases for the type of car depending upon the charging period and kilometers.
- Case A:
The original SOC battery is at least 100 kVA in this situation and the charging cycle starts at 16.00 h. The customers were believed to be closed down and ready for charging in their respective workplaces. A total of thirty EVs were attached to a small passenger car and a low battery system at 16.00 to 21.00 h. The machine has a poor battery at 17–20 h where the power link is limited to 20. It means that up to 20 EVs cannot be used with the recharge scheme. The PEV-charging device, however, could handle 19 EVs in one hour without a low battery indication.
- Case B:
The SOC battery is, in this case, full and is charged 24.00 h a day. Pick and mix different charging times, classes and miles per day. An evaluation of the number of connections was performed.
- Case C:
The original battery condition is completely charged in this situation and the charging takes the whole hour of the day. However, it was chosen arbitrarily and measured electronically for assessment on the device charging system for the vehicle class, charge times and miles a day.
Equation (12) indicates that the current supplied by the solar cell inside the resistance
Rs series is relatively low, and the
Rsh shunt was relatively strong. The model consists of a diode, a certain resistance, and a current supply. The entire resistor is not taken into consideration so as to enhance the simulation. The circuit in turn includes a diode, current source, and the PV cells in series and parallel corresponding modes. The output current (out) depends on the mathematical equations with abbreviations employed. The following equation model the current of the PV cell:
The voltage
and current
obtained are described mathematically:
The expected output of the PV system:
where
Igc is the light generated current,
q is the electric charge (1.6 × 10
−19 C),
is strong relatively,
K is the Boltzmann’s constant,
F is the cell idealizing factor,
Tc is the cell’s absolute temperature, the
Cd is the diode voltage.
3.4.2. Liability Detection and Storage in Three-Phase Grid Storage
The types of errors that can be observed are connected to the density of distribution and the precision of the monitoring systems deployed. The levels of penetration in various areas of the monitoring systems vary. For example, in a rural delivery system, the density of tracking devices is typically lower than in an urban distribution system. Furthermore, high-strength grounding failures can only be detected by detectors which are usually mounted on the urban delivery grid, but not on the rural system, with high precision sensors. Here, it is possible to approximate primary (αs) fault areas and to recognize bogus warnings. Consequently, the objective function is to minimize the amount of fault zones (α) suspected, as well as the number of false alarms (
s).
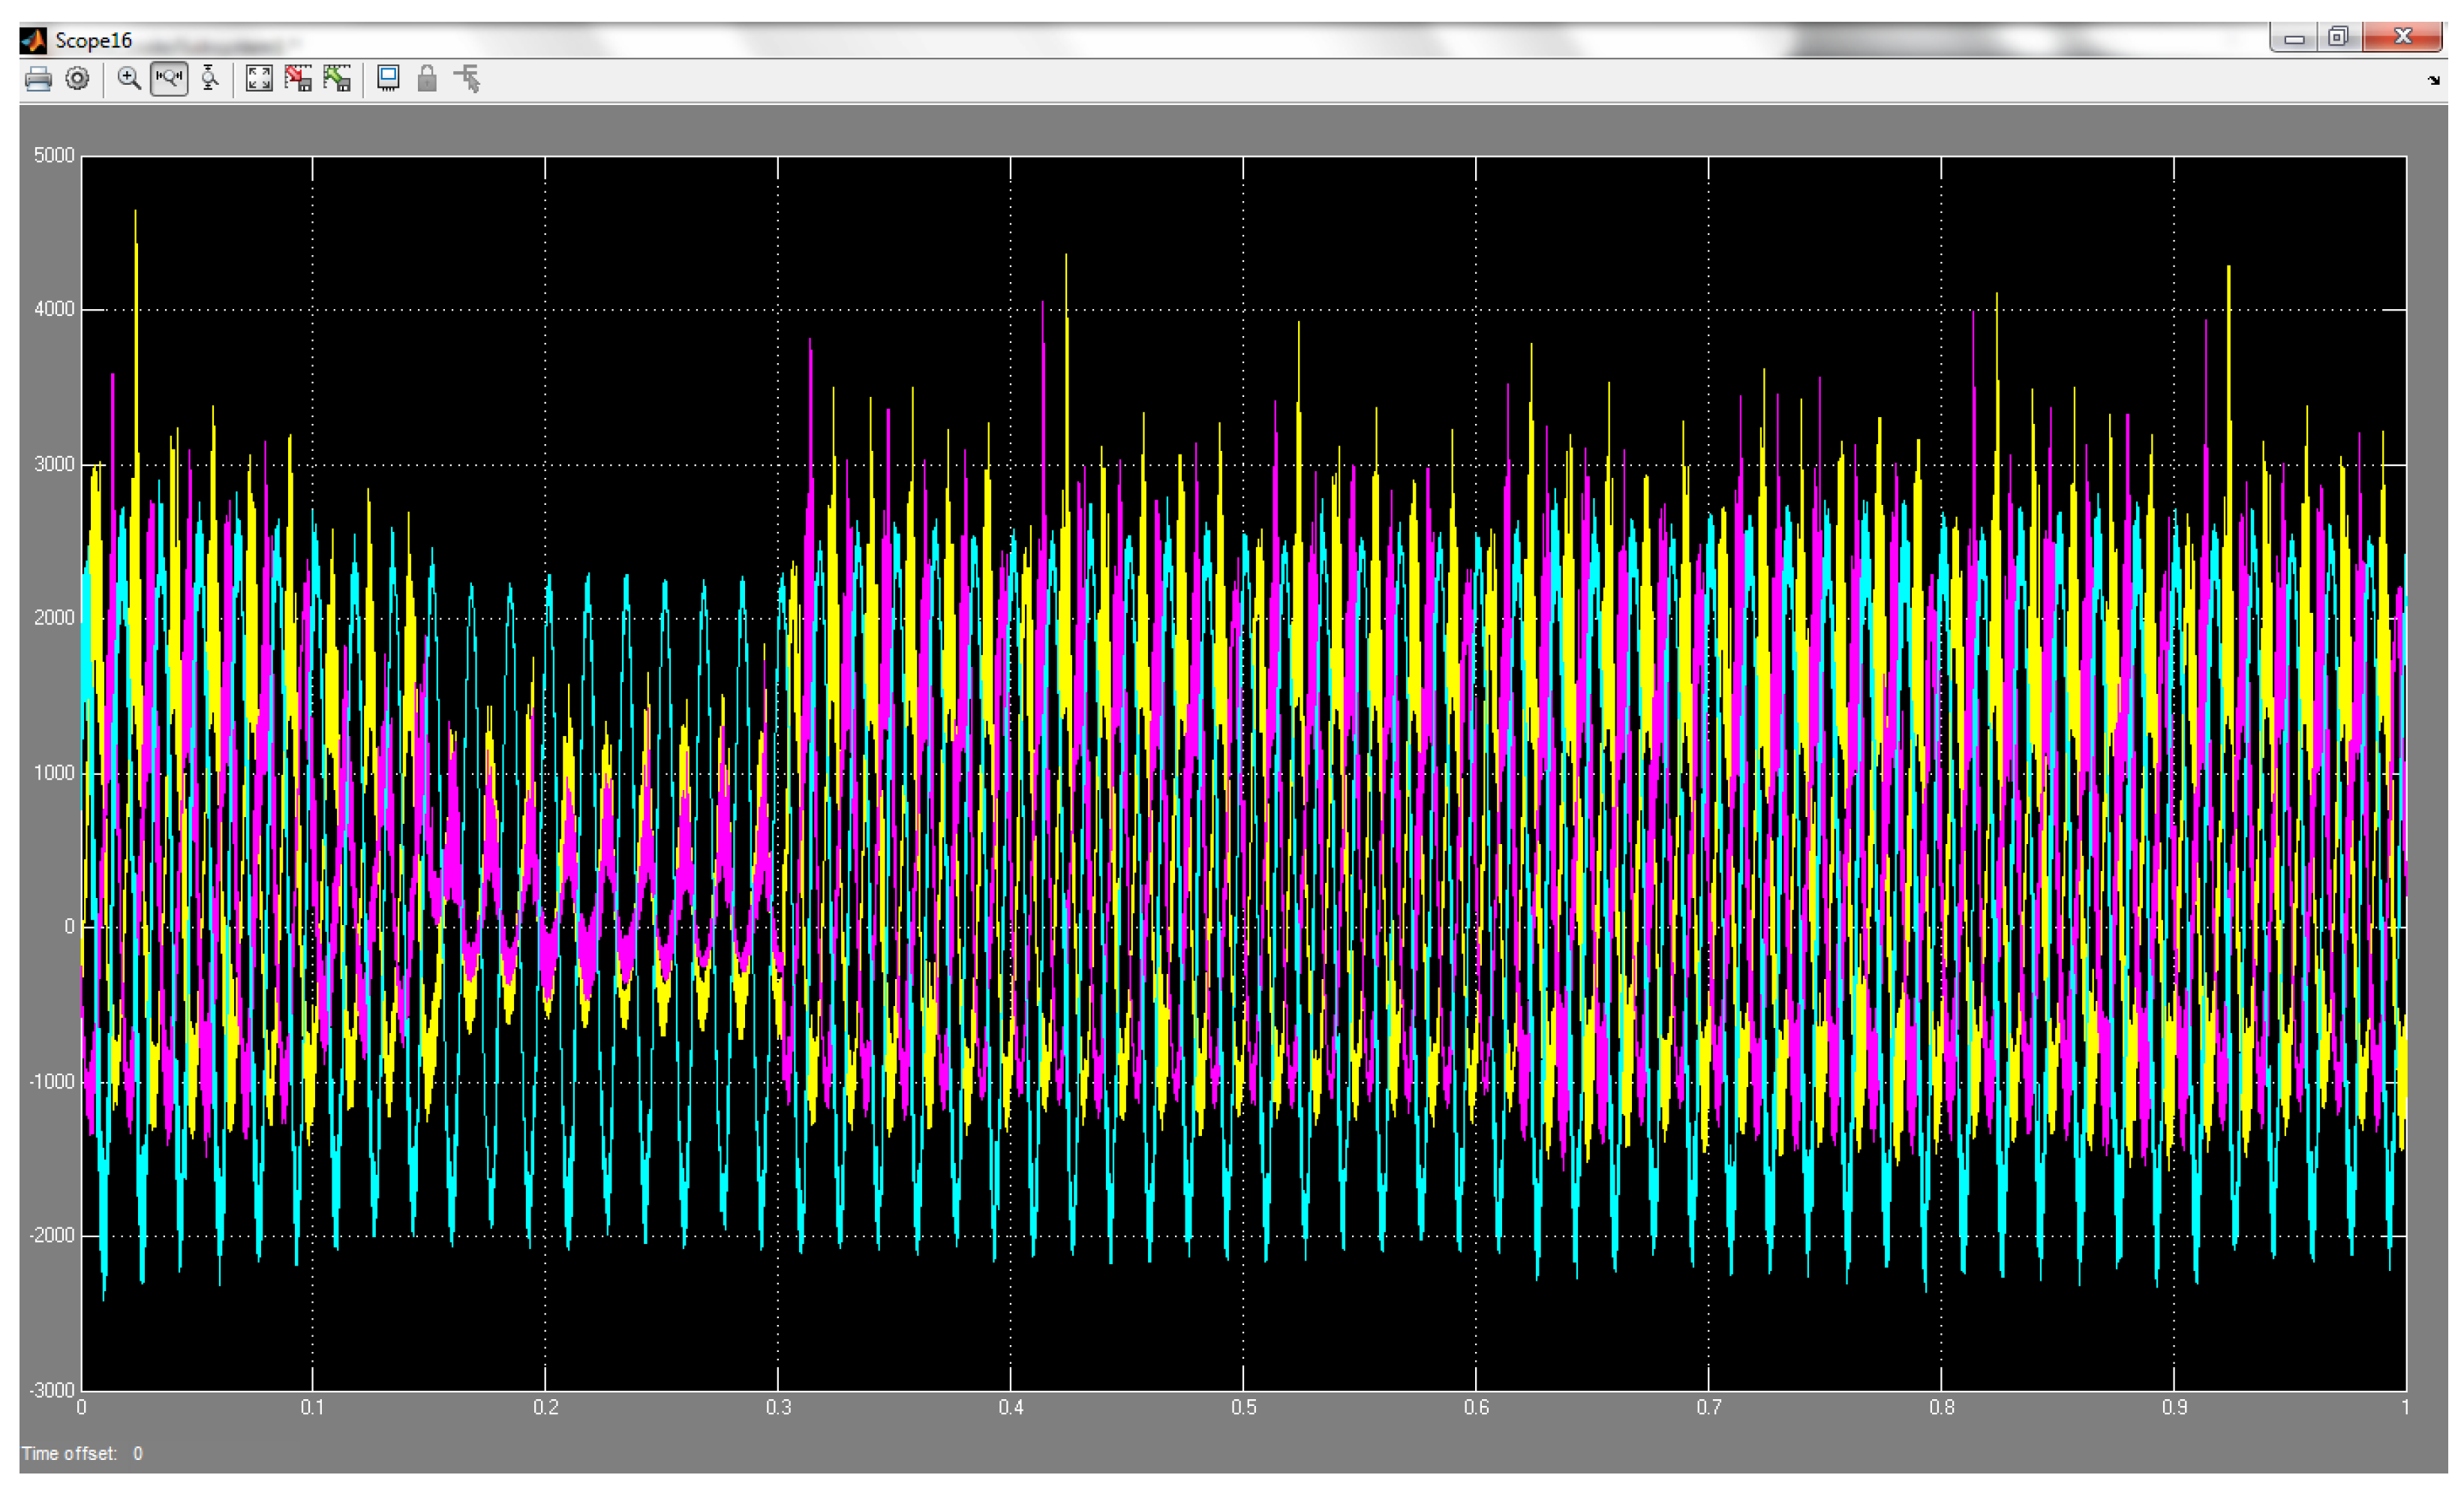
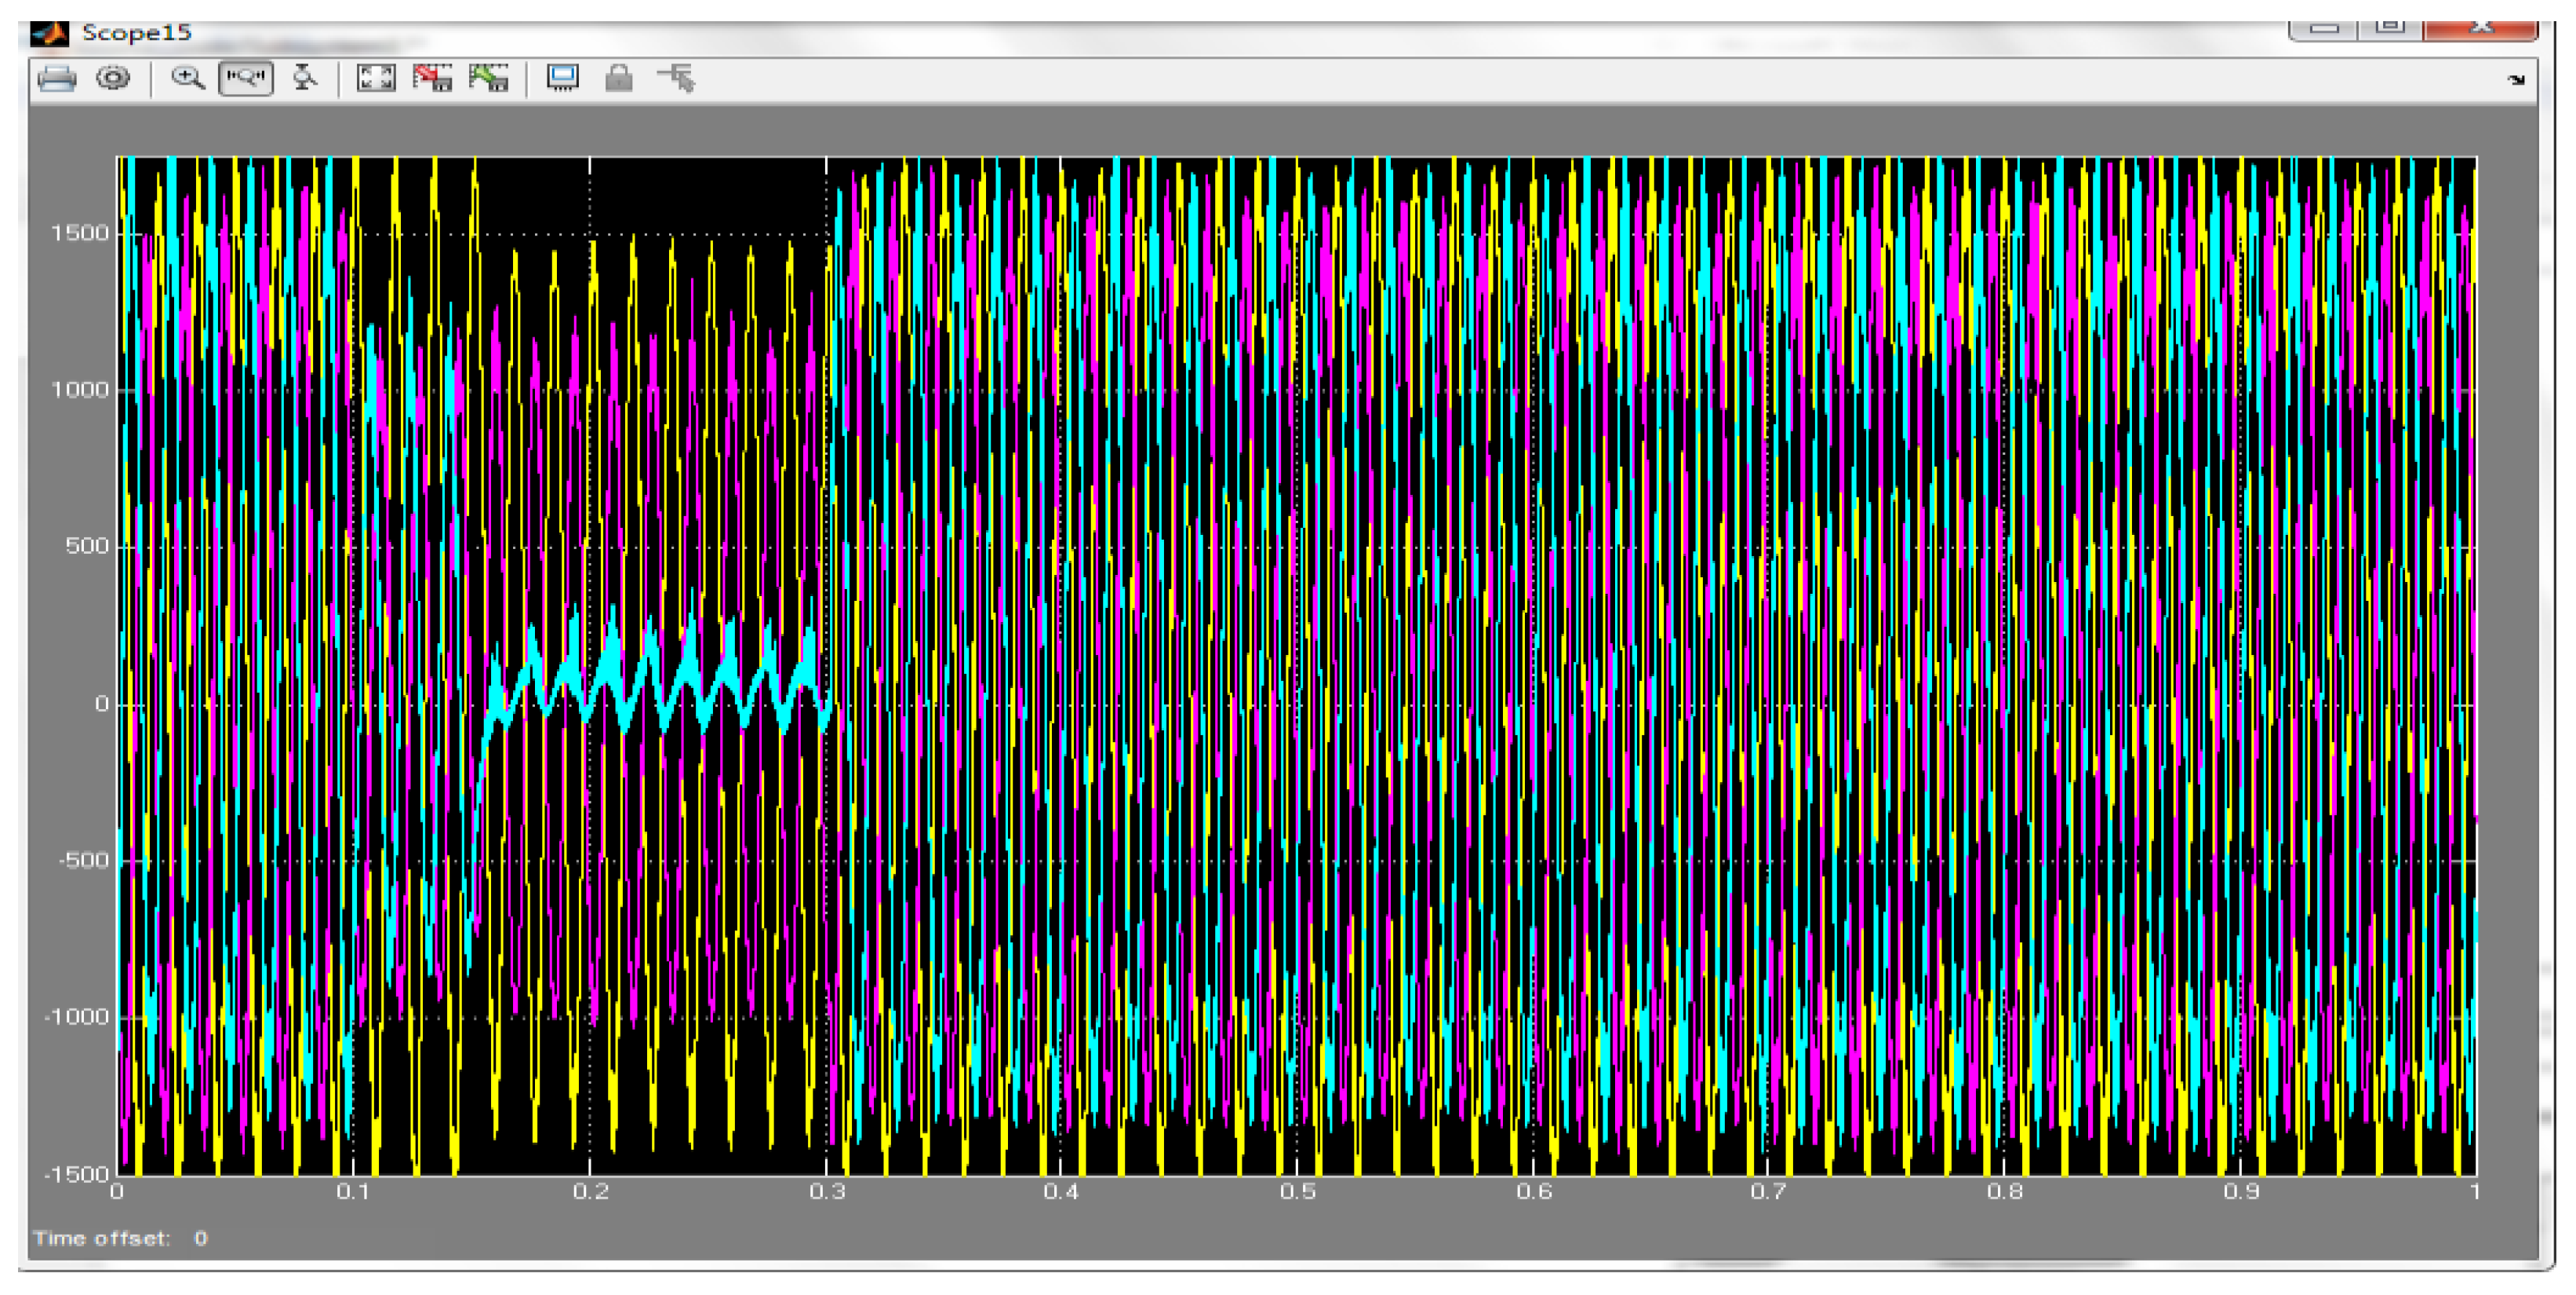
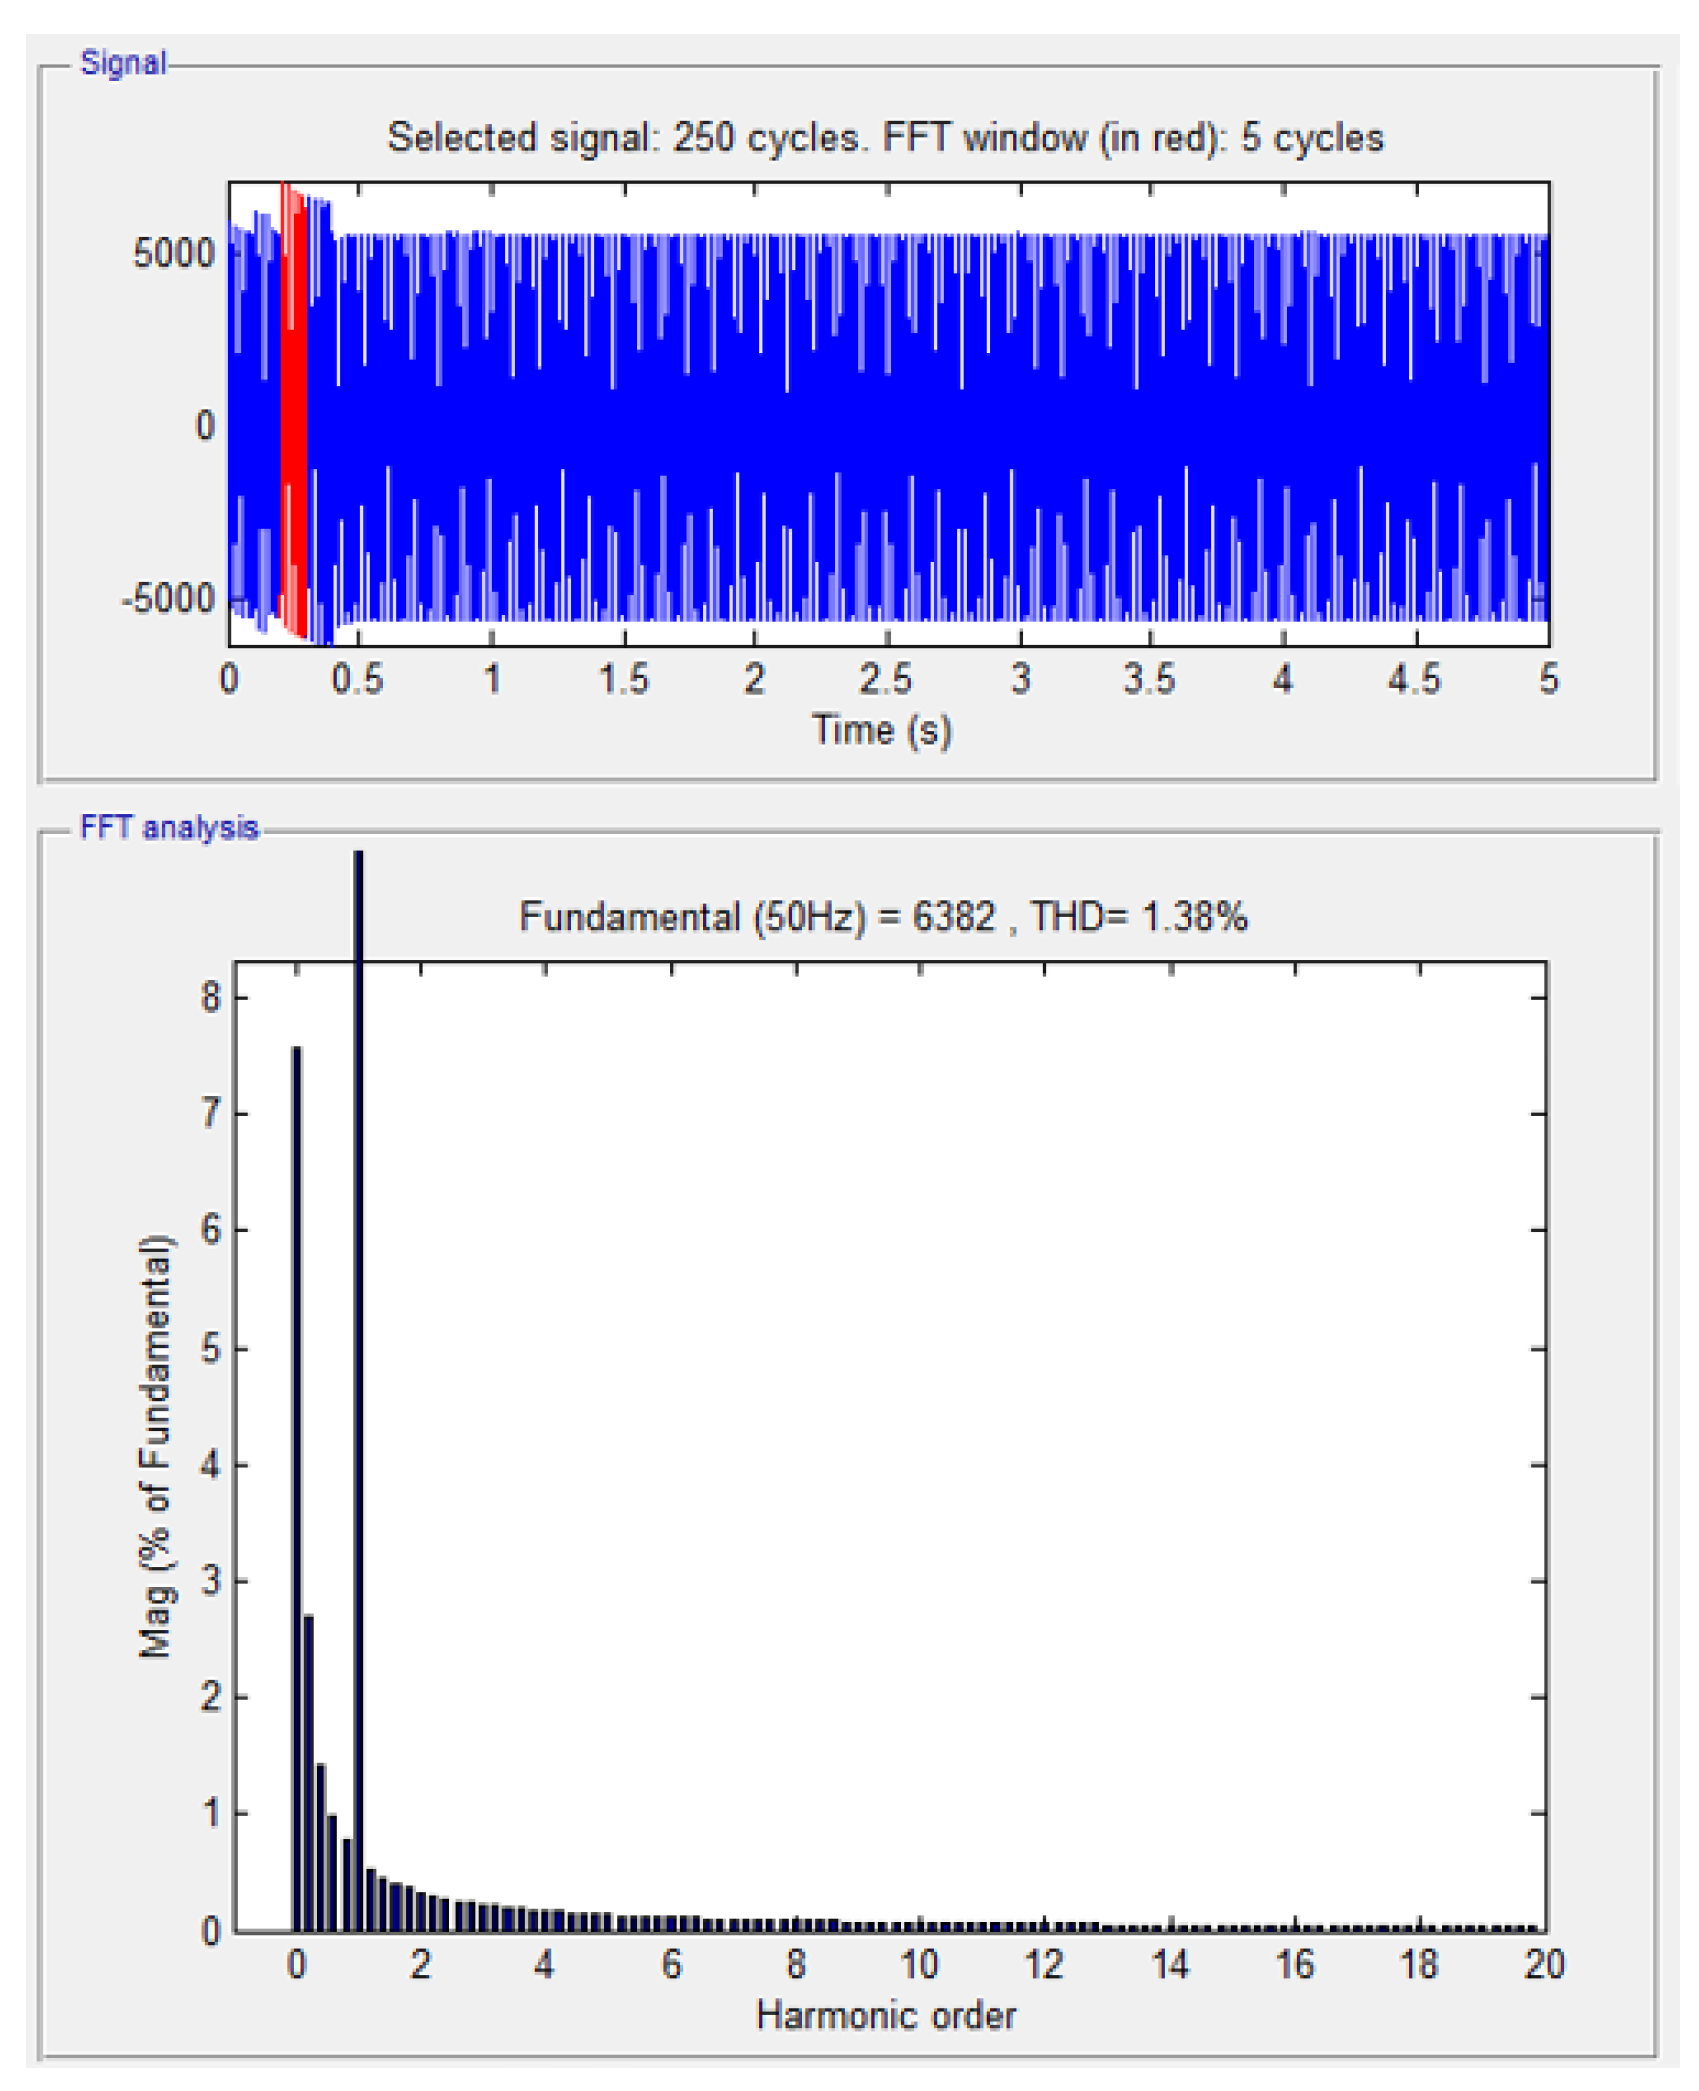
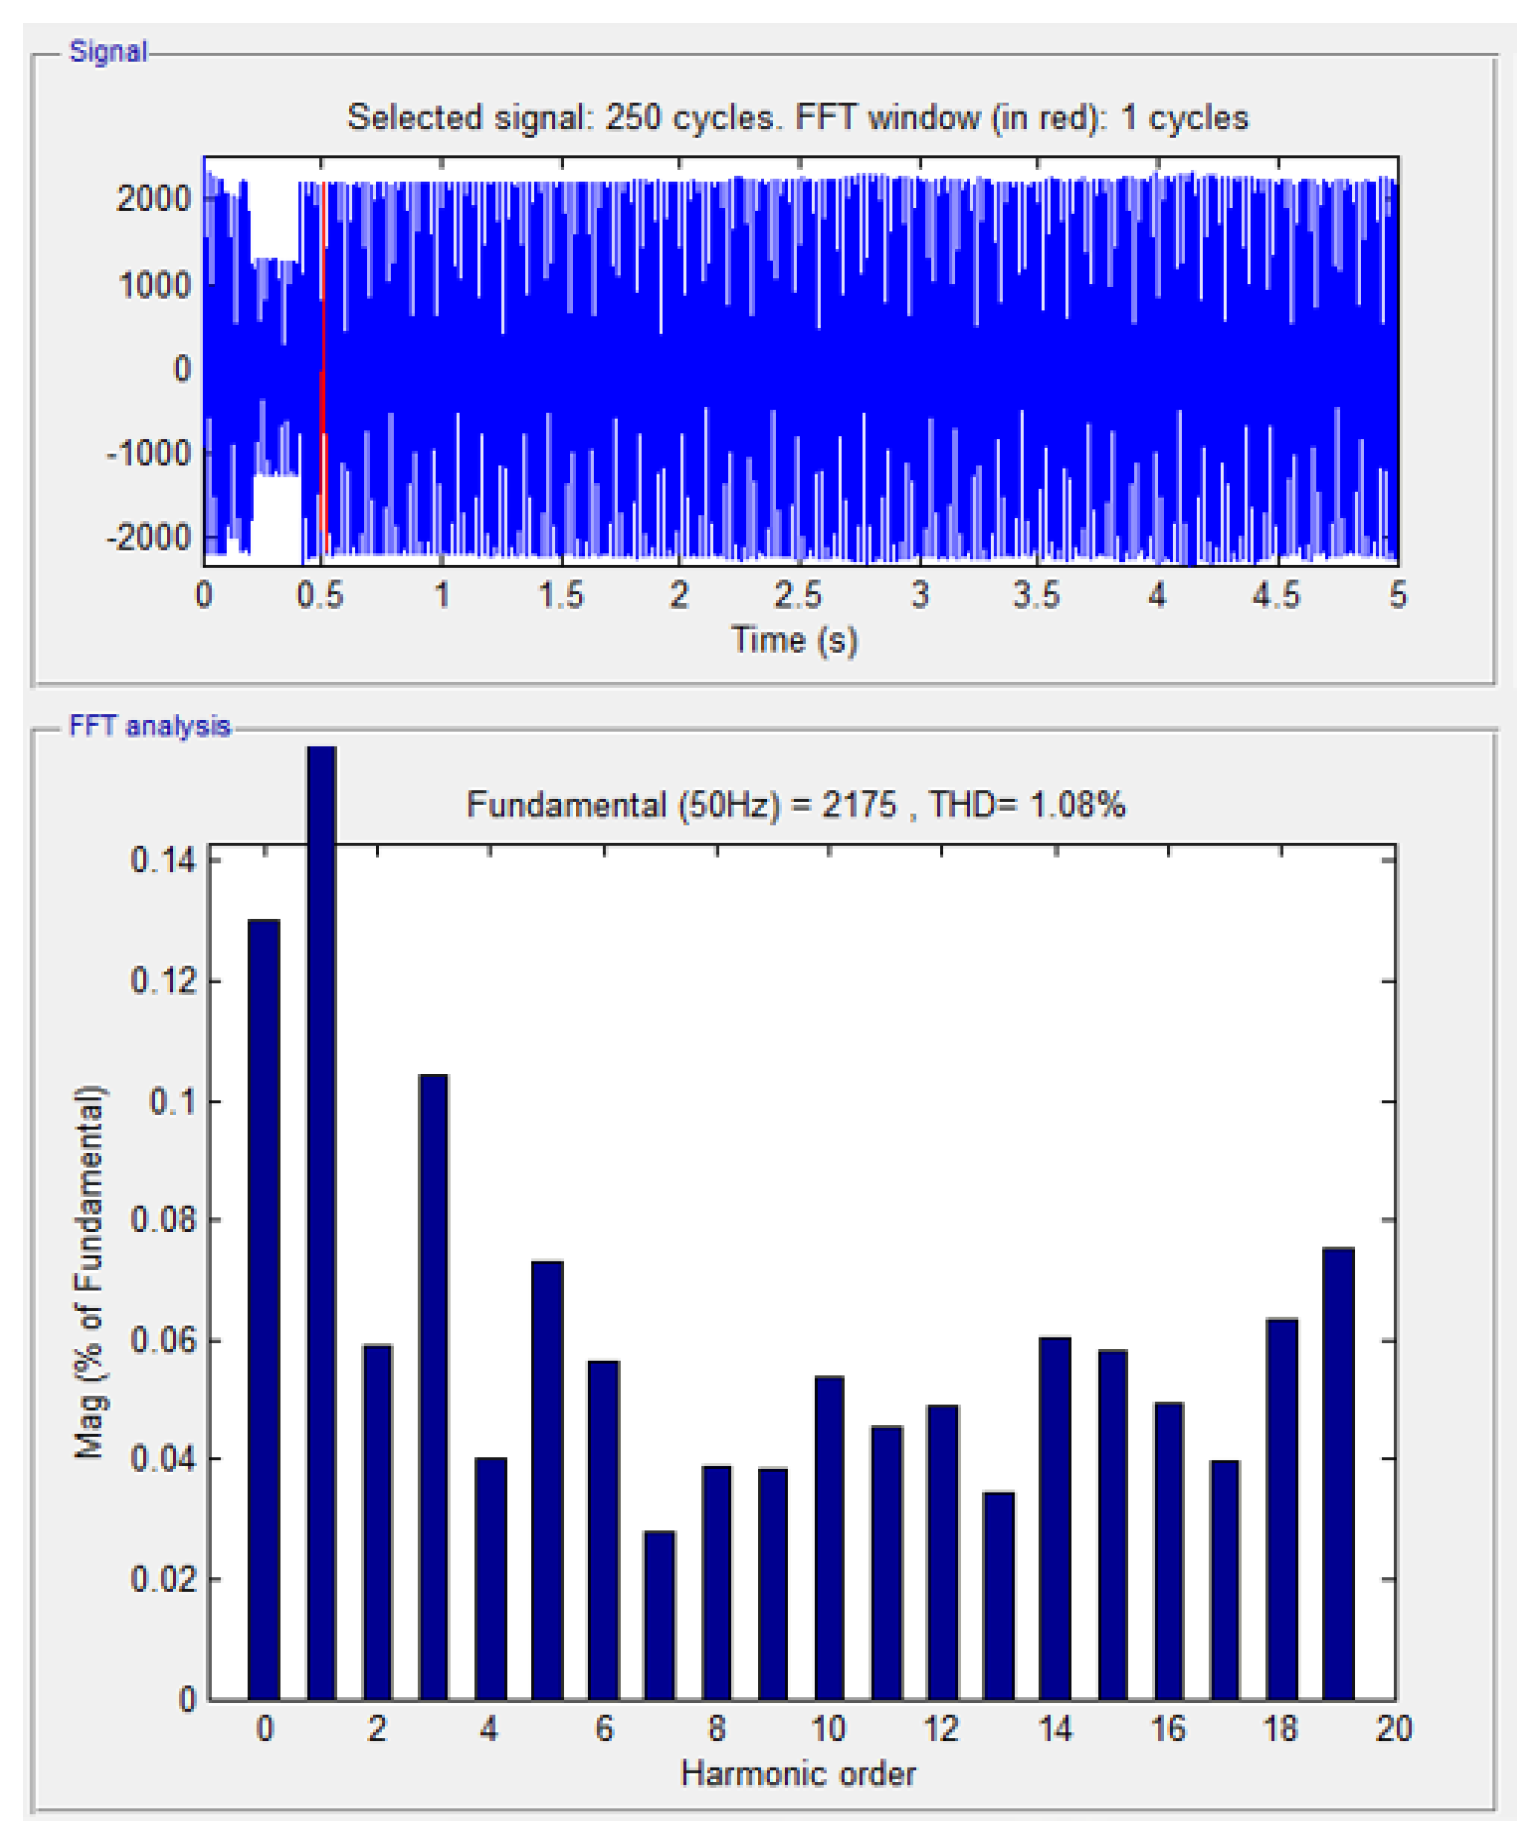
The UPQC utility is based predominantly on the APF series controller and shunt. The key goal of series compensators is the reduction in harmonic distortion in a supply voltage. The harmonics should then be extracted to achieve the system’s full power. Power is passed to the grid and the load on the transmission line. Consequently, using this approximate process, effective power compensation was carried out. The key goal of series compensators is the reduction of harmonic distortion in a supply voltage. The three-stage electric power is considered a characteristic method for the electrical power ac (alternating current) generation, distribution, and transmission. Just the PQ was improved, afterward, the loss was remunerated and power was stored in the grid in support of supplementary handling. The power was being transmitted in the transmission line course, for the grid and three-phase load. Therefore, the compensation of effectual power was carried out with the projected method utilization. The validation condition or testing of the given source is performed based on the controller and switching pulses. By using this, harmonics are reduced, which enhances the performance. Between the source and grid transmission, the generated pulse from the controller while stored in the grid also offers a reduction in harmonics or THD value. The testing or validation of this is performed based on THD by varying the time interval and attaining THD values.
5. Conclusions
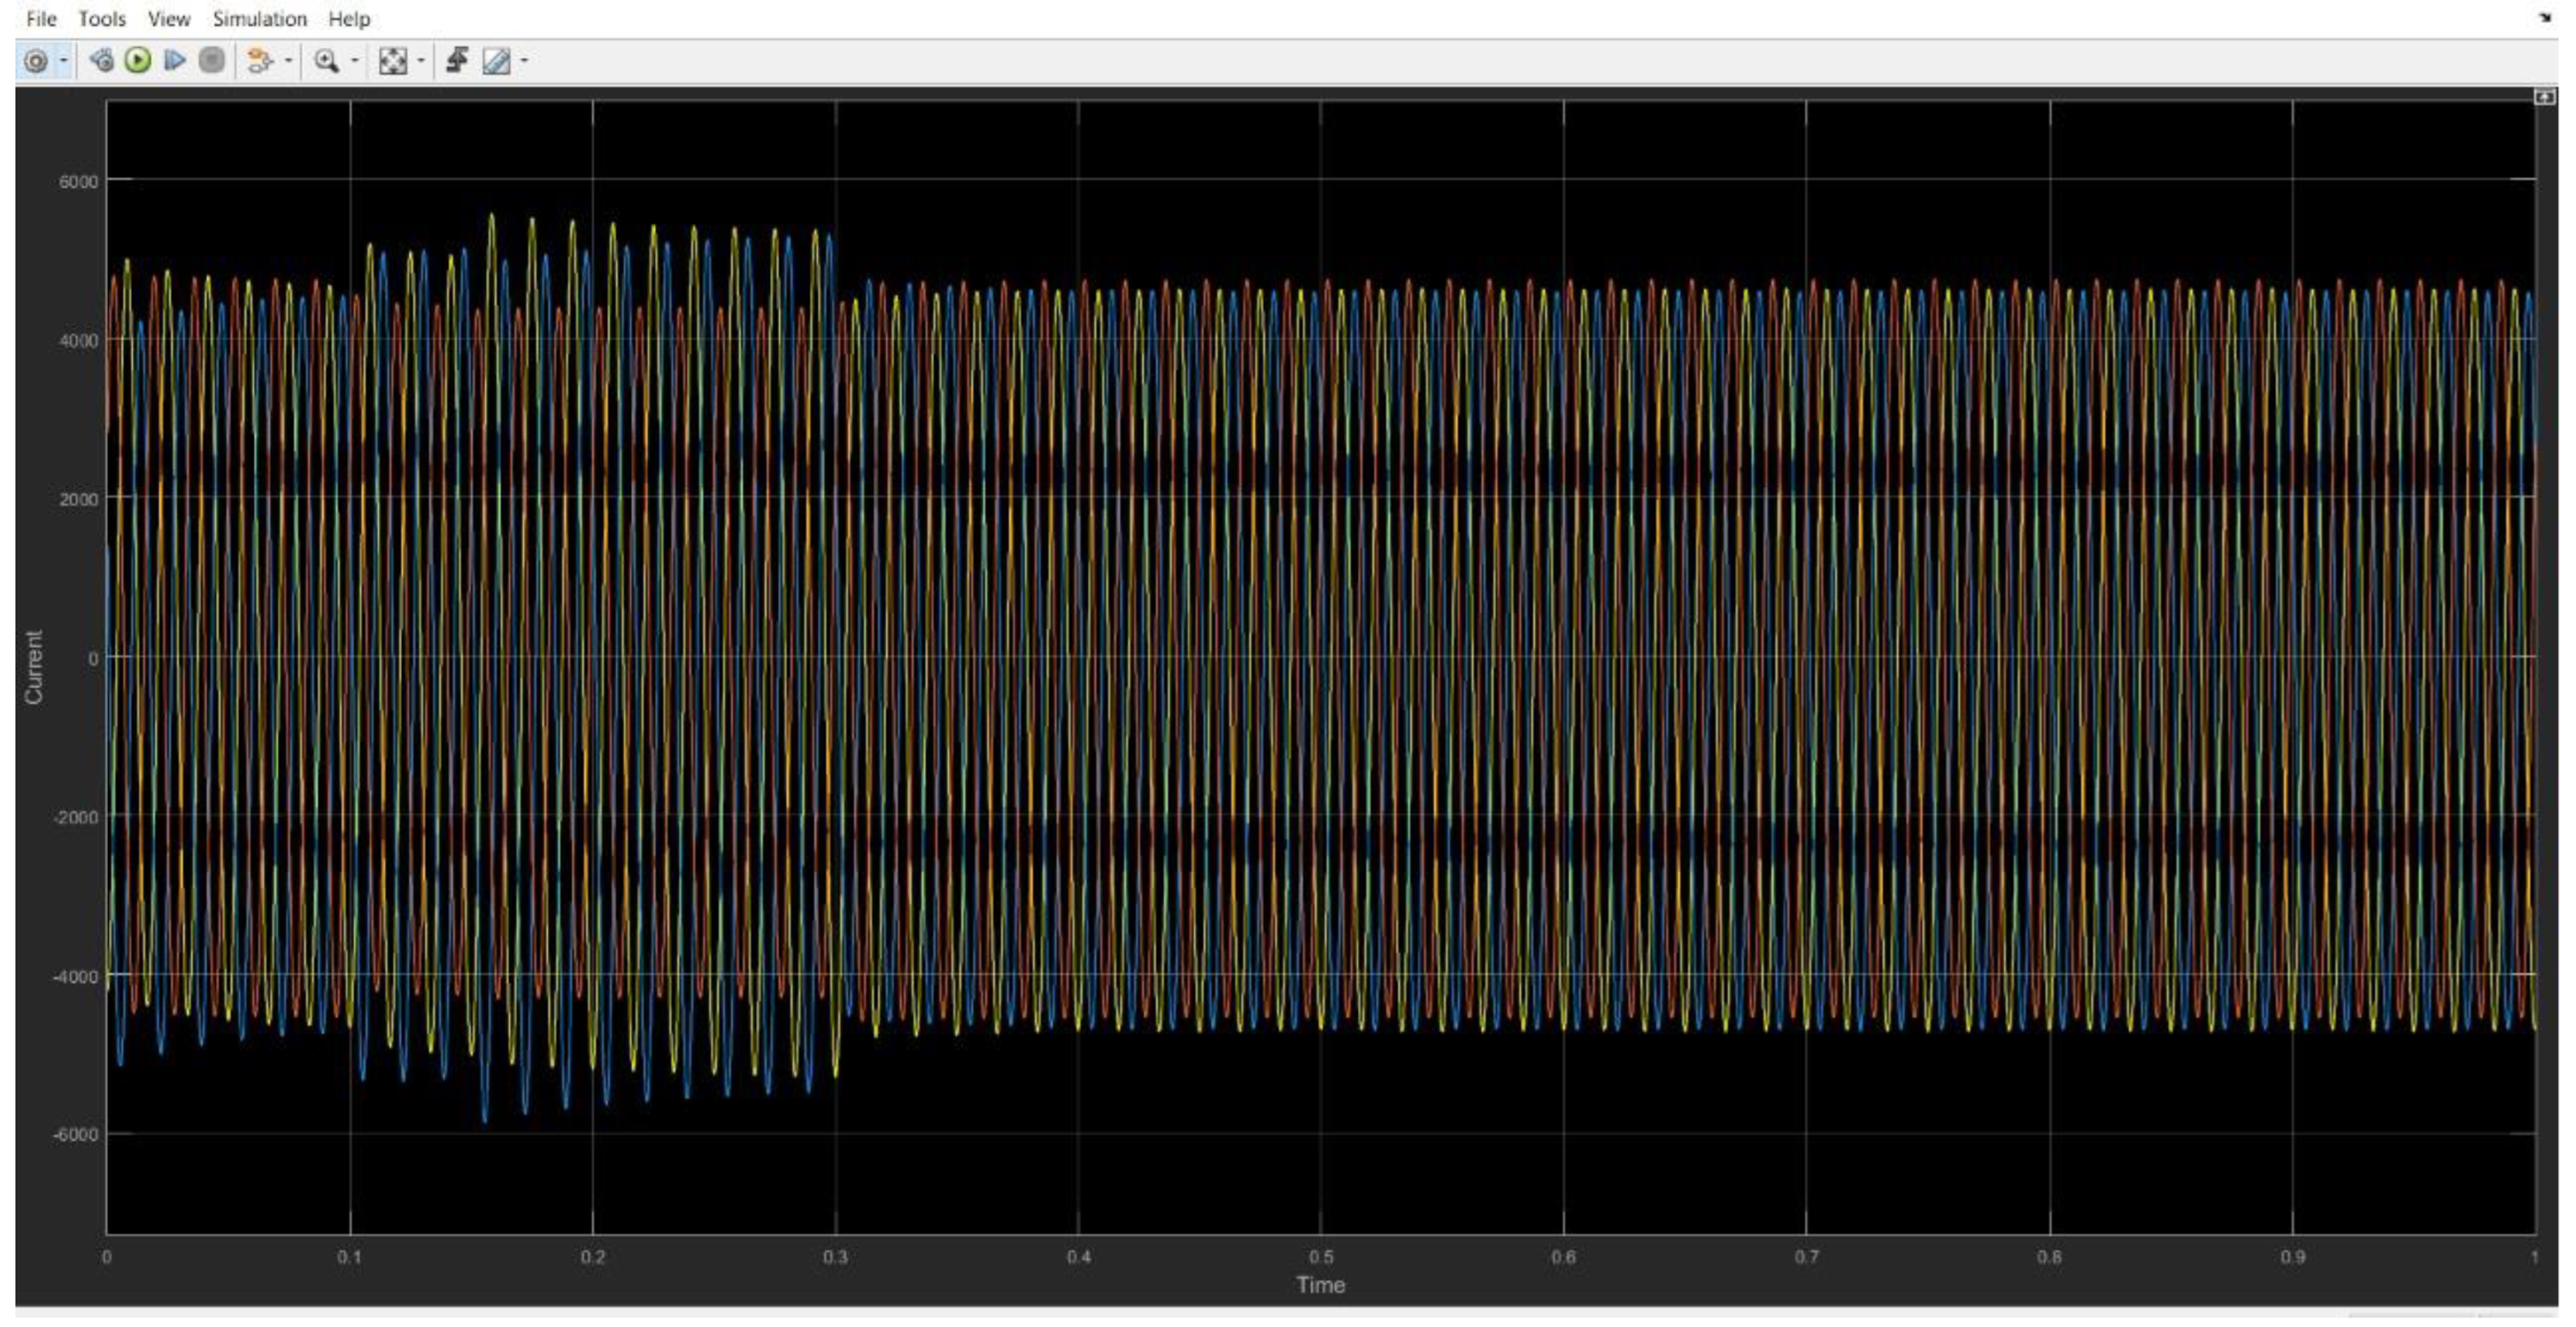
The proposed technique investigated the impact of the EV charging station loads on the voltage stability and power losses of the distribution network using the RL-ICSO optimization algorithm. Initially, from the input bus system, dataset optimal power flow was optimized to obtain an improved real and reactive current level. The model EV charger load was connected with the input line, bus and outage data to analyze the impact of the EV charging station. In this article, a design of the power quality control of smart hybrid multi renewable energy with microgrids was presented. MPPT-based RL-ICSO was employed so as to boost the DC converter performance. The generated energy was checked for any liabilities by adding some fault in the transmission line and thereby rectifying the fault by means of the UPQC device. Thus, the fault-rectified power was stored in the grid and the transmitting power could be used for electric vehicle charging. This approach mainly aimed at decreasing the errors caused at the power transmission time, hence, it was essential to compensate for the power supply quality just before a three-phase grid. The MPC controller together with RL-ICSO was introduced. This was then integrated into the multi-renewable sources of energy like battery, fuel cells, and PV panels, meaning the correct eradication of harmonics in terms of voltage and current liability. The performance was estimated in terms of power and current measurement, THD estimation, EV charging and discharging state. The outcome attained for the proposed MPC with the RL-ICSO optimization scheme in terms of grid current THD is about 1.38% with grid voltage THD at 1.08%. The THD attained for the proposed (RL-ICSO with MPC) controller is 1.38%. The analysis attained shows that the system is said to be effective in handling the power and energy factor. Authors should discuss the results and how they can be interpreted from the perspective of previous studies and the working hypotheses. The findings and their implications should be discussed in the broadest context possible. Future research directions may also be highlighted.


