Article

Indication of Sr Isotopes on Weathering Process of Carbonate Rocks in Karst Area of Southwest China

1
School of Energy and Environmental Engineering, University of Science and Technology Beijing, Beijing 100083, China
2
State Key Laboratory of Environmental Geochemistry, Institute of Geochemistry, Chinese Academy of Sciences, Guiyang 550002, China
*
Author to whom correspondence should be addressed.
Sustainability 2022, 14(8), 4822; https://doi.org/10.3390/su14084822
Submission received: 6 March 2022 / Revised: 14 April 2022 / Accepted: 14 April 2022 / Published: 18 April 2022
(This article belongs to the Topic Climate Change and Environmental Sustainability)

Abstract

:
Based on the determination of the major and trace element content, and the Sr isotope composition of soils from limestone and dolomite profiles in the karst area of Southwest (SW) China, this study discussed the distribution and migration characteristics of the elements and the influencing factors of Sr isotope fractionation, in order to better understand the chemical weathering and pedogenesis process, as well as to explore the material source of laterite. The chemical weathering analysis results (Chemical Index of Alteration, mass balance coefficient, and A-CN-K ternary) indicate that the weathering intensity of dolomite profile PB is higher than that of limestone profiles CZ and CY. The correlation analysis between Sr isotopes and P2O5 suggests that in addition to illite, apatite in the dolomite profile also affects the 87Sr/86Sr composition. Sr content and 87Sr/86Sr demonstrate two stages in the weathering process of the carbonate, carbonate dissolution stage, and residual silicate weathering stage. As the carbonate minerals dissolve at the beginning of weathering, the Sr content decreases and 87Sr/86Sr increases slightly. After the decomposition of carbonate, the Sr content remains unchanged and 87Sr/86Sr increases. Finally, the study suggests that the material source of laterite is more likely to be underlying bedrock rather than the aeolian source.

1. Introduction

Chemical weathering is an important soil forming process, which will lead to the decomposition of rocks and minerals to form a weathering crust [1,2,3]. It involves complex chemical, mechanical, and biological processes, which can control the geochemical cycle of various elements, provide nutrients in the soil, and affect the global carbon cycle and long-term climate change [4,5,6,7,8]. Studying geochemical characteristics is helpful to understand the laws and control mechanisms of element release, migration, and distribution during the chemical weathering process [9,10].
Major and trace elements are powerful tools in the study of rock weathering and pedogenesis. Many chemical indicators composed of major elements are commonly used to evaluate the weathering degree [11,12,13,14]. Recently, proxies 4Si-M+ − R2+, Δ4Si vs. R3+/(R3+ + R2+ + M+) were proposed by Meunier et al. and were considered to be more accurate in distinguishing chemical weathering trends [11,15]. The immobile elements were utilized to address the material sources of sedimentary rocks, terra rossa, loess, and deep-sea sediments [16,17,18]. Due to the fact that rare earth elements (REE) have special chemical properties and unique system variations, they have been used to clarify the chemical weathering process of soil and sediments, such as mineral dissolution, and redox fluctuations [13,16,19].
Sr is an important trace component of rock-forming minerals [20,21,22,23]. Sr isotopic composition hardly undergoes any significant fractionation during geochemical processes, and its changes mainly reflect changes in material sources [24,25,26]; therefore, Sr isotopes have been used to study material sources of soils and terrestrial deposits, nutrient cycling in ecosystems, and water/rock reactions in surface or groundwater systems [27]. Julie et al. used Sr isotopes to constrain the contribution of soil mineral development, weathering fluxes, atmospheric deposition, and to elucidate the weathering processes of individual minerals in a small tropical granitoid watershed in the Luquillo Mountains of Puerto Rico [28]. Sr isotopes were also used by Santoni et al. to identify the water–rock interactions and mixing rates within a complex granite–carbonate coastal aquifer under high touristic pressure [23]. Each mineral has an individual 87Sr/86Sr ratio, and different weathering rates of the mineral cause variations in Sr isotopic composition during the weathering process; therefore, Sr isotopes have been used as tracers to address a wealth of geoscience issues in the weathering process of rock [29,30,31,32].
Numerous studies on rock weathering with Sr isotopes have been widely carried out [22,33]; however, most of them are focused on igneous rocks, and few have considered carbonate rocks [34,35]. The distribution area of red soil developed on carbonate rocks in the world is very extensive. The karst region of SW China covers approximately 42.6 × 10⁴ km2 and is one of the largest contiguous exposed carbonate distribution areas in the world [12,14]. The exploration of the pedogenesis process on the weathered carbonate rock in karst areas is the basis for revealing the geochemical cycle of elements in the karst environment and research on supergene resources; however, the material source and formation process of the red soil covering the bedrock is still controversial, and it has attracted wide and strong interest from soil scientists over the years [18,34].
In the southwest-central Guizhou Province, the widely distributed carbonate rocks are covered by thick red soil due to the humid and mild monsoon climate; therefore, the natural setting facilitates the study of carbonate rocks and lateritic soils. In this study, we investigated the Sr isotopic composition and element geochemistry of soil profiles to explore Sr isotopic characteristics and influencing factors in the soil profiles overlying dolomite and limestone, and to explain the material source of soil in this area.

2. Materials and Methods

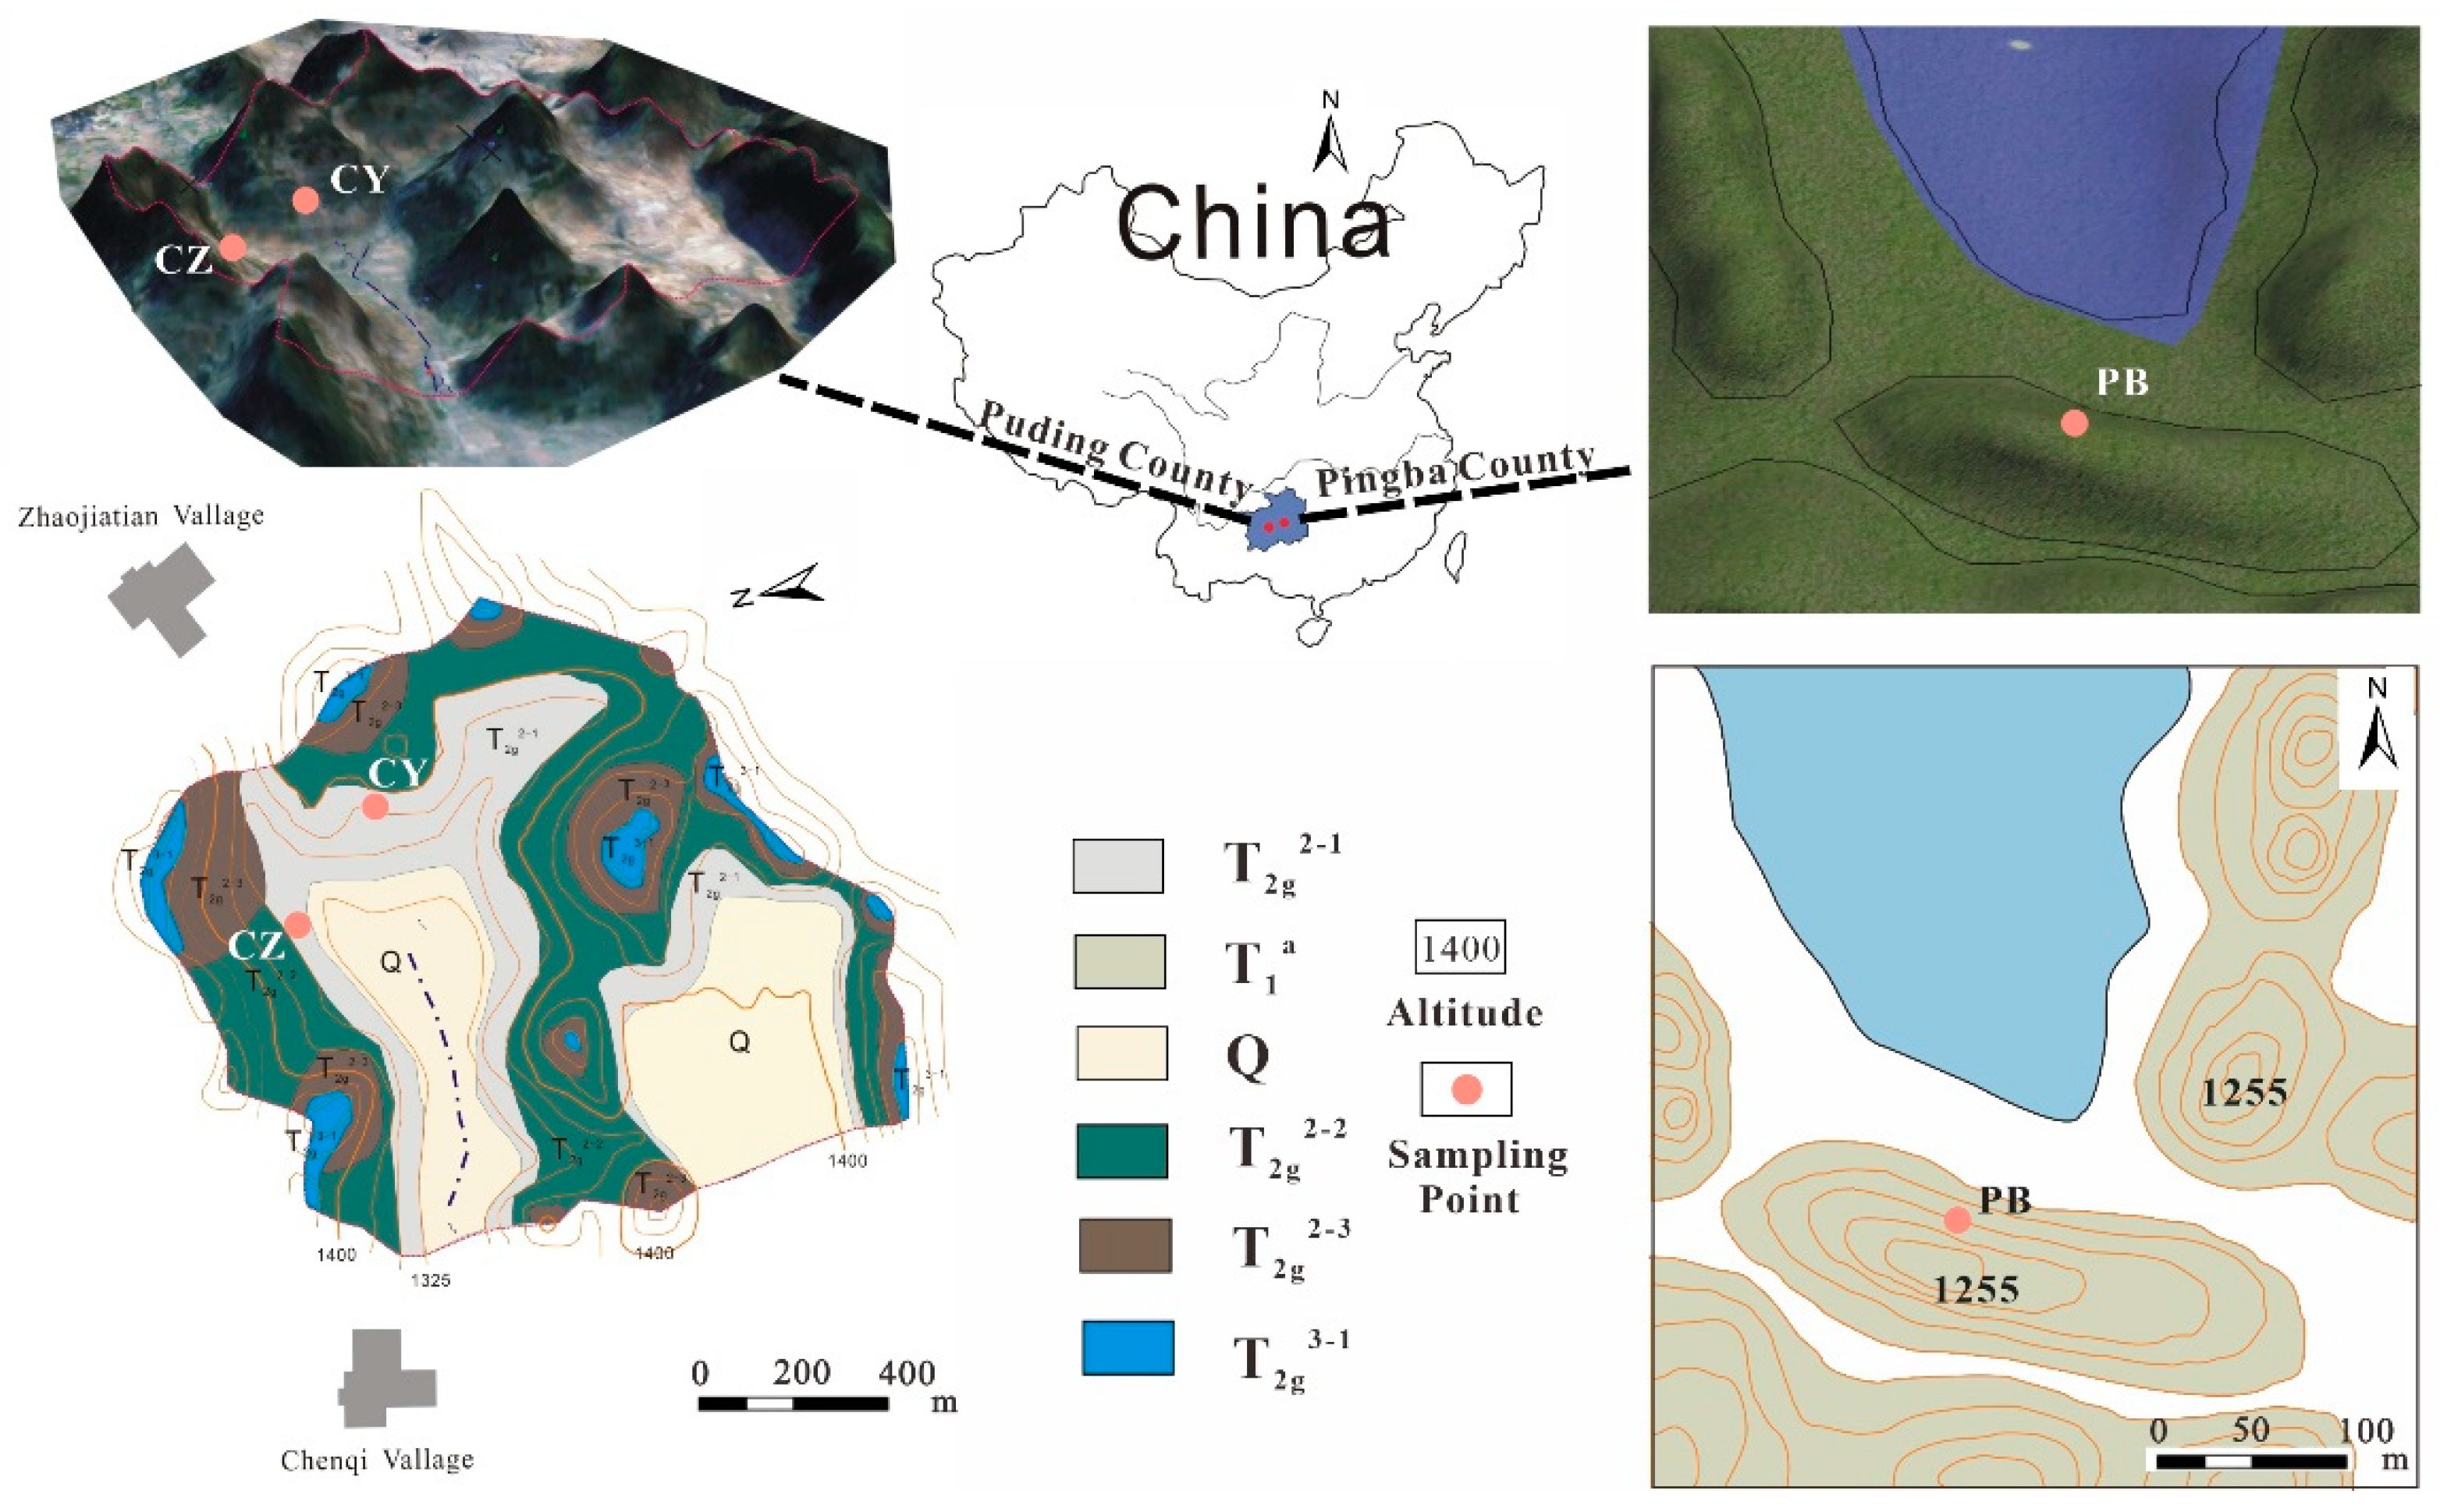
2.1. Study Area and Sampling

The study karst area is located in the central part of the Guizhou Province, Southwest (SW) China (Figure 1). The climate in SW China is humid, and the karst landform is widely developed in the Guizhou and Yunnan provinces. The karst terrain in this area is one of the largest continuously distributed karst landforms in the world. The study area has a subtropical monsoon climate, controlled by the East Asian summer monsoon, the Indian Ocean monsoon, and the Tibetan Plateau monsoon. The annual precipitation is 1100–1300 mm, and the rainy season is from May to October, accounting for 70–85% of the annual precipitation. The weather is relatively mild, and the annual average temperature is above 15 °C [36]. The PB profile (26°26′ N, 106°22′ E) is located in Pingba County, about 40 km southwest of Guiyang, the capital of the Guizhou Province. The sampling points are near Hongfeng Lake. The bedrock is sedimentary dolomite, belonging to the Triassic Anshun Formation. Profiles CZ and CY (26°21′ N, 106°31′ E) are located in the Chenqi watershed of Puding County, about 50 km southwest of Pingba. The dominant lithology of this watershed is the limestone of the Guanling Formation of the Triassic system [18,36]. The sampling points and regional lithology are shown in Figure 1.
The vertical soil profiles were established due to road construction by an excavator. The surface soil of the profiles is loose and covered with lush vegetation. The samples were collected in order from the surface soil to the bedrock. A total of 9 soil samples and 4 bedrock samples were collected from PB profile. PB-1, PB-2, and PB-3 were collected at 5 cm, 10 cm, and 20 cm away from the ground, then soil samples were taken at every 40 cm and recorded as PB-4-PB-9. Four bedrock samples were collected at 290 cm, 390 cm, 590 cm, and 1090 cm, respectively, and were recorded as PB-10 to PB-13. CY-1 and CZ-1 were collected at 40 cm and 30 cm away from the ground, then 4 soil samples (CY-2 to CY-5) and 5 soil samples (CZ-2 to CZ-6) were collected at intervals of 40 cm and 30 cm, respectively. Subsequently, bedrock samples were collected at 250 cm and 210 cm away from the surface and recorded as CY-6 and CZ-7.

2.2. Analytical Methods
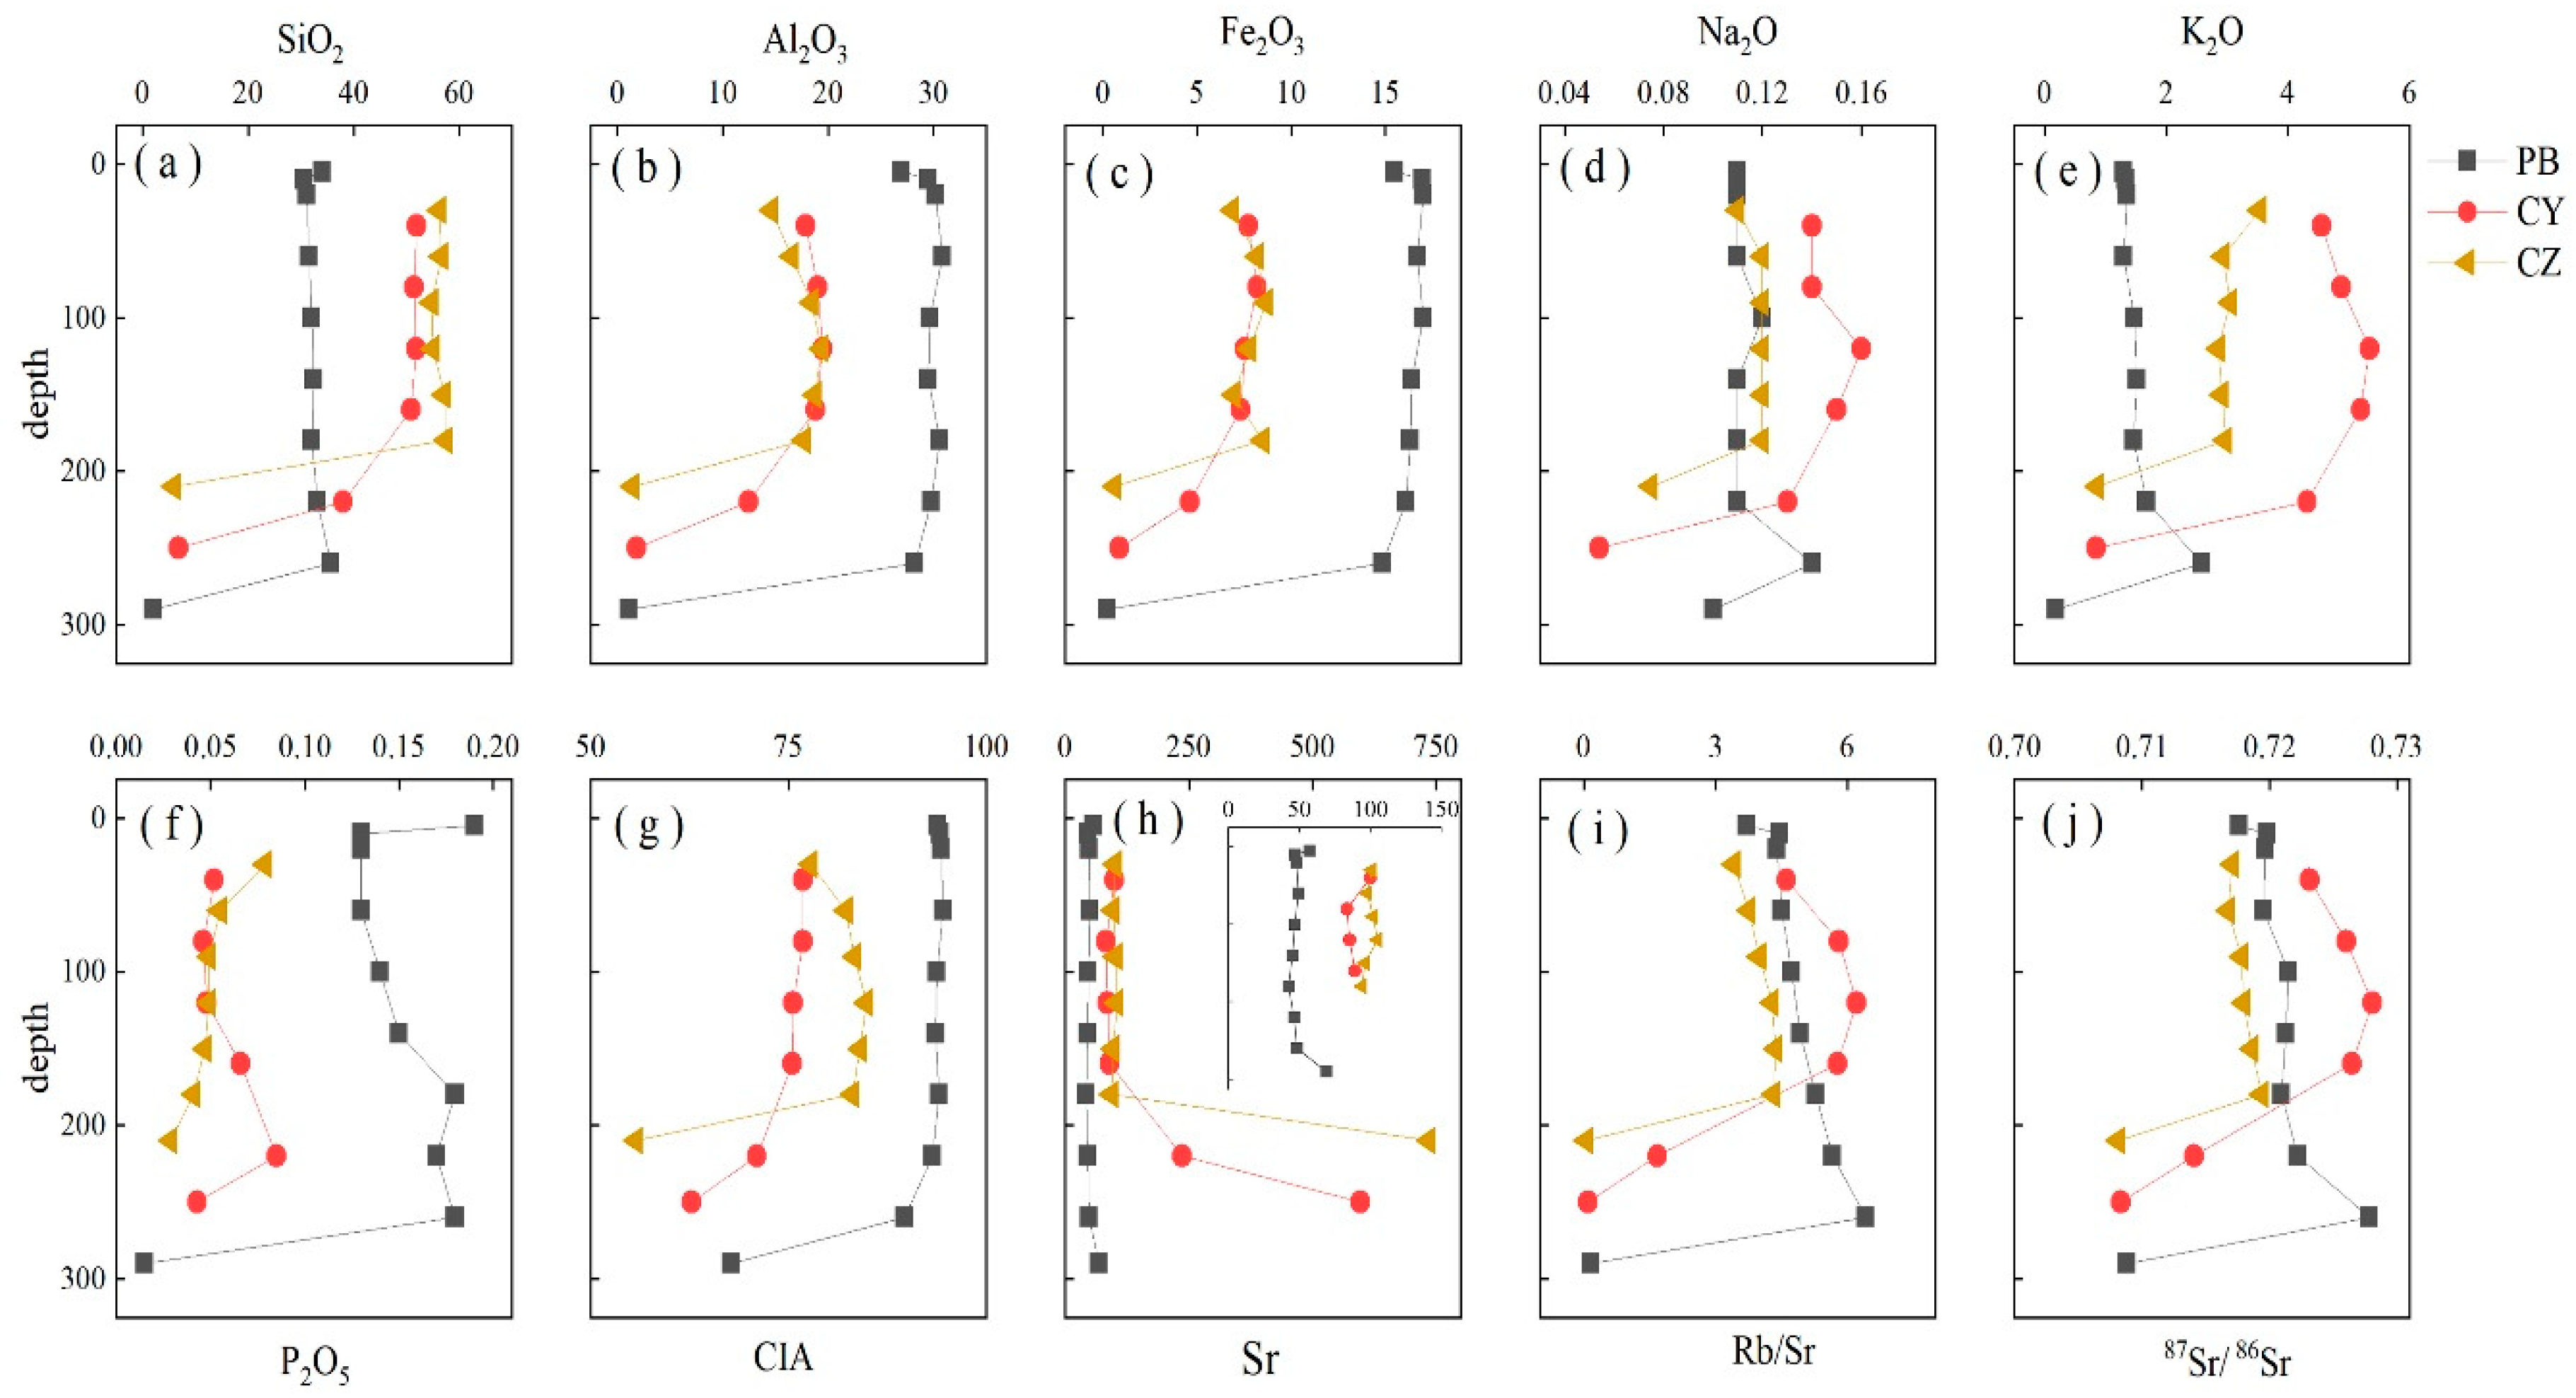
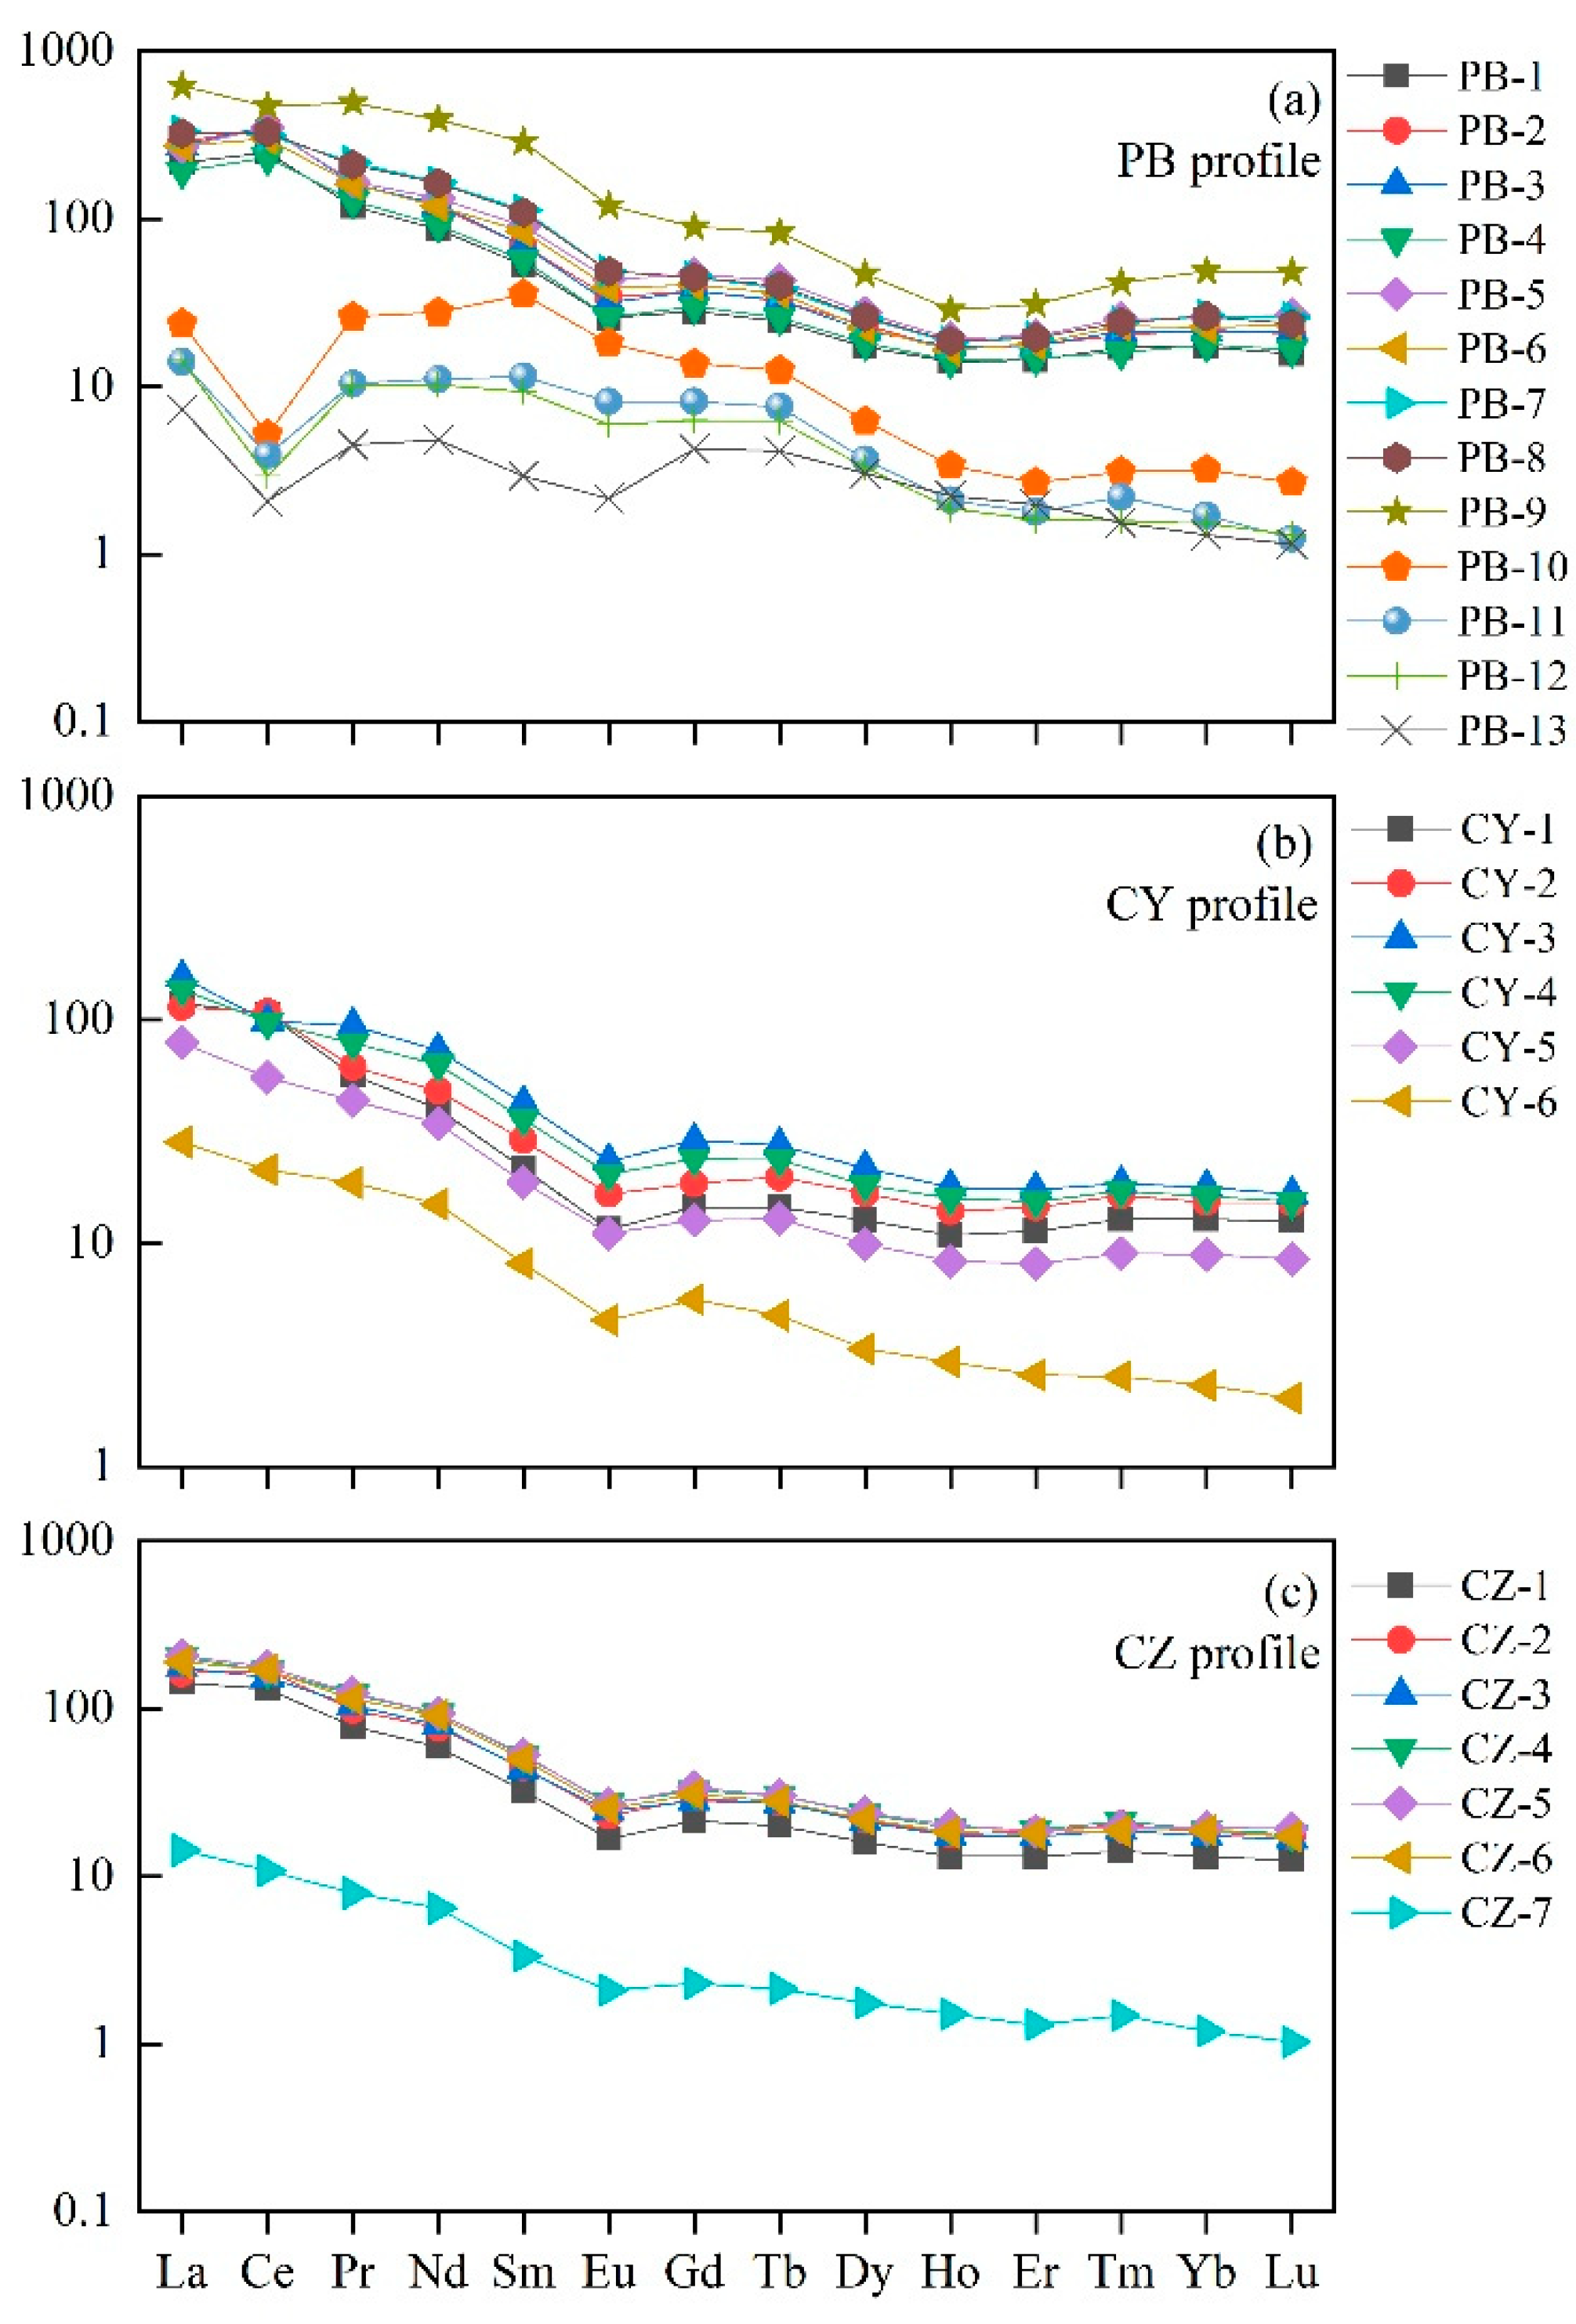
A total of 26 samples from three profiles were collected, including 20 soil samples and 6 bedrock samples. The soil samples were air-dried to remove impurities such as plant roots, debris, and conglomerates, and placed in a sealed polyethylene bag for storage, pretreatment, and analysis. Air-dried soil samples for whole-rock geochemical analysis were ground in an agate mortar and sieved through a 200-mesh (74 μm) light sieve.
The major elements were determined via X-ray fluorescence spectrometry (XRF) (PW2400 X-ray fluorescence spectrometer, PANalytical Company, Westborough, MA, USA) in accordance with the GB/T14506.28-2010 silicate rock chemical analytical procedure [37]. The trace elements and REE contents were analyzed using high-resolution inductively coupled plasma mass spectroscopy (HR-ICP-MS) (Element I, Thermo Fisher, Waltham, WA, USA) according to the GB/T14506.30-2010 [38]. An ICP-MS procedure was conducted at a temperature of 20 °C and a humidity of 30%. The analytical precision values for major and trace elements were less than 5% and 10%, respectively. The major and trace element data of all samples were provided by the Beijing Research Institute of Uranium Geology. Sr is determined by the isotope dilution method at the State Key Laboratory of Environmental Geochemistry, Institute of Geochemistry, Chinese Academy of Sciences. The powder samples (sieved through 200 mesh) were placed into a low-pressure digestion tank and the analytical grade HF + HNO3 + HCl mixed acid was added to digest the samples. The dissolved sample is evaporated so that it becomes dry and converted to perchlorate, and 1.8–2.0 mol/L hydrochloric acid was used as elution acid. Sr isotopes were measured by multi-collector Thermal Ionization Mass Spectrometry (TIMS) (IsoProbe–T, GV Company, U.K.). TIMS typically provides a value of the 87Sr/86Sr ratio of 0.710235 ± 0.000014 (2σ, n = 26) for the NBS987 Sr standard, and the measured isotope data are precise to 0.003% or better.
The Chemical Index of Alteration is widely used to measure the chemical weathering degree [39,40]. It can demonstrate the degree of feldspar decomposition and clay mineral variation in soils. The calculation method is: CIA = Al2O3/(Al2O3 + CaO* + Na2O + K2O). Al2O3, CaO, K2O, and Na2O are all molar numbers of oxides, in which CaO* is the molar content of silicate minerals, excluding the content of CaO in carbonates and phosphates [41]. Usually when the molar number of CaO is greater than Na2O, n(CaO*) = n(Na2O) can be considered, whereas n(CaO*) = n(CaO) can be considered when the molar number of CaO is less than Na2O [41].
Mass balance coefficient (τ) is one of the best methods to indicate the depletion or enrichment of elements in soil samples, and it can provide information about REE mobility during geochemical processes [13]. The coefficient τ was calculated by the equation:
τ i ,   j = { [ ( C j ,   w ) / ( C j ,   p ) ] / [ ( C i ,   w ) / ( C i ,   p ) ] } 1
where Cj,w, Cj,p and Ci,w, Ci,p represent the concentrations of element j and the relatively immobile element i in the soil samples and the bedrock, respectively. A positive τi,j, value indicates that element j is enriched in soils relative to that in bedrock, whereas a negative value indicates the depletion. And zero of τi,j indicates the immobility of the element j in soil. We used Th as the immobile reference element in this study.

3. Results

The vertical changes in the concentration of several selected elements and other geochemical parameters are shown in Figure 2. Multiple elements have a very low content in the bedrock samples (PB-10, CY-6, CZ-7) of three profiles, but Sr content is still relatively high. The concentration of Al2O3, Fe2O3, and P2O5 in the dolomite profile PB is higher than in the limestone profiles CY and CZ, whereas SiO2, K2O, and Sr are lower. CIA is a common proxy for determining the weathering intensity. Figure 2 shows the variation of CIA with depth. The CIA values of rock soil interface in the profiles PB, CY, and CZ are 89.65, 70.97, and 83.05, and of the soil samples they are 93.20–94.60, 75.45–76.81, and 77.76–84.76, respectively (Table 1 and Table 2). It is significantly higher than the average CIA (47.92) of the upper crust (UCC).
The maximum range of REE content is 354.96–994.65 in the PB profile with an average value of 535.64 (Table 3). At the same time, the PB profile has a higher degree of fractionation between light and heavy rare earth elements with (La/Yb)N = 10.49–13.10. In contrast, the content of REE in limestone profiles CY and CZ is lower than in the PB profile, as well as the fractionation degree between light rare earth elements (LREE, La, Ce, Pr, Nd, Pm, Sm, and Eu) and heavy rare earth elements (HREE, Gd, Tb, Dy, Ho, Er, Tm, Yb, and Lu). The content of REE in the CY profile ranges from 111.18 to 218.59, with an average value of 166.16, whereas the content in the CZ profile ranges from 221.65 to 303.05, with an average value of 247.39 (Table 4). The (La/Yb)N are 7.48–9.24 and 8.86–10.98 in CY and CZ profiles, respectively. In addition, the ratio of LREE/HREE (14.01–17.16 in PB profile, 7.72–10.70 in CY profile, and 10.07–10.64 in CZ profile) shows that compared with HREE, the enrichment of LREE in the three profiles is higher. The chondrite-normalized REE pattern displays a right-leaning trend, which is also indicative of the enrichment of LREE (Figure 3). In the REE pattern, the PB profile shows a significant Ce anomaly (δCe = 0.85–1.7), whereas the Ce anomaly is not obviously in the limestone profile CZ and CY.
All of the soil samples from the PB profile have a positive Ce anomaly except PB-9, which has a negative Ce anomaly (δCe = 0.85). The soil samples from the CZ profile have a slight positive Ce anomaly (1.08–1.34). The Ce anomaly in the CY profile ranges from 0.82 to 1.30 with a positive Ce anomaly in the upper part of the profile and a negative anomaly in the lower part.
Compared with the Sr content in the bedrock, the Sr content in the soil samples has been significantly reduced. The Sr content (42.3–69.1) of the PB profile is less than that of the limestone profiles CY (83.5–100) and CZ (94.1–105). The Rb/Sr ratios of the three profiles are 1.28–2.21, 1.59–2.14, and 1.18–1.50, respectively. Rb/Sr ratios increase from the bedrock to the rock-soil interface, and then slightly decreases from the bottom to the top of the profiles. The variation of 87Sr/86Sr in the profiles is similar to that of Rb/Sr. The highest 87Sr/86Sr is in the CY profile range from 0.7141 to 0.7281, whereas the ranges for PB and CZ profiles are 0.7176–0.7279 and 0.7168–0.7194, respectively.

4. Discussion

4.1. Major and Rare Earth Elements Indicate Chemical Weathering of Dolomite and Limestone

Chemical weathering is a process in which primary minerals are dissolved or transformed into other minerals and plays an important role in the process of soil formation. As a commonly used weathering indicator, CIA can directly reflect the degree of soil weathering [12,14]. It is generally believed that when 50 < CIA < 65 is reflected, the primary chemical weathering occurs under cold and dry climate conditions; when 65 < CIA < 85, it indicated intermediate weathering under warm and humid conditions; when CIA > 85, it is expressed as strong weathering under hot and rainy climate conditions [15]. The CIA value of the dolomite profile PB is higher than the limestone profiles. The CIA values of the soil samples in CY and CZ profiles are between 75–85, indicating that they have experienced relatively strong weathering, whereas the CIA values of almost all samples in the dolomite profile PB are > 90, indicating that they have experienced strong chemical weathering and leaching processes. These processes lead to large consumption of CaO, Na2O, K2O, and other soluble components in the study area.
A-CN-K (Al2O3-CaO* + Na2O-K2O) ternary diagram is usually used to study the weathering process, reflecting the changes of major elements and minerals, and indicating the trend of chemical weathering [42,43]. In the A-CN-K diagram (Figure 4), the bedrock is close to the CN apex and soil samples are close to the A-K line, and they gradually close to the A apex from the lower part to the upper part along with the profiles. CaO and Na2O in the bedrock are lost rapidly after the beginning of dissolution, which indicates the dissolution of feldspar minerals (plagioclase and potash feldspar) and the formation of clay minerals (illite). In the soil layer, illite further develops into kaolinite and K2O is gradually lost and Al2O3 is enriched [43]; therefore, the weathering trend reflected in the A-CN-K diagram can be divided into two stages, stage I: the dissolution of carbonate minerals and leaching of soluble elements, and stage II: the formation and alteration process of clay minerals. Although dolomite and limestone profiles both have two stages of weathering, they show different weathering trends. In the first stage of weathering, dolomite profile PB shows that the weathering trend from bedrock to rock-soil interface is closer to the A-CN line, whereas the weathering trend from rock-soil interface to soil samples is closer to the A-K line and intense weathering products such as kaolinite, chlorite, and gibbsite [44,45]. The first stage in limestone profiles CY and CZ deviates more from the A-CN line than the PB profile, and the accumulation of K-bearing minerals is more obvious. In a A-CN-K ternary diagram the soil samples of dolomite profile PB are located above the illite, corresponding to a higher CIA value > 90%, indicating that these samples have experienced strong weathering. Most of the soil samples of limestone weathering profiles are located below or close to illite (not beyond the scope of illite), and the corresponding CIA is 75–85%, indicating that the weathering of limestone soil samples has not yet reached the strong lateralization stage.
During chemical weathering, REE-containing minerals are dissolved, and REE is released into the soil and transferred through the soil solution [9,16]. The content of REE usually decreases with the increase in weathering degree [13,19]. According to the REE mass balance coefficient figure (Figure 5), both LREE and HREE in the soil samples of the PB profile have been greatly lost, and the τ is close to −1, which is consistent with the strong degree of weathering (CIA > 90). The τ of LREE and HREE in the limestone profile CY are concentrated at −0.5–0.8, indicating that the loss of REE is not as strong as that in the PB profile. Meanwhile, the REE in the CZ profile shows a slight depletion with a τ range from −0.5 to 0. All these indicate that the weathering degree of the dolomite profile is higher than that of the limestone. The behavior of the Ce element in the PB profile is different from other elements, so we calculated the Ce anomaly and showed the results in Figure 5a. There is a positive Ce anomaly in the upper part of the PB profile, δCe = 1.5–1.8 (PB-3-PB-8), the strong positive anomaly does not appear in the limestone profiles, and the Ce anomaly in the CY and CZ profiles is not obvious.
Therefore, dolomite may have a faster weathering rate than limestone. The soil from the dolomite profile has experienced more intense weathering and is in the intense lateralization stage. In contrast, the limestone profiles have a lower degree of chemical weathering and lateralization.

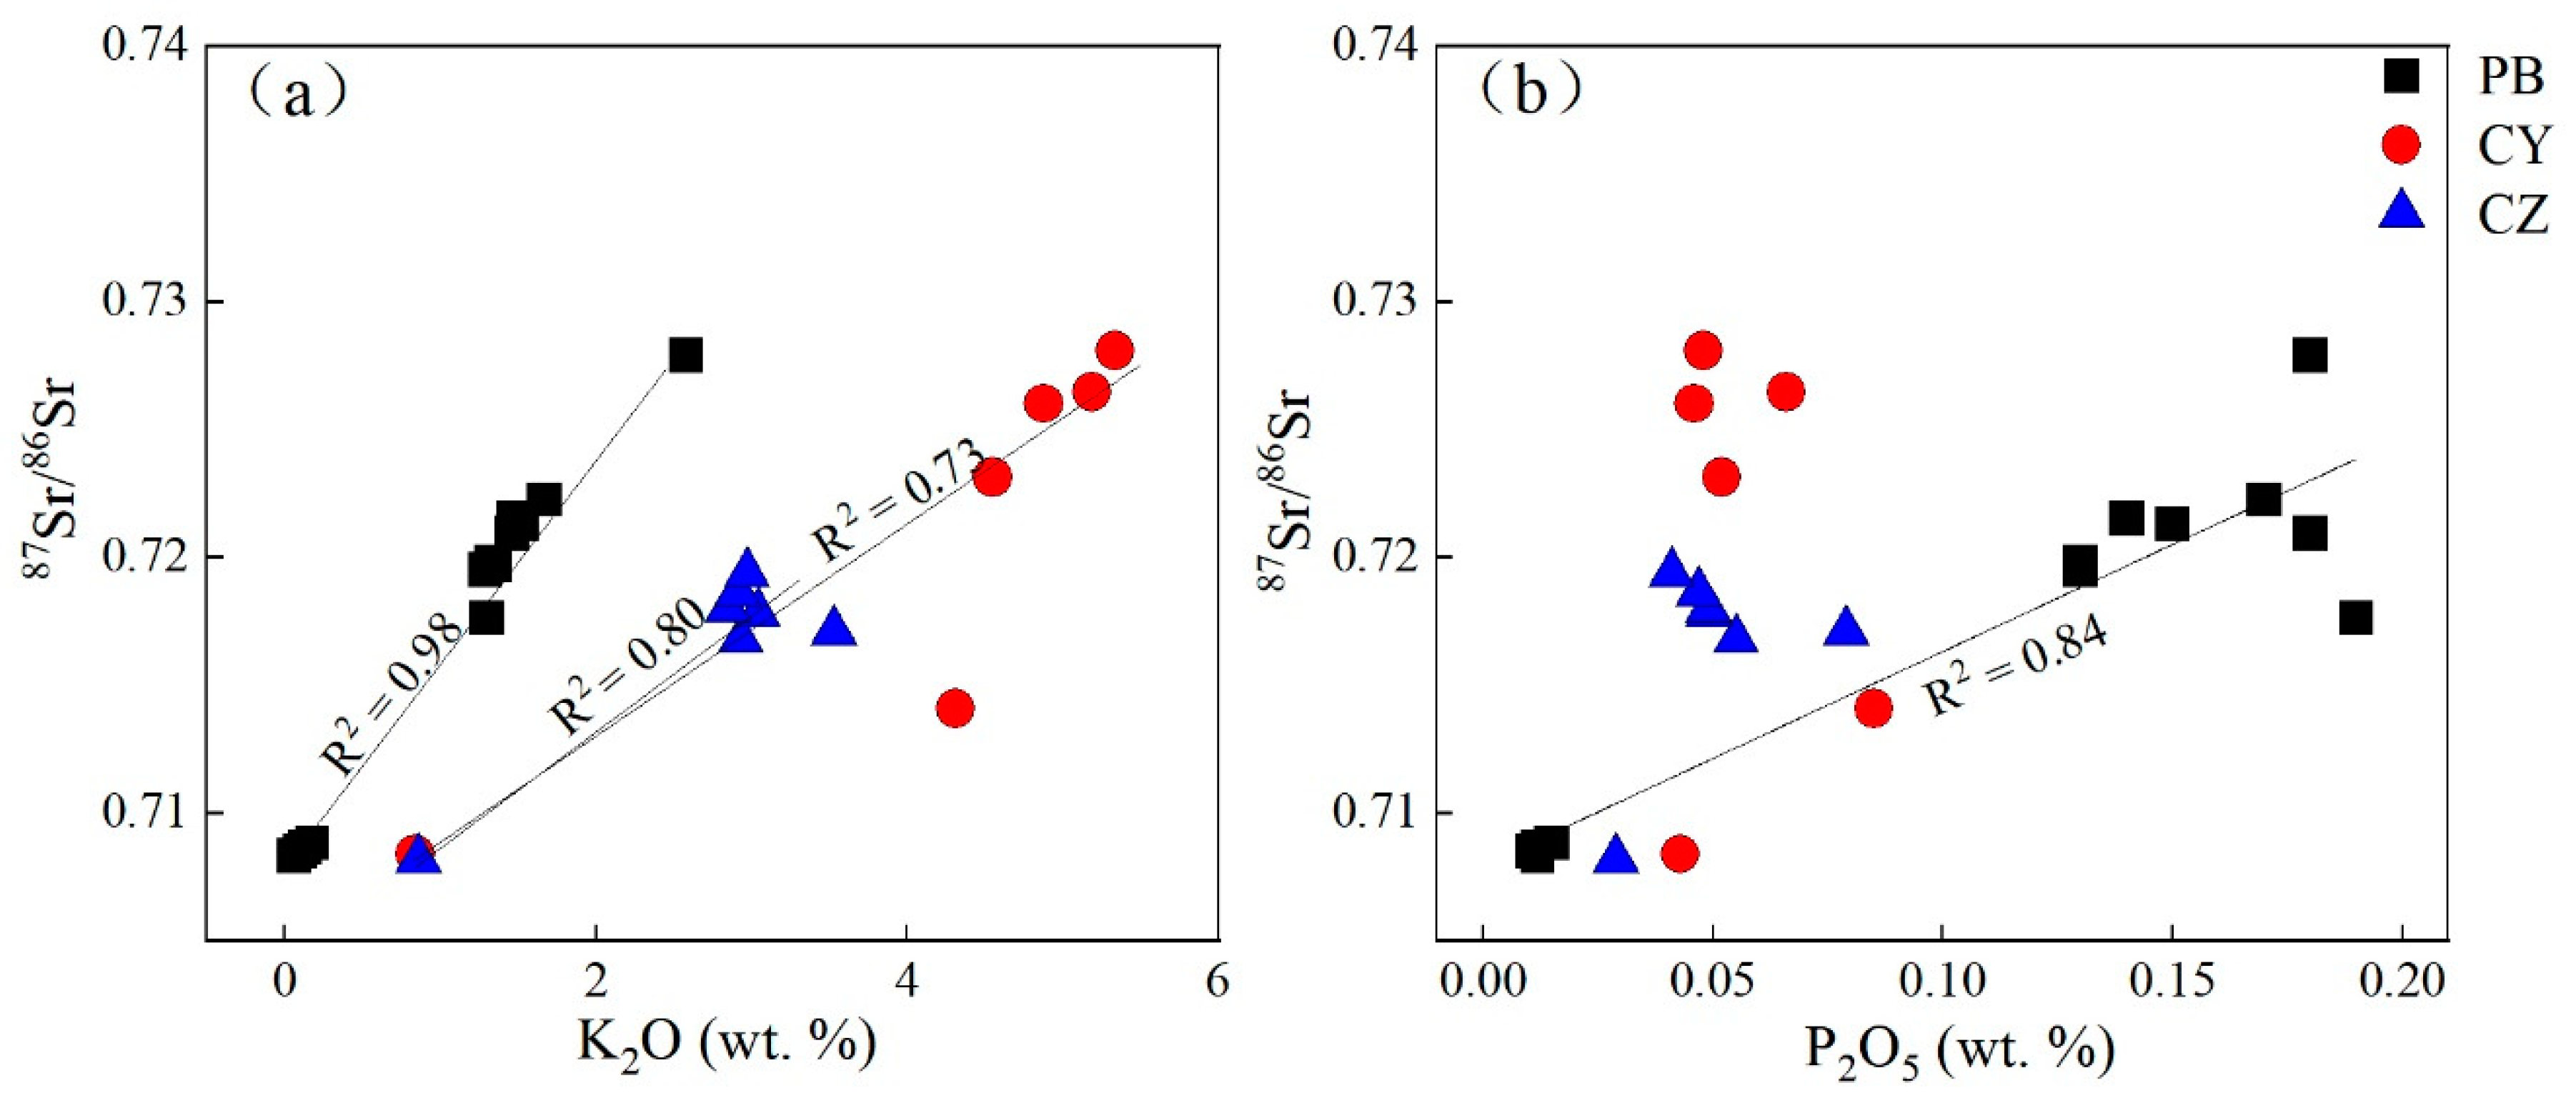
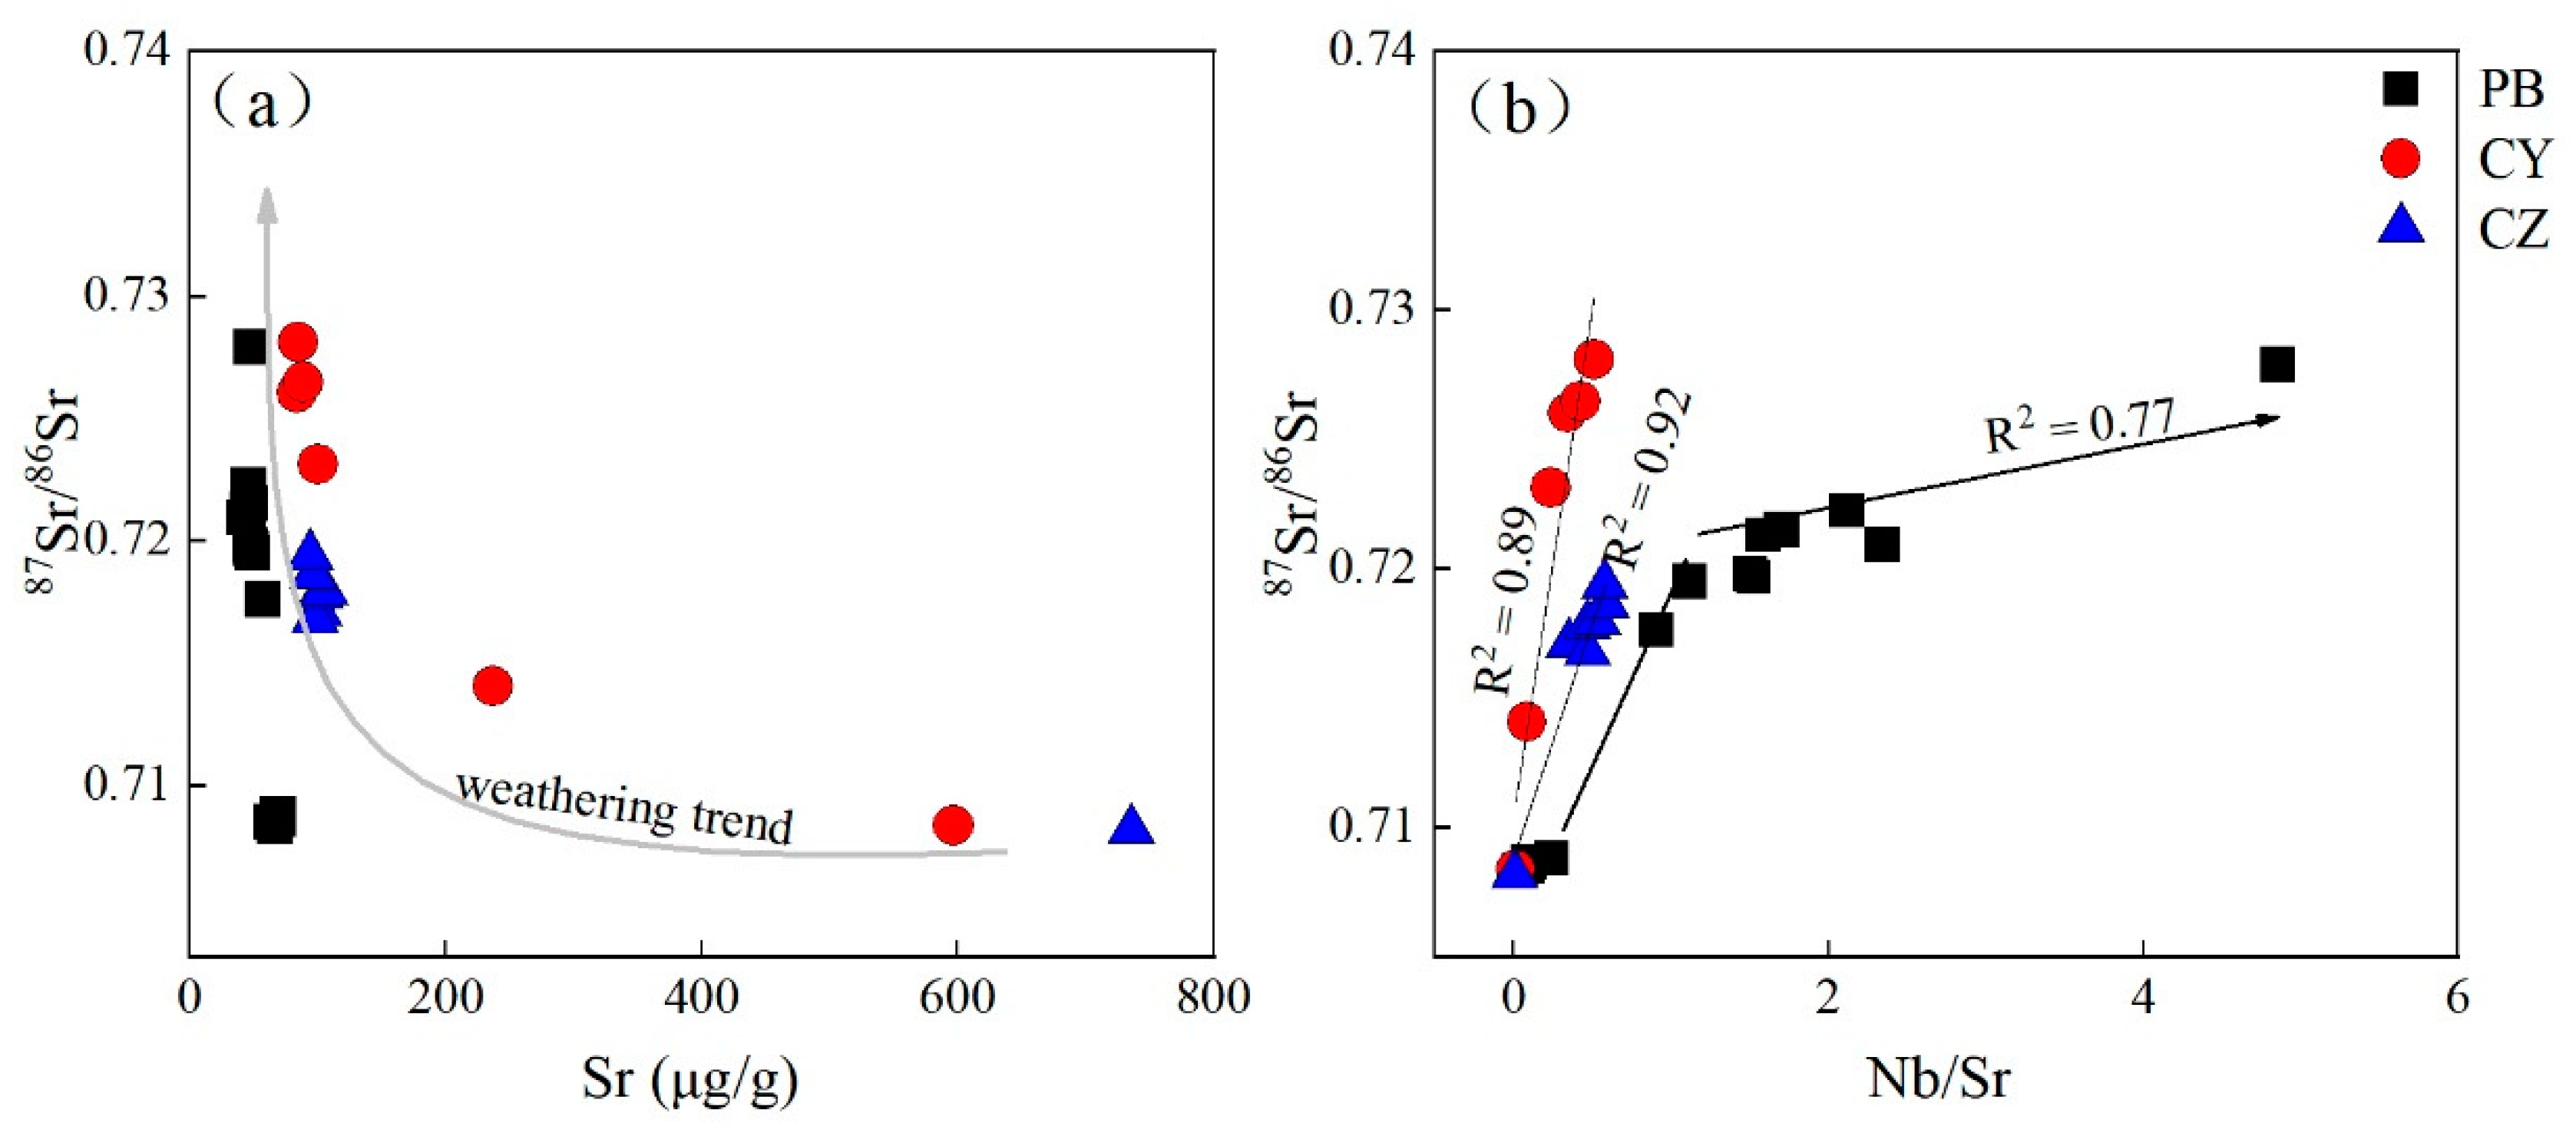
4.2. 87Sr/86Sr Indication of the Weathering Process

4.2.1. Influencing Factors of 87Sr/86Sr during Soil Chemical Weathering Process

Sr isotopes are rarely affected by near-surface chemical, physical, and biological processes [44,45]; however, the weathering and decomposition of Sr-containing minerals may cause changes in the Sr isotopic composition [46,47,48,49]. The soil has three soluble reservoirs of Sr: carbonate minerals, clay minerals that adsorbed exchangeable strontium, and phosphorus minerals formed during diagenesis [50,51,52]. In the hot and humid subtropical climate of the Guizhou Province, the weathering profile contains few carbonate minerals, so the latter two are the main reservoirs of Sr in the study profiles. The 87Sr/86Sr ratios of the three profiles increase sharply from the rock-soil interface to the soil, then decrease upwards in the soil layer with an increasing weathering degree (Figure 2). This decrease is particularly obvious in the CY profile. The ratios of Rb/Sr and 87Sr/86Sr both gradually decrease upwards, which is contrary to the increase of Rb/Sr and 87Sr/86Sr in the granitic weathering profiles. This may be due to the existence of a large number of clay minerals that can absorb exchangeable Sr [32,53].
In the A-CN-K ternary diagram (Figure 4), the soil sample of the limestone profile falls in the area of illite, indicating that the main clay minerals in soil are illite and kaolinite formations. Illite is often regarded as a factor that affects the change of 87Sr/86Sr [31,35]. As a soluble element, the content of K2O in the laterite profile is closely related to the decomposition and formation of K-containing minerals such as K-feldspar and illite [23,53]. The K2O element content in the limestone profiles CY and CZ decreases with depth, which is caused by the gradual decomposition of illite due to the increase in weathering intensity. Due to the ionic radius of Rb being similar to that of K and the electricity valence being equal, K-containing minerals are usually rich in Rb. 87Sr is derived from 87Rb through β decay, so K-containing minerals usually have a higher 87Sr/86Sr [48]. In the soil layer, illite decomposes, resulting in 87Sr/86Sr becoming smaller. The good positive correlation between the K element and 87Sr/86Sr also indicates weathering, and the decomposition of illite controls the 87Sr/86Sr composition of the profile (Figure 6a).
The content of K in the dolomite profile PB is very low, and soil samples that fall in the A-CN-K ternary diagram are above the illite, indicating that the main clay mineral in the soil is kaolinite, so there may be other factors affecting 87Sr/86Sr.
The PB profile is a typical carbonate weathering profile. It can be seen that CaO has a good correlation with 87Sr/86Sr (Figure 6b); however, in the strong weathering and leaching environment, the carbonate rocks are leached and decomposed, and the CaO-containing mineral may not be carbonate rock but apatite [31]. The consistency of the Ce anomaly and P2O5 content change (Figure 5), and the high P2O5 content in the PB profile, indicates the possibility of apatite, and previous studies on Guangxi red soil also proved that the presence of apatite may be affected 87Sr/86Sr. We analyzed the correlation between P2O5 and 87Sr/86Sr and found that only P2O5 and 87Sr/86Sr in the PB profile have a good correlation, which proves that apatite is also a factor that affects the Sr isotope in the PB profile (Figure 6).

4.2.2. Significance of 87Sr/86Sr for Evaluating the Soil Chemical Weathering Process

The Sr isotopic composition of the bedrock samples and the soil samples are different. The bedrock contains Sr in the main minerals, dolomite/calcite, which are dissolved during the weathering process, resulting in Sr leaching, which is the significant difference between soil and bedrock [26,54]. The Sr content and 87Sr/86Sr present two weathering steps during the weathering process of carbonate rocks (Figure 7). From the bedrock to the soil–rock interface, the Sr content decreases significantly and the 87Sr/86Sr ratios increase significantly; from the rock–soil interface to the soil samples, the Sr content changes a little, and 87Sr/86Sr increases moderately. It shows that the weathering process of carbonate rocks can be divided into two stages: Stage I represents the leaching process of carbonate minerals, and Stage II represents the weathering process of saprolite (Figure 7a). This may be related to two different sources of Sr in carbonate rocks. One is carbonate minerals with high Sr content and low 87Sr/86Sr, and the other is silicate minerals with low Sr content and high 87Sr/86Sr [34]. Carbonate rocks are more easily decomposed during the weathering process, so 87Sr/86Sr from the bedrock to the soil will suddenly increase.
Niobium (Nb) is a stable element and has almost no migration during weathering [55,56,57]; therefore, the concentration of Nb in the soil solution is very low, and the Nb/Sr ratio is close to zero. As the degree of weathering increases, the Nb concentration and Nb/Sr ratio in the soil are expected to increase [34]. For this reason, 87Sr/86Sr vs. Nb/Sr diagrams are commonly used to assess Sr endmembers and reveal the evolution of weathering profiles. There is a strong correlation between Nb/Sr and 87Sr/86Sr in the limestone profile CY and CZ (R2 = 0.89, 0.92), showing a trend that Nb/Sr and 87Sr/86Sr increase with the weathering (Figure 7b). Nb/Sr and 87Sr/86Sr increase rapidly from bedrock to rock–soil interface, but the changes to the soil layer are not obvious. The dolomite profile PB has obvious two-stage weathering trends. Fresh carbonate bedrock has a relatively low 87Sr/86Sr ratio and high Sr content. It is preferentially weathered under warm and humid conditions [35]; therefore, clastic silicate minerals end members with a higher 87Sr/86Sr ratio to control the Sr isotopic composition of saprolite. In the first stage from the bedrock to the rock–soil interface, the 87Sr/86Sr ratio increased and the Sr content decreased (Nb/Sr increased) (Figure 7b). As dolomite contains more clastic impurities (silicates), the degree of Sr accumulation in the dolomite rock–soil interface after the bedrock dissolves is higher than that of the limestone profile. In the second stage, carbonate is depleted (CaO concentration is usually < 0.5 wt.%), and silicate components constitute the main body of the weathering layer. In this process, silicate minerals are affected by long-term strong weathering and transform into more stable minerals, such as kaolinite and gibbsite [44,55]. The exchangeable Sr existing in the silicate minerals is partially leached; therefore, the Sr and 87Sr/86Sr in the soil are reduced compared with the bedrock. Dolomite contains more silicate minerals and has experienced more intense weathering. Sr leaching is stronger than that in limestone soil samples, resulting in lower Sr content in the dolomite profile.

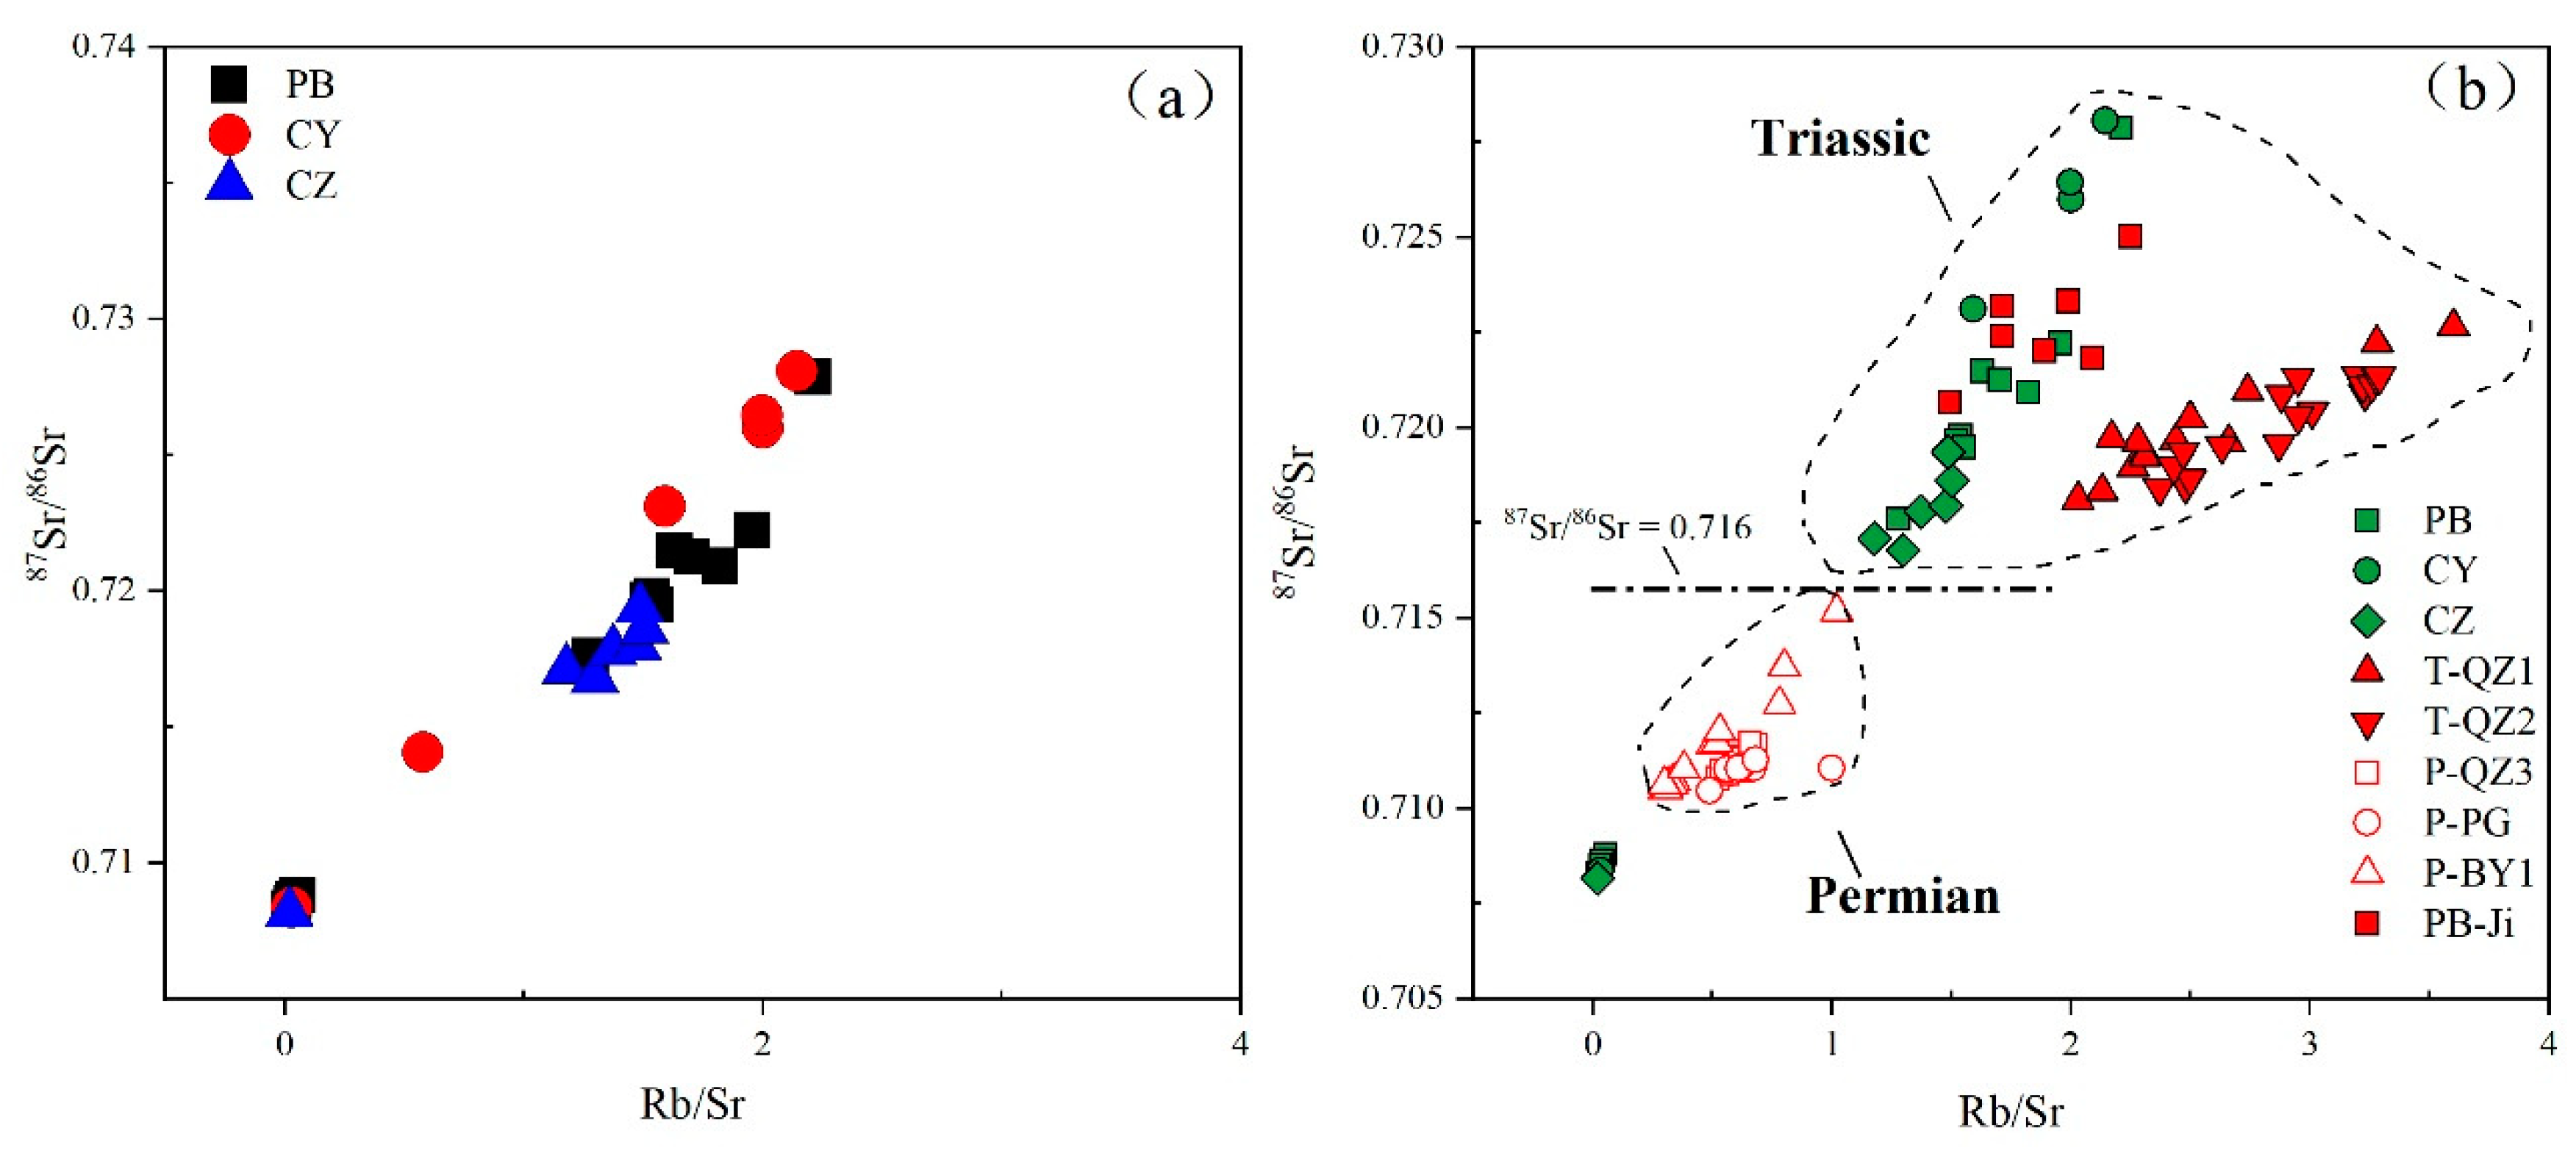
4.3. 87Sr/86Sr Indication of Material Source of Soil Overlying Carbonate Rock

For a long time, the material source of laterite overlying carbonate rock has been controversial. They may have multiple origins, such as aeolian, and they may develop from clastic rock or in-situ weathering of carbonate rock. In SW China, some studies have also proposed the possibility that the overlying red soil comes from Chinese loess or Emeishan basalt; however, in our research, it is difficult to find evidence to support this hypothesis.
In the chondrite-normalized REE pattern, except for the strong Ce anomaly in the PB profile, the patterns of REE in the soil samples of the three profiles are very similar to the patterns in the respective bedrock samples, showing a trend of tilting to the right. This means that LREE are relatively enriched in HREE. This similarity indicates that the soil samples have a good inheritance from the bedrock and it supports the hypothesis of the homology relationship between the carbonate rock and the overlying weathered soil.
In the open superficial environment, Rb-containing minerals (mainly mica and potassium feldspar) are more resistant to decomposition than Ca (and Sr)-containing minerals (mainly feldspar and calcite) [24,58]. Due to different weathering rates of different minerals, the weathering process usually leads to changes in Rb and Sr concentrations and leaching rates of radioactive and non-radioactive Sr [25,29,59,60]. Generally, minerals with a high Rb/Sr ratio have good weather resistance and a high 87Sr/86Sr ratio; therefore, the ratios of Rb/Sr and 87Sr/86Sr of soil profile samples increase with the increase of weathering intensity. The Rb/Sr and 87Sr/86Sr ratios of the study profiles are significantly positively correlated (Figure 8a). The strong linear relationship indicates that the radiogenic 87Sr is mainly derived from 87Rb decay, and the weathering decomposition of Rb-containing minerals leads to the loss of Rb and radiogenic 87Sr/86Sr from the weathering system, whereas the contribution of the heterogeneous is very limited. Compared with profiles PB and CZ, the ratios of Rb/Sr and 87Sr/86Sr in profile CY are higher, which may be due to the weaker weathering degree and residual minerals with a high Rb/Sr ratio.
The study profile was compared with some similar lateritic weathering profiles in the Guizhou and Guangxi Provinces (Figure 8b). All of the data comes from published reports [18,34,35]. Some previous studies and our PB profile are in the same area (a distance of more than 10 km), with the same climate and similar stratigraphic age. Although these profiles and our profiles have similar ranges of Rb/Sr and 87Sr/86Sr ratios, their slopes and intercepts are not the same, indicating that their material sources are not a uniform aeolian material source, but should be evolved from the underlying bedrock.
In Figure 8b, we found that soil samples from Triassic and Permian bedrocks have different distribution ranges. The soils overlying the Permian bedrock have lower Rb/Sr and 87Sr/86Sr ratios while those overlying the Triassic bedrock have higher Rb/Sr and 87Sr/86Sr ratios, bounded by 87Sr/86Sr = 0.716. This difference may be due to the change of continental debris source in the South China Sedimentary Basin during the Permian to Triassic period [35]. The changes in the sources of these continents may be related to plate tectonics; therefore, the Sr isotope records in red soil may provide evidence for the movement of the South China block in the Late Paleozoic.

5. Conclusions

This study assessed the Sr isotope composition and weathering processes of the carbonate rock (dolomite and limestone) weathering crust. The weathering degree of the dolomite weathering profile PB was higher than that of the limestone weathering profiles CZ and CY. A-CN-K ternary suggested the main clay mineral in the CZ and CY profiles is illite, and the clay minerals in the PB profile are changing to gibbsite and kaolin. The mineral composition had a significant impact on the Sr isotopic characteristics. The decomposition of illite and apatite in the carbonate rock profiles could affect the Sr isotopic composition in soils. Two stages existed in the weathering process of the carbonate rock profiles. In the first stage, the Sr content decreased and 87Sr/86Sr slightly increased due to the carbonate minerals rapidly dissolving from the bedrock to the rock–soil interface. In the second stage, the main body of the weathering process from the rock–soil interface to the soil layer is composed of clastic silicate minerals, which resulted in the Sr content slightly decreasing and 87Sr/86Sr increasing significantly. The ratios of Rb/Sr and 87Sr/86Sr divided the soil profiles into different groups, indicating that their parent materials are different and the possibility of exogenous soil origin (aeolian) of the region is very low; therefore, the red soil overlying the carbonate rock is more likely to be developed from the underlying bedrock.

Author Contributions

Conceptualization, C.C.; Formal analysis, C.C.; Funding acquisition, H.J.; Writing—Original Draft, C.C.; Writing—Review and Editing, C.C., H.J. and H.O.B.; Supervision, H.J. All authors have read and agreed to the published version of the manuscript.

Funding

This work was supported by the National Natural Science Foundation of China (NSFC) grants (41473122, 41073096), the National Key Basic Research Program of China (2013CB956702) and the Hundred Talents Program of the Chinese Academy of Sciences.

Data Availability Statement

The data is available on request from the corresponding author.

Conflicts of Interest

The authors declare no conflict of interest.

References

  1. Nesbitt, H.W. Mobility and fractionation of rare earth elements during weathering of a granodiorite. Nature 1979, 279, 206. [Google Scholar] [CrossRef]
  2. Braun, J.-J.; Pagel, M.; Herbilln, A.; Rosin, C. Mobilization and redistribution of REEs and thorium in a syenitic lateritic profile: A mass balance study. Geochim. Et Cosmochim. Acta 1993, 57, 4419–4434. [Google Scholar] [CrossRef]
  3. Scarciglia, F.; Le Pera, E.; Critelli, S. Weathering and pedogenesis in the Sila Grande Massif (Calabria, South Italy): From field scale to micromorphology. Catena 2005, 61, 1–29. [Google Scholar] [CrossRef]
  4. Laveuf, C.; Cornu, S. A review on the potentiality of Rare Earth Elements to trace pedogenetic processes. Geoderma 2009, 154, 1–12. [Google Scholar] [CrossRef]
  5. Séquaris, J.-M.; Klumpp, E.; Vereecken, H. Colloidal properties and potential release of water-dispersible colloids in an agricultural soil depth profile. Geoderma 2013, 193–194, 94–101. [Google Scholar] [CrossRef]
  6. Wei, X.; Ji, H.; Wang, S.; Chu, H.; Song, C. The formation of representative lateritic weathering covers in south-central Guangxi (southern China). Catena 2014, 118, 55–72. [Google Scholar] [CrossRef]
  7. da Silva, Y.J.A.B.; do Nascimento, C.W.A.; Biondi, C.M.; van Straaten, P.; de Souza Júnior, V.S.; da Silva, Y.J.A.B.; dos Santos, C.A.; do Carmo Trezena de Araújo, J. Influence of metaluminous granite mineralogy on the rare earth element geochemistry of rocks and soils along a climosequence in Brazil. Geoderma 2017, 306, 28–39. [Google Scholar] [CrossRef]
  8. Teng, F.-Z.; Hu, Y.; Ma, J.-L.; Wei, G.-J.; Rudnick, R.L. Potassium isotope fractionation during continental weathering and implications for global K isotopic balance. Geochim. Et Cosmochim. Acta 2020, 278, 261–271. [Google Scholar] [CrossRef]
  9. Mihajlovic, J.; Stärk, H.-J.; Rinklebe, J. Geochemical fractions of rare earth elements in two floodplain soil profiles at the Wupper River, Germany. Geoderma 2014, 228–229, 160–172. [Google Scholar] [CrossRef]
  10. Bickle, M.J.; Chapman, H.J.; Tipper, E.; Galy, A.; De La Rocha, C.L.; Ahmad, T. Chemical weathering outputs from the flood plain of the Ganga. Geochim. Et Cosmochim. Acta 2018, 225, 146–175. [Google Scholar] [CrossRef]
  11. Derakhshan-Babaei, F.; Nosrati, K.; Tikhomirov, D.; Christl, M.; Sadough, H.; Egli, M. Relating the spatial variability of chemical weathering and erosion to geological and topographical zones. Geomorphology 2020, 363, 107235. [Google Scholar] [CrossRef]
  12. Song, C.; Ji, H.; Beckford, H.O.; Chang, C.; Wang, S. Assessment of chemical weathering and physical erosion along a hillslope, southwest China. Catena 2019, 182, 104133. [Google Scholar] [CrossRef]
  13. Chang, C.; Song, C.; Beckford, H.O.; Wang, S.; Ji, H. Behaviors of REEs during pedogenetic processes in the karst areas of Southwest China. J. Asian Earth Sci. 2019, 185, 104023. [Google Scholar] [CrossRef]
  14. Ji, H.; Chang, C.; Beckford, H.O.; Song, C.; Blake, R.E. New perspectives on lateritic weathering process over karst area—Geochemistry and Si-Li isotopic evidence. Catena 2021, 198, 105022. [Google Scholar] [CrossRef]
  15. Meunier, A.; Caner, L.; Hubert, F.; El Albani, A.; Prêt, D. The weathering intensity scale (WIS): An alternative approach of the Chemical Index of Alteration (CIA). Am. J. Sci. 2013, 313, 113–143. [Google Scholar] [CrossRef]
  16. Braun, J.J.; Riotte, J.; Battacharya, S.; Violette, A.; Oliva, P.; Prunier, J.; Maréchal, J.C.; Ruiz, L.; Audry, S.; Subramanian, S. REY-Th-U Dynamics in the Critical Zone: Combined Influence of Reactive Bedrock Accessory Minerals, Authigenic Phases, and Hydrological Sorting (Mule Hole Watershed, South India). Geochem. Geophys. Geosystems 2018, 19, 1611–1635. [Google Scholar] [CrossRef]
  17. Deng, Y.; Wang, S.; Bai, X.; Luo, G.; Wu, L.; Chen, F.; Wang, J.; Li, Q.; Li, C.; Yang, Y.; et al. Spatiotemporal dynamics of soil moisture in the karst areas of China based on reanalysis and observations data. J. Hydrol. 2020, 585, 124744. [Google Scholar] [CrossRef]
  18. Ji, H.; Wang, S.; Ouyang, Z.; Zhang, S.; Sun, C.; Liu, X.; Zhou, D. Geochemistry of red residua underlying dolomites in karst terrains of Yunnan-Guizhou Plateau. Chem. Geol. 2004, 203, 29–50. [Google Scholar] [CrossRef]
  19. Braun, J.J.; Riotte, J.; Battacharya, S.; Violette, A.; Prunier, J.; Bouvier, V.; Candaudap, F.; Maréchal, J.C.; Ruiz, L.; Panda, S.R.; et al. REY-Th-U Solute Dynamics in the Critical Zone: Combined Influence of Chemical Weathering, Atmospheric Deposit Leaching, and Vegetation Cycling (Mule Hole Watershed, South India). Geochem. Geophys. Geosystems 2017, 18, 4409–4425. [Google Scholar] [CrossRef]
  20. Bain, D.C.; Bacon, J.R. Strontium isotopes as indicators of mineral weathering in catchments—ScienceDirect. Catena 1994, 22, 201–214. [Google Scholar] [CrossRef]
  21. Hogan, J.F.; Blum, J.D.; Siegel, D.I.; Glaser, P.H. 87Sr/86Sr as a tracer of groundwater discharge and precipitation recharge in the Glacial Lake Agassiz Peatlands, northern Minnesota. Water Resour. Res. 2000, 36, 3701–3710. [Google Scholar] [CrossRef]
  22. Pett-Ridge, J.C.; Derry, L.A.; Kurtz, A.C. Sr isotopes as a tracer of weathering processes and dust inputs in a tropical granitoid watershed, Luquillo Mountains, Puerto Rico. Geochim. Et Cosmochim. Acta 2009, 73, 25–43. [Google Scholar] [CrossRef]
  23. Santoni, S.; Huneau, F.; Garel, E.; Aquilina, L.; Vergnaud-Ayraud, V.; Labasque, T.; Celle-Jeanton, H. Strontium isotopes as tracers of water-rocks interactions, mixing processes and residence time indicator of groundwater within the granite-carbonate coastal aquifer of Bonifacio (Corsica, France). Sci. Total Environ. 2016, 573, 233–246. [Google Scholar] [CrossRef] [PubMed]
  24. Land, M.; Ingri, J.; Andersson, P.S.; Öhlander, B. Ba/Sr, Ca/Sr and 87 Sr/86Sr ratios in soil water and groundwater : Implications for relative contributions to stream water discharge. Appl. Geochem. 2000, 15, 311–325. [Google Scholar] [CrossRef]
  25. Klaus, J.; Hansen, B.; Buapeng, S. 87Sr/86Sr ratio: A natural tracer to monitor groundwater flow paths during artificial recharge in the Bangkok area, Thailand. Hydrogeol. J. 2007, 15, 745–758. [Google Scholar] [CrossRef]
  26. Charlier, B.L.A.; Nowell, G.M.; Parkinson, I.J.; Kelley, S.P.; Pearson, D.G.; Burton, K.W. High temperature strontium stable isotope behaviour in the early solar system and planetary bodies. Earth Planet. Sci. Lett. 2012, 329-330, 31–40. [Google Scholar] [CrossRef]
  27. Hartman, G.; Richards, M. Mapping and defining sources of variability in bioavailable strontium isotope ratios in the Eastern Mediterranean. Geochim. Et Cosmochim. Acta 2014, 126, 250–264. [Google Scholar] [CrossRef]
  28. Pett-Ridge, J.C.; Derry, L.A.; Barrows, J.K. Ca/Sr and 87Sr/86Sr ratios as tracers of Ca and Sr cycling in the Rio Icacos watershed, Luquillo Mountains, Puerto Rico. Chem. Geol. 2009, 267, 32–45. [Google Scholar] [CrossRef]
  29. Yang, Y.-H.; Wu, F.-Y.; Yang, J.-H.; Chew, D.M.; Xie, L.-W.; Chu, Z.-Y.; Zhang, Y.-B.; Huang, C. Sr and Nd isotopic compositions of apatite reference materials used in U–Th–Pb geochronology. Chem. Geol. 2014, 385, 35–55. [Google Scholar] [CrossRef]
  30. Hissler, C.; Stille, P.; Juilleret, J.; Iffly, J.F.; Perrone, T.; Morvan, G. Elucidating the formation of terra fuscas using Sr–Nd–Pb isotopes and rare earth elements. Appl. Geochem. 2015, 54, 85–99. [Google Scholar] [CrossRef]
  31. Salifu, M.; Aiglsperger, T.; Hällström, L.; Martinsson, O.; Billström, K.; Ingri, J.; Dold, B.; Alakangas, L. Strontium (87Sr/86Sr) isotopes: A tracer for geochemical processes in mineralogically-complex mine wastes. Appl. Geochem. 2018, 99, 42–54. [Google Scholar] [CrossRef]
  32. Wang, X.; Tang, Z. The first large-scale bioavailable Sr isotope map of China and its implication for provenance studies. Earth-Sci. Rev. 2020, 210, 103353. [Google Scholar] [CrossRef]
  33. Krabbenhöft, A.; Eisenhauer, A.; Böhm, F.; Vollstaedt, H.; Fietzke, J.; Liebetrau, V.; Augustin, N.; Peucker-Ehrenbrink, B.; Müller, M.N.; Horn, C.; et al. Constraining the marine strontium budget with natural strontium isotope fractionations (87Sr/86Sr∗, δ88/86Sr) of carbonates, hydrothermal solutions and river waters. Geochim. Et Cosmochim. Acta 2010, 74, 4097–4109. [Google Scholar] [CrossRef]
  34. Liu, W.-J.; Liu, C.-Q.; Zhao, Z.-Q.; Xu, Z.-F.; Liang, C.-S.; Li, L.-b.; Feng, J.-Y. Elemental and strontium isotopic geochemistry of the soil profiles developed on limestone and sandstone in karstic terrain on Yunnan-Guizhou Plateau, China: Implications for chemical weathering and parent materials. J. Asian Earth Sci. 2013, 67–68, 138–152. [Google Scholar] [CrossRef]
  35. Wei, X.; Wang, S.; Ji, H.; Shi, Z. Strontium isotopes reveal weathering processes in lateritic covers in southern China with implications for paleogeographic reconstructions. PLoS ONE 2018, 13, e0191780. [Google Scholar] [CrossRef] [Green Version]
  36. Peng, T.; Wang, S.-j. Effects of land use, land cover and rainfall regimes on the surface runoff and soil loss on karst slopes in southwest China. Catena 2012, 90, 53–62. [Google Scholar] [CrossRef]
  37. GB/T 14506.28-2010; Methods for Chemical Analysis of Silicate Rocks—Part 28: Determination of 16 Major and Minor Elements Content. National Standardization Technical Committee of Land and Resources: Beijing, China, 2011.
  38. GB/T 14506.30-2010; Methods for Chemical Analysis of Silicate Rocks—Part 30: Determination of 44 Elements. National Standardization Technical Committee of Land and Resources: Beijing, China, 2011.
  39. Nesbitt, H.W.; Markovics, G. Chemical processes affecting alkalis and alkaline earths during continental weathering. Geochim. Et Cosmochim. Acta 1980, 44, 1659–1666. [Google Scholar] [CrossRef]
  40. Nesbitt, H.W.; Young, G.M. Early Proterozoic climates and plate motions inferred from major element chemistry of lutites. Nature 1982, 299, 715–717. [Google Scholar] [CrossRef]
  41. Condie, K.C. Chemical composition and evolution of the upper continental crust: Contrasting results from surface samples and shales. Chem. Geol. 1993, 104, 1–37. [Google Scholar] [CrossRef]
  42. Chen, Y.; Li, X.; Han, Z.; Yang, S.; Wang, Y.; Yang, D. Chemical weathering intensity and element migration features of the Xiashu loess profile in Zhenjiang, Jiangsu Province. J. Geogr. Sci. 2008, 18, 341–352. [Google Scholar] [CrossRef]
  43. Bau, M.; Dulski, P. Comparative study of yttrium and rare-earth element behaviours in fluorine-rich hydrothermal fluids. Contrib. Mineral. Petrol. 1995, 119, 213–223. [Google Scholar] [CrossRef]
  44. McLennan, S.M.; Hemming, S.; McDaniel, D.K.; Hanson, G.N. Geochemical approaches to sedimentation, provenance, and tectonics. Processes Control. Compos. Clastic Sediments 1993, 284, 21. [Google Scholar]
  45. McLennan, S.; Hemming, S.; Taylor, S.; Eriksson, K. Early Proterozoic crustal evolution: Geochemical and NdPb isotopic evidence from metasedimentary rocks, southwestern North America. Geochim. Et Cosmochim. Acta 1995, 59, 1153–1177. [Google Scholar] [CrossRef]
  46. Chung, C.-H.; You, C.-F.; Chu, H.-Y. Weathering sources in the Gaoping (Kaoping) river catchments, southwestern Taiwan: Insights from major elements, Sr isotopes, and rare earth elements. J. Mar. Syst. 2009, 76, 433–443. [Google Scholar] [CrossRef]
  47. Raiber, M.; Webb, J.A.; Bennetts, D.A. Strontium isotopes as tracers to delineate aquifer interactions and the influence of rainfall in the basalt plains of southeastern Australia. J. Hydrol. 2009, 367, 188–199. [Google Scholar] [CrossRef]
  48. Hindshaw, R.S.; Rickli, J.; Leuthold, J.; Wadham, J.; Bourdon, B. Identifying weathering sources and processes in an outlet glacier of the Greenland Ice Sheet using Ca and Sr isotope ratios. Geochim. Et Cosmochim. Acta 2014, 15, 50–71. [Google Scholar] [CrossRef]
  49. Wiederhold, J.G. Metal stable isotope signatures as tracers in environmental geochemistry. Environ. Sci. Technol. 2015, 49, 2606–2624. [Google Scholar] [CrossRef]
  50. Jones, C.E.; Jenkyns, H.C.; Coe, A.L.; Stephen, H.P. Strontium isotopic variations in Jurassic and Cretaceous seawater. Geochim. Et Cosmochim. Acta 1994, 58, 3061–3074. [Google Scholar] [CrossRef]
  51. Jiang, Y.; Ji, H. Sr fluxes and 87Sr/86Sr characterization of river waters from a karstic versus granitic watershed in the Yangtze River. J. Geochem. Explor. 2011, 110, 202–215. [Google Scholar] [CrossRef]
  52. Négrel, P.; Petelet-Giraud, E.; Guerrot, C.; Millot, R. Ca and Sr isotope constraints on chemical weathering processes: A view through the Ebro river basin, Spain. Chem. Geol. 2021, 578, 120324. [Google Scholar] [CrossRef]
  53. Dubinin, A.V.; Uspenskaya, T.Y.; Rimskaya-Korsakova, M.N.; Demidova, T.P. Rare elements and Nd and Sr isotopic composition in micronodules from the Brazil Basin, Atlantic Ocean. Lithol. Miner. Resour. 2017, 52, 81–101. [Google Scholar] [CrossRef]
  54. Williamson, T.; Henderson, R.A.; Price, G.D.; Collerson, K.D. Strontium–isotope stratigraphy of the Lower Cretaceous of Australia. Cretac. Res. 2012, 36, 24–36. [Google Scholar] [CrossRef]
  55. Erel, Y.; Blum, J.D.; Roueff, E.; Ganor, J. Lead and strontium isotopes as monitors of experimental granitoid mineral dissolution. Geochim. Et Cosmochim. Acta 2004, 68, 4649–4663. [Google Scholar] [CrossRef]
  56. Chabaux, F.; Riotte, J.; Schmitt, A.-D.; Carignan, J.; Herckes, P.; Pierret, M.-C.; Wortham, H. Variations of U and Sr isotope ratios in Alsace and Luxembourg rain waters: Origin and hydrogeochemical implications. Comptes Rendus Geosci. 2005, 337, 1447–1456. [Google Scholar] [CrossRef]
  57. Drouet, T.; Herbauts, J.; Gruber, W.; Demaiffe, D. Strontium isotope composition as a tracer of calcium sources in two forest ecosystems in Belgium. Geoderma 2005, 126, 203–223. [Google Scholar] [CrossRef]
  58. Whipkey, C.E.; Capo, R.C.; Chadwick, O.A.; Stewart, B.W. The importance of sea spray to the cation budget of a coastal Hawaiian soil: A strontium isotope approach. Chem. Geol. 2000, 168, 37–48. [Google Scholar] [CrossRef]
  59. Blum, J.D.; Erel, Y. RbSr isotope systematics of a granitic soil chronosequence: The importance of biotite weathering. Geochim. Et Cosmochim. Acta 1997, 61, 3193–3204. [Google Scholar] [CrossRef]
  60. Steinmann, M.; Stille, P. Rare earth element behavior and Pb, Sr, Nd isotope systematics in a heavy metal contaminated soil. Appl. Geochem. 1997, 12, 607–623. [Google Scholar] [CrossRef]
Figure 1. Geological map of Chenqi catchment and Pingba farmland, SW China. The map is adapted from Peng and Wang [36]. Q: Quaternary deposits; T1a: sedimentary dolomite of the Anshun Formation of the Early–Middle Triassic period; T2g2-1: marl intercalated with limestone of the lower part of the middle part of the middle Guanling Formation of the Middle Triassic period; T2g2-2: limestone intercalated with marl of the middle part of the middle Guanling Formation of the Middle Triassic period; T2g2-3: limestone of the upper part of the middle Guanling Formation of the Middle Triassic period; T2g3-1: dolomite of the upper Guanling Formation of the Middle Triassic period.
Sustainability 14 04822 g001
Figure 2. Distributions of selected elements and changes of several relevant parameters along with the vertical sampling depth. (aj) represent the changes of SiO2 Al2O3, Fe2O3, Na2O, K2O, P2O5, CIA, Sr, Rb/Sr and 87Sr/86Sr with depth respectively. The unit of the major element is wt.%, and the unit of Sr is μg/g.
Sustainability 14 04822 g002
Figure 3. Chondrite-normalized REE patterns of soil samples from study profiles.
Sustainability 14 04822 g003
Figure 4. A–CN–K ternary diagram of the profiles (arrows indicating weathering trend). (b) is the part of the circle in (a).
Sustainability 14 04822 g004
Figure 5. Depth variations of τTh,REE, Ce anomaly and P2O5 content in study profiles. (ac) represent the τTh,REE, Ce anomaly and P2O5 content in PB, CY and CZ profiles.
Sustainability 14 04822 g005
Figure 6. Distributions of 87Sr/86Sr ratio with (a) K2O and (b) P2O5 in samples from the study profiles.
Sustainability 14 04822 g006
Figure 7. Distributions of 87Sr/86Sr ratio with (a) Sr content and (b) Nb/Sr ratio in samples from the study profiles.
Sustainability 14 04822 g007
Figure 8. Relationships between 87Sr/86Sr and Rb/Sr ratios. (a) Weathering profiles in the studied area. (b) Cited profiles in the Guizhou province (data of profiles PB-Ji were derived from Ji et al. [18]; data of profiles T-QZ1, T-QZ2, and P-QZ3 are from Liu et al. [34]) and the Guilin province profile data (P-PG and P-BY1 are from Wei et al. [35]).
Sustainability 14 04822 g008
Table 1. Selected major and trace element concentrations and 87Sr/86Sr ratios of bulk samples of dolomite profile PB.
PB-1PB-2PB-3PB-4PB-5PB-6PB-7PB-8PB-9PB-10PB-11PB-12PB-13
pH5.604.463.744.284.164.074.074.063.90
SiO2/%34.0530.6231.0631.4532.0732.4231.9533.1435.671.951.601.010.36
Al2O3/%26.9429.5130.1630.8529.6729.5130.5629.8028.251.100.580.380.18
Fe2O3/%15.4916.9617.0116.7117.0116.3916.3216.1114.820.240.160.150.18
MgO/%0.940.800.840.810.890.910.910.971.1918.4619.9520.3820.51
CaO/%0.730.150.190.090.070.080.080.090.1031.0830.4730.5831.19
Na2O/%0.110.110.110.110.120.110.110.110.140.100.140.120.10
K2O/%1.301.331.351.291.471.521.461.672.580.180.130.100.06
MnO/%0.070.040.040.040.080.070.120.190.390.010.010.010.01
TiO2/%1.311.201.181.151.251.221.161.221.410.050.030.030.02
P2O5/%0.190.130.130.130.140.150.180.170.180.020.010.010.01
CIA93.8494.2594.3094.6193.7393.6394.0293.2189.6767.7449.1043.0331.36
Th/μg/g29.7037.6035.4031.6032.0033.2037.6033.9036.400.630.540.370.31
Nb/μg/g51.9070.6073.1055.1079.6071.4099.2097.80235.0016.606.656.152.87
Rb/μg/g73.0072.3072.8076.5076.3076.8077.0090.40107.003.682.672.041.32
Sr/μg/g57.1047.0047.9049.3046.8045.1042.3046.2048.4069.0069.1064.3066.80
87Sr/86Sr0.720.720.720.720.720.720.720.720.730.710.710.710.71
Table 2. Selected major and trace element concentrations and 87Sr/86Sr ratios of bulk samples of limestone profile CY and CZ.
CY-1CY-2CY-3CY-4CY-5CY-6CZ-1CZ-2CZ-3CZ-4CZ-5CZ-6CZ-7
pH5.825.695.897.237.42 6.386.626.936.936.626.14
SiO2/%51.9651.4451.7650.8437.996.7756.3156.6154.7855.0857.1757.445.92
Al2O3/%17.8819.0219.5018.8212.481.8314.6616.5618.4319.4018.7317.721.48
Fe2O3/%7.738.197.537.324.620.896.898.198.677.796.948.470.62
MgO/%2.673.073.523.502.611.031.321.291.461.421.321.240.77
CaO/%0.650.600.702.3117.0447.890.970.740.770.780.660.6048.93
Na2O/%0.140.140.160.150.130.050.110.120.120.120.120.120.08
K2O/%4.554.885.345.194.310.843.532.933.042.852.912.970.86
MnO/%0.070.080.090.090.050.020.180.170.190.180.190.230.01
TiO2/%0.960.850.720.730.420.061.321.421.381.401.401.430.09
P2O5/%0.050.050.050.070.090.040.080.060.050.050.050.040.03
CIA76.8576.8175.5675.4971.0262.7477.8082.2883.3484.7984.0983.0855.69
Th/μg/g18.0018.4018.4017.9010.201.4615.4020.4019.9021.8021.5020.601.15
Nb/μg/g23.9028.8043.7037.9020.608.9635.4046.3047.9055.9056.4054.503.87
Rb/μg/g15916718317813719.0011912714015514514014.00
Sr/μg/g10083.5085.4089.1023759710197.9010210596.4094.10736
87Sr/86Sr0.720.730.730.730.710.710.720.720.720.720.720.720.71
Table 3. The depth distribution of rare earth elements of bulk samples from the dolomite profile PB.
PB-1PB-2PB-3PB-4PB-5PB-6PB-7PB-8PB-9PB-10PB-11PB-12PB-13
La67.2089.0084.8059.6083.7084.60103.00100.00192.007.374.354.412.27
Ce201.00284.00289.00188.00282.00242.00256.00265.00379.004.183.152.351.67
Pr14.5020.0019.7015.6020.3019.7026.5025.6060.003.171.271.230.55
Nd51.9070.6073.1055.1079.6071.4099.2097.80235.0016.606.656.152.87
Sm10.3013.5013.5011.0017.7016.4022.0021.3056.006.902.241.820.57
Eu1.882.502.321.903.212.853.573.578.831.330.600.440.16
Gd7.269.609.597.7712.1010.4011.6011.6023.203.542.101.621.10
Tb1.151.521.531.212.021.701.811.873.900.590.360.290.19
Dy5.527.466.955.868.837.178.218.4015.102.001.181.060.98
Ho1.011.201.241.031.391.191.321.342.060.240.150.130.16
Er3.013.713.683.124.193.774.104.116.460.560.370.340.41
Tm0.550.660.690.520.830.750.780.781.350.100.070.050.05
Yb3.594.584.433.725.384.705.545.4710.200.670.360.320.27
Lu0.500.660.690.540.860.760.830.761.550.090.040.040.04
∑REE369.38508.99511.21354.96522.11467.38544.46547.61994.6547.3422.8820.2511.29
L/H 115.7016.7017.1614.2614.0114.7215.2915.2914.955.143.984.302.55
δCe 21.551.621.701.481.651.431.181.260.850.210.320.240.36
δEu0.660.670.620.630.670.670.680.690.750.820.840.770.61
LaN/YbN 312.6213.1012.9110.8010.4912.1412.5312.3312.697.458.269.385.65
LaN/SmN4.104.153.953.412.973.242.952.952.160.671.221.522.51
GdN/YbN1.631.691.751.691.811.791.691.711.844.284.774.123.28
1 Stands for ΣLREE/ΣHREE; 2 The Ce anomaly (δCe = CeN/[(LaN + PrN)/2]) and Eu anomaly (δEu = EuN/[(SmN + GdN)/2])were calculated; 3 LaN/YbN = (La/LaN)/(Yb/YbN), LaN/SmN = (La/LaN)/(Sm/SmN), GdN/YbN = (Gd/GdN)/(Yb/YbN). All concentrations are normalized to the bulk sample and given in μg/g.
Table 4. The depth distribution of rare earth elements of bulk samples from the limestone profile CY and CZ.
CY-1CY-2CY-3CY-4CY-5CY-6CZ-1CZ-2CZ-3CZ-4CZ-5CZ-6CZ-7
La36.6035.4048.1042.3024.408.7944.3050.6054.1062.4064.2058.604.44
Ce85.7087.5079.8078.7044.6017.20106.00137.00125.00136.00143.00138.008.71
Pr6.917.5411.509.585.302.279.5712.0012.7014.8015.1013.900.97
Nd23.9028.8043.7037.9020.608.9635.4046.3047.9055.9056.4054.503.87
Sm4.205.638.247.003.661.586.298.718.4810.2010.409.720.65
Eu0.851.221.711.500.810.331.231.691.802.011.971.860.15
Gd3.774.817.466.183.291.455.547.507.308.378.797.980.59
Tb0.680.931.291.110.610.220.941.291.291.421.421.310.10
Dy4.085.386.995.883.191.085.116.946.807.577.717.030.56
Ho0.781.001.281.140.600.210.941.271.251.401.451.310.11
Er2.383.043.663.231.700.542.753.933.613.973.903.760.27
Tm0.410.530.600.560.290.080.460.660.610.690.640.600.05
Yb2.673.193.733.391.860.482.723.853.643.984.063.920.25
Lu0.410.490.530.490.270.070.400.550.530.570.620.560.03
∑REE173.34185.46218.59198.96111.1843.27221.65282.29275.01309.28319.66303.0520.76
L/H 110.708.807.728.248.629.6210.9810.0710.2010.2710.4110.679.72
δCe 21.301.290.820.940.940.931.241.341.151.081.111.161.01
δEu0.650.720.670.700.720.670.640.640.700.670.630.650.76
LaN/YbN 39.247.488.698.418.8412.2910.988.8610.0210.5710.6610.0812.02
LaN/SmN5.483.963.673.804.193.504.433.654.013.853.883.794.30
GdN/YbN1.141.221.611.471.432.431.641.571.621.701.751.641.93
1 Stands for ΣLREE/ΣHREE; 2 The Ce anomaly (δCe = CeN/[(LaN + PrN)/2]) and Eu anomaly (δEu = EuN/[(SmN + GdN)/2]) were calculated; 3 LaN/YbN = (La/LaN)/(Yb/YbN), LaN/SmN = (La/LaN)/(Sm/SmN), GdN/YbN = (Gd/GdN)/(Yb/YbN). All concentrations are normalized to the bulk sample and given in μg/g.
Publisher’s Note: MDPI stays neutral with regard to jurisdictional claims in published maps and institutional affiliations.

