Article

Travel Behavior before and during the COVID-19 Pandemic in Brazil: Mobility Changes and Transport Policies for a Sustainable Transportation System in the Post-Pandemic Period

by
Carolina Silva Costa
*,
Cira Souza Pitombo
and
Felipe Lobo Umbelino de Souza
Department of Transportation Engineering, São Carlos School of Engineering, University of São Paulo (EESC-USP), São Carlos 13566-590, Brazil
*
Author to whom correspondence should be addressed.
Sustainability 2022, 14(8), 4573; https://doi.org/10.3390/su14084573
Submission received: 24 February 2022 / Revised: 29 March 2022 / Accepted: 7 April 2022 / Published: 12 April 2022
(This article belongs to the Collection Sustainable Transport Economics, Behaviour and Policy)

Abstract

:
This article was motivated by the urban mobility changes observed at the onset of the COVID-19 pandemic in Brazil. We aim to analyze travel behavior before and during the COVID-19 pandemic in Brazil considering two samples of revealed preference online data, independent samples tests, multinomial logit models (MNL), and mixed logit models (ML). The analysis shows a decrease in Urban Public Transport (UPT) use. Comfort and frequency of the UPT service were important factors to attract users during the pandemic period. Ridesourcing services were used for leisure purposes before the pandemic. During the pandemic, they were used for health purposes. Active modes were used more for shopping and leisure purposes during the pandemic. Regarding car users, such as drivers, it was found that they used ridesourcing less often during the pandemic than before. The main contribution of this research concerns the changes in travel behavior that might remain and how these analyses can shape sustainable transportation public policies in the future. Therefore, for a Brazilian study case, this article suggests an increase in the quality of UPT services, a reform on pricing regulations for UPT, an increase in the infrastructure for active modes, an implementation of car demand management strategies, and more strategies to support teleworking as a form of traffic demand management.

1. Introduction

In an attempt to contain the spread of SARS-CoV-2 around the world, many countries have adopted social distancing, health security, hygiene, and lockdown measures. Many authors who investigated this topic in various countries demonstrated that these measures are effective in reducing the spread of COVID-19 [1,2]. In Brazil, school closures and stagnant economic activities started between 12 and 23 March 2020. Since then, social distancing measures varied throughout 2020 and 2021 according to the occupancy rate of hospital beds, with the aim of avoiding deaths and the collapse of health systems.
Social distancing measures were directly associated with people mobility [3], and changed entire transportation systems and travel behaviors around the world. Furthermore, vulnerability, perceived risk, and fear caused by the SARS-CoV-2 pandemic influenced individuals behavior related to these preventive measures to face COVID-19. In Turkey, avoiding the use of Urban Public Transport (UPT) was the main factor in preventing the spread of COVID-19, according to individuals in a survey [4]. Other authors observed that individuals in a Tokyo sample tended to avoid leisure activities and going to restaurants more, but continued to go shopping using protective measures such as masks and hand hygiene [5].
In Brazil, the reduction in Urban Public Transport demand that had occurred even before the beginning of the pandemic, since 2019, has become greater during the pandemic. This drop in demand means a drop in the revenue, which had an impact in the services offered by operators [6]. Especially in a developing country, with many social disparities, it is important to analyze the influence of users’ satisfaction with UPT quality on the choice of these services during the pandemic. Thus, in the current period of mass vaccination—74% of the Brazilian population were fully vaccinated on 22 March 2022 [7]—and with the reduction in restrictive measures in Brazil, the purpose now is to understand the changes that occurred and identify those that may persist in the future, suggesting public policies regarding transportation that can ensure people’s quality of life.
This study aims to identify the main changes in Brazilian urban mobility habits (travel mode choice and trip purpose) that occurred at the onset of the COVID-19 pandemic in Brazil. The specific objective is to identify these changes related to the use of ridesourcing services. This study is based on online surveys in certain Brazilian cities during the pre-pandemic and the pandemic period. Changes are investigated by performing independent samples tests and confirmatory analysis calibrating Multinomial Logit (MNL) and Mixed Logit (ML) models.
This article has three main contributions. The first one is related to identifying the mobility changes associated with travel mode and trip purpose choices caused by the COVID-19 pandemic in Brazil. The second contribution is to find the main quality indicators of UPT that most influence its choice during the pandemic, such as frequency of service and comfort. The third one is the suggestion of transport policies to support transport operators and decision-makers to ensure health security, as well as a democratic and sustainable transportation system regarding the COVID-19 pandemic’s impacts and the findings in this article.
The present study consists of five sections, in addition to this introduction. Section 2 includes the literature review regarding travel behavior during the COVID-19 pandemic and UPT quality indicators. Section 3 presents the method used to meet the objectives of this article and contains a description of the data collection and the adopted tools. Section 4 comprises the characterization of the sample obtained, as well as the description and discussion of the results obtained in the analyses performed. Finally, Section 5 proposes public transport policies for the Brazilian context, based on the results obtained. In Section 6, the authors conclude the discussions presented throughout the article and propose future research avenues.

2. Literature Review

This section presents the previous literature on travel behavior during the COVID-19 pandemic focused on travel mode and trip purpose. After analyzing the influence of people’s satisfaction with the Brazilian Urban Public Transport service in relation to the pandemic period, a literature review related to UPT quality indicators is also discussed.

2.1. Travel Behavior during the COVID-19 Pandemic

Risk perception and fear have influenced travel behavior during the pandemic and changed individuals’ travel mode choice [4]. In the current literature, authors have observed that people are more positive about using private vehicles than UPT, according to users [8]. In research from the USA, only 29% of the sample’s respondents considered private motorized vehicles as having a medium- to high risk of contagion and the rate for bicycles was even lower (23%). Meanwhile, for ridesourcing, the rate was 89% and for PT 93%. Among this 93%, more than 26% did not have frequent access to a private vehicle [9]. In Australia, the results observed in the literature were similar, as rail and buses were considered the travel modes that 33 and 42% of the sample felt less comfortable using, respectively, compared to a rate of only 1% in the case of a private car. However, only 12% of the respondents pointed out ridesourcing as the travel mode they feel less comfortable commuting with during the COVID-19 pandemic, which is a lower rate than in the USA [10].
Furthermore, some authors have investigated the factors that influenced travel behavior changes observed during the pandemic. In Thessaloniki, Greece, a study found that people switched from UPT to private vehicles and walking, in which private cars were more used for commuting [11]. In Chicago, USA, a study found that transit use declined more in commercial regions and the regions with more COVID-19 cases presented smaller declines [12].
In Brazil, bus demand decreased by approximately 40% between October 2020 and February 2021 and rail demand decreased by 55.9% between March and December 2020, when compared to the same period of the previous year [13,14]. Although other travel modes had a drop in demand, in the case of UPT, the reduction in demand was greater [15,16]. However, it is not clear in the literature if the socioeconomic- and trip-related factors that influence travel mode choice changed at the onset of the pandemic. Therefore, Brazilian travel behavior during the COVID-19 pandemic should be studied to avoid the negative impacts of the substitution of UPT by private vehicles (cars and motorcycles) and ridesourcing services.
In addition to changes in habits related to travel mode choice, one can observe changes in individual behavior related to activities performed out of the home. In Chicago, USA, respondents perceived that going to hospitals, gyms, and restaurants had the highest risk of contagion, while visiting family and/or friends and shopping were the lowest [9]. In Canada, there was a higher frequency of travel during the pandemic due to work-related trips or shopping [17]. In Australia, a more significant decrease in trips was observed due to shopping, visiting friends, and going to restaurants [10]. In Brazil, work-related trips reduced and telework increased during the pandemic [6].
Many authors have suggested policies to minimize the negative effects of the pandemic on travel behavior, such as applying land occupation properly based on density of the neighborhoods to decrease social disparities and travel time [18]. Another proposal is to adjust the UPT service supply to the socioeconomically different groups and spaces [12]. This study relies on the individual’s satisfaction with the quality of UPT and how it influences their travel mode choice during the pandemic.

2.2. Urban Public Transport Quality

Improving the quality of UPT is important to attract users [19]. Thus, it is required to investigate an individual’s perception about these quality factors to shape effective policies for operators. Many authors have suggested different indicators to assess UPT quality [20,21,22], and which ones should be used is not clear in the literature [23]. The socioeconomic context and local customs from the region analyzed should be considered [22]. This literature review brings the most important general factors and correspondent indicators analyzed by some authors before the COVID-19 pandemic, as shown in Table 1.
The frequency of service, schedule reliability, comfort, cleaning, safety, information, courtesy of employees, and cost indicators are the most used because of their importance in many studies [23]. Brazilian authors used the personal safety, comfort, schedule reliability, frequency of service, and general quality indicators to assess UPT quality in a survey applied in many Brazilian regions in 2019, just before the beginning of the COVID-19 pandemic. The research findings show that security and schedule reliability were important factors on whether individuals would use UPT [29].
However, the pandemic has changed travel behavior and the UPT service supply, and it is not yet clear in the literature which factors have most influenced travel mode choice during the pandemic. Research regarding London UPT investigated people’s satisfaction with the service using tweets. More negative perception was indicated when compared to the period before the pandemic. In addition, it indicates that measures associated with the pandemic, such as using masks, were new factors relevant for individuals [31]. Therefore, this article contributes to assessing UPT quality and investigating the Brazilian indicators that most influence its choice during the pandemic period.

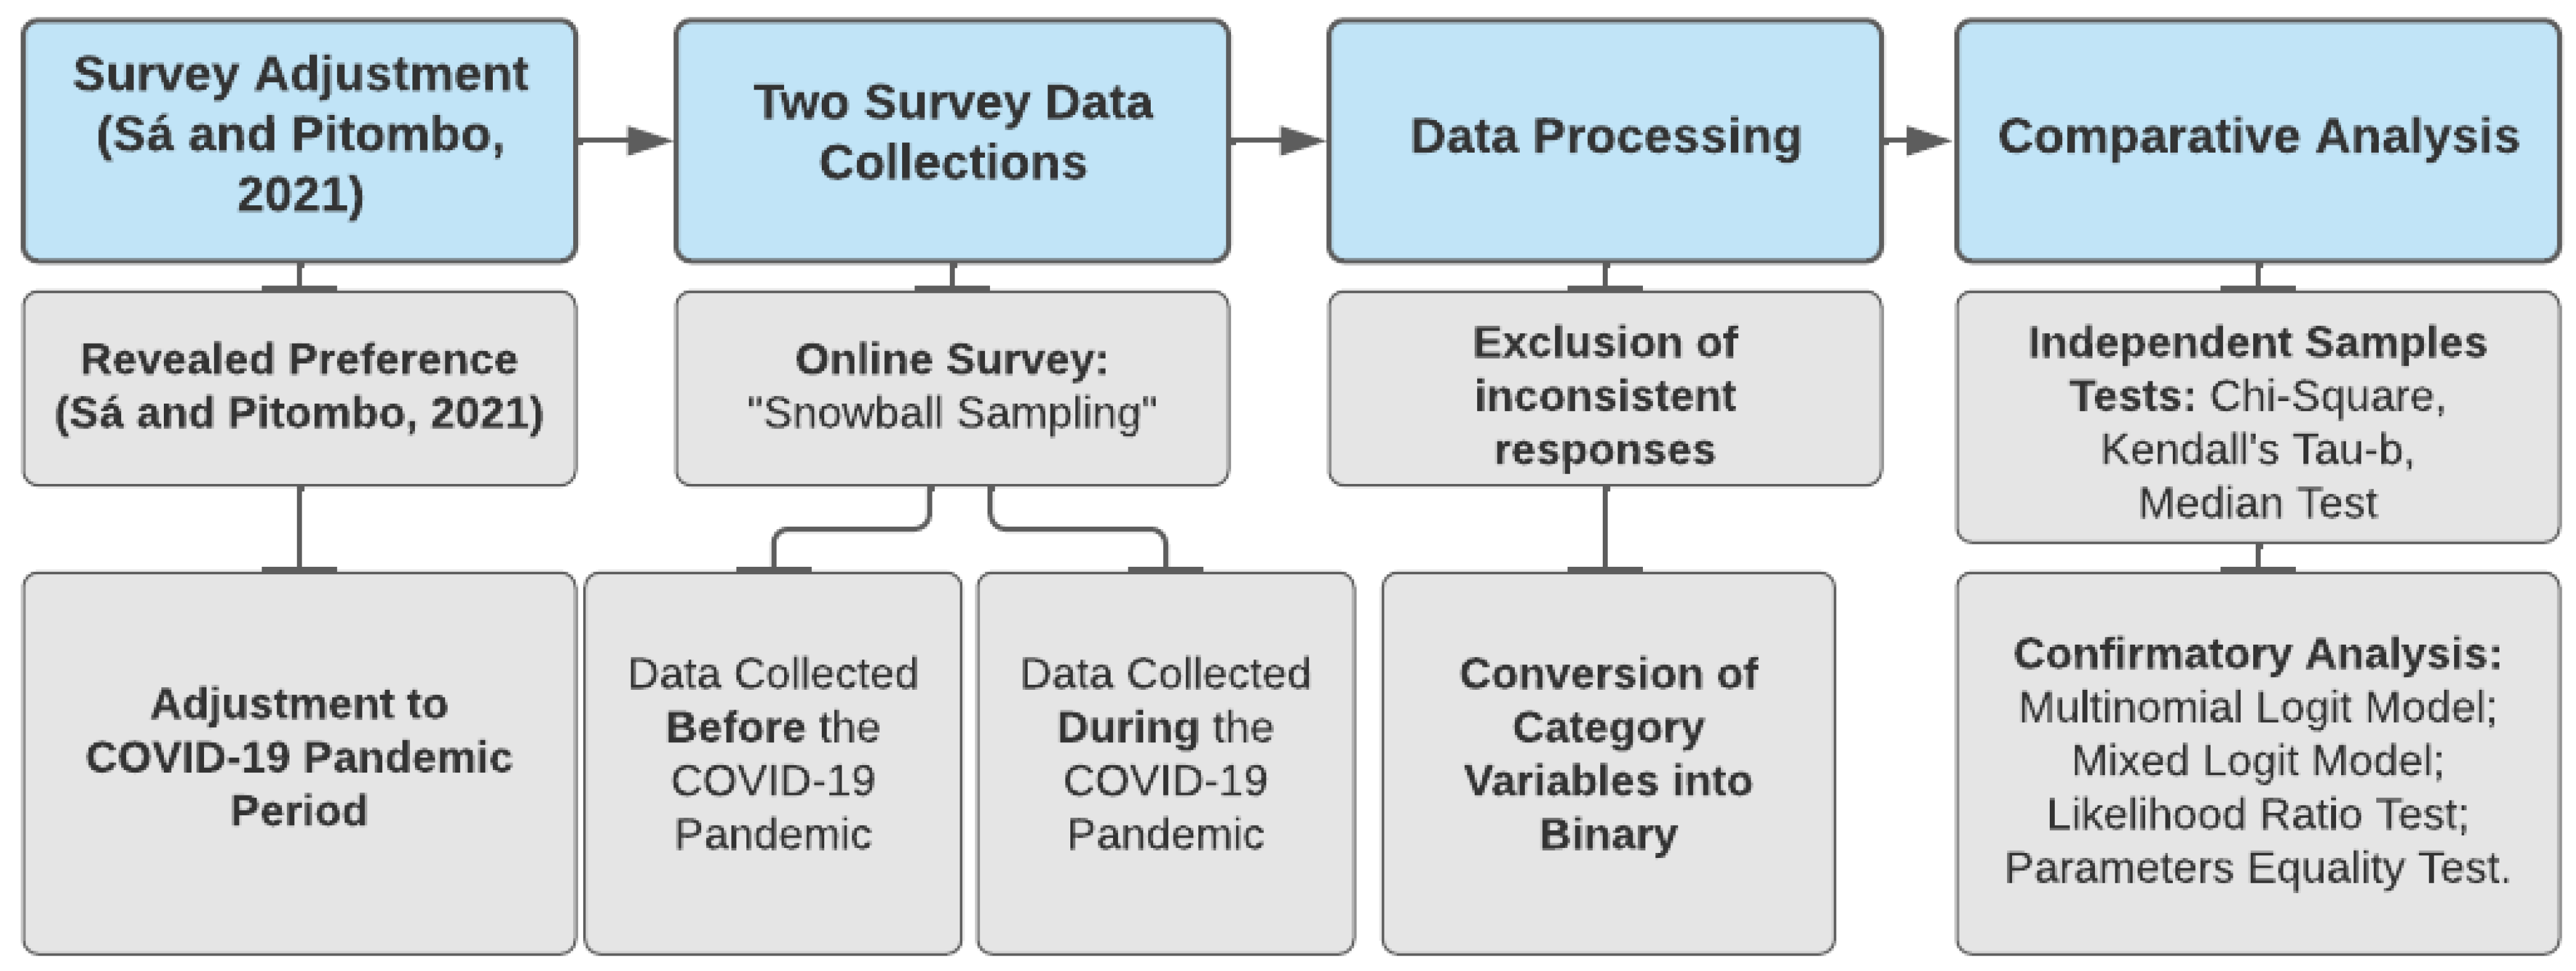
3. Materials and Methods

To meet the objectives of this article, the method consists of four main steps. Initially, a previous survey was adjusted [29]. Then, data from two online questionnaires were collected (one before the pandemic and another during the pandemic). Finally, the data were processed and a comparative analysis between the two independent samples was conducted. The methodological flowchart in Figure 1 illustrates the steps. Following this, a detailed description of the methodological steps is presented in the next subsections of this article.

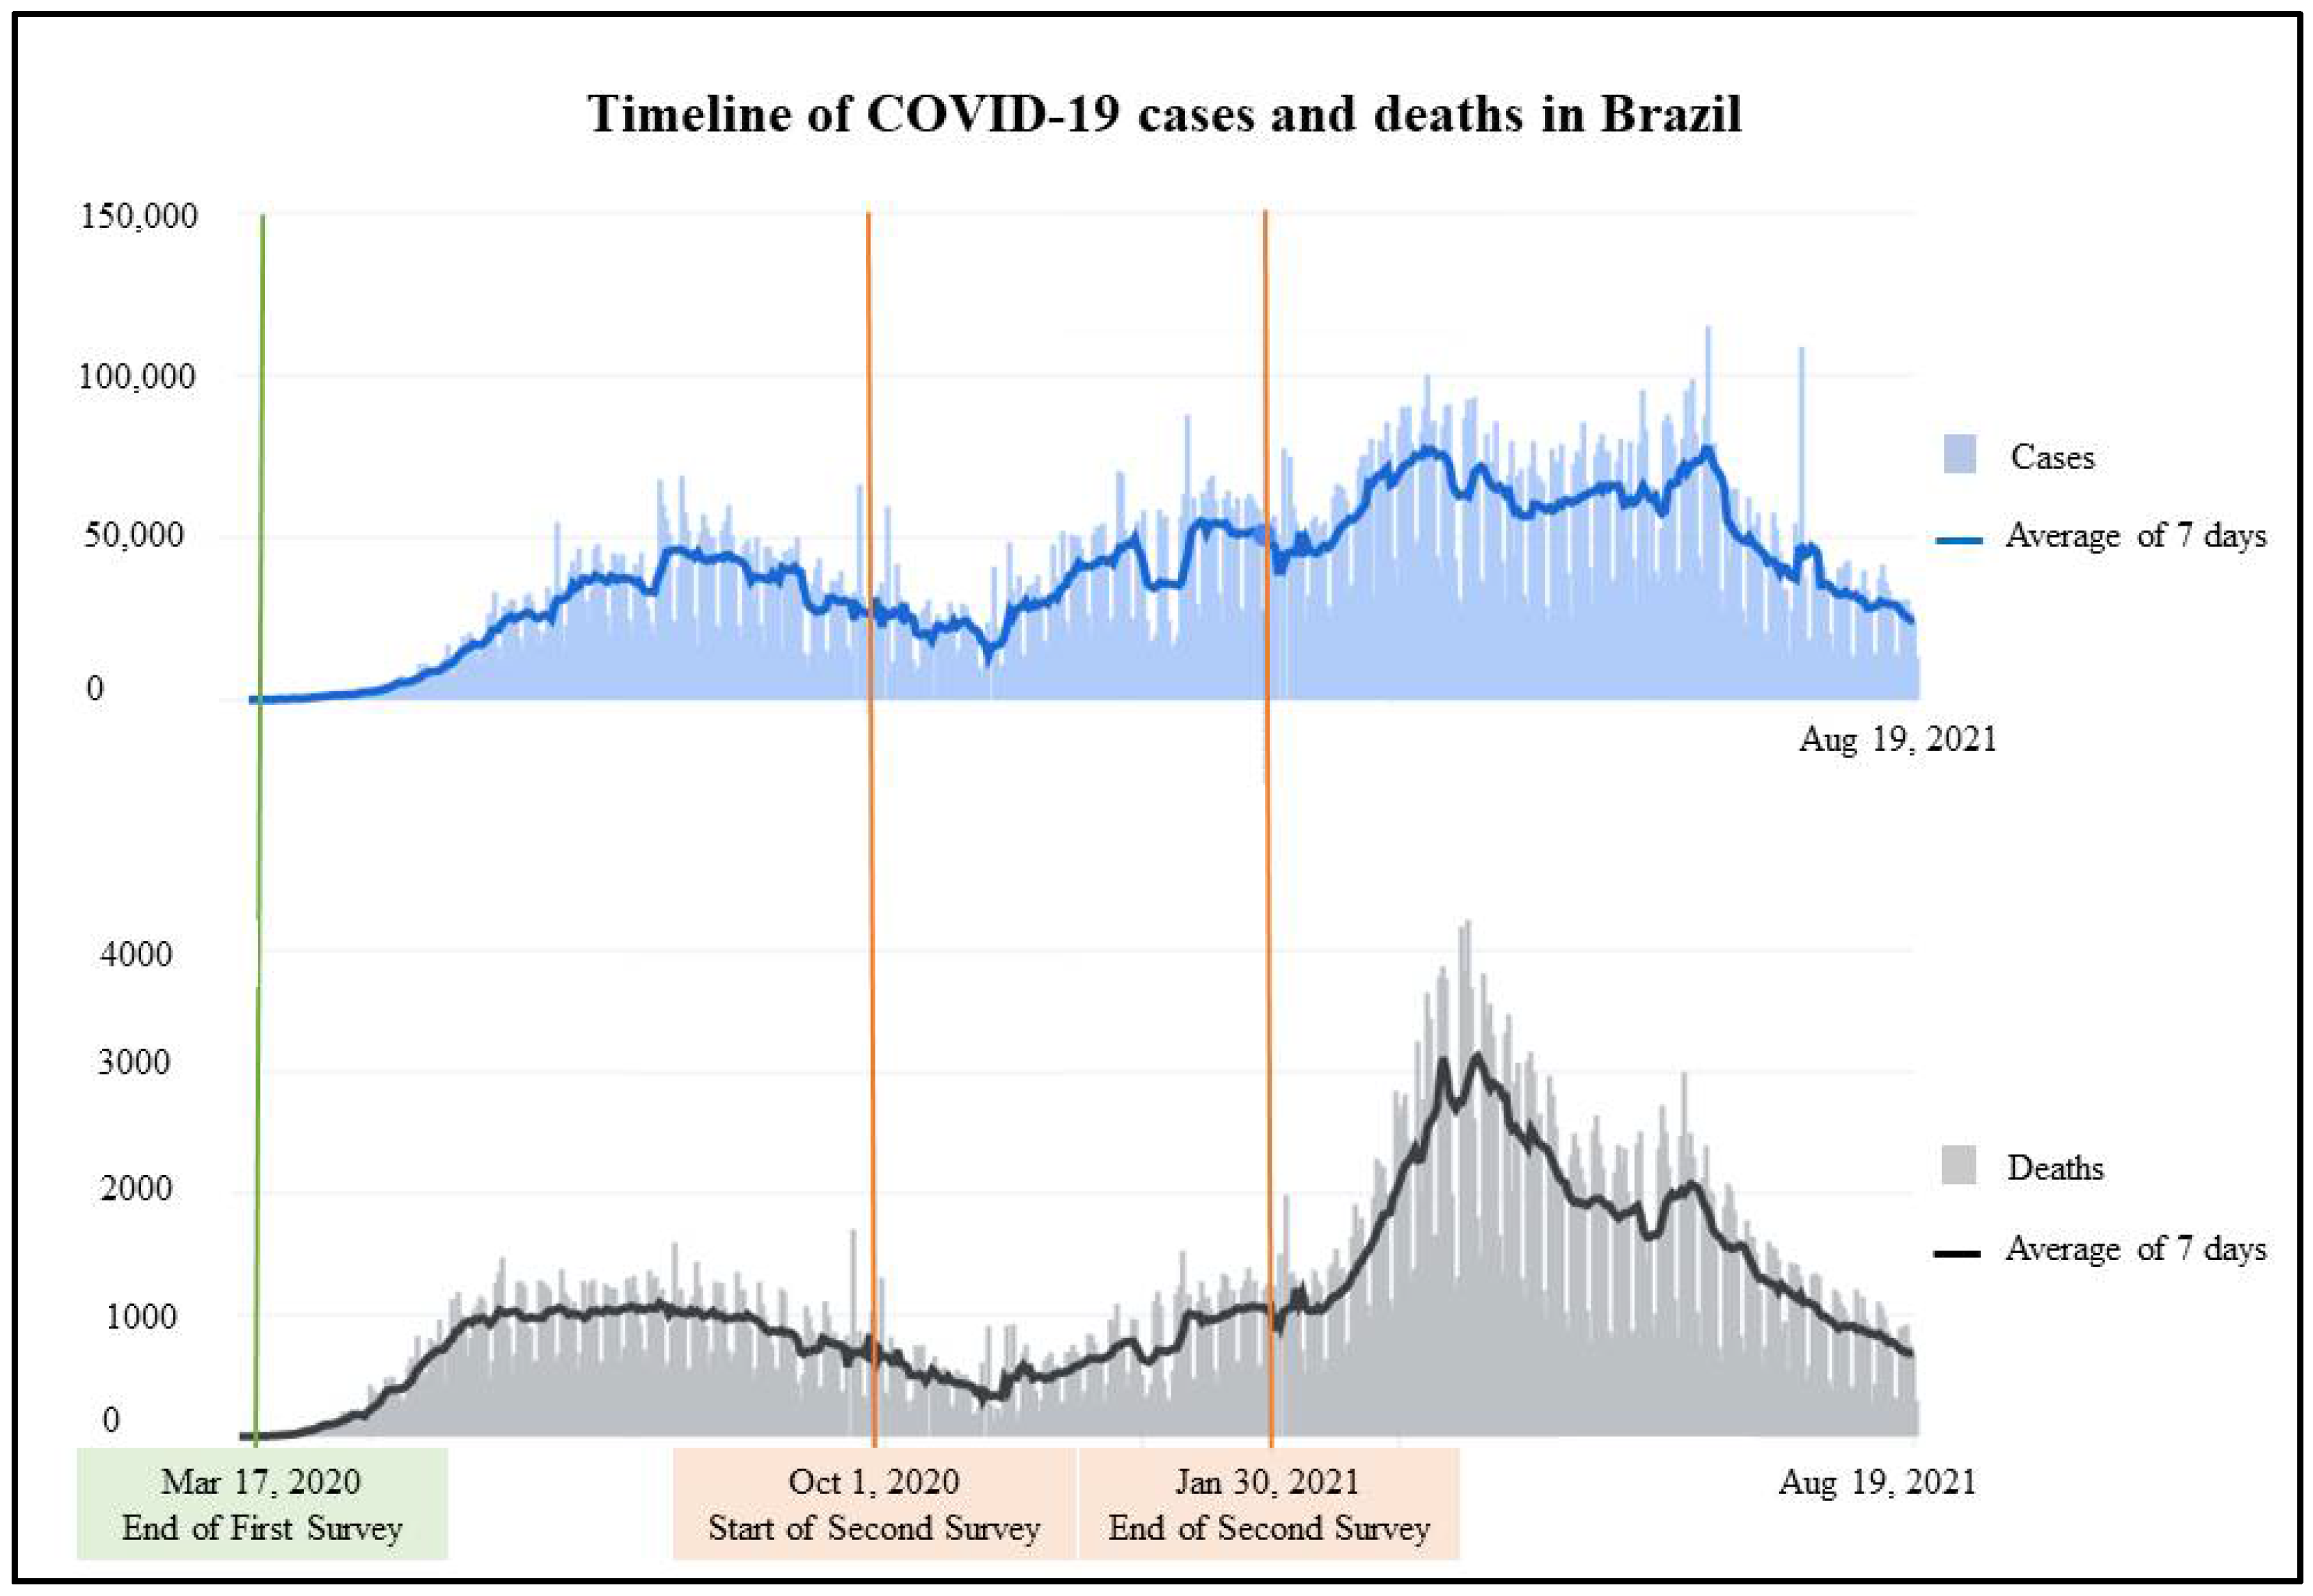
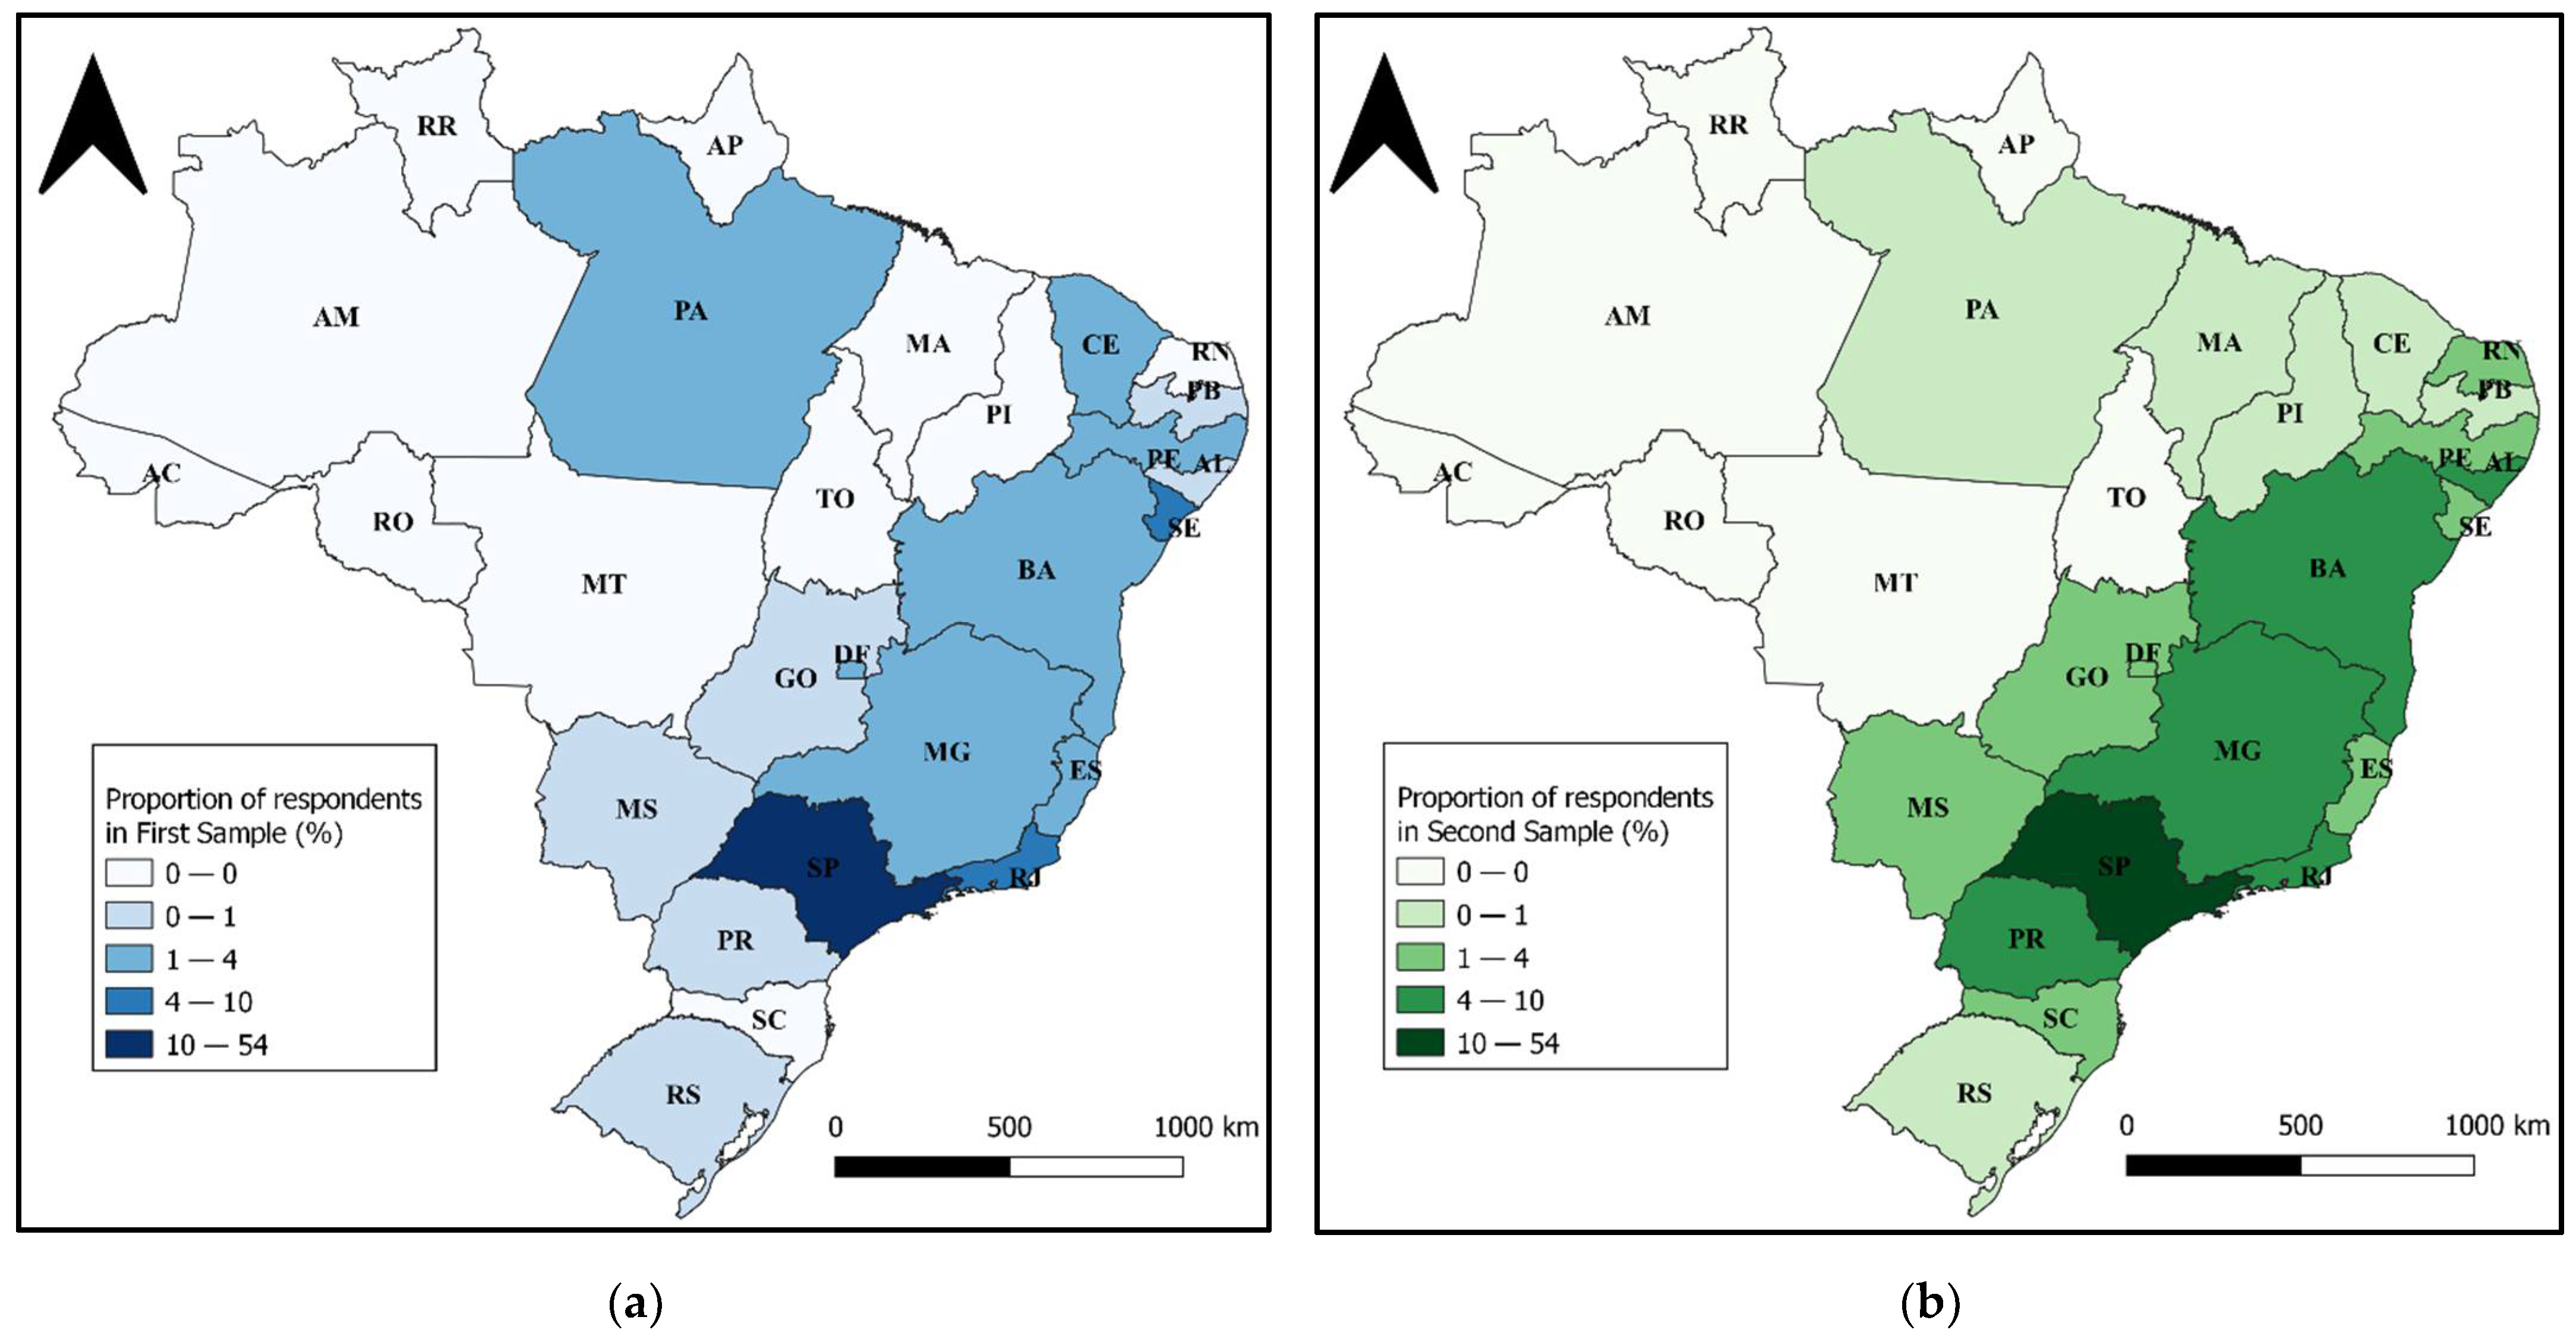
3.1. Survey Adjustment, Data Collection, and Processing

Initially, a revealed preference survey was used [29], and the questions were adapted considering the context of the COVID-19 pandemic. The aim of this type of survey was to obtain the actual travel behavior of users during the pandemic. The two questionnaires consist of four sections and the questions included in each section are presented in Table 2.
The participants’ rights and privacy were protected by presenting the survey’s terms and conditions in the first page of the questionnaire. The respondents had to read and agree to the terms, which contextualized the survey, described the sections of the questionnaire, showing that the participation was voluntary. In addition, the participants were informed that all responses were anonymous and confidential.
Data collection was carried out in two periods: before the pandemic (between November 2019 and March 2020—sample before the pandemic) and during the pandemic (between October 2020 and January 2021—sample during the pandemic). In order to understand the different contexts in which the questionnaires were conducted, Figure 2 shows the evolution graph of confirmed COVID-19 cases and deaths in Brazil over time.
It can be observed that the first collection was completed just before the social distancing restrictive measures (March 2020). The second collection was carried out in a period of relaxation of these measures, thus after the peak of the “first wave” and before the peak of the “second wave” of the pandemic in the country. The questionnaires were published online on the Google Forms platform, via social networks and email lists.
In this study, the authors used a non-probabilistic sampling method (convenience sample) called “snowball sampling”. This data collection has limitations due to the difficulty in accessing the various segments of the Brazilian population, especially during the COVID-19 pandemic period.
Afterward, the data processing included the elimination of inconsistencies and two independent samples were obtained. For the pre-pandemic sample (sample before), 625 responses were obtained from individuals from 103 cities in 22 different Brazilian states. In the sample collected during the pandemic (sample during), 468 responses were obtained from individuals from 98 cities in 20 different Brazilian states. The proportion of the respondents’ states of origin is shown in maps (a) and (b) in Figure 3 and the population for each state is shown in Figure 4.
It can be seen that the two samples covered states from all regions of Brazil and the highest concentration of responses was in the southeast and northeast regions, which are the most populous regions of Brazil [33]. Due to the wide variety of cities and states, these responses were replaced by the binary variable “metropolitan region” to perform the analyses, classifying them according to belonging to a metropolitan area. These regions are defined by the Brazilian Institute of Geography and Statistics (IBGE in Portuguese) as the clustering of neighboring municipalities, aiming to integrate the organization, planning, and execution of public functions of common interest. It should be mentioned that Brazil has 74 metropolitan areas [34].
To carry out the confirmatory analysis, a new specific procedure for data processing was performed, in which responses whose alternative travel mode and/or trip purpose was “other” were excluded and categorical variables were transformed into a binary. The variables obtained from the questionnaire, their respective sections, and the new variables effectively used for the model’s calibration are shown in Table 3.

3.2. Comparative Analysis

In order to carry out a comparative analysis between the two independent samples, hypothesis tests were initially carried out to verify whether there was a significant change in the variables associated with travel behavior in the previous period and during the pandemic. The chi-square test technique was used for the variables “most frequent travel mode”, “most frequent trip purpose”, and “frequency of ridesourcing use”, due to the possibility of working with nominal and ordinal qualitative variables [35]. In the case of the variable related to ridesourcing use, a statistical comparison was made between the median test and Kendall’s Tau-b test techniques, as it is an ordinal categorical variable [36]. Table 4 describes the variables, the type of each variable, the hypothesis tested, the tests performed in each case, and the confidence level considered in the tests. IBM SPSS 24.0 software was used.
Following this, discrete choice models were calibrated to investigate the differences in travel mode and trip purpose choices. Discrete choice analysis was used to model preferences, based on the random utility theory [40,41]. This theory assumes that every individual is a rational decision-maker. The decision-maker selects the alternative in the choice set with the highest utility value.
Simpler structures were tested first, such as MNL models [40], assuming that stochastic errors have an IID Gumbel distribution. The utilities are configured as follows:
U i n = V i n + ε i n
where U i n is the utility of alternative i for the individual n; V i n is the deterministic part in the utility function alternative i for the individual n. ε i n represents the unobserved part of the utility and is often called the random component of utility.
Afterward, the utilities for each alternative were defined, whose coefficients are estimated from the maximum likelihood. The choice probability of alternative i for individual n for a multinomial logit model can be configured as follows:
P i n = e V i n j = 1 j e V j n
where Pin is the probability of the alternative i to be chosen by individual n; j is the number of alternatives.
The standard logit model shows independence from irrelevant alternatives (IIA), which implies proportional substitution across alternatives [42]. This assumption for the distribution of residuals is rather simplistic, as they depend on the hypothesis of independence and homoscedasticity of residues [43].
More complex logit models can be derived similarly from different assumptions about the coefficients and error-term distribution. To overcome limitations of the MNL model, another model tested was mixed logit (ML), which has a highly flexible model that can approximate any random utility model [44] and consider heterogeneity in behavior. In the ML model, β is randomly changed. Thus, it is necessary to multiply the distribution of β on this basis to obtain the conditional selection probability of the behavior subject to the presence of random preferences [45]. Mixed logit probabilities can be expressed as integral to standard logit probabilities over a distribution of the parameters (3):
P i n =   L i n ( β ) f ( β | θ ) d β
L i n is the logit probability evaluated at parameters β [42]:
L i n   ( β ) = e V i n ( β ) j = 1 J e V j n ( β )
f ( β | θ ) is the density function under the overall parameter θ , known as ‘mixing distribution’ [46]. The density function is described by a certain parameter θ , such as a normal distribution through the mean μ and standard deviation σ . The selection probability of the mixed logit model can be regarded as the weighted average of the selection probabilities of the multidimensional logit model, and the weight is determined by f ( β | θ ) [45,47].
ML models with random coefficients (ML-RC), considering normal distribution, were estimated to investigate taste variation (e.g., in a time coefficient) by assuming that preferences were randomly distributed in the population. Many papers have proven the efficiency of normal distribution estimating the random parameters in a mixed logit model [48]. This paper utilizes 1000 Halton draws in the simulation procedure for parameter estimation. Model estimation was performed using R [49] and the Apollo package [50].
Different models were developed in this study so that we could compare the contexts of both surveys. The variable considered as alternatives, the period of the sample, the alternatives included, and the models calibrated are summarized in Table 5.
Two MNL models and two ML models were calibrated for travel mode choices: referring to the period before the COVID-19 pandemic (MNL travel mode before and ML travel mode before); and the others referring to the period during the COVID-19 pandemic (MNL travel mode during and ML travel mode during). The set of alternatives of all the models were: car (as a passenger); active modes; car (as a driver) or motorcycle; ridesourcing; and urban public transport (bus, subway, or train). A likelihood ratio test was performed to test whether there is a significant improvement in the goodness-of-fit of the ML model in relation to the MNL.
Similarly, models associated with the trip purpose choices were generated for the period before the pandemic (MNL trip purpose before and ML trip purpose before), in which the set of alternatives was: “work”; “leisure”; “study”; and “other” (“visiting friends and/or family”, “shopping”, or “health”). In addition, models for the period during the pandemic (MNL trip purpose during and ML trip purpose during), in which the set of alternatives was: “work”; “shopping”; “health”, and “others” (“visiting friends and/or family”, “study”, and “leisure”). The ML models are considerate when random parameters are observed, otherwise the mixed logit collapses into a multinomial logit model.
The multicollinearity test (Variance Inflation Factor—VIF) was performed regarding the independent variables of the models using the IBM SPSS 24.0 software [51] and the non-collinearity assumption for using the MNL model was verified and accepted.
In order to do a comparative analysis of the parameters that appeared in both models (before and during pandemic), the authors did a parameters equality test by verifying if the parameter of the during the pandemic model was inside the interval calculated for the before pandemic model. A normal distribution was considerate and the z value of 1.96 (95% interval confidence) was used to determine the parameters’ interval confidence, as follows:
β before 1.96 ( s . e . β before ) < β during < β before + 1.96 ( s . e . β before )
where β before is the parameter in the model before the pandemic, s . e . β before is the standard error of this parameter, and β during is the same parameter in the during the pandemic model.

4. Results

4.1. Samples Description

After the data collection and processing stage, the characterization of the two samples was obtained. The socioeconomic profile of the respondents is represented in Table 6, which describes household income range, level of education, exemption/discount for transit passengers, gender, age, and household car ownership of the samples from before the pandemic and during the pandemic.
It can be observed that most of the respondents in the sample from before the pandemic are young people aged between 18 and 30 years (71.2%), with a high level of education, having at least an undergraduate degree (63.2%). They have at least one car at home (69.7%) and do not have a discount or exemption on the UPT fare (69%). The characteristics of the respondents from the sample during the pandemic are similar. Around 63% are 18 to 30 years old, 62% have at least an undergraduate degree, 73% have at least one car at home, and 72% do not have a discount or exemption for transit fares. In both samples, approximately half are female and over a third have an income between three and nine minimum wages.
The level of education and household income of most respondents do not represent the reality of Brazilians as a whole, as the highest percentage of individuals over 14 years old have not completed elementary school [52] and the individual monthly income of most Brazilians over 10 years old is up to three minimum wages [53]. Therefore, the results obtained here cannot be expanded to the entire population. The snowball sampling technique, in general, results in a biased sample regarding the level of education and income. One way to mitigate this methodological constraint, proposed by the authors, was to remove these variables from the analysis, especially in the modeling stage.
However, the socioeconomic characterization is similar in the two samples, allowing the comparison of mobility habits in the different study periods. The characterization of trips and UPT quality assessment were differentiated between the two samples. Table 7 shows the percentage of answers for each category of trip purpose, travel mode, and frequency of ridesourcing use. Table 8 describes the respondents’ assessment of each UPT quality indicator.
The three most-used travel modes before the pandemic were the car, as a driver (34.7%), UPT by bus (25.4%), and ridesourcing (11.7%). During the pandemic, the proportion of drivers was higher (43.6%), ridesourcing appeared in second place (13.9%), and in third place was the bus (12.6%). It was observed that during the pandemic, UPT was assessed as worse than before the pandemic, and the biggest differences between the periods are in relation to the “very poor” evaluation of comfort, general quality, and frequency of service. It is worth mentioning that only UPT users from before and during the pandemic responded to the quality assessment of the UPT service questions, featuring a total of 204 responses in the sample before the pandemic and 220 responses in the sample during the pandemic.
Although ridesourcing was the second most used travel mode for the main trips during the pandemic, the frequency of use of this service was higher in the previous period. Regarding the purpose for the most frequent trip, there was a significant difference in the proportion of the samples as the three purposes most chosen by the respondents of the sample before the pandemic were “work” (53.4%), “study” (34.6%), and “leisure” (7.5%). In the sample during the pandemic, the most chosen purposes were “shopping” (35.9%), “work” (35.3%), “visits” (13%), and “health” (10.3%). The most frequent travel time is the only continuous variable and its description is characterized in Table 9.
A reduction in the average travel time and standard deviation was observed during the pandemic. The minimum, first quartile, and maximum values were similar, and the third quartile was higher before the pandemic.

4.2. Independent Samples Tests

In order to test behavioral differences regarding the travel mode choice, trip purpose, and frequency of ridesourcing use, some comparative tests were carried out between the responses obtained before and during the pandemic. The results are presented in Table 10, which shows the Pearson’s chi-square statistics, the Cramer’s V and contingency coefficient values, and the median and Kendall’s Tau-b test results.
It can be observed that there was a significant change in mobility habits at the onset of the pandemic, as the p-value in all cases were 0.000, and therefore significant for 99% confidence. In the case of the variable “frequency of ridesourcing use”, all tests carried out indicated that there is a difference in the proportion of responses in each category between the analyzed periods. Thus, the Tau-b correlation coefficient was negative, indicating a reduction in the frequency of ridesourcing use at the onset of the pandemic. In addition, when comparing Cramer’s V and Pearson’s chi-square values for the three variables tested, a greater intensity of difference was observed between the trip purposes chosen before and during the pandemic. To verify these relationships in more detail, the MNL and ML models were calibrated.

4.3. Multinomial Logit and Mixed Logit Models

The authors analyzed models for the travel mode alternatives and for the trip purpose alternatives.

4.3.1. Travel Mode Models

The set of alternatives for the modeling associated with the travel mode was car (as a passenger), active modes, car (as a driver) or motorcycle, ridesourcing, and urban public transport (bus, subway, or train). The MNL and ML models were estimated with data from before the pandemic and during the pandemic and the socioeconomic variables of level of education and income were removed due to the sample bias. The results of the models’ statistics obtained for the travel mode choice, such as number of observations, number of parameters, log-likelihood values, adjusted rho-square ratio, and Akaike information criteria are shown in Table 11.
The authors compared the log-likelihood (final) of the MNL and ML models from the same period, considering 95% of confidence. The likelihood ratio test was 19.696 for before the pandemic models and 28.676 for during the pandemic models (critical value for chi-square distribution X 0.95 ; 1 is 3.84), and therefore we assume that the ML models bring accuracy improvements.
The ML travel mode before the pandemic was estimated with the travel time coefficient normally distributed and it was the only attribute that had random effects across all observations. The ML travel mode during the pandemic was estimated with the “Household car ownership” coefficient normally distributed, being the only attribute that showed to have random effects across all observations. Table 12 describes the variables included in the utility function of each alternative, the parameters estimated in the final model for each period, the confidence interval of the parameters in the before pandemic model and the comparison between the parameters of the variables that were included in both models.
After processing the data, a total of 609 observations were obtained for the mixed logit travel mode before the pandemic and 457 for the mixed logit travel mode during the pandemic. The parameters were estimated taking into account 90% of confidence and the signs that were consistent with their influence on the choice of alternatives. The adjusted rho-square values were similar and acceptable for both models [40].
By analyzing the results, we were able to compare the factors that influence the choice for each travel mode alternative in the different periods analyzed. In the case of UPT, the sign of its utility function constant changed from positive (before the pandemic) to negative (during the pandemic) and its value, in module, was higher during the pandemic (−1.9757). The comparative test indicates that the values were not equal for 95% confidence. This result indicates that there was a reduction in the choice of UPT at the onset of the COVID-19 pandemic. In addition, the parameter of the trip purpose variable “going to work” was significant only during the pandemic and its sign was positive and the value was high (2.1724), indicating a great influence of this factor on the UPT choice. Since it is a mandatory trip, it is understandable that UPT was used, especially for individuals who do not have a car at home.
The UPT quality assessment also influences its choice; however, only the users of these services responded to this section of the questionnaire and in the survey during the pandemic the individuals that used UPT before the pandemic and stopped at the onset of the pandemic were also included. It can be observed that the parameters for the scores 4 and 5 (“good” or “very good”) have a positive value, thus the better the UPT quality assessment, the greater the probability of the individual choosing this travel mode. The factors “comfort” and “frequency of service” had a significant parameter in the model (1.3841 and 1.3475, respectively), suggesting a greater influence on the choice of UPT than the other quality indicators of these services. Considering the Brazilian cases of UPT overcrowding during the pandemic [6], there is a need to improve UPT quality to attract users and ensure a more democratic, sustainable, and safe transport system. After all, even with the high-risk perception towards UPT [5,9,10], many users need this service for urban mobility, mainly to carry out mandatory activities, such as work.
Regarding the active modes, it was observed that males who do not live in metropolitan regions were more likely to choose this travel mode in both periods of study (the parameters for the two variables in both models were negative, thus the utility decreases when the response is 1—gender is not male and 1—lives in a metropolitan region, respectively). These results can be explained by women’s perception of violence and unsafety when walking or cycling on Brazilian roads [54] and the long distance in work-related trips in metropolitan regions. However, the parameter of the variable “metropolitan region” was significantly lower during the pandemic than before pandemic. Moreover, two variables related to the trip purpose had significant parameters only in the ML travel mode during the pandemic. It can be concluded that shopping and doing leisure activities influenced the choice of active modes more than the individual region of residence during the pandemic.
In the utility function of the ridesourcing alternative, differences related to the most frequent trip purpose were also observed. Before the pandemic, the main purpose was to go to leisure activities (a significant parameter with a positive value of 1.2385), while during the pandemic it was to go to health care (a significant parameter with a positive value of 1.3214). The models suggest that individuals are substituting ridesourcing for active modes to do leisure trips, as explained earlier in this section. The high frequency of ridesourcing use (at least six trips in the month prior to the survey) continued to influence positively the choice of these services even at the onset of the pandemic, as the comparative test indicates similarity between both parameter values.
The factors that influenced the choice for private motorized vehicles (car as driver and motorcycle) were similar in both models; however it was possible to observe some differences supported by the comparative test. Individuals who own at least one car at home are more likely to choose these travel modes for commuting during the pandemic than before (the parameter value was higher during pandemic at 3.7087, than before at 1.3252). Age is a social characteristic that was important only before the pandemic, as the variable “aged between 31 and 50 years old” had a significant and positive parameter (0.8901) only in the “ML travel mode before”. The utility function constant of the motorized private mode alternative was also significant. The value, in module, was higher during the pandemic, indicating a reduction in its use, since the sign was negative.
Another distinction observed was the decrease in the frequency of ridesourcing use with the onset of the pandemic by individuals that more often travel by car or motorcycle on the main trips. The parameter of the dummy variable “frequency of ridesourcing use (0)” was positive and higher on the “ML Travel Mode During”, thus it increased utility when the response was “1—did not use ridesourcing in the month prior to the survey”. This result is similar to the literature, in which the perceived risk was higher for using ridesourcing services than private cars [9,10].
Finally, the influence of the “travel time” variable on the utility functions of two alternatives (ridesourcing and UPT) in the models before and during the pandemic was analyzed. It could be observed that the signs for the ridesourcing alternative were negative (−0.0554 before; −0.0590 during), and the signs for UPT were positive (0.04151 before; 0.0248 during). Thus, one can infer that users are choosing ridesourcing more in shorter trips, so that the choice for UPT is made more often in long travel times, when the ridesourcing price is not competitive with the UPT tariff.
In addition, the constant of the ridesourcing utility function was positive and PT utility function was negative during the pandemic. It is possible that substituting UPT by ridesourcing, which had already been observed even before the pandemic [29,55], was accentuated in 2020, especially for those individuals who did not have a car available at home. Therefore, it is consistent with the literature from Australia, in which it was found that the risk perception in UPT is higher than in ridesourcing [10] and from Canada, in which an increase in the frequency of ridesourcing use to avoid crowded UPT vehicles and stations was recorded [56].
Distinctions were observed regarding travel behavior by observing the purposes for the most frequent trips that influenced each utility function. Thus, other modeling was carried out to obtain more in-depth results on the changes in activities carried out at the onset of the COVID-19 pandemic, as presented in the following section.

4.3.2. Trip Purpose Models

Different mixed logit models were tested; however, it should be noted that no random parameter has been found in the models. Thus, the mixed logit models collapse into a multinomial logit model (MNL). For trip purpose models, this paper presents only the models calibrated from the multinomial logit.
Two different MNL models were carried out for the alternatives of the most frequent trip purpose of the respondent. For the before the COVID-19 pandemic model, we included the utility functions of the alternatives: “work”, “leisure”, “study”, and “other purposes” that had a low number of responses (home visits, shopping, and health). In the model during the pandemic, we considered the utility functions of the alternatives: “shopping”, “health”, “work”, and “other purposes” that had a low number of responses (visiting family and/or friends, study, and leisure). The purposes grouped in the alternative “others” were different in the two models due to the different number of responses obtained for each alternative in each sample. The utility function of the other purposes was fixed with a constant equal to zero. The statistics of the two models, the parameters of the variables included in the utility functions, the confidence interval of the parameters in the before the pandemic model, and its comparison with the parameters in the during the pandemic model were obtained, as shown in Table 13.
The adjusted rho-squares were similar and acceptable for the two models. The log-likelihood (final) values were lower than the initial ones, as expected. The parameters obtained had signs that were consistent with their influence on the choice of alternatives and were significant for at least 90% confidence.
When analyzing the value of the constants of each utility function and the alternatives that were included in each model, a large reduction in the trip purposes “study” and “leisure” can be observed. Schools and universities had to restrict face-to-face activities to avoid contagion by the coronavirus, which had an enormous impact on education [57]. The “work” purpose was also impacted by the onset of the pandemic. Teleworking is a demand management strategy for urban travel that was already in place even before the pandemic. Considering the biosecurity measures to face the new coronavirus, there was a dramatic increase in this form of work, reducing the number of trips for this purpose and this new behavior may continue even after the pandemic [58,59]. In addition, there was a large increase in travel choice for “health” and “shopping” purposes at the onset of the pandemic. The constant of the utility function of the shopping alternative was the one with the highest value in the MNL trip purpose during the pandemic (3.9186) and this result is similar to the literature, as shopping is an essential activity that tended to be maintained during the COVID-19 pandemic [5].
When analyzing the factors that influence the choice of each trip purpose alternative during the pandemic, it was found that shopping trips were mostly made by active modes and have a low travel time. In addition, individuals did not use ridesourcing frequently for shopping, as the parameter associated with this variable was positive (0.4386), increasing utility when answer was “1—did not use ridesourcing in the month prior to the survey”. These travel services were used to make trips for “health care” purposes, according to the positive parameter obtained in the utility function of this alternative (1.2097). Differently, before the pandemic, ridesourcing was mostly used to access leisure activities (value parameter 1.0613).
It was found that UPT is used mostly to go to work during the pandemic. The parameter of the variable “Travel Mode (UPT)” (1.8714) was higher than for the “Travel Mode (Car as a driver or motorcycle)” (0.8039) during the pandemic and this difference is significant for 95% of confidence, as observed in the comparative test. However, in the period before the pandemic, the parameter for private vehicles was higher than UPT, therefore, the influence of using UPT on work trips on purpose is greater during the pandemic than before. Brazil only had 25.7% of its workforce teleworking and this possibility is restricted to individuals with greater purchasing power [60], which is not the case for most UPT users, thus it is necessary to use this service to go to work. Regarding the socioeconomic characteristics of individuals who make the main trip to work, it was found that most are men, aged between 31 and 50 years who use ridesourcing with high frequency. It was observed that this profile is similar in the two study periods.

5. Discussion and Transport Policies

From two independent samples of respondents with similar socioeconomic characteristics, it was possible to do a comparative analysis between the behavior related to the travel mode and trip purpose of the most frequent trip and frequency of ridesourcing use before and during the COVID-19 pandemic in Brazil. After identifying changes in habits that occurred in the context of the COVID-19 pandemic, the authors assessed those that may persist in the future. Even with the reopening of establishments and the return of face-to-face activities, behavior change can persist through inertia [61], so that individuals continue to act in a similar way to the pandemic period as a precaution [59]. In research conducted in Australia, evidence has shown that post-pandemic travel behaviors should be different from the pre-pandemic period [62]. Thus, based on the factors that influence the choice of travel mode and trip purpose alternatives, the authors propose public policies to mitigate the negative impacts and strengthen the positive impacts resulting from the effect of the pandemic. In order to complement the discussion, some habits were identified that did not change at the onset of the pandemic. Table 14 shows the mobility changes and habits that did not change and the policies suggested.
In the results observed in this article, it was found that during the pandemic, there was a reduction in UPT use, which is mainly used to travel long distances and for work-related purposes. In addition, the UPT quality assessment was worse. Therefore, it is feared that users will migrate to less sustainable travel modes, such as private motorized vehicles and ridesourcing, even after the COVID-19 pandemic period. In Australia, a study assumed a 20% reduction effect in public transport trips in the post-pandemic period, when compared to before the pandemic [62]. Demand for these services will increase after the pandemic, but not enough to match the pre-pandemic context. Thus, transport operators and the government need to implement policies that increase the frequency of service and, consequently, avoid overcrowded vehicles. These measures were also obtained in other surveys. For example, Moovit, a mobility and navigation app, asked its users what measures would encourage them to use UPT and increasing the fleet in circulation to avoid full vehicles was the most voted response [16].
Another proposal presented would be to reduce travel time. Ridesourcing is a competitor of Urban Public Transport in shorter trips, which have a more competitive cost with the UPT fare, and it was observed in the literature that a lower travel time in ridesourcing services is an important factor to substitute UPT with this mode [29,55,63]. In order to reduce travel time, the urban space and built environment should be considered. Increasing infrastructure for UPT, such as implementing exclusive fast lanes, would be a way to do this. Another policy suggested in the literature is to plan neighborhoods considering a balanced level of density [18]. Finally, the authors recommend increasing women’s personal safety in vehicles and stations as they are the main users of these services and harassment in UPT is frequent in Brazil [64].
From the point of view of transport operators, there are financial barriers to investing in improving the quality of the offered system. Revenue is acquired by the tariff paid by users and, considering the drop in demand for UPT in Brazil and the increase in additional costs for cleaning vehicles and stations [65], the economic crisis has affected UPT systems. From March 2020 to February 2021, the economic impact on buses was BRL 11.75 billion (nearly USD 2.22 billion dollars) and more than 18 companies had to interrupt their services [10]. Thus, the government should finance part of the operational expenses, through subsidies, improving the quality of service, and attracting users. Brazilian authors suggest a reform in the tariff policy [6] to grant more flexible contracts so that operators can seek ancillary revenues and eliminate existing cross-subsidy schemes [66]. While the subsidies are not implemented, a suggestion would be to adjust the UPT service levels based on socioeconomic characteristics and spatial needs [12].
Based on the results of this study, there is an important reduction in the constant of the utility function of UPT considering the pandemic period, compared to the previous period. A positive value of parameters associated with the variables of UPT quality assessment is also observed, corroborating the idea that comfort and adequate service frequency can increase the usefulness of the UPT, even in an exceptional situation such as the pandemic period.
Regarding ridesourcing use, different purposes for the trips were observed, in which “leisure” was the main purpose before the pandemic and during the pandemic it was “health care”. Similar characteristics were also observed between the two periods, such as the high frequency of use for work-trip purposes and the greater probability of choosing ridesourcing in shorter trips, when these services are more competitive with more sustainable travel modes, such as the UPT, indicating a possible substitution of UPT with ridesourcing. Thus, the quality of UPT needs to be improved to avoid this negative impact.
It can be observed that private cars were used more in the COVID-19 pandemic to access workplaces. In addition, there was a decrease in the frequency of ridesourcing use by car users, when compared to the period before the pandemic. In the literature, it was observed that before the pandemic there was a rate of substitution of private cars (used as a driver) by ridesourcing in Brazil of 12.5–25% [29]. In addition, the main substitution factors between these modes were avoiding using parking lots and avoiding drunk driving [29,55,63]. Thus, considering the restriction of leisure activities (which may have alcohol consumption), the decrease in mobility rates (which makes it possible to access parking areas more easily), and the high-risk perception in ridesourcing services [9], this substitution rate became lower during the COVID-19 pandemic. Demand management measures for car use, improvements in the quality of UPT services, bicycle infrastructure, and incentives for carpooling are suggested.
Regarding active modes, the results of this article demonstrate that their use occurred mostly for the “shopping” and “leisure” purposes during the pandemic. The pandemic has led to a greater use of active modes. A 50% increase in bicycle sales was observed between May and June 2020 [67]. A report prepared by Moovit in August 2020 shows that bicycle use has doubled in five Brazilian capitals: São Paulo, Rio de Janeiro, Brasília, Belo Horizonte, Recife, Porto Alegre, and Fortaleza [68].
In order for the increased choice of active modes to remain after the pandemic, investments should be made in infrastructure improvements, such as implementing cycle paths [6]. During the pandemic, temporary cycle paths were implemented in Brazilian cities, such as Belo Horizonte and Curitiba, and in cities in Europe and Latin America [69,70]. However, more investments should be made in accordance with the mobility plan of the cities so that these changes become permanent [6]. In addition, improvements in walking quality are needed, such as sidewalk infrastructure, crosswalks, planting more trees, street lighting, and improved accessibility for people with limited mobility.
The findings of the models also show that men used to choose more active modes before the pandemic and this characteristic continued during the pandemic. Women’s perceptions indicate they are more afraid when walking alone in Brazilian cities and this limits their use of public space. Therefore, increasing personal safety should also be considered when planning public policies for active mobility [54].
The reduction in travel for work purposes is related to the sudden increase in teleworking as a measure to contain the coronavirus in Brazil and in the world. Individuals who work in large companies have a higher level of education and are formally registered [6]. This way of working had already been adopted by some companies even before the pandemic and, in part, tends to continue during the post-pandemic period [58,59]. In Brazil, a survey of 1566 respondents found that 70% of teleworkers would like to continue working remotely after the pandemic [6]. Thus, more strategies are suggested for managing demand for travel through teleworking, such as a hybrid scheme to reduce trips to offices, staff rotation on different days of the week, flexibility in arrival and departure times to avoid peak hours, and full-time remote work (carried out at home) including proper social support for employees.

6. Conclusions

This article used two independent samples from two revealed preference online surveys conducted before and during the COVID-19 pandemic in all regions of Brazil. The objective was to analyze changes related to travel behavior that occurred at the onset of the pandemic. Independent sample tests were applied to identify changes in travel mode, trip purpose, and frequency of ridesourcing use. Afterwards, two mixed logit models were calibrated to analyze travel mode choice and two multinomial logit models were calibrated to identify trip purpose choices. ML and MNL models were tested and the likelihood ratio test was used to compare accuracy between them.
For future research, it is suggested to use a different sampling methodology to avoid the bias limitations of the online snowball sampling technique. In addition, other modeling methods can be applied for the trip purpose alternatives, since the mixed logit could not identify random parameters and the multinomial logit does not consider heterogeneity in behavior.
Even with the methodological limitations, it was possible to identify factors that influenced travel mode and trip purpose choice before the pandemic, and compare them with the factors observed during the pandemic. The decrease in Urban Public Transport (UPT) use in Brazil is a mobility change that was already happening before the pandemic and was intensified during the pandemic. This result concerns many researchers, scientists, and governors because of the substitution of this travel mode by less sustainable ones. It can lead to an increase in ridesourcing and private vehicles use, as observed in the results, and this change may persist in the post-pandemic period. Therefore, the analysis shows that increased frequency of service and comfort in UPT and a decrease in its cost and travel time would mitigate these negative impacts.
This article contributes to creating a more sustainable, democratic, and safe transportation system in Brazil by suggesting public policies for all travel modes to mitigate negative impacts and support positive impacts of the mobility changes observed during the pandemic. The authors suggest increasing infrastructure for active modes, reforming ridesourcing service regulations, implementing car demand management strategies, and improving UPT quality. In addition, implementing more strategies to support teleworking as a form of traffic demand management may help decrease congestion and improve traffic in cities.
For future research, it is suggested to investigate changes related to the socioeconomic characteristics of ridesourcing users in Brazil, which may have occurred at the onset of the pandemic. Before the pandemic, the profile was of young people with a high level of education and high income, according to the literature [29,63]; however, during the pandemic, it was not possible to identify them. Another research gap is the investigation of the impacts of the different active modes separately (such as walking and cycling). Furthermore, we recommend analyzing the differences in travel behavior in small, medium, and large cities in Brazil, as well as their regional particularities and availability of urban public transportation systems. Finally, conducting a survey again in the post-pandemic period will shed light on the habits that will persist in the future and the public policies that will be efficient in building a more equitable, sustainable, and safe transportation system.

Author Contributions

Conceptualization, C.S.C.; Data curation, C.S.C.; Formal analysis, C.S.C. and F.L.U.d.S.; Investigation, C.S.C.; Methodology, C.S.C. and F.L.U.d.S.; Software, C.S.C. and F.L.U.d.S.; Supervision, C.S.P.; Writing—original draft, C.S.C.; Writing—review & editing, C.S.C. and C.S.P. All authors have read and agreed to the published version of the manuscript.

Funding

This research was carried out with the financial support from the Coordination for the Improvement of Higher Education Personnel (CAPES—Finance Code 88882.379135/2019-01) and from the Brazilian National Council for Scientific and Technological Development (CNPq—Finance Code 304345/2019-9).

Institutional Review Board Statement

For this type of non-interventional study, which involves voluntary participation, ethical approval is not required by the Ministry of Health—National Council of Health. In any case, the anonymity of all participants was assured; they were fully informed why the research was being conducted and that no personal risks were associated with the survey.

Informed Consent Statement

Informed consent was obtained from all subjects involved in the study.

Data Availability Statement

Not applicable.

Acknowledgments

The authors would like to thank the researcher Ana Luiza Santos de Sá (University of Melbourne).

Conflicts of Interest

The authors declare no conflict of interest.

References

  1. Khachfe, H.H.; Sammouri, J.; Chahrour, M.; Salhab, H.A. An Epidemiological Study on COVID-19: A Rapidly Spreading Disease. Cureus 2020, 12, e7313. [Google Scholar] [CrossRef] [Green Version]
  2. Tomar, A.; Gupta, N. Prediction for the spread of COVID-19 in India and effectiveness of preventive measures. Sci. Total Environ. 2020, 278, 138762. [Google Scholar] [CrossRef]
  3. Candido, D.S.; Claro, I.M.; de Jesus, J.G.; Souza, W.M.; Moreira, F.R.R.; Dellicour, S.; Mellan, T.A.; Plessis, L.d.; Pereira, R.H.M.; Sales, F.C.S.; et al. Evolution and Epidemic Spread of SARS-CoV-2 in Brazil. Science 2020, 369, 1255–1260. [Google Scholar] [CrossRef] [PubMed]
  4. Yildirim, M.; Geçer, E.; Akgul, O. The impacts of vulnerability, perceived risk, and fear on preventive behaviours against COVID-19. Psychol. Health Med. 2020, 26, 35–43. [Google Scholar] [CrossRef] [PubMed]
  5. Parady, G.; Taniguchi, A.; Takami, K. Travel behavior changes during the COVID-19 pandemic in Japan: Analyzing the effects of risk perception and social influence on going-out self-restriction. Transp. Res. Interdiscip. Perspect. 2020, 7, 100181. [Google Scholar] [CrossRef]
  6. Rodrigues da Silva, A.N.; Pitombo, C.S.; Pedreira Júnior, J.U.; Ciríaco, T.G.M.; Costa, C.S. Changes in Mobility and Challenges to the Transport Sector in Brazil due to COVID-19. In Transportation Amid Pandemics: Practices and Policies; Elsevier: Amsterdam, The Netherlands, 2022. [Google Scholar]
  7. Our World in Data. Brazil: Coronavirus Pandemic Country Profile. Available online: https://ourworldindata.org/coronavirus/country/brazil (accessed on 22 March 2022).
  8. Haas, M.; Faber, R.; Hamersma, M. How COVID-19 and the Dutch ‘intelligent lockdown’ change activities, work and travel behaviour: Evidence from longitudinal data in the Netherlands. Transp. Res. Interdiscip. Perspect. 2020, 6, 100150. [Google Scholar] [PubMed]
  9. Shamshiripour, A.; Rahimi, E.; Shabanpour, R.; Mohammadian, A. How is COVID-19 reshaping activity-travel behavior? Evidence from a comprehensive survey in Chicago. Transp. Res. Interdiscip. Perspect. 2020, 7, 100216. [Google Scholar] [CrossRef]
  10. Beck, M.J.; Hensher, D.A. Insights into the impact of COVID-19 on household travel and activities in Australia—The early days under restrictions. Transp. Policy 2020, 96, 76–93. [Google Scholar] [CrossRef]
  11. Politis, I.; Georgiadis, G.; Papadopoulos, E.; Fyrogenis, I.; Nikolaidou, A.; Kopsacheilis, A.; Sdoukopoulos, A.; Verani, E. COVID-19 lockdown measures and travel behavior: The case of Thessaloniki, Greece. Transp. Res. Interdiscip. Perspect. 2021, 10, 100345. [Google Scholar] [CrossRef]
  12. Hu, S.; Chen, P. Who left riding transit? Examining socioeconomic disparities in the impact of COVID-19 on ridership. Transp. Res. Part D 2021, 90, 102654. [Google Scholar] [CrossRef]
  13. ANPTrilhos. Balanço Do Setor Metroferroviário 2020–2021. 2021. Available online: https://anptrilhos.org.br/balanco-do-setor-metroferroviario-brasileiro-2020-2021/ (accessed on 28 April 2021).
  14. NTU. Boletim NTU Impactos da COVID-19 No Transporte Público por ônibus 4 ed. 2021. Available online: https://www.ntu.org.br/novo/upload/Publicacao/Pub637520984974137462.pdf (accessed on 28 April 2021).
  15. ANTP. Na Pandemia, Carros Tornam-se Protagonistas Para Manter Isolamento em Deslocamentos e Até no entretenimento. 2020. Available online: http://www.antp.org.br/noticias/clippings/na-pandemia-carros-tornam-se-protagonistas-para-manter-isolamento-em-deslocamentos-e-ate-no-entretenimento.html (accessed on 28 April 2021).
  16. Moovit Relatório Global Moovit Sobre Transporte Público 2020. Moovit. 2020. Available online: https://moovitapp.com/insights/en/Moovit_Insights_Public_Transit_Index-countries (accessed on 28 April 2021).
  17. Fatmi, M.R. COVID-19 impact on urban mobility. J. Urban Manag. 2020, 9, 270–275. [Google Scholar] [CrossRef]
  18. Zhang, W.; Lu, D.; Chen, Y.; Liu, C. Land use densification revisited: Nonlinear mediation relationships with car ownership and use. Transp. Res. Part D 2021, 98, 102985. [Google Scholar] [CrossRef]
  19. Guirao, B.; García-Pastor, A.; López-Lambas, M.E. The importance of service quality attributes in public transportation: Narrowing the gap between scientific research and practitioners’ needs. Transp. Policy 2016, 49, 68–77. [Google Scholar] [CrossRef]
  20. Hadiuzzaman, M.; Das, T.; Hasnat, M.M.; Hossain, S.; Musabbir, S.R. Structural equation modeling of user satisfaction of bus transit service quality based on stated preferences and latent variables. Transp. Plan. Technol. 2017, 40, 257–277. [Google Scholar] [CrossRef]
  21. Rahman, F.; Das, T.; Hadiuzzaman, M.; Hossain, S. Perceived service quality of paratransit in developing countries: A structural equation approach. Transp. Res. Part A 2016, 93, 23–38. [Google Scholar] [CrossRef]
  22. Ferraz, A.C.P.; Torres, I.G.E. Transporte Público Urbano; São Carlos: Rima, Morocco, 2004. [Google Scholar]
  23. De Oña, J.; De Oña, R. Quality of service in public transport based on customer satisfaction surveys: A review and assessment of methodological approaches. Transp. Sci. 2013, 49, 433–719. [Google Scholar] [CrossRef] [Green Version]
  24. Joewono, T.B.; Kubota, H. User satisfaction with paratransit in competition with motorization in indonesia: Anticipation of future implications. Transportation 2007, 34, 337–354. [Google Scholar] [CrossRef]
  25. Chen, J.; Li, S. Mode Choice Model for Public Transport with Categorized Latent Variables. Hindawi Math. Probl. Eng. 2017, 2017, 7861945. [Google Scholar] [CrossRef] [Green Version]
  26. Cheng, Y.-H.; Chen, S.-Y. Perceived accessibility, mobility, and connectivity of public transportation systems. Transp. Res. Part A 2015, 77, 386–403. [Google Scholar] [CrossRef]
  27. De Oña, J.; De Oña, R.; Eboli, L.; Mazzulla, G. Perceived service quality in bus transit service: A structural equation approach. Transp. Policy 2013, 29, 219–226. [Google Scholar] [CrossRef]
  28. Han, Y.; Li, W.; Wei, S.; Zhang, T. Research on Passenger’s Travel Mode Choice Behavior Waiting at Bus Station Based on SEM-Logit Integration Model. Sustainability 2018, 10, 1996. [Google Scholar] [CrossRef] [Green Version]
  29. Sa, A.L.S.; Pitombo, C.S. Methodological Proposal for Stated Preference Scenarios Regarding an Exploratory Evaluation of Ride-Hailing Implications on Transit: A Brazilian Context Analysis. Case Stud. Transp. Policy 2021, 9, 1419–1974. [Google Scholar] [CrossRef]
  30. Dos Santos, J.B.; Lima, J.P. Quality of public transportation based on the multi-criteria approach and from the perspective of user’s satisfaction level: A case study in a Brazilian city. Case Stud. Transp. Policy 2021, 9, 1233–1244. [Google Scholar] [CrossRef]
  31. Politis, I.; Georgiadis, G.; Kopsacheilis, A.; Nikolaidou, A.; Papaioannou, P. Capturing Twitter Negativity Pre- vs. Mid-COVID-19 Pandemic: An LDA Application on London Public Transport System. Sustainability 2021, 13, 13356. [Google Scholar] [CrossRef]
  32. JHU. CSSE COVID-19 Data. 2021. Available online: https://systems.jhu.edu/research/public-health/ncov/ (accessed on 30 August 2021).
  33. IBGE. Cidades e Estados. Instituto Brasileiro de Geografia e Estatística. 2021. Available online: https://www.ibge.gov.br/cidades-e-estados (accessed on 30 August 2021).
  34. IBGE. Regiões Metropolitanas, Aglomerações Urbanas e Regiões Integradas em Desenvolvimento. Instituto Brasileiro de Geografia e Estatística. 2020. Available online: https://www.ibge.gov.br/geociencias/organizacao-do-territorio/divisao-regional/18354-regioes-metropolitanas-aglomeracoes-urbanas-e-regioes-integradas-de-desenvolvimento.html?edicao=29463&t= (accessed on 30 August 2021).
  35. Liebetrau, A.M. Measures of Association. Sage University Papers Series on Quantitative Applications in the Social Sciences, 07-004; Sage: Newbury Park, CA, USA, 1983. [Google Scholar]
  36. Kahmis, H. Measures of Association How to Choose? JDMS 2008, 24, 155–162. [Google Scholar] [CrossRef] [Green Version]
  37. Pearson, K. On the criterion that a given system of deviations from the probable in the case of a correlated system of variables is such that it can be reasonably supposed to have arisen from random sampling. Philos. Mag. 1900, 50, 157–175. [Google Scholar] [CrossRef] [Green Version]
  38. Siegel, S.; Castellan, J.N., Jr. Nonparametric Statistics for the Behavioral Sciences, 2nd ed.; Mcgraw-Hill Book Company: New York, NY, USA, 1988. [Google Scholar]
  39. Kendall, M.G. A New Measure of Rank Correlation. Biometrika 1938, 30, 81–93. [Google Scholar] [CrossRef]
  40. McFadden, D. Conditional logit analysis of qualitative choice behavior. In Frontiers in Econometrics; Academic Press: New York, NY, USA, 1974; pp. 105–142. [Google Scholar]
  41. Ben-Akiva, M.E.; Lerman, S.R. Discrete Choice Analysis: Theory and Application to Travel Demand; MIT: Cambridge, MA, USA, 1985. [Google Scholar]
  42. Train, K.E. Discrete Choice Methods with Simulation, 2nd ed.; Cambridge University Press: New York, NY, USA, 2009. [Google Scholar]
  43. Ben-Akiva, M.; Bolduc, D.; Walker, J. Specification, Identification, and Estimation of the Logit Kernel (Or Continuous Mixed Logit) Model, Working Paper. In Proceedings of the 5th Invitational Choice Symposium, Asilomar, CA, USA, 1–5 June 2003. [Google Scholar]
  44. McFadden, D.; Train, K. Mixed MNL models for discrete response. J. Appl. Econom. 2000, 15, 447–470. [Google Scholar] [CrossRef]
  45. Ye, M.; Chen, Y.; Yang, G.; Wang, B.; Hu, Q. Mixed Logit Models for Travelers’ Mode Shifting Considering Bike-Sharing. Sustainability 2020, 12, 2081. [Google Scholar] [CrossRef] [Green Version]
  46. Ortúzar, J.D.; Willumsen, L.G. Modelling Transport; John Wiley & Sons: Chichester, UK, 2011. [Google Scholar]
  47. Larranaga, A.M.; Arellana, J.; Senna, L.A. Encouraging intermodality: A stated preference analysis of freight mode choice in Rio Grande do Sul. Transp. Res. Part A Policy Pract. 2017, 102, 202–211. [Google Scholar] [CrossRef]
  48. Liu, S.; Li, Y.; Fan, W. Mixed logit model based diagnostic analysis of bicycle-vehicle crashes at daytime and nighttime. Int. J. Transp. Sci. Technol. 2021, in press. [Google Scholar] [CrossRef]
  49. R Core Team. R: A Language and Environment for Statistical Computing; R Foundation for Statistical Computing: Vienna, Austria, 2020; Available online: https://www.Rproject.org/ (accessed on 10 October 2020).
  50. Hess, S.; Palma, D. Apollo: A flexible, powerful and customisable freeware package for choice model estimation and application. J. Choice Model. 2019, 32, 100170. [Google Scholar] [CrossRef]
  51. IBM. IBM SPSS Statistics 24 Algorithms; International Business Machines: Armonk, NY, USA, 2016. [Google Scholar]
  52. IBGE. Pesquisa Nacional por Amostra de Domicílios Contínua. Instituto Brasileiro de Geografia e Estatística. 2016. Available online: https://www.ibge.gov.br/estatisticas/sociais/populacao/17270-pnad-continua.html?edicao=18971&t=o-que-e (accessed on 30 August 2021).
  53. IBGE. Censo Demográfico. Instituto Brasileiro de Geografia e Estatística. 2010. Available online: https://sidra.ibge.gov.br/tabela/1384 (accessed on 30 August 2021).
  54. Souza, A.C.S.; Bittencourt, L.; Taco, P.W.G. Women’s perspective in pedestrian mobility planning: The case of Brasília. Transp. Res. Procedia 2018, 33, 131–138. [Google Scholar] [CrossRef]
  55. Clewlow, R.R.; Mishra, G.S. Disruptive Transportation: The Adoption, Utilization, and Impacts of Ride-Hailing in the United States; Research Report; Institute of Transportation Studies, University of California: Davis, CA, USA, 2017. [Google Scholar]
  56. Loa, P.; Hossain, S.; Liu, Y.; Habib, K.N. How has the COVID-19 pandemic affected the use of ride-sourcing services? An empirical evidence-based investigation for the Greater Toronto Area. Transp. Res. Part A 2021, 155, 46–62. [Google Scholar] [CrossRef]
  57. Bracarense, L.S.F.P.; Oliveira, R.L.M. Access to urban activities during the COVID-19 pandemic and impacts on urban mobility: The Brazilian context. Transp. Policy 2021, 100, 98–111. [Google Scholar] [CrossRef]
  58. Kramer, A.; Kramer, K.Z. The potential impact of the COVID-19 pandemic on occupational status, work from home, and occupational mobility. J. Vocat. Behav. 2020, 119, 103442. [Google Scholar] [CrossRef]
  59. Wang, D.; Tayarani, M.; He, B.Y.; Gao, J.; Chow, J.Y.J.; Gao, H.O.; Ozbay, K. Mobility in post-pandemic economic reopening under social distancing guidelines: Congestion, emissions, and contact exposure in public transit. Transp. Res. Part A 2021, 153, 151–170. [Google Scholar] [CrossRef]
  60. IPEA. Potencial de Teletrabalho na Pandemia: Um Retrato no Brasil e no Mundo; Carta de Conjuntura 47; IPEA: Brasília, Brazil, 2020.
  61. Srinivasan, K.K.; Mahmassani, H.S. Modeling inertia and compliance mechanisms in route choice behavior under real-time information. Transp. Res. Rec. J. Transp. Res. Board 2000, 1725, 45–53. [Google Scholar] [CrossRef]
  62. Currie, G.; Jain, T.; Aston, L. Evidence of a post-COVID change in travel behavior—Self-reported expectations of commuting in Melbourne. Transp. Res. Part A 2021, 153, 218–234. [Google Scholar] [CrossRef]
  63. Costa, C.S.; Sá, A.L.S.; Pitombo, C.S. Análise dos fatores que influenciam a utilização do Ridesourcing no Brasil: Uma abordagem baseada no Algoritmo two-step cluster. In Proceedings of the 9th Congresso Luso-Brasileiro para o Planejamento Urbano, Regional, Integrado e Sustentável, PLURIS, Digital, Bauru, Brazil, 7–9 April 2021. [Google Scholar]
  64. SPTrans. Pesquisa da SPTrans Aponta que Mulheres são Maioria dos Passageiros de Ônibus e que Fazem Menos Teletrabalho. 2021. Available online: https://www.sptrans.com.br/noticias/pesquisa-da-sptrans-aponta-que-mulheres-sao-maioria-dos-passageiros-de-onibus-e-que-fazem-menos-teletrabalho/ (accessed on 30 August 2021).
  65. SPTrans. Protocolos do Transporte Público. 2020. Available online: http://sptrans.com.br/media/5584/protocolos-transporte-pu-blico.pdf?v=23062020_1510 (accessed on 7 August 2020).
  66. Zaban, B.; Pompermayer, F.M.; Carvalho, C.H.R. Novo modelo de contrato de mobilidade urbana: Como gerar receita, aumentar uso e reduzir custos de transporte público urbano. In Nota Técnica No. 23; IPEA—Institute of Applied Economic Research: Brasilia, Brazil, 2021. [Google Scholar]
  67. ANTP. Ciclovias Mais Largas e sem Zigue-Zagues Podem ser Legado da Pandemia. 2020. Available online: http://www.antp.org.br/noticias/clippings/ciclovias-mais-largas-e-sem-zigue-zagues-podem-ser-legado-da-pandemia.html (accessed on 28 April 2021).
  68. Moovit. Futuro da Mobilidade Urbana Brasil: São Paulo, Rio de Janeiro, Brasília, Belo Horizonte, Recife, Porto Alegre e Fortaleza; Moovit: New York, NY, USA, 2020. [Google Scholar]
  69. WRI. Ciclovias Temporárias São Resposta Sustentável de Cidades do Brasil e da América Latina à COVID-19. 2020. Available online: https://wribrasil.org.br/pt/blog/2020/07/covid-19-faz-cidades-do-brasil-e-da-america-latina-investirem-em-ciclovias-temporarias (accessed on 30 August 2021).
  70. WRI. Do Emergencial ao Permanente: Transformando a Infraestrutura Cicloviária Para além da Pandemia. 2021. Available online: https://wribrasil.org.br/pt/blog/cidades/do-emergencial-ao-permanente-infraestrutura-cicloviaria-para-alem-da-pandemia (accessed on 30 August 2021).
Figure 1. Methodological flowchart.
Sustainability 14 04573 g001
Figure 2. Timeline of COVID-19 cases and deaths series in Brazil [32].
Sustainability 14 04573 g002
Figure 3. (a) Proportion of respondents from the Brazilian states in the first survey sample (2019); (b) Proportion of respondents from the Brazilian states in second survey sample (2020).
Sustainability 14 04573 g003
Figure 4. Population of the Brazilian states [33]: AC (Acre); AL (Alagoas); AM (Amazonas); AP (Amapá); BA (Bahia); CE (Ceará); DF (Distrito Federal); ES (Espírito Santo); GO (Goiás); MA (Maranhão); MS (Mato Grosso do Sul); MG (Minas Gerais); MT (Mato Grosso); PA (Pará); PB (Paraíba); PE (Pernambuco); PI (Piauí); PR (Paraná); RJ (Rio de Janeiro); RN (Rio Grande do Norte); RS (Rio Grande do Sul); RO (Rondônia); RR (Roraima); SC (Santa Catarina); SP (São Paulo); SE (Sergipe); TO (Tocantins).
Sustainability 14 04573 g004
Table 1. Quality indicators in Urban Public Transport.
General FactorsIndicatorsLiterature Review
AccessibilityAccessibility[20,21], [22] *, [24,25,26,27]
Distance between origin/destination and station[20,25,26,27,28]
FlexibilityFrequency of service[20,21], [22] *, [26,27,28], [29] *, [30] *
Schedule reliability[20,21], [22] *, [24,27], [29] *, [30] *
Trip delays[25,26,28]
Integration between travel modes[21,24,25]
Average travel time[20,21], [22] *, [24], [29] *, [30] *
CostPayment system[20,21,24]
Cost[20,21,24,27,28], [29] *, [30] *
SafetyPersonal safety[21], [22] *, [24,28], [29] *, [30] *
Women´s safety[20]
ComfortCleaning[20,21,24,25,26,27,28], [30] *
Occupancy rate inside vehicles and stations[20,21], [22] *, [24,26,27,28], [29] *
Seat comfort[20,21,24,25,28]
* Brazilian study cases.
Table 2. Questions and sections of the two surveys.
SectionQuestions
Socioeconomic characteristicState and city of residence
Gender
Age
Level of education
Household income in minimum wages:
BRL 998.00 in 2019 (approximately USD 174.00 on 22 December 2021);
BRL 1039.00 in 2020 (approximately USD 181.10 on 22 December 2021)
Household car ownership
Exemption/discount for transit passengers
Ridesourcing useFrequency of ridesourcing use
Characteristics of respondent’s most frequent tripTravel mode
Trip purpose
Average travel time
Assessment of quality indicators of UPT in the city of residence (five points of Likert scale)General quality
Comfort
Personal safety
Frequency of service
Schedule reliability
Table 3. Variables included in each survey section and variables included in the models.
SectionVariables in Survey (Type)Variables in Logit ModelsType
Socioeconomic characteristicState and city of residence (nominal)Metropolitan regionQualitative (binary)
Gender (nominal)GenderQualitative (binary)
Age (nominal)Aged below 30 years oldQualitative (binary)
Aged between 30 and 50 years oldQualitative (binary)
Aged above 50 years oldQualitative (binary)
Household car ownership (quantitative)Household car ownershipQuantitative
Exemption/discount for transit passengers (nominal)Exemption/discount for transit passengersQualitative (binary)
Ridesourcing useFrequency of ridesourcing use (ordinal)Did not use in the previous monthQualitative (binary)
Used 1 to 5 times in the previous monthQualitative (binary)
Used 6 to 10 times in the previous monthQualitative (binary)
Used more than 10 times in the previous monthQualitative (binary)
Most frequent travelTravel mode (nominal)Active modes (bicycle and walking)Qualitative (binary)
Car as a passengerQualitative (binary)
Car as a driver or motorcycleQualitative (binary)
RidesourcingQualitative (binary)
Public transportQualitative (binary)
Trip purpose (nominal)WorkQualitative (binary)
StudyQualitative (binary)
LeisureQualitative (binary)
ShoppingQualitative (binary)
Visiting family and/or friendsQualitative (binary)
HealthQualitative (binary)
Travel time (quantitative)Travel timeQuantitative
Assessment of quality in transit (Likert Scale—1 to 5)Comfort (ordinal)Comfort 4 and 5Qualitative (binary)
Frequency of service (ordinal)Frequency of service 4 and 5Qualitative (binary)
Table 4. Independent sample tests applied for each variable.
VariablesTypeHypothesisIndependent Sample TestsConfidence Level
“Travel Mode Before”; “Travel Mode During”Qualitative (Nominal); Qualitative (Nominal)Hypothesis 0 (H0):The variables are not different
Hypothesis 1 (H1):The variables are different.
Chi-square [37]95%
“Trip purpose Before”; “Trip purpose During”Qualitative (Nominal); Qualitative (Nominal)Hypothesis 0 (H0):The variables are not different
Hypothesis 1 (H1):The variables are different
Chi-square [37]95%
“Frequency of ridesourcing use Before”;“Frequency of ridesourcing use During”Qualitative (Ordinal); Qualitative (Ordinal)Hypothesis 0 (H0):The variables are not different
Hypothesis 1 (H1):The variables are different
Chi-square [37]
Median [38]
Kendall’s Tau-b [39]
95%
Table 5. Models calibrated for the period before and during the pandemic.
VariablePeriodAlternativesModels Calibrated
Travel modeBefore pandemicCar as a passenger; active modes;
private vehicles; ridesourcing;
urban public transport
Multinomial logit;
mixed logit
During pandemicCar as a passenger; active modes;
private vehicles; ridesourcing;
urban public transport
Multinomial logit;
mixed logit
Trip purposeBefore pandemicWork; leisure;
study; other
Multinomial logit;
mixed logit
During pandemicWork; shopping;
health; other.
Multinomial logit;
mixed logit
Table 6. Description of samples before and during the pandemic.
Variables DescriptionBefore PandemicDuring PandemicVariables DescriptionBefore PandemicDuring Pandemic
Household income range (MW/Month) n%n%Gendern%n%
<1 minimum wage (MW) *335.3%122.6%Female34555.2%25654.7%
1–3 MW15324.5%12426.5%Male27844.5%20944.7%
3–6 MW14122.6%13027.8%Others20.3%30.6%
6–9 MW10416.6%6313.5%Agen%n%
9–12 MW7011.2%469.8%<1830.5%10.2%
>12 MW12419.8%9319.9%18–2422936.6%13128.0%
Level of educationn%n%25–3021634.6%16334.8%
Elementary school00.0%30.6%31–407812.5%5511.8%
High school233.7%194.1%41–50416.6%347.3%
Undergraduate without degree20933.4%13729.3%51–60457.2%5211.1%
Undergraduate with degree20733.1%15633.3%>60 132.1%326.8%
Graduate18629.8%15332.7%Household car ownershipn%n%
Exemption/discount for transit passengersn%n%018930.2%12626.9%
No43169.0%33872.2%123938.2%19140.8%
Yes (others)71.1%51.1%212520.0%10121.6%
Yes (student)17728.3%10923.3%3599.4%377.9%
Yes (elderly)101.6%163.4%4 or more132.1%132.8%
* Minimum Wage (MW)—BRL 174 in 2019 (before sample) and BRL 181 in 2020 (during sample). Currency conversion on 22 December 2021.
Table 7. Characterization of the most frequent trips and ridesourcing use.
Variables DescriptionBefore PandemicDuring PandemicVariables DescriptionBefore PandemicDuring Pandemic
Trip Purposen%n%Travel Moden%n%
Shopping91.4%16835.9%Active modes (bicycle or walking)6710.7%6113.0%
Study21634.6%61.3%Car (passenger)426.7%5511.8%
Visiting family and/or friends71.1%6113.0%Car (driver)21734.7%20443.6%
Leisure477.5%163.4%Motorcycle111.8%102.1%
Health50.8%4810.3%Ridesourcing7311.7%6513.9%
Work33453.4%16535.3%Taxi50.8%30.6%
Other71.1%30.6%Bus15925.4%5912.6%
Frequency of ridesourcing use in previous monthn%n%Subway396.2%71.5%
0 (did not use)7111.5%19742.1%Train81.3%20.4%
1 (1–3 trips)16827.4%14831.6%Other40.6%20.4%
2 (4–5 trips)14323.3%5211.1%
3 (6–10 trips)10817.6%367.7%
4 (>10 trips)13522.0%357.5%
Table 8. Urban Public Transport quality assessment.
Quality Indicators 1 (Very Poor)2 (Poor)3 (Regular)4 (Good)5 (Very Good)
BeforeDuringBeforeDuringBeforeDuringBeforeDuringBeforeDuring
Overall qualityn194457577084532857
%9%20%28%26%34%38%26%13%2%3%
Comfortn527965615645282738
%25%36%32%28%27%20%14%12%1%4%
Securityn536651715455422147
%26%30%25%32%26%25%21%10%2%3%
Frequency of servicen355355746262432596
%17%24%27%34%30%28%21%11%4%3%
Schedule reliabilityn4655415545645738158
%23%25%20%25%22%29%28%17%7%4%
Table 9. Description of the quantitative variable “travel time (minutes)”.
SampleMeanStandard DeviationMinimumFirst QuartileThird QuartileMaximum
Before30 min33 min5 min.10 min35 min240 min
During26 min24 min5 min10 min30 min240 min
Table 10. Comparative analysis between travel behavior variables in two different periods.
Before × DuringFrequency of Ridesourcing UseTravel ModeTrip Purpose
Number of observations95210931093
Pearson’s chi-square67.28753.96479.907
Degrees of freedom476
p-value0.0000.0000.000
Cramer’s V0.2660.2220.663
p-value0.0000.0000.000
Contingency coefficient0.2570.2170.552
p-value0.0000.0000.000
Median2 (4–5 trips)--
Chi-square35.036--
Degrees of freedom1--
p-value0.000--
Kendall’s Tau-b−0.231--
p-value0.000--
Table 11. Travel mode models.
Models StatisticsMNL Travel Mode before PandemicML Travel Mode before PandemicMNL Travel Mode during PandemicML Travel Mode during Pandemic
Number of observations609609457457
Number of parameters15161819
Log-likelihood (start)−980.1477−980.1477−735.5131−735.5131
Log-likelihood (final)−668.0266−658.1786−484.8149−470.4771
Adj. rho-square0.30310.31220.31640.3345
AIC1366.051348.361005.63978.95
Likelihood ratio test19.69628.6756
Table 12. Estimates of the mixed logit models (travel mode).
AlternativeVariableML Travel Mode before PandemicML Travel Mode during PandemicConfidence Interval of Parameters before ModelParameter Comparison
EstimateEstimate
Car (passenger)Constant00--
Active modes (bicycle or walking)Constant2.2208 ***−0.0009 ***1.58 to 2.86Different
Trip purpose (shopping)-1.4349 ***--
Trip purpose (leisure)-2.1795 ***--
Travel time−0.0239 **---
Metropolitan region−1.8740 ***−0.6569 *−2.52 to −1.23Different
Gender−0.9009 ***−0.6839 **−1.49 to −0.31Similar
Car (driver) or motorcycleConstant−0.7938 **−3.5065 ***−1.41 to −0.18Different
Household car ownership1.3252 ***3.7087 ***1.07 to 1.58Different
Trip purpose (work)0.9604 ***1.1550 *0.48 to 1.44Similar
Frequency of ridesourcing use (0)0.7266 **2.5105 ***0.05 to 1.40Different
Age (31–50)0.8901 ***---
RidesourcingConstant0.43260.6837 *--
Frequency of ridesourcing use (3 and 4)1.5961 ***1.5419 ***0.97 to 2.22Similar
Travel time−0.0554 ***−0.0590 ***−0.09 to −0.02Similar
Trip purpose (health)-1.3214 ***--
Trip purpose (leisure)1.2385 ***---
Public transport (bus, subway, train)Constant0.4739−1.9757 ***−0.16 to 1.11Different
Travel time0.04151 ***0.0248 ***0.02 to 0.06Similar
Trip purpose (work)-2.1724 ***--
Assessment of comfort in PT (4 or 5)-1.3841 **--
Assessment of frequency of service in PT (4 or 5)-1.3475 **--
Significance: *** p < 0.01, ** p < 0.05, * p < 0.1. Variables: 1. Trip purpose (activity): binary variable, in which 0 = travel purpose is not this activity, and 1 = travel purpose is this activity. 2. Metropolitan region: binary variable, in which 0 = respondent does not live in metropolitan region, and 1 = respondent lives in metropolitan region. 3. Gender: binary variable, in which 0 = male, and 1 = female and others. 4. Frequency of ridesourcing use (0): binary variable, in which 0 = used ridesourcing services at least 1 time in the previous month, and 1 = did not use ridesourcing services in the previous month. 5. Age (31–50): binary variable, in which 0 = do not belong to this age group, and 1 = belong to this age group. 6. Frequency of ridesourcing use (3 and 4): binary variable, in which 0 = used ridesourcing services of less than 6 times in the previous month, and 1 = used ridesourcing services at least 6 times in the previous month. 7. Assessment of comfort in PT (4 or 5): binary variable, in which 0 = did not select grade “4” or “5”, and 1 = selected grade “4” or “5” in the Likert scale. 8. Assessment of frequency of service in PT (4 or 5): binary variable, in which 0 = did not select grade “4” or “5”, and 1 = selected grade “4” or “5” in the Likert scale.
Table 13. Estimates of the multinomial logit models (trip purpose).
AlternativeVariableMNL Trip Purpose
before Pandemic
MNL Trip Purpose during PandemicConfidence Interval of Parameters before Pandemic ModelParameter Comparison
EstimateEstimate
OthersConstant = 0Trip purpose:
visiting family and/or friends + shopping + health
Trip purpose:
leisure + study + visiting family and/or friends
--
ShoppingConstant-3.9186 ***--
Travel mode (bicycle or walking)-1.0151 ***--
Travel time-−0.0403 ***--
Frequency of ridesourcing use (0)-0.4386 *--
HealthConstant-2.7947 ***--
Travel mode (ridesourcing)-1.2097 ***--
WorkConstant2.9758 ***2.8211 ***2.20 to 3.75Similar
Travel mode (UPT)0.6393 ***1.8714 ***0.18 to 1.10Different
Travel mode (car as a driver or motorcycle)0.7552***0.8039 ***0.29 to 1.22Similar
Gender−0.3042 *−0.4026 *−0.66 to 0.05Similar
Age (31–50)-0.7201 ***--
Travel time-−0.0138 **--
Frequency of ridesourcing use (3 or 4)0.8099 ***1.1739 ***0.42 to 1.20Similar
LeisureConstant1.6570 ***---
Travel mode (Ridesourcing)1.0613 ***---
StudiesConstant1.3291 ***---
Exemption/discount for transit passengers1.7644 ***---
Age (30 or less)1.5533 ***---
Model statistics
Number of observations609457
Number of variables1014
Log-likelihood (start)−844.2533−633.5365
Log-likelihood (final)−509.4485−450.1603
Adj. rho-square0.38470.2689
AIC 1038.9926.32
Significance: *** p < 0.01, ** p < 0.05, * p < 0.1. Variables: 1. Travel mode (mode): binary variable, in which 0 = do not use this travel mode, and 1 = use this travel mode. 2. Frequency of ridesourcing use (0): binary variable, in which 0 = used ridesourcing services at least 1 time in the previous month, and 1 = did not use ridesourcing services in the previous month. 3. Gender: binary variable, in which 0 = male, and 1 = female and others. 4. Age (31–50): binary variable, in which 0 =do not belong to this age group, and 1 = belong to this age group. 5. Frequency of ridesourcing use (3 and 4): binary variable, in which 0 = used ridesourcing services of less than 6 times in previous month, and 1 = used ridesourcing services at least 6 times in previous month. 6. Exemption/discount for transit passengers: binary variable, in which 0 = do not have exemption or discount in PT fare, and 1 = have exemption/discount in PT fare. 7. Age (30 or less): binary variable, in which 0 = do not belong to this age group, and 1 = belong to this age group.
Table 14. Summary of travel behavior changes and policies suggested.
AlternativeMobility ChangesMobility Habits Not ChangedPolicies Suggested
Urban Public TransportDecrease in use;
decrease in UPT Quality
Use in longer trips (high travel time).Increase frequency of service in UPT;
increase comfort of UPT;
reform pricing regulations [6];
decrease travel time of UPT trips;
adjust the UPT service levels based on socioeconomic characteristics and spatial needs [12].
RidesourcingIncrease in use for UPT users;
decrease in use for car users.
Users choose these services at least 6 times per month; use in shorter trips (low travel time).Increase UPT quality of service;
reform ridesourcing service regulations.
Private vehiclesDecrease in trips; increase in use for individuals that own a carUse for work tripsImplement car demand management strategies;
increase UPT quality of service;
increase shared mobility strategies [6];
increase bicycle infrastructure [6].
Active modesIncrease in use for “shopping” and “leisure” purposesMore use when gender is maleIncrease infrastructure for active modes (walking infrastructure, cycling infrastructure, greener cities, etc.);
increase security for women on the streets.
Travel purpose workDecrease in work-related trips (teleworking)-Implement more strategies to support teleworking as a form of traffic demand management.
Publisher’s Note: MDPI stays neutral with regard to jurisdictional claims in published maps and institutional affiliations.

