Article

Social Psychology and the Willingness of Different Citizens to Participate in a Car Lottery

1
Faculty of Urban Construction, Beijing University of Technology, Beijing 100124, China
2
Beijing Key Laboratory of Traffic Engineering, Beijing University of Technology, Beijing 100124, China
*
Authors to whom correspondence should be addressed.
Sustainability 2022, 14(2), 944; https://doi.org/10.3390/su14020944
Submission received: 10 December 2021 / Revised: 12 January 2022 / Accepted: 12 January 2022 / Published: 14 January 2022
(This article belongs to the Collection Sustainable Transport Economics, Behaviour and Policy)

Abstract

:
To investigate citizens’ participation behavior in the lottery under the influence of the license plate lottery policy (LPLP) and to guide them to participate in the lottery rationally, this paper, based on social psychology and combined with the theory of planned behavior, divides citizens into citizens with cars in their households and citizens without cars in their households. This study then separately constructs structural equation models, sets perceived car necessity (PCN), perceived behavioral control (PBC), attitude toward car ownership (ATT), and subjective norms (SN), respectively. These four psychological latent variables were used to analyze the participation behavior of different categories of citizens in the car lottery from the perspective of psychological factors. Our empirical study found that there are significant differences in age and the number of people living together. The mechanism of their intention to participate in the car lottery and the psychological factors are different. The psychological factors affecting the intention of people with a car and people without a car to participate in the car lottery are SN > ATT > PCN > PBC and ATT > SN > PBC, respectively. Our research results can help to identify the internal factors and mechanisms that influence citizens’ intention to participate in the car lottery and help government administrators to optimize the LPLP.

1. Introduction

To alleviate a series of environmental and traffic problems caused by the rapid growth of motor vehicles [1,2,3], Shanghai, Beijing, Guangzhou, Shenzhen, Hangzhou, Tianjin and Hainan have introduced a vehicle purchase restriction policy, shown in Table 1. Beijing, in 2011, launched the license plate lottery policy (LPLP) for citizens who would like to purchase passenger vehicles to stabilize the newly issued license plate registration number at 100,000 vehicles per year [4]. Since the implementation of the LPLP, the number of lottery participants has increased, while the winning rate has rapidly decreased due to the total volume control of the issued license plate. The benchmark winning rate has dropped from 1:10.6 in 2011 of the first period to 1:3120 in the sixth period of 2020. In the sixth period of 2020, the number of valid codes was 20370763, the number of quota allocations was 6370, and the winning rate was 1:3120 [5].
Subsequently, in 2014, the Beijing government added the license plate queuing policy for new energy vehicles (NEV) registration to the LPLP, providing an alternative way for citizens with urgent car needs to obtain a license plate quota [6]. Under the influence of the government’s incentive policy for NEVs, a larger number of license plate applicants have shifted to the NEV one, making the queue for the purchase of new energy vehicles grow rapidly. As of November 2019, the number of valid codes for new energy minibus indicators has increased to 448,576 [5]. If citizens currently join the NEV queue, they are expected to obtain a NEV purchase quota in 2028. In Beijing, the number of people who are participating in the motor vehicle lottery is large. Similarly, the number of citizens who have motor vehicles in their families but still participate in the lottery is large, further increasing the difficulty of obtaining a license plate quota for citizens who do not have cars in their families but have a high demand for cars [7].
The above results indicate that the situation for citizens obtaining a license plate quota is very critical [8]. In some cases, not everyone who participates in the LPLP has an urgent need to own and use a motor vehicle, and there is no shortage of people who participate in the lottery with a “queuing” mentality [9]. Situations such as these have made it more difficult for a citizen to obtain a license plate quota. The participation of people without car needs in the lottery can make it difficult for people with car needs to win the quota in time. How to use the policy to guide people to participate in the LPLP rationally and level out the probability of winning the lottery from the perspective of demand has become a challenge for the administrators. Therefore, it is important to analyze the influencing factors of citizens’ participation in the LPLP from the perspective of their psychology to find the right guiding measures to lead them to participate rationally in the LPLP and thus build a more relaxed environment for car purchasing.
Ever since Singapore pioneered the motor vehicle purchase restriction policy in the 1990s, scholars have continued to study motor vehicle purchase restriction policies. Liu described the motor vehicle purchase restriction policies in Beijing, Tianjin, Shanghai, and Guangzhou and analyzed the effects of these policies on the local private car stock. The results show that the purchase restriction policies have kept the car stock per 1000 people in these cities at a relatively stable level as the economy grows [10]. Sandel argued that both lotteries and auctions are generic methods of allocating limited public resources [11]. Yang analyzed the impact of the motor vehicle purchase restriction policy on energy consumption from the perspective of energy consumption [12]. An evaluation of the Beijing vehicle purchase restriction policy was conducted by Su [13]. Wang found that the lottery is a tool for the rich to speculate rather than a solution for the poor by studying the motor vehicle purchase restriction policy in Guangzhou [14]. Jianwei Ma analyzed the impact of the lottery restriction policy on consumers’ car purchase choices from an economic perspective [15]. Junze Zhu analyzed the impact on citizens’ participation behavior in the car lottery from the perspective of increasing the cost of citizens’ participation in lottery [16]. Li proposed an optimization and improvement method for the current lottery restriction policy indicator allocation scheme [17]. Li conducted a theoretical analysis of three alternative car ownership rationing schemes, including lottery, auction, and hybrid schemes, and proposed an analytical model for determining the optimal automatic quota for each scheme and the optimal allocation ratio between lottery and auction in the hybrid scheme [18]. Zhuge focused on Beijing’s motor vehicle purchase restriction policy, using the agent-based spatially integrated urban model SelfSim-EV, for investigating how the policy may affect electric vehicle use at the individual level over time [19]. However, little research has been done on how the LPLP works in terms of the public’s participation behavior in the lottery.
Researchers have studied the aspect of public participation in transportation planning and available tools to support that process. Kazak’s research found the high usefulness of the analyzed decision support system to solve the problem of public transport design [20]. Soegoto gave advice related to the transportation inspection by using a decision support system [21].
In addition, the influence of psychological factors on choice behavior has received increasing scholarly attention. Lars examined which variables drive the intention to reduce car use by modeling the structure of a phase of change with mechanisms in the theory of planned behavior (TPB) and the normative activation model (NAM) [22]. Wang used the theory of planned behavior as the basis of his research to explore the gap between intention and environmental behavior in waste separation policy in China, and the results showed that perceived policy effectiveness and actual behavioral control had a positive effect on behavioral intention, implementation intention, and environmental behavior [23]. Peng Ju integrated the psychological factors influencing car-sharing behavior into the traditional discrete choice model to study travelers’ choice of car-sharing behavior; the results showed that latent psychological variables such as travelers’ perceived usefulness of car-sharing positively influenced their choice behavior, and the model had higher fitness than the traditional model without latent variables [24]. Peng Jing proposed an extended theory of planned behavior (ETPB) to delve into the psychological factors that result from the influence of adults’ cognitive and behavioral habits [25]. Haustein et al. compared the electric vehicle user group with the conventional vehicle user group using the theory of planned behavior based on a Swedish online survey and showed that the acceptance of electric vehicles is the most important factor influencing citizens’ choice of electric vehicles [26]. Zhang constructed a structural equation model of travel mode choice considering the non-differential threshold in the framework of the classical theory of planned behavior, taking into account the “sensitivity of travelers to changes in mode costs” [27]. Oretiz-Peregrina studied the factors influencing distracted driving using the theory of planned behavior [28]. Mingyu Huo used the theory of planned behavior to study the behavior of Chinese people using cell phones while crossing the street [29]. Huiling Wang used the theory of planned behavior as a basis to explore the relationship between willingness and environmental behavior in the new waste separation policy in China [30]. Ange Wang used the theory of planned behavior to explore the intention to share parking spaces from the perspective of private urban parking space owners at different levels [31].
Previous studies have shown that psychological factors, especially social factors, have an important influence on citizens’ choice behavior, which in turn affects people’s related behaviors. However, an analysis of the existing research literature shows that no scholar has yet studied the participation behavior of different categories of citizens in the LPLP in terms of social psychology. Therefore, this paper extends the perceived car necessity (PCN) based on the TPB and divides participating citizens into those with cars and those without cars according to their household car ownership. This paper then establishes structural equation models to examine the intrinsic factors affecting the participation behavior of different categories of citizens in car lottery and their mechanisms of action from the perspective of social psychology to provide a reference basis for improving motor vehicle demand management and motor vehicle lottery restriction policies and guiding citizens to participate in the lottery rationally.
The remainder of the thesis is organized as follows: Section 2 constructs a model of citizens’ participation behavior in the LPLP and its influencing factors based on the theory of planned behavior, provides a structural equation modeling approach and proposes research hypotheses. Section 3 describes the design of the questionnaire, the data collection using Beijing as an example, and the preliminary data statistics. The reliability of the latent variables and the results of the analysis of the structural equation model of different citizens are given in Section 4. Section 5 proposes corresponding policy recommendations for the optimization and adjustment of citizen participation in LPLP based on the results of the model analysis. Finally, Section 6 summarizes the main contents of this study and provides an outlook on future research directions.

2. Methods

2.1. Structural Equation Modeling (SEM)

Structural equation modeling (SEM), also known as structural analysis of covariance, is a method for building, estimating, and testing causal models that contain explicit observable variables and latent variables that are not directly observable. Structural equation modeling combines the traditional multivariate statistical analysis of “factor analysis” and “regression analysis of linear models”, which can not only quantitatively analyze the interrelationships between multiple variables but also analyze the direct and indirect effects between variables. It also gives the overall goodness of fit of the model, not just the significance of the model coefficients [32]. Structural equation modeling is widely used in various fields of economics, marketing, psychology, and sociology [33,34,35]. As the complexity of scientific research problems in traffic behavior increases, more and more scholars are introducing structural equation models into the field of traffic behavior research [36,37].
A complete structural equation model with latent variables consists of two sub-models together: the measurement model and the structural model.
(1)
The measurement model is mainly used to verify the relationship between latent and observed variables, and its expressions are as follows:
y = Λ y η + ε
x = Λ x ξ + δ
In the formula:
x, y: denote the vectors composed of endogenous and exogenous indicators, respectively.
η, ξ: denote endogenous latent variables and explicit exogenous variables, respectively.
Λ x : the factor loading matrix of x on η, representing the relationship between endogenous indicators and endogenous latent variables.
Λ y : the factor loading matrix of y on ξ, representing the relationship between exogenous indicators and exogenous latent variables.
ε, δ: denote the error terms between the endogenous and exogenous indicators, respectively;
(2)
The structural equation is mainly used to verify the causal relationship between latent variables and latent variables, and its expression is as follows:
η = B η + Γ ζ + ζ
In the formula:
B: coefficient matrix, indicating the relationship between the endogenous latent variables.
Γ: coefficient matrix, indicating the effect of exogenous latent variables on endogenous latent variables.
ζ: denotes the residual term of the structural equation.

2.2. Theory of Planned Behavior

Social psychology is a theoretical system that focuses on the psychology of people in a social environment. It is the study of the psychological and behavioral patterns of individuals and groups in social interaction. The representative theory is the theory of planned behavior (TPB), firstly proposed by Ajzen et al. It can explain the decision-making process of general behavior. The theory believes that individual behavioral decisions are determined by their behavioral intentions, which in turn are jointly influenced by the combination of attitudes, subjective norms, and perceived behavioral control [38]. The following hypotheses are proposed.
Hypothesis 1 (H1).
Citizens’ attitudes toward car ownership (ATT) are positively related to their behavioral intention to participate in the LPLP.
Hypothesis 2 (H2).
Citizens’ subjective norms (SN) are positively correlated with their intention to participate in the LPLP.
Hypothesis 3 (H3).
Citizens’ perceptual behavioral control (PBC) is positively related to their behavioral intention to participate in the LPLP.
Hypothesis 4 (H4).
Citizens’ perceived behavioral control (PBC) is positively correlated with participation behavior in the LPLP.
Hypothesis 5 (H5).
Citizens’ behavioral intention to participate in the LPLP (BI) is positively correlated with participation behavior in the LPLP. Haustein added perceived mobility necessity (PMN) to the TPB, defining PMN as people’s perception of mobility-related influences in their living environment and arguing that it affects travel mode choice and that PMN is determined by actual needs [39]. He thought PBC is positively related to PMN, and that PMN is positively correlated with behavioral intention and behavior. Many subsequent studies have extended PMN to the theory of planned behavior in travel behavior studies [40,41,42]. The demand for car use affects the willingness of citizens to participate in LPLP [9]. Therefore, this paper combines the PMN and extends the perceived car necessity (PCN) latent variable based on the TPB.
Hypothesis 6 (H6).
Citizens’ perceptual behavioral control (PBC) is positively related to citizens’ perceived car necessity (PCN).
Hypothesis 7 (H7).
Citizens’ perceived car necessity (PCN) is positively correlated with their intention to participate in the lottery.
Hypothesis 8 (H8).
Citizens’ perceived car necessity (PCN) is positively correlated with participation in lottery selection behavior.
We constructed an extended theoretical model of planned behavior that includes the PCN, psychological factors, intention to participate in the LPLP, and participation behavior in the LPLP, as shown in Figure 1, in which the behavioral intention to participate in the LPLP (BI) is used as the mediating variable. The outcome of behavioral intention is whether to choose to participate in the LPLP (Behavior). The following hypotheses are proposed.
Based on the above theory, this paper constructs a structural equation model of willingness to participate in the LPLP, uses the model to analyze the factors influencing willingness to participate in the LPLP, and analyzes the influence of psychological factors on citizens’ participation behavior in the LPLP through the parameters in the model. The model includes 5 latent variables, PCN, SN, PBC, ATT, and BI, and 27 measured variables. The specific descriptions of each latent variable and its measurement variables are shown in Table 2, where the measurement variables are measured by referring to the question items of the relevant domestic and international TPB [38] using the Likert (Likert) five-level scale.

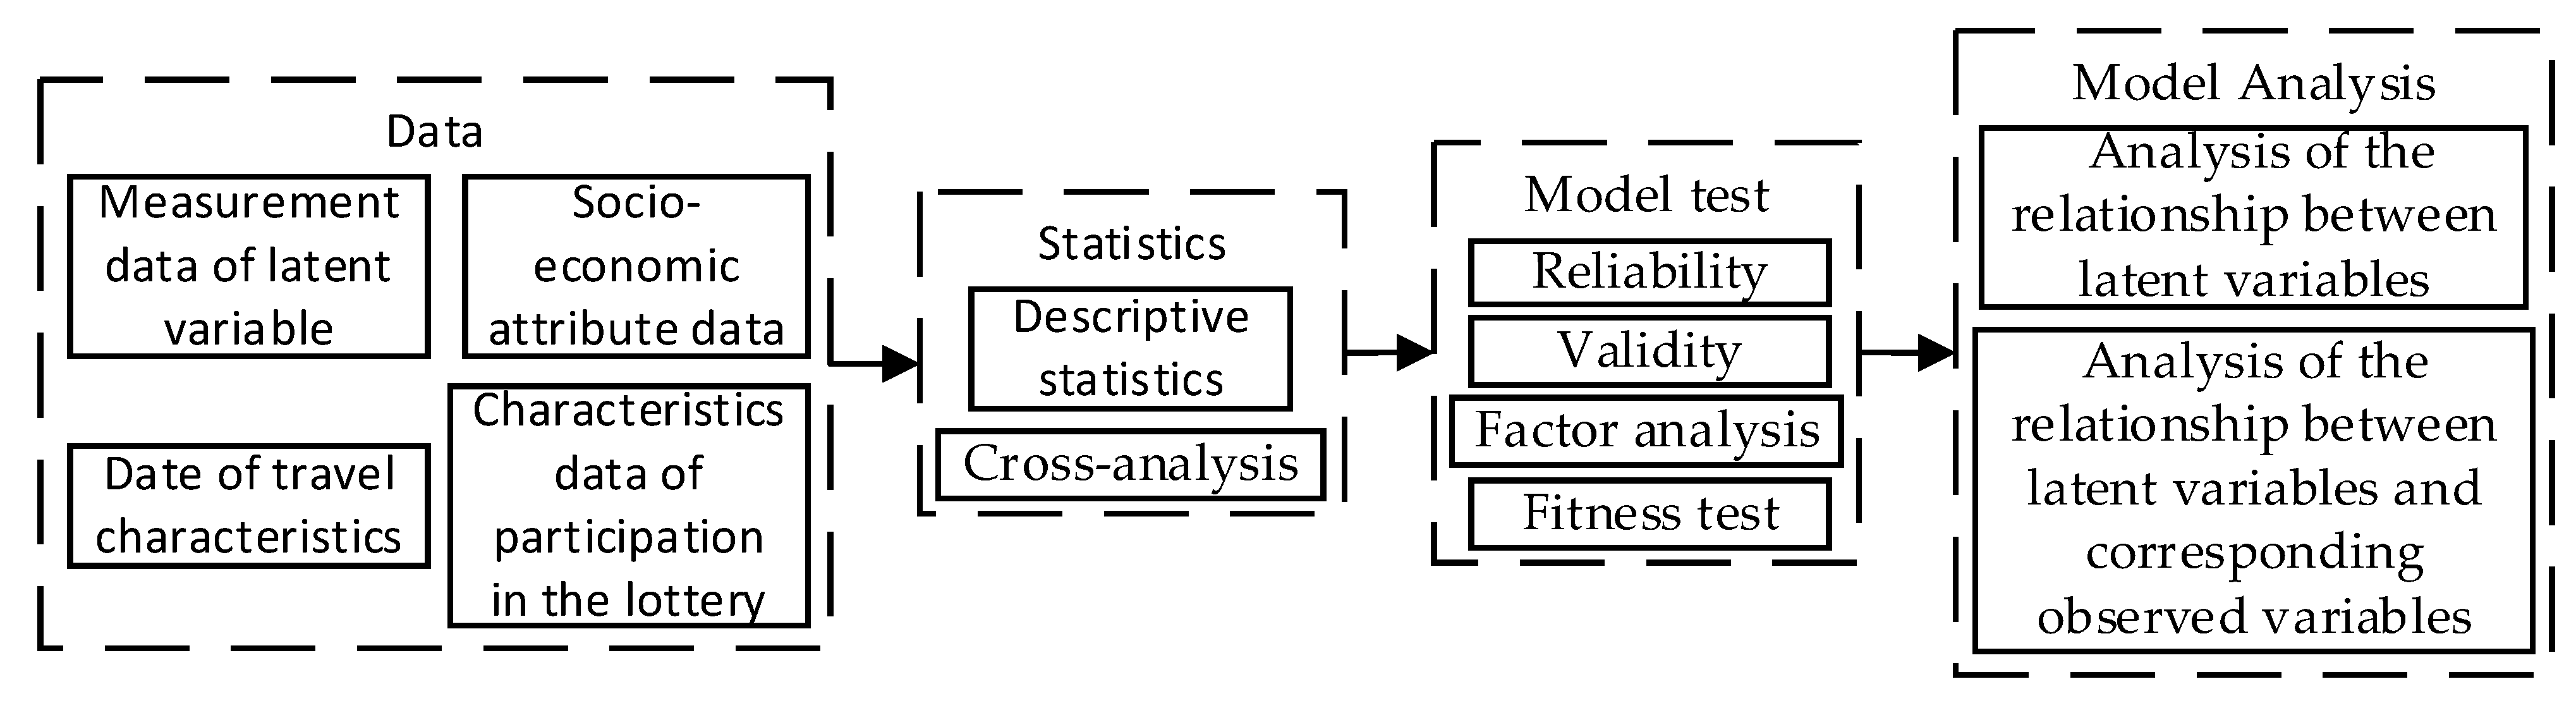
2.3. Methodological Steps

The required data include latent variable measures, socioeconomic attributes, participation shake characteristics, and travel characteristics. The latent psychological variables are those mentioned in Section 2.2. Socioeconomic attributes include gender, occupation, education level, number of household members, annual household income, and number of vehicles in the household. Participation characteristics include the number of household households eligible for the lottery, the number of households participating in the lottery, the time of participation in the lottery, and the participation behavior in the lottery. The travel characteristics include the number of households with commuting needs by car, daily travel distance, and travel mode.
After obtaining the data, statistical analyses were first performed, which included descriptive statistics of individual socioeconomic attributes and cross-tabulations of individual socioeconomic attributes and participation in the shakeout behavior. This was followed by reliability tests, validity tests, factor analyses, and fitness tests of the latent psychological variables. This was followed by model analysis, path analysis between the latent variables and path analysis between the measured variables and the corresponding latent variables, as shown in Figure 2.

3. Questionnaire Survey, Descriptive Statistics and Inspection

In Beijing, smartphones are widely available, and web-based questionnaires reach more people than face-to-face questionnaires, so online questionnaires were chosen. This paper obtains empirical data through a questionnaire survey, and the respondents are mainly people who are eligible for the lottery (holding a motor vehicle license and no motor vehicle in their name). To ensure the reliability of the sample, as well as richness, the questionnaire describes the current LPLP scenarios in Beijing so that all respondents can empathize with them, and respondents answer according to their reality in the LPLP scenarios. The questionnaire mainly includes information on respondents’ personal and household socioeconomic attributes and willingness to participate in the lottery table.
The survey was conducted on 13 August 2019 through a web-based questionnaire issued by Questionnaire Star and took 3 weeks. A total of 528 questionnaires were collected, of which 430 were valid, accounting for 81.4%. To conduct SEM analysis, the ratio of the sample size to the observed variables must be at least 5:1 [43]. This paper constructs a structural equation model with 26 observed variables, so the minimum sample size is 130, and the number of valid questionnaires is greater than 260. Hence, the sample size meets the requirements.
For a finite population, the sample sampling size formula is as follows [44]:
n N ( α k ) 2 N 1 P ( 1 P ) + 1
In the formula:
n is the sample demand;
N is the population;
α is the significance level;
k is quantile;
P is usually set to 0.5, because a setting of 0.50 yields the most plausible sample size.
Generally, the significance level α was set to 0.05, the quantile k was 1.96, the number of participants in the shake was 3.3 million, and the minimum sample size n was calculated to be about 384. The number of valid questionnaires was 430 over 384, meeting the requirement.

3.1. Descriptive Statistics Analysis

Descriptive statistics were conducted on the socioeconomic attributes of individuals in the sample. There are slightly more men than women, accounting for 58.14%; the education level is mostly undergraduate, accounting for 36.98%; 32.56% of them have annual household income distributed from 50,000 to 100,000 yuan; 74.65% of them are qualified to participate in the LPLP (legally holding a driver’s license and no registered motor vehicle in their name), and the number of household members living together is mostly 3. Information on personal socioeconomic attributes is shown in Table 3.
According to the Beijing Seventh National Population Census Bulletin, the survey results of the seventh national census in Beijing in 2020 show that there are slightly more males than females in Beijing at present, and a higher proportion has an education level of university or above. Therefore, the survey data in this paper are consistent with the data of the seventh census in Beijing and are representative of the population. Thus, the data can represent the overall circumstances of participation in the lottery among permanent residents of Beijing and can be used for the analysis described in the subsequent chapters.

3.2. Analysis of the Difference between Citizens with a Car in the Household and Those without a Car in the Household

In the questionnaire survey, we investigated “Would you choose to participate in the lottery?”. The results of the survey are shown in Figure 3. The proportion of people who choose to participate in the lottery is more than 50% in general, s well as for the proportion of people who have a car in their family and people who do not have a car in their family.
Next, we used correlation tests to filter out the socioeconomic attributes of citizens with and without a car in the household and compared them, as shown in Figure 4. We found that:
  • The group of citizens without a car in the household is younger than those with a car in the household, with the proportion of those distributed under 30 years old exceeding 60%;
  • The group without a car has a higher education level than the group with a car, with 46.1% of those with postgraduate education or above;
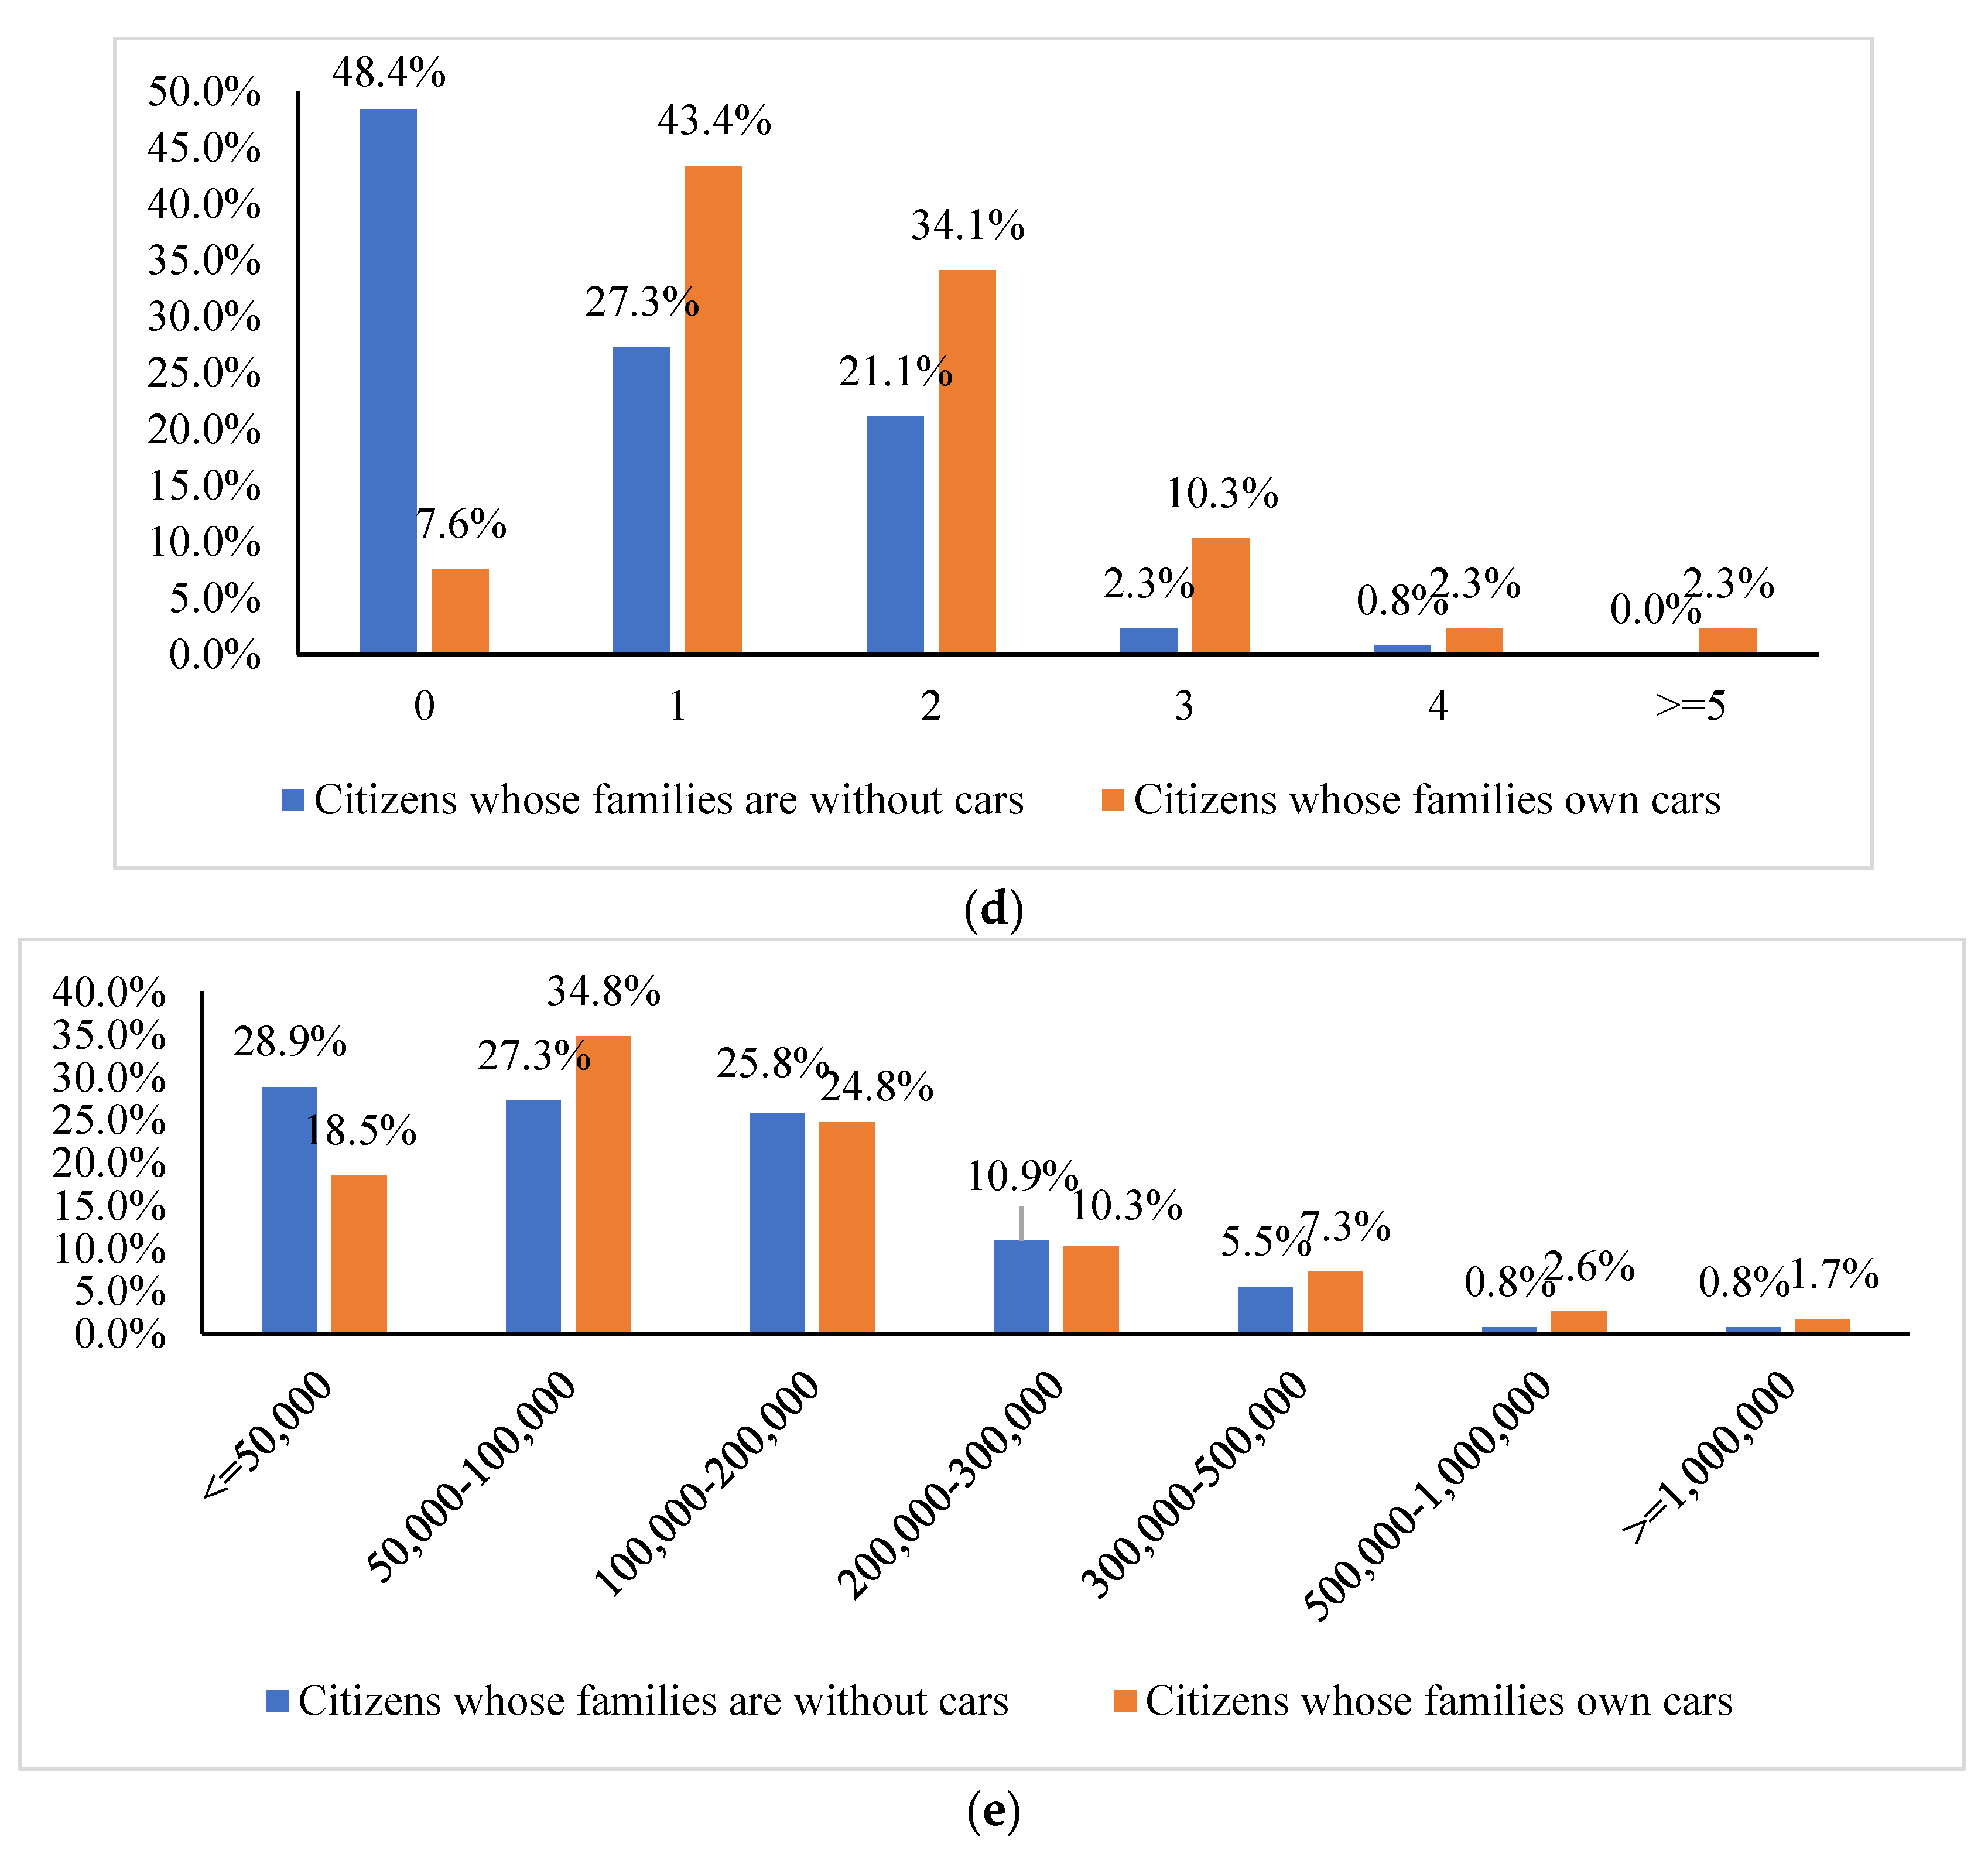
  • The number of people without a car in their family is smaller, 28.9% live alone, 20.3% live with two people, 28.1% live with three people, while the number of people with a car in their family is higher for those with a car, 37.4% live with three people, 26.5% live with four people, and 16.9% live with five or more people;
  • In terms of the number of people living together who commute by car, 48.4% of the group without a car don’t need to commute by car, while 92.4% of the group with a car need to commute by car;
  • In terms of annual income, the annual income of people without a car in their family is relatively lower than that of people with a car in their family.
A cross-analysis of individual socioeconomic attributes and choice for household car-owning citizens and citizens without a car in their family can be obtained:
(1)
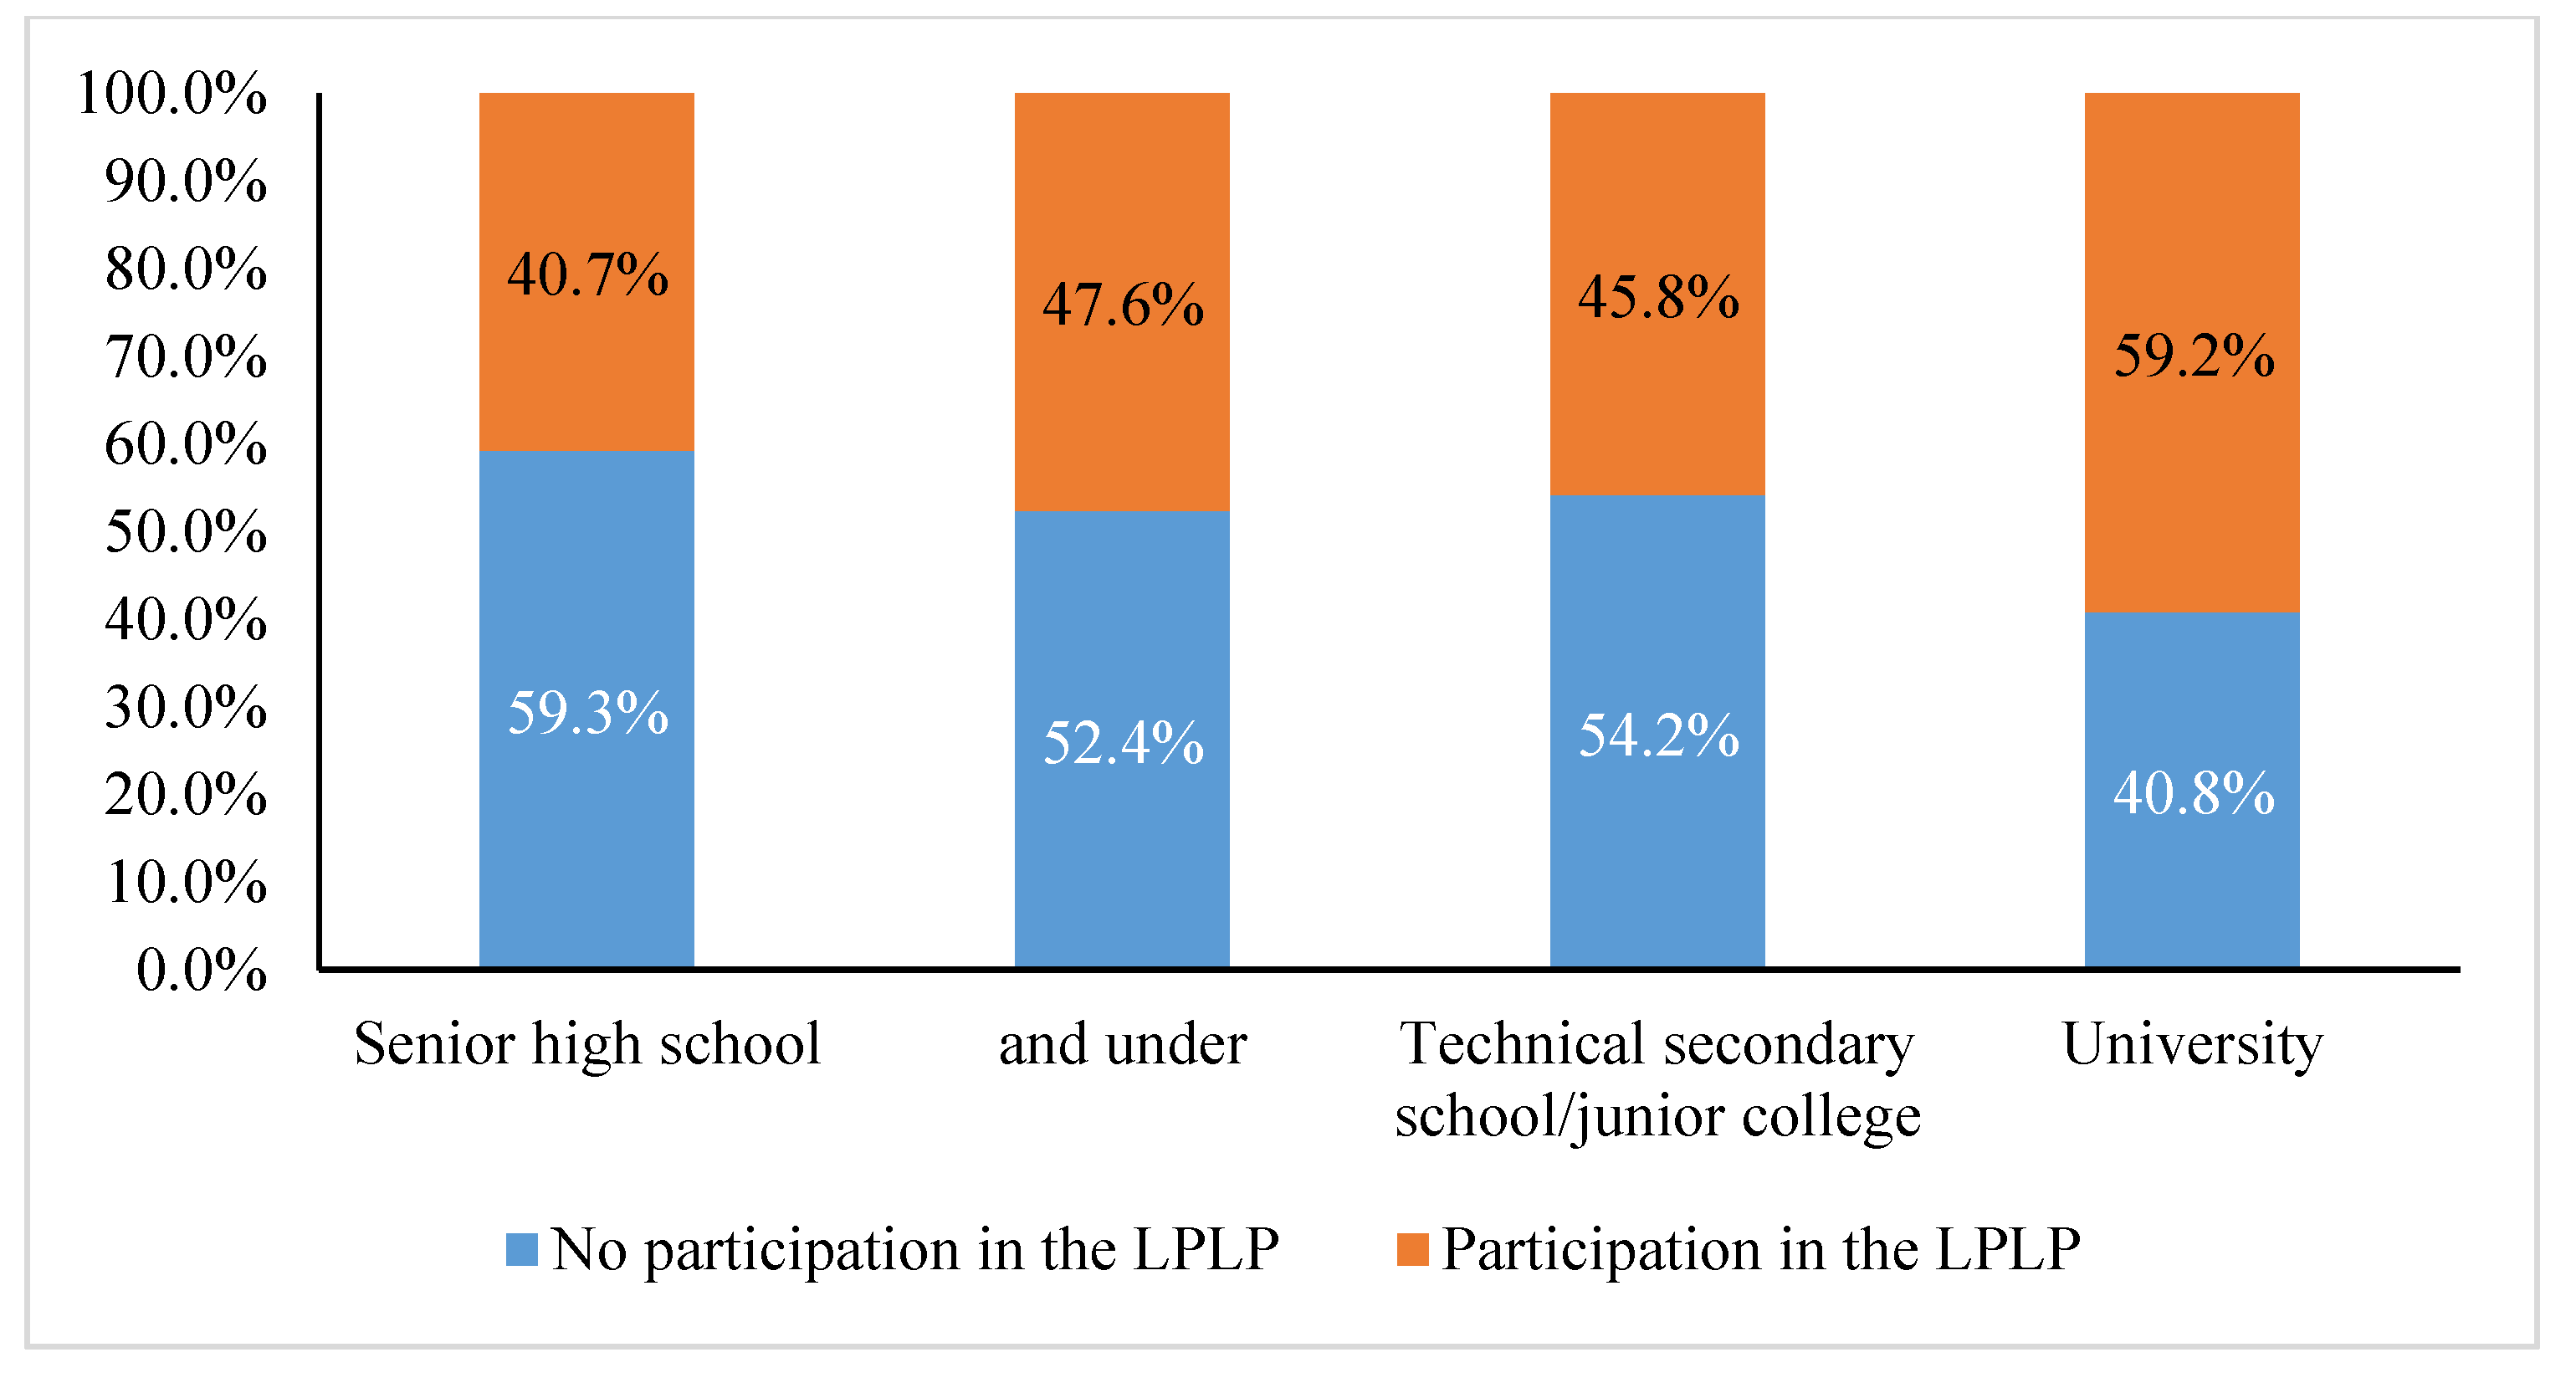
For citizens with a car in their family: the results of the cross-tabulation analysis between age and selection show that the older the age, the lower the willingness to participate in the car lottery, as shown in Figure 5. Further cross-tabulation analysis of age with other personal socioeconomic attributes found that the older the citizen, the lower the annual household income and the fewer the number of households living together with a commuting car need, which may be the reason why older citizens do not participate in the car lottery. Among the education levels, the results of the cross-tabulation analysis between education level and choice show that the higher the education level, the stronger the willingness to participate in the car lottery. Further cross-tabulation analysis of educational attainment with other personal socioeconomic attributes, as shown in Figure 6. The result reveals that the higher the educational attainment, the greater the number of people living together with the need to commute by car, and the higher the annual household income, which may contribute to the stronger willingness of people with higher educational attainment to participate in the LPLP;
(2)
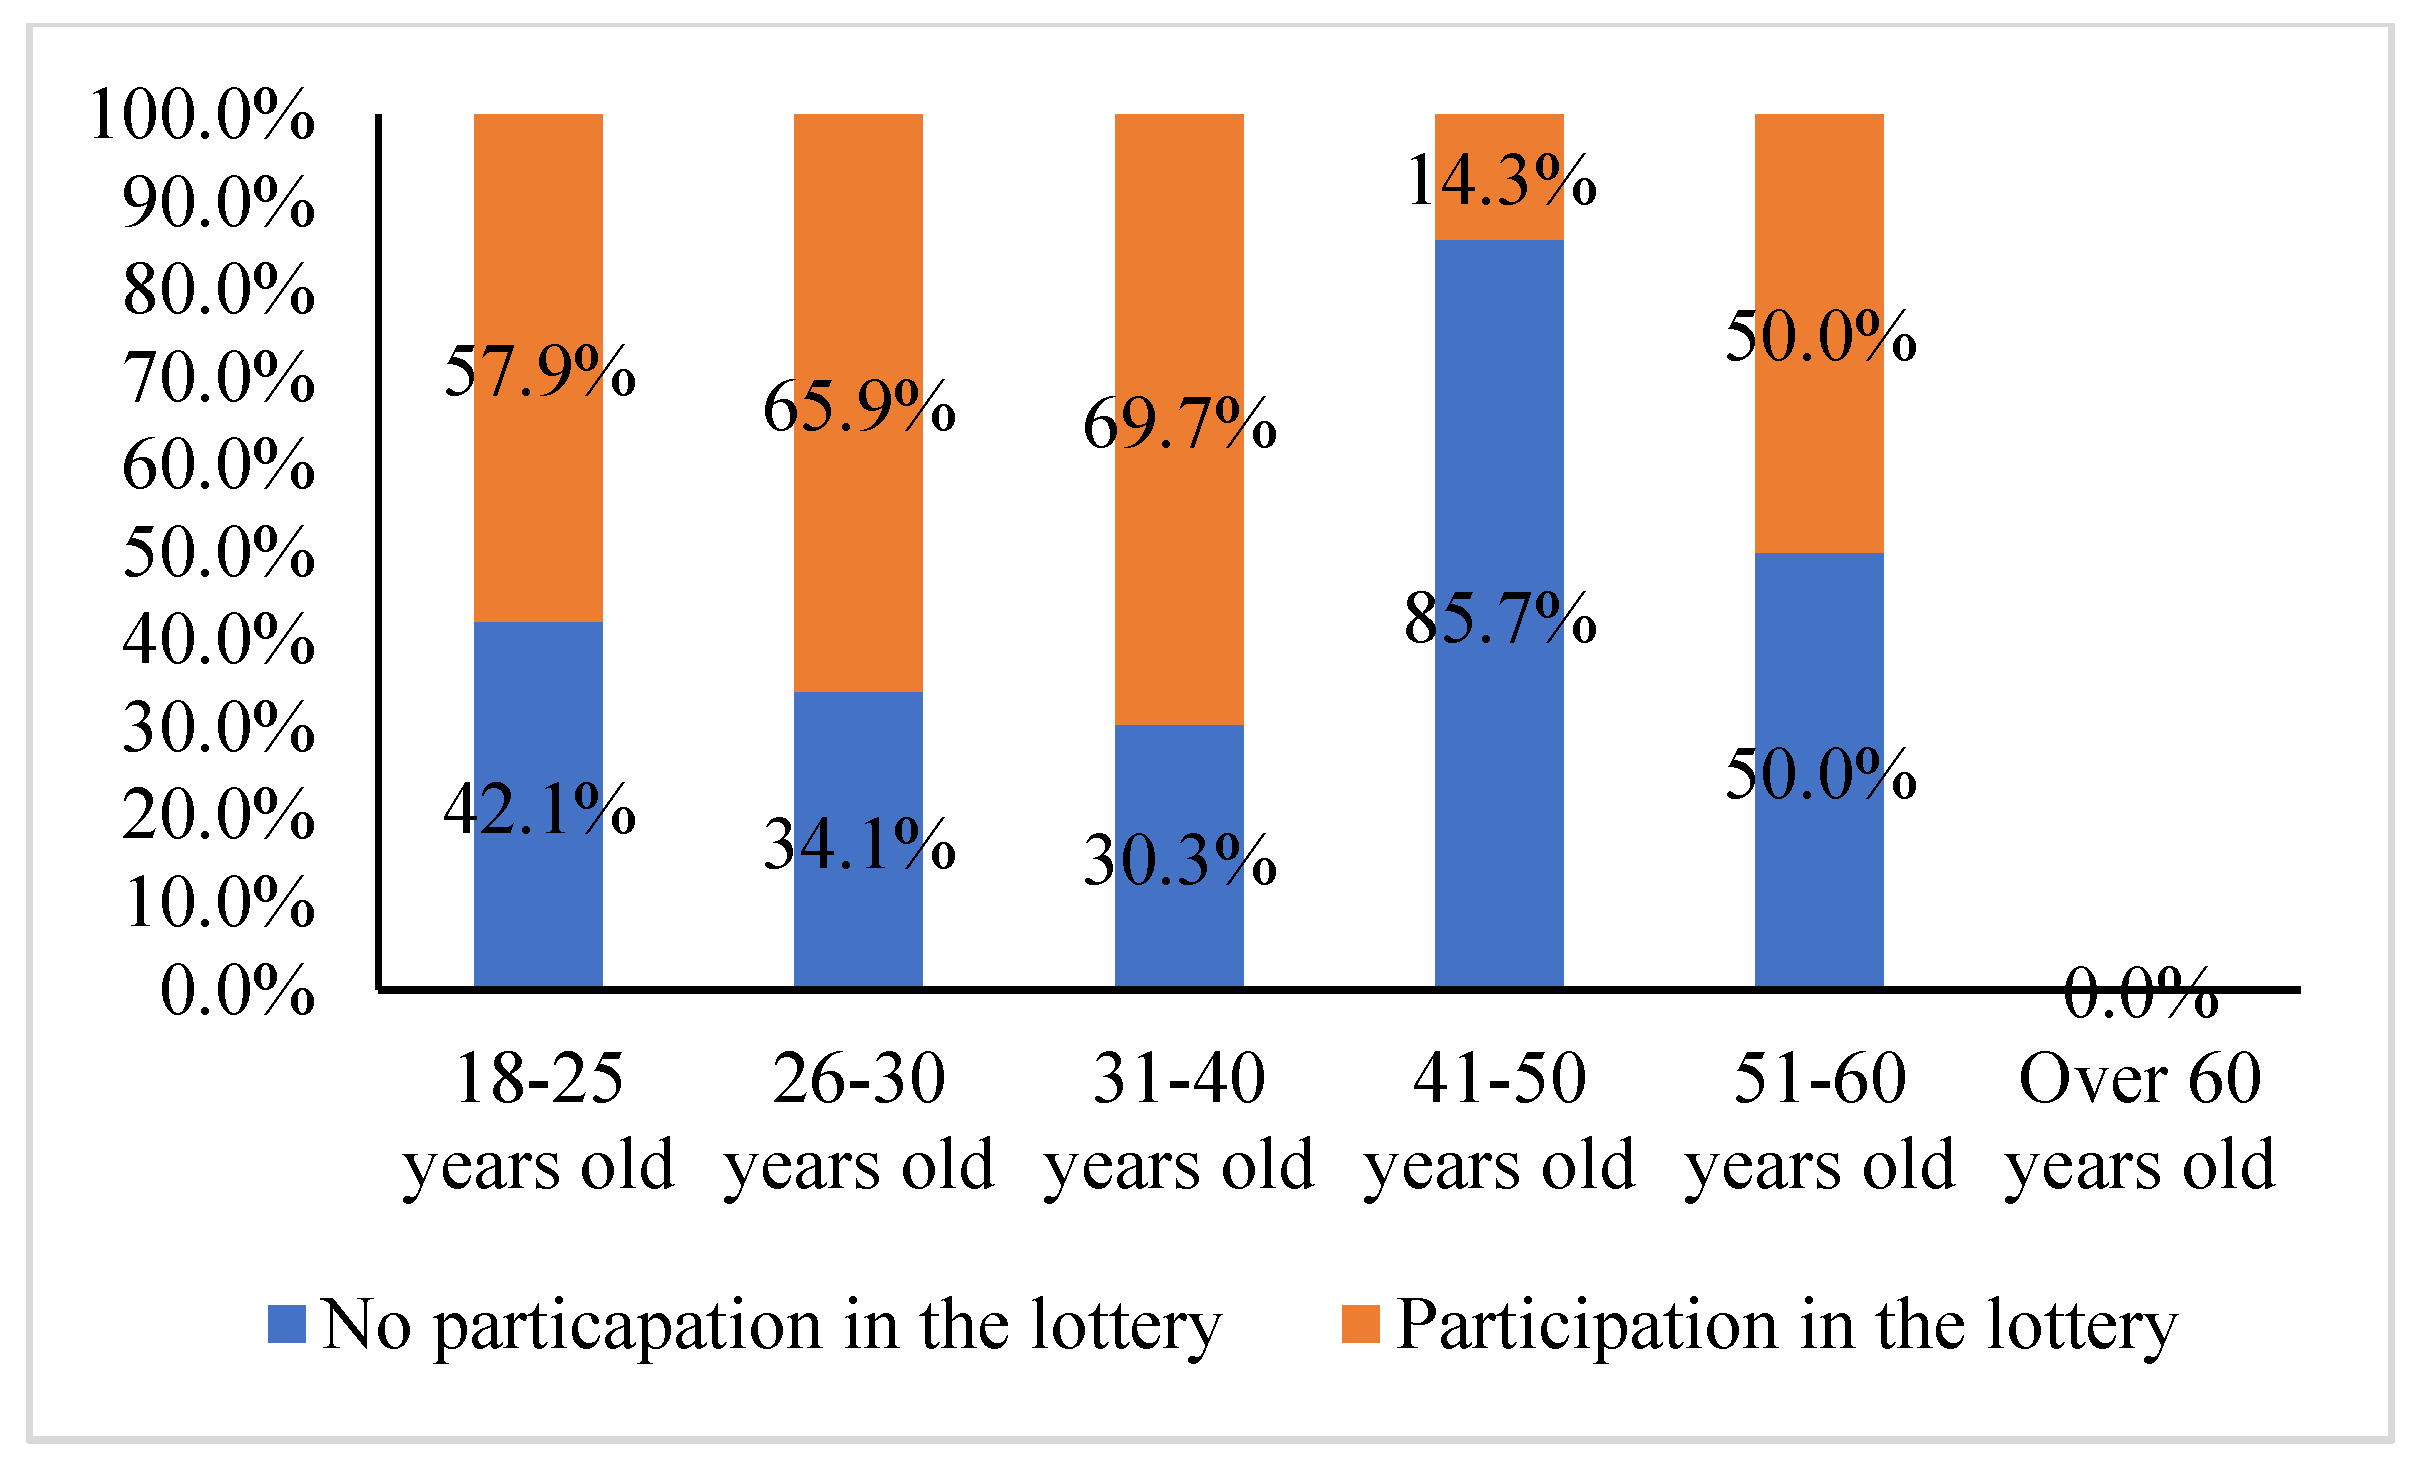
For household car-free citizens: the cross-tabulation analysis of age and selection shows the same trend as that of household car-owning citizens, with car-free citizens older than 40 years old tending not to participate in the car purchase lottery and car-free citizens younger than 40 years old tending to select the car purchase lottery, as shown in Figure 7. Further cross-tabulation analysis of age with other personal socioeconomic attributes reveals that the younger the citizen, the more educated he or she is. As shown in Figure 8, the higher the education level, the more likely the citizens are to participate in the car lottery. The cross-tabulation analysis between the number of commuters living together and the participation in the car lottery shows that the greater the number of household members who need to commute by car, the more likely they are to participate in the car lottery, as shown in Figure 9.

3.3. Model Test

Reliability and validity are used to measure the accuracy and stability of the questionnaire test results [45]. The reliability of the scale was tested by calculating the Cronbach’s alpha coefficient for each variable. According to Mallery and George, a reliability coefficient α greater than 0.9 indicates excellent credibility, while good is above 0.8, acceptable is above 0.7, largely acceptable above is 0.6, crossover is above 0.5, and unacceptable occurs at less than 0.5 [46]. As can be seen from Table 4, the Cronbach’s alpha coefficient for each variable is greater than the standard value of 0.7, and the overall Cronbach’s reliability coefficient is 0.922, which has a strong internal consistency. This indicates that the variables have good reliability. The convergent validity of the questionnaire was evaluated using average variance extracted (AVE), which is the extent to which the amount of variance explained by each factor originates from the full range of questions included in that factor. An average variance extracted value greater than 0.5 indicates that the indicator variable can effectively respond to its latent variables and that the latent variable has good reliability and validity [47]. As shown in Table 3, the average variance extracted values (AVE) for each latent variable are greater than 0.5, which indicates that the convergent validity of the questionnaire is ideal and can be used for further research analysis.
This paper extends the perceived latent variable of car use necessity based on the theory of planned behavior, thus requiring a factor analysis. In this paper, exploratory factor analysis was performed on the sample. The results of the scale Kaiser–Meyer–Olkin (KMO) and Bartlett’s spherical test are shown in Table 5. The KMO values of both the model of household willingness to participate in the lottery for people without a car and the model of household willingness to participate in the lottery for people with a car are greater than 0.7. Bartlett’s spherical test is significant (Sig. < 0.001), which indicates that there is a strong correlation between the observed variables and meets the prerequisite requirements of factor analysis. The total explanatory power of the five factors, PCN, SN, PBC, ATT, and BI, was 79.017% and 78.428% in the model of people without a car and people with a car, respectively, which were higher than 50%, indicating that the scale has good internal consistency reliability.
The maximum variance method was used to orthogonally rotate the factor loading matrix, and all factor loading values were greater than 0.5, which indicated that the scale had good structural validity.
Then, the confirmatory factor analysis is applied to test the model fit. This paper selects the chi-squared degree of freedom ratio ( χ 2 / d f ), the goodness of fit index (GFI), adjusted goodness of fit index (AGFI), root-mean-square residual (RMR), root-mean-square error of approximate (RMSEA), normed fit index (NFI), incremental fit index (IFI), and comparative fit index (CFI) as the evaluation indicators in this study. Among them, χ 2 / d f is a statistic that directly tests the similarity between the sample covariance matrix and the estimated covariance matrix. The closer the χ 2 / d f value is to 0, the better the observation data fits the model. It is generally believed that when the χ 2 / d f value is less than 3, the model fits well, and when the χ 2 / d f value is between 3 and 5, the model fits the model, and the model is acceptable. When it is greater than 5, the observation data does not fit the model well [48]. The results of the fitness are shown in Table 6. From the results of the table, we can see that the model can meet the criteria for all the fitness indexes except for the AGFI and RMR of the household carless citizen model, which are slightly lower than the standard values, and the overall model fit is good, indicating that the model has good fitness.

4. Structural Equation Model Analysis

Amos is a powerful structural equation modeling (SEM) software that helps support research and theories by extending standard multivariate analysis methods, including regression, factor analysis, correlation and analysis of variance. Amos can build attitudinal and behavioral models reflecting complex relationships more accurately than with standard multivariate statistics techniques using either an intuitive graphical or programmatic user interface [49]. The structural equation model constructed in this paper was calibrated using Amos software. The results from the calibration of the model revealed the mutual causality between the latent variables of the extended theory of planned behavior and the degree of influence of the observed variables on their corresponding latent variables.

4.1. The Willingness Model of Family Car-Owning Citizens to Participate in Car Purchase

4.1.1. Analysis of the Relationship between Latent Variables

The model output is shown in Figure 9. The normalized path coefficients between the variables respond to the magnitude of the direct effects between the variables. As seen in Figure 10, the positive effects of ATT, SN, PBC, and PCN on BI were significant, with path coefficients of 0.250, 0.482, 0.144, and 185, respectively, with significant levels of p < 0.01 for ATT, SN, and PBC and p < 0.05 for PCN. This suggests that the intention to participate in the car lottery is influenced by the attitude toward car ownership, subjective norms, perceived behavioral control, and perceived necessity to use a car, thus hypothesizing that H1, H2, H3, and H7 are proven. The degree of influence on the intention to participate in the lottery is SN, ATT, PCN, and PBC in descending order, with the path coefficient of SN far exceeding the other three, which indicates that the participation behavior of citizens with cars in their families in the LPLP is mainly influenced by subjective norms.
There was a significant positive effect of BI and PBC on behavior, with path coefficients of 0.188 and 0.149, respectively, at a significance level of p < 0.05. This suggests that the intention to participate in the LPLP and intuitive behavioral control are influential factors in citizens’ participation behavior in the lottery. Therefore, hypotheses H4 and H5 hold. There was a significant positive effect of PBC on PCN, respectively, with a significance level of p < 0.05. Therefore, hypothesis H6 is held. In contrast, the path of the effect of PCN on behavior did not pass the significance test, so hypothesis H8 does not hold.

4.1.2. Analysis of the Relationship between Latent Variables and Corresponding Observed Variables

The results of the parameter estimate between the latent variables and their observed variables in the SEM model of citizens with a car in their families to participate in the car lottery are shown in Table 7.
  • Among the ATTs, ATT3 has the greatest impact, with a path coefficient of 0.937, and ATT2 has a path coefficient of 0.913, which is close to ATT2. This suggests that the comfort and convenience of travel that comes with owning a motor vehicle motivate families with cars to participate in the lottery;
  • Among SNs, SN3 has the largest standardized path coefficient of 0.906, which indicates that citizens with cars in their households are vulnerable to the influence of other participating citizens around them to participate in the lottery;
  • Among the PBCs, PBC3 has a standardized path coefficient of 0.943, while PBC4 also has a high path coefficient of 0.916, indicating that the no-cost participation in the lottery and the potential economic benefits of car acquisition targets are the main factors that attract citizens with a car in their families to participate in the car lottery;
  • In the PCN, the path coefficient of PCN3 is 0.882, which indicates that the need to commute to work is the main factor that drives people to participate in the car lottery.

4.2. The Willingness Model of Family without Car Citizens to Participate in Car Purchase

4.2.1. Analysis of the Relationship between Latent Variables

The model output is shown in Figure 10. The normalized path coefficients between the variables respond to the magnitude of the direct effects between the variables. As seen in Figure 11, the positive effects of ATT, SN, and PBC on BI were significant, with path coefficients of 0.399, 0.336, and 0.313, respectively, with significance levels of p < 0.001 for ATT, SN, and PBC and p < 0.01 for PCN. This suggests that the intention to participate in the lottery is influenced by the attitude toward car ownership, subjective norms, perceptual behavioral control, and perceived necessity to use a car. Thus hypotheses H1, H2, and H3 are proven. The effect of PCN on BI did not pass the significance test, so hypothesis H7 is not valid. The path coefficients of ATT, SN, and PBC on BI in the model of household carless citizens’ willingness to purchase a car lottery exceed 0.3, which indicates that attitude toward car ownership, subjective norms, and perceptual behavioral control all have significant effects on household carless citizens’ participation in car lottery behavior. This is inconsistent with the model of willingness to participate in car lottery among citizens with a car in the household.
There was a significant positive effect of BI on behavior with a path coefficient of 0.245 and a significance level of p < 0.05. This indicates that the intention to participate in the lottery is the only factor influencing citizens’ participation in the lottery, which is inconsistent with the participation in the LPLP for car purchases by citizens with a car in their families. Therefore, hypothesis H5 above is valid. There was a significant positive effect of PBC on PCN at a significance level of p < 0.05. Therefore, hypothesis H6 is held. The effects of PCN and PBC on behavior did not pass the significance test, so hypotheses H4 and H8 are not valid.

4.2.2. Analysis of the Relationship between Latent Variables and Corresponding Observed Variables

The results of the parameter estimate between the latent variables and their observed variables in the SEM model of the family without car citizens’ willingness to participate in the car lottery are shown in Table 8.
  • Among the ATTs, ATT2 has the highest impact, with a path coefficient of 0.967, followed by ATT3 with a path coefficient of 0.904. This suggests that the comfort and convenience of travel that comes with owning a motor vehicle motivate people without a car to participate in the lottery;
  • Among SNs, SN3 has the largest standardized path coefficient of 0.957, which indicates that household citizens without a car are vulnerable to the influence of other participating citizens around them to participate in the lottery;
  • In the PCNs, the path coefficient of PCN3 is 0.908, which indicates that the demand for cars to and from work is the main factor that motivates family car-free citizens to participate in the LPLP. These three points are consistent with the model presented for citizens with a car in the household;
  • Among the PBCs, PBC1 has the largest standardized path coefficient of 0.926, followed by PBC2 with a path coefficient of 0.889, indicating that the difficulty of winning the lottery is the main factor that attracts people without a car to participate in the lottery due to the opportunistic mentality of “trying,” which is very different from the model of people with a car. The difficulty of winning the lottery is the main factor that attracts people without a car to participate in the lottery. This phenomenon may be since citizens with cars in their families are already accustomed to using cars for commuting and show their dependence on cars for travel, so the PCN by household citizens with cars has an impact on their participation in the car purchase lottery. In contrast, household citizens without cars can only travel by public transportation and other means, and the PCN has no impact on their participation in the car purchase lottery.

5. Discussion and Policy Recommendations

Based on the above findings, the following policy recommendations are proposed.
  • From the comparison of personal socioeconomic attributes of household car-owning citizens and household car-free citizens, it can be seen there are significant differences in age distribution and household size between household car-owning citizens and household car-free citizens;
  • Analysis from the perspective of an extended theory of planned behavior revealed that:
    (1)
    For citizens with cars in their families, PCN, PBC, ATT, and SN have a significant positive effect on BI. Among them, the effect of SN on BI is much higher than PCN, PBC, and ATT, which indicates that SN plays a major role in the participation behavior of citizens whose families own cars in the car lottery;
    (2)
    PBC, ATT, and SN have significant positive effects on the BI for people without a car in their family, and the effects of these three items on the intention to participate in the car lottery are approximately the same, which indicates that ATT, SN, and PBC play a major role in the car lottery behavior of people without a car in their family;
  • A comparative analysis of the latent variables revealed that:
    (1)
    Among the SNs, the strongest subjective norms for citizens whose families have cars and those whose families do not have cars were both from other participants in the lottery, with the second strongest subjective norms being influenced by related news or social media. Some studies have shown the crucial role of social media on transportation choice behavior [50]. Therefore, it is suggested that the management department should strengthen the publicity of rational participation in the LPLP and the use of public transport and green transport to reduce the subjective normative effect of other participants on public participation in car purchasing;
    (2)
    The comfort and convenience of travel brought by owning a motor vehicle is the main factor influencing the participation in the car lottery for citizens whose families have cars and those whose families do not have cars in the ATTs. The government can learn from the practices of cities with developed public transportation, such as Portland in the United States [51], to reduce the comfort level of the car travel environment, reduce car travel, and improve the planning and construction of a multi-modal transportation system with public transportation, bicycle transportation, and pedestrian transportation service quality, as a way to change the public’s attitude that car travel can bring convenience and comfort in travel, and thus rationally choose to participate in car purchase lottery;
    (3)
    In the PBC comparison, the zero cost of participating in the lottery and the potential economic benefits of the car purchase index are the main factors that attract people with a car in their family to participate in the lottery. In contrast, the difficulty of winning the lottery and the opportunistic mentality of “trying” are the main factors that attract people without a car in their family to participate in the lottery. At present, citizens can participate in the lottery as long as they meet the eligibility criteria for the lottery. There is no restriction on the number of motor vehicles in the family, only that citizens with motor vehicles registered under their names cannot participate in the lottery, so a considerable number of citizens with cars in their families and those without urgent needs for cars in their families obtain the purchase index for small cars and then rent and sell the index to those without cars who have urgent needs for cars. A number of car owners and people without the urgent need for a car, after obtaining a small car purchase quota, are leasing and selling the quota to people without the urgent need for a car to obtain substantial financial benefits. In response to this result, combined with the significant difference in socioeconomic attributes between car-owning and car-free households mentioned above, administrators can classify citizens according to whether they have a motor vehicle in the household, set different lottery rules for car-free and car-owning households, respectively, create additional car-free household number pools, and set separate quotas for car-free household number pools to reduce the difficulty of winning the lottery for car-free households. At the same time, the government should also strengthen the monitoring of illegal renting and selling of car purchase indexes and vigorously publicize the legal risks associated with the illegal renting and selling of indexes;
    (4)
    The perceived necessity of using a car has an impact on the intention of participating in the lottery for citizens with a car in their families. In contrast, it has no significant impact on the willingness of citizens without a car to participate in the lottery for purchasing a car, in which the necessity of using a car for commuting to and from work is the main factor that motivates citizens with a car in their families to participate in the lottery for purchasing a car. Management can reduce the service level of cars on an existing basis, restrict the use of cars, and improve the service level of public transportation. Furthermore, management can lower the service level of small cars, restrict the use of small cars, improve the service level of public transportation, and lower the PCN of citizens with a car in their families, to guide citizens with a car in their families to give up the lottery.

6. Conclusions

This study aims to investigate the high enthusiasm of citizens’ participation in the lottery under the motor vehicle lottery restriction policy. This paper takes the citizens’ participation in car lottery selection behavior as the research object, divides the citizens into citizens with a car in their families and citizens without a car in their families, and explores in-depth the influence mechanism of different categories of citizens’ participation in car lottery behavior. The relationship between psychological factors and the influence of potential psychological variables on citizens’ participation in the lottery was verified by constructing a structural equation model based on the research framework of the theory of planned behavior. The model validation results show that the extended plan behavior theory of different citizens constructed in this paper has high explanatory power and proves that the extended plan behavior theory can explain the differences in the willingness of different categories of citizens to participate in the lottery. Based on the model results, we also propose corresponding policy recommendations.
This study makes many theoretical and practical contributions. To the best of our knowledge, this is the first study to apply extended plan behavior theory to explore citizens’ intention to participate in car lottery. This study can also help policymakers to optimize motor vehicle shakeout policies.
This study only considers the influence of psychological factors on the participation behavior of different categories of citizens in the lottery. This study did not explore the influence of objective factors on the participation behavior of different categories of citizens in the lottery.
The findings show that not all psychological variables directly affect the intention to participate in the car lottery, which may be related to the structure of these psychological factors. The psychological variables used are all introduced from abroad, and their applicability in China needs much domestic empirical evidence for further research.
In future research, other psychological influences can be further introduced into the theory of planned behavior, or even combined with psychological behavior models, and this can be used as the basis for designing and verifying effective regulation measures for citizens’ participation in the lottery to achieve effective guidance for different categories of citizens’ participation in the car lottery. If possible, we can cooperate with the relevant departments in Beijing and use an official platform to collect data.

Author Contributions

Conceptualization, H.G.; methodology, J.Z.; investigation, J.Z. and H.W.; data curation, J.Z.; writing—original draft preparation, J.Z.; writing—review and editing, H.G. and H.Y.; supervision, H.G. and H.Y.; project administration, H.G. All authors have read and agreed to the published version of the manuscript.

Funding

This research was funded by the National Natural Science Foundation of China (Grant No. 71971005) and the Natural Science Foundation of Beijing, China (Grant No. 8202003).

Institutional Review Board Statement

Not applicable.

Informed Consent Statement

Not applicable.

Data Availability Statement

Not applicable.

Conflicts of Interest

The authors declare no conflict of interest.

References

  1. International Energy Agency. IEA CO2 Emissions from Fuel Combustion Highlights 2017; International Energy Agency: Paris, France, 2017.
  2. Pucher, J.; Peng, Z.; Mittal, N.; Zhu, Y.; Korattyswaroopam, N. Urban Transport Trends and Policies in China and India: Impacts of Rapid Economic Growth. Transp. Rev. 2007, 27, 379–410. [Google Scholar] [CrossRef]
  3. Guo, J.; Sun, M.; Wang, T.; Lu, L. Transportation development and congestion mitigation measures of Beijing, China. Mitig. Adapt. Strateg. Glob. Chang. 2015, 20, 651–663. [Google Scholar] [CrossRef]
  4. Beijing Municipal Government. Beijing Municipal Government Interim Regulations on the Regulation and Control of the Number of Passenger Cars in Beijing; Beijing Municipal Government: Beijing, China, 2011.
  5. Beijing Municipal Government. Beijing Municipal Passenger Car Index Regulation Management Office Beijing Municipal Passenger Car Index Regulation Management Information System. 2021. Available online: https://xkczb.jtw.beijing.gov.cn/ (accessed on 1 December 2021).
  6. Beijing Municipal Government. Beijing Interim Provisions on the Regulation and Control of the Number of Passenger Cars Implementing Regulations; Beijing Municipal Government: Beijing, China, 2014.
  7. Zhu, J.; Guan, H.; Hao, M.; Qin, Z.; Wang, A. “License Plate Lottery”: Why Are People So Keen to Participate in It? Sustainability 2021, 13, 13411. [Google Scholar] [CrossRef]
  8. Liu, Y.; Gu, T.; Zhou, L. Analysis and Optimization Research of Beijing’s Quantity Control Policies on Motor Vehicles. In Green Intelligent Transportation Systems; GITSS 2017; Lecture Notes in Electrical Engineering; Wang, W., Bengler, K., Jiang, X., Eds.; Springer: Singapore, 2019; Volume 503. [Google Scholar] [CrossRef]
  9. Gao, L. Study on the Beijing Lottery Policy Effect on Choice Behavior of Buying Car. Master’s Thesis, Beijing University of Technology, Beijing, China, 2015. [Google Scholar]
  10. Liu, F.; Zhao, F.; Liu, Z.; Hao, H. The Impact of Purchase Restriction Policy on Car Ownership in China’s Four Major Cities. J. Adv. Transp. 2020, 2020, 7454307. [Google Scholar] [CrossRef]
  11. Sandel, M.J. Justice: What’s the right thing to do? BUL Rev. 2011, 91, 1303. [Google Scholar]
  12. Yang, J.; Liu, Y.; Qin, P.; Liu, A.A. A review of Beijing's vehicle registration lottery: Short-term effects on vehicle growth and fuel consumption. Energy Policy 2014, 75, 157–166. [Google Scholar] [CrossRef]
  13. Su, M. Study on the Policy Evaluation of Vehicle Registrations via a Lottery System in Beijing. Master’s Thesis, Beijing University of Chemical Technology, Beijing, China, 2016. [Google Scholar]
  14. Wang, S.; Zhao, J. The distributional effects of lotteries and auctions—License plate regulations in Guangzhou. Transp. Res. Part A Policy Pract. 2017, 106, 473–483. [Google Scholar] [CrossRef]
  15. Ma, J. Research on the Restriction Policy of Cars and Its Impact on Consumers—Taking Tianjin as an Example. Master’s Thesis, Tianjin University of Commerce, Tianjin, China, 2016. [Google Scholar]
  16. Zhu, J.; Guan, H.; Lu, S.; Qin, Z.; Zhao, L. A Study on the Influence of the Cost of Participation on the Behavior of Public Participation in the Lottery in Beijing. In Proceedings of the 20th COTA International Conference of Transportation Professionals, Xi’an, China, 14–16 August 2020; pp. 2672–2682. [Google Scholar]
  17. Li, T.; Yang, W.; Wang, L.; Yan, H. Ladder Probability Rule Optimization of License-plate Lottery in Beijing. J. Transp. Syst. Eng. Inf. Technol. 2019, 19, 227–232. [Google Scholar]
  18. Li, Z.; Wu, Q.; Yang, H. A theory of auto ownership rationing. Transp. Res. Part B Methodol. 2019, 127, 125–146. [Google Scholar] [CrossRef]
  19. Zhuge, C.; Wei, B.; Shao, C.; Shan, Y.; Dong, C. The role of the license plate lottery policy in the adoption of Electric Vehicles: A case study of Beijing. Energy Policy 2020, 139, 111328. [Google Scholar] [CrossRef]
  20. Ma, J.; Liu, W.; Ma, Z.; Song, P.; Zhao, Y.; Yang, F.; Wang, X. 2019 IOP Conference Series: Materials Science and Engineering; IOP Publishing: Bristol, UK, 2019. [Google Scholar]
  21. Soegoto, S.; Ramadhani, P. 2020 IOP Conference Series: Materials Science and Engineering; IOP Publishing: Bristol, UK, 2020. [Google Scholar]
  22. Olsson, L.E.; Huck, J.; Friman, M. Olsson. Intention for Car Use Reduction: Applying a Stage-Based Model. Int. J. Environ. Res. Public Health 2018, 15, 216. [Google Scholar] [CrossRef] [Green Version]
  23. Wang, S.; Fan, J.; Zhao, D.; Yang, S.; Fu, Y. Predicting consumers’ intention to adopt hybrid electric vehicles: Using an extended version of the theory of planned behavior model. Transportation 2016, 43, 123–143. [Google Scholar] [CrossRef]
  24. Peng, J.; Jing, Z.; Hongli, X. Junting Travelers’ Choice Behavior of Car Sharing Based on Hybrid Choice Model. J. Transp. Syst. Eng. Inf. Technol. 2017, 17, 7–13. [Google Scholar]
  25. Jing, P.; Wang, J.; Chen, L.; Zha, Q. Incorporating the extended theory of planned behavior in a school travel mode choice model: A case study of Shaoxing, China. Transp. Plan. Technol. 2018, 41, 119–137. [Google Scholar] [CrossRef]
  26. Haustein, S.; Jensen, A.F. Factors of electric vehicle adoption: A comparison of conventional and electric car users based on an extended theory of planned behavior. Int. J. Sustain. Transp. 2018, 12, 484–496. [Google Scholar] [CrossRef] [Green Version]
  27. Zhang, X.; Guan, H.; Zhu, H.; Zhu, J. Analysis of Travel Mode Choice Behavior Considering the Indifference Threshold. Sustainability 2019, 11, 5495. [Google Scholar] [CrossRef] [Green Version]
  28. Ortiz-Peregrina, S.; Oviedo-Trespalacios, O.; Ortiz, C.; Casares-López, M.; Salas, C.; Anera, R.G. Factors determining speed management during distracted driving (WhatsApp messaging). Sci. Rep. 2020, 10, 13263. [Google Scholar] [CrossRef]
  29. Hou, M.; Cheng, J.; Xiao, F.; Wang, C. Distracted Behavior of Pedestrians While Crossing Street: A Case Study in China. Int. J. Environ. Res. Public Health 2021, 18, 353. [Google Scholar] [CrossRef]
  30. Wang, H.; Mangmeechai, A. Understanding the Gap between Environmental Intention and Pro-Environmental Behavior towards the Waste Sorting and Management Policy of China. Int. J. Environ. Res. Public Health 2021, 18, 757. [Google Scholar] [CrossRef] [PubMed]
  31. Wang, A.; Guan, H.; Qin, Z.; Zhu, J. Study on the Intention of Private Parking Space Owners of Different Levels of Cities to Participate in Shared Parking in China. Discret. Dyn. Nat. Soc. 2021, 2021, 9955686. [Google Scholar] [CrossRef]
  32. Ripplinger, D.; Mattson, J.; Peterson, D. An applocation of attitudinal structural equation modeling to intercity transportation market segmentation. In Proceedings of the Transportation Research Board 91st Annual Meeting, Washington, DC, USA, 22–26 January 2012. [Google Scholar]
  33. Alyoussef, I.Y. E-Learning Acceptance: The Role of Task–Technology Fit as Sustainability in Higher Education. Sustainability 2021, 13, 6450. [Google Scholar] [CrossRef]
  34. Kim, J.; Jung, S.; Roh, J.; Choi, H. Success Factors and Sustainability of the K-Pop Industry: A Structural Equation Model and Fuzzy Set Analysis. Sustainability 2021, 13, 5927. [Google Scholar] [CrossRef]
  35. Mcdonald, R.P.; Ho, M.R. Principles and practice in reporting structural equation analyses. Psychol. Methods 2002, 7, 64–82. [Google Scholar] [CrossRef] [PubMed]
  36. Shiftan, Y.; Outwater, M.L.; Zhou, Y. Transit market research using structural equation modeling and attitudinal market segmentation. Transp. Policy 2008, 15, 186–195. [Google Scholar] [CrossRef]
  37. Kapser, S.; Abdelrahman, M.; Bernecker, T. Autonomous delivery vehicles to fight the spread of Covid-19—How do men and women differ in their acceptance? Transp. Res. Part A Policy Pract. 2021, 148, 183–198. [Google Scholar] [CrossRef]
  38. Ajzen, I. The theory of planned behavior. Organ. Behav. Hum. Decis. Processes 1991, 50, 179–211. [Google Scholar] [CrossRef]
  39. Haustein, S.; Hunecke, M. Reduced Use of Environmentally Friendly Modes of Transportation Caused by Perceived Mobility Necessities: An Extension of the Theory of Planned Behavior1. J. Appl. Soc. Psychol. 2007, 37, 1856–1883. [Google Scholar] [CrossRef]
  40. Hunecke, M.; Haustein, S.; Grischkat, S.; Böhler, S. Psychological, sociodemographic, and infrastructural factors as determinants of ecological impact caused by mobility behavior. J. Environ. Psychol. 2007, 27, 277–292. [Google Scholar] [CrossRef]
  41. Hunecke, M.; Haustein, S.; Böhler, S.; Grischkat, S. Attitude-Based Target Groups to Reduce the Ecological Impact of Daily Mobility Behavior. Environ. Behav. 2010, 42, 3–43. [Google Scholar] [CrossRef] [Green Version]
  42. Thorhauge, M.; Haustein, S.; Cherchi, E. Accounting for the Theory of Planned Behaviour in departure time choice. Transp. Res. Part F Traffic Psychol. Behav. 2016, 38, 94–105. [Google Scholar] [CrossRef] [Green Version]
  43. Bentler, P.M.; Chou, C.P. Practical issues in structural modeling. Sociol. Methods Res. 1987, 16, 78–117. [Google Scholar] [CrossRef]
  44. Wu, M. Statistical Analysis of Questionnaires in Practice—SPSS Operation and Application; Chongqing University Press: Chongqing, China, 2010. [Google Scholar]
  45. Golafshani, N. Understanding reliability and validity in qualitative research. Qual. Rep. 2003, 8, 597–607. [Google Scholar] [CrossRef]
  46. George, P.M.D. SPSS for Windows Step by Step: A Simple Guide and Reference; ERIC: Washington, DC, USA, 1999. [Google Scholar]
  47. Norhayati, M.N.; Mofreh, S.A.M.; Azman, Y.M. Vicarious Traumatization Questionnaire: Psychometric Properties Using Rasch Model and Structural Equation Modeling. Int. J. Environ. Res. Public Health 2021, 18, 4949. [Google Scholar] [CrossRef] [PubMed]
  48. Jing, P.; Juan, Z.C.; Zha, Q.F. Application of the Expanded Theory of Planned Behavior in Intercity Travel Behavior Based on MIMIC Model. J. Ind. Eng. Manag. 2016, 30, 61–68. [Google Scholar]
  49. Maxwell, K. Structural Equation Modeling with IBM SPSS Amos A Methodology for Predicting Behavioral Intentions in the Services Sector. Available online: https://www.ibm.com/products/structural-equation-modeling-sem (accessed on 1 December 2021).
  50. Ghasri, M.; Vij, A. The potential impact of media commentary and social influence on consumer preferences for driverless cars. Transp. Res. Part C Emerg. Technol. 2021, 127, 103132. [Google Scholar] [CrossRef]
  51. Jianhong, Y.; Xiaohong, C.; Hua, Z. Reducing the Reliance on Automobiles: Portland Multi-modal Transportation System Development. Urban Transp. China 2013, 11, 10–17. [Google Scholar]
Figure 1. Modeling framework of willingness to participate in the lottery.
Sustainability 14 00944 g001
Figure 2. The data flow chart.
Sustainability 14 00944 g002
Figure 3. Statistical results of participate behavior in the LPLP.
Sustainability 14 00944 g003
Figure 4. Different categories of respondents’ socio-economic attributes (Age, Education level, Number of household members, Number of household members who need to commute by cars, Family annual income. (a) Age. (b) Education level. (c) Number of household members. (d) Number of household members who need to commute by cars. (e) Family annual income (CNY).
Sustainability 14 00944 g004aSustainability 14 00944 g004b
Figure 5. Cross-analysis of age and choice intention of citizens with cars in their families.
Sustainability 14 00944 g005
Figure 6. Cross-analysis of education level and choice intention of citizens with cars in their families.
Sustainability 14 00944 g006
Figure 7. Cross-analysis of age and choice intention of citizens without cars in their families.
Sustainability 14 00944 g007
Figure 8. Cross-analysis of education level and choice intention of citizens without cars in their families.
Sustainability 14 00944 g008
Figure 9. Cross-analysis of the number of household members who need to commute by car and choice intention of citizens without cars in their families.
Sustainability 14 00944 g009
Figure 10. Analytical results of structural equation model for households with cars participating in the car lottery model. Note: “*”: p < 0.05, “**”: p < 0.01, “***”: p < 0.001.
Sustainability 14 00944 g010
Figure 11. Analytical results of structural equation model for households without cars participating in the car lottery model. Note: “*”: p < 0.05, “***”: p < 0.001.
Sustainability 14 00944 g011
Table 1. Regions that implemented the vehicle purchase restriction policy.
Year of Policy ApplicationRegionsRestricted FormNumber of Annual IndicatorsNumber of VehiclesPopulation
1994ShanghaiAuction100,0004.42 million24.9 million
2011BeijingLottery100,0006.57 million21.9 million
2013GuangzhouLottery + Auction120,0003.08 million18.7 million
2013TianjinLottery + Auction100,0003.38 million13.9 million
2014HangzhouLottery + Auction80,0002.86 million11.9 million
2015ShenzhenLottery + Auction80,0003.59 million17.6 million
2018HainanLottery + Auction120,0001.50 million10.1 million
Noted: Both the number of vehicles and the population are for the year 2020.
Table 2. A specific description of each latent variable and its measurement variables.
Latent VariableMeasurement
Variable
Variable Description
Perceived Car
Necessity
(PCN)
PCN1Holiday driving demand
PCN2The demand for driving when taking children to and from school
PCN3Demand for commuting by private vehicle
PCN4Other driving demand
Car Ownership
Attitude
(ATT)
ATT1Owning a car can improve the flexibility of travel
ATT2Owning a car can improve the comfort of travel
ATT3Owning a car can improve the convenience of travel
ATT4Owning a car can improve the safety of travel
ATT5Owning a car can improve the quality of life
Subjective Norm (SN)SN1Influenced by friends/colleagues/classmates
SN2Influenced by relevant news or social media
SN3Other people who participate in the lottery will affect your participation
SN4Influenced by family
Perceptual Behavior Control (PBC)PBC1Participate in the lottery with a “try and see” mentality out of opportunism
PBC2The degree of difficulty of successfully applying for the license plate (winning rate)
PBC3You can participate in the lottery without any cost
PBC4The license plates can be leased and sold at a profit, and the results of the application for license plates are equivalent to invisible property
Intention to Participate in Lottery Behavior (BI)BI1I have a strong desire to participate in the lottery
BI2I would like to encourage people around me to participate in the lottery
BI3Even if I have a car, I will still participate in the lottery
Table 3. Personal socioeconomic attributes of respondents.
VariablesPercentageVariablesPercentage
Age18~25 years old26.5%GenderMale58.1%
26~30 years old27.7%Famale41.9%
31~40 years old25.8%The number of household members who need to commute by car019.8%
41~50 years old16.5%138.6%
51~60 years old3.3%230.2%
Older than 60 years old0.2%37.9%
OccupationStaff in government
or public institution
33.0%41.9%
Professional and technical personnel such as lawyers/doctors/teachers/engineers15.1%≥5 1.6%
Private/self-employed3.3%The number of household members who are eligible for participating in the LPLP 025.3%
Corporate Staff20.9%137.2%
Freelance4.7%229.5%
Retired0.5%36.1%
Full-time student13.7%≥41.9%
Other8.8%Family annual income
(CNY)
≤50,00021.6%
Education levelSenior high school
and under
7.9%50,000~100,00032.6%
Technical secondary school/junior college24.9%100,000~200,00025.1%
University37.0%200,000~300,00010.5%
Master degree or above30.2%300,000~500,0006.7%
Number of household members110.7%500,000~1,000,0002.1%
217.4%≥1,000,0001.4%
334.7%The main mode of transportation for daily travelPrivate car38.8%
423.7%Public transportation (subway, bus)31.2%
≥513.5%Walking\cycling21.4%
Number of vehicles in the household029.8%Taxi\online car-hailing5.6%
149.5%other3.0%
218.1%
≥32.6%
Note: CNY 1000 ≈ USD 156.8.
Table 4. Reliability test of latent variables.
Latent VariableCitizen Family without Car ModelCitizen Family with Car Model
AVECronbach’s AlphaAVECronbach’s Alpha
PCN0.7000.8990.6150.883
ATT0.8270.9080.6970.915
SN0.7900.9010.6590.869
PBC0.8660.9350.8320.951
BI0.6730.7940.7130.852
Table 5. Results of KMO and Bartlett’s spherical test.
Citizen Family without Car ModelCitizen Family with Car Model
Kaiser–Meyer–Olkin metric for sampling adequacy0.9040.850
Bartlett’s spherical testApproximate Chi-squared5028.1612151.609
Df190190
Sig.0.0000.000
Table 6. Fitness results.
Evaluation IndicatorsCitizen Family without Car ModelCitizen Family with Car ModelStandard ValueGeneral Standard Value
Chi-squared / degrees   of   freedom   ( χ 2 / d f ) 2.1061.7431~33~5
Goodness of fit index (GFI)0.8950.837>0.90>0.80
Adjusted goodness of fit index (AGFI)0.8610.778>0.90>0.80
Root mean square residual (RMR)0.0580.088<0.05<0.08
Root mean square error of approximate (RMSEA)0.0610.077<0.05<0.08
Normed fit index (NFI)0.9300.874>0.90>0.80
Incremental fit index (IFI)0.9620.942>0.90>0.80
Comparative fit index (CFI)0.9620.941>0.90>0.80
Table 7. Estimation results of parameters between latent variables and observed variables.
PathEstimateStandard
Deviation
Critical
Ratio
p
ATT→ATT10.8570.07615.508***
ATT→ATT20.9130.07616.557***
ATT→ATT30.9370.07616.883***
ATT→ATT40.7010.08112.415***
ATT→ATT50.741
SN→SN10.8540.14710.164***
SN→SN20.8840.15210.309***
SN→SN30.9060.15110.432***
SN→SN40.553
PBC→PBC10.8980.04025.153***
PBC→PBC20.8980.04225.285***
PBC→PBC30.9370.03628.785***
PBC→PBC40.916
PCN→PCN10.6940.07312.887***
PCN→PCN20.7160.07113.436***
PCN→PCN30.8820.05818.070***
PCN→PCN40.829
BI→BI10.963
BI→BI20.7950.05914.618***
BI→BI30.7620.06113.386***
Note: “***”: p < 0.001.
Table 8. Estimation results of parameters between latent variables and observed variables.
PathEstimateStandard
Deviation
Critical
Ratio
p
ATT→ATT10.8350.1298.687***
ATT→ATT20.9670.1259.770***
ATT→ATT30.9040.1329.345***
ATT→ATT40.678
ATT→ATT50.6910.1337.285***
SN→SN10.8380.1558.601***
SN→SN20.8840.1518.899***
SN→SN30.9530.1619.379***
SN→SN40.667
PBC→PBC10.9260.09412.510***
PBC→PBC20.8890.09912.302***
PBC→PBC30.8510.06016.994***
PBC→PBC40.813
PCN→PCN10.7470.1139.146***
PCN→PCN20.8870.10611.943***
PCN→PCN30.9080.09911.696***
PCN→PCN40.794
BI→BI10.714
BI→BI20.8470.1428.002***
BI→BI30.7140.1457.083***
Note: “***”: p < 0.001.
Publisher’s Note: MDPI stays neutral with regard to jurisdictional claims in published maps and institutional affiliations.

