
A Strategy for Managing the Operation of Technical Infrastructure Based on the Analysis of “Bad Actors”—A Case Study of LOTOS Group S.A.


Abstract
:1. Introduction
2. Technical Infrastructure and Assets of the LOTOS Group
- safety–machines, the consequences of which may be: very dangerous/dangerous/safe;
- significance from the perspective of the unit–machines of: main/medium/small importance;
- significance from the perspective of the plant–machines: very important/important/other;
- probability of failure–machines with: high/medium/low probability of failure;
- refurbishment complexity-machines in need of refurbishment activities: very complex/medium complex/simple.
3. Operation Management Strategies at the LOTOS Group
4. Methods and Methodology
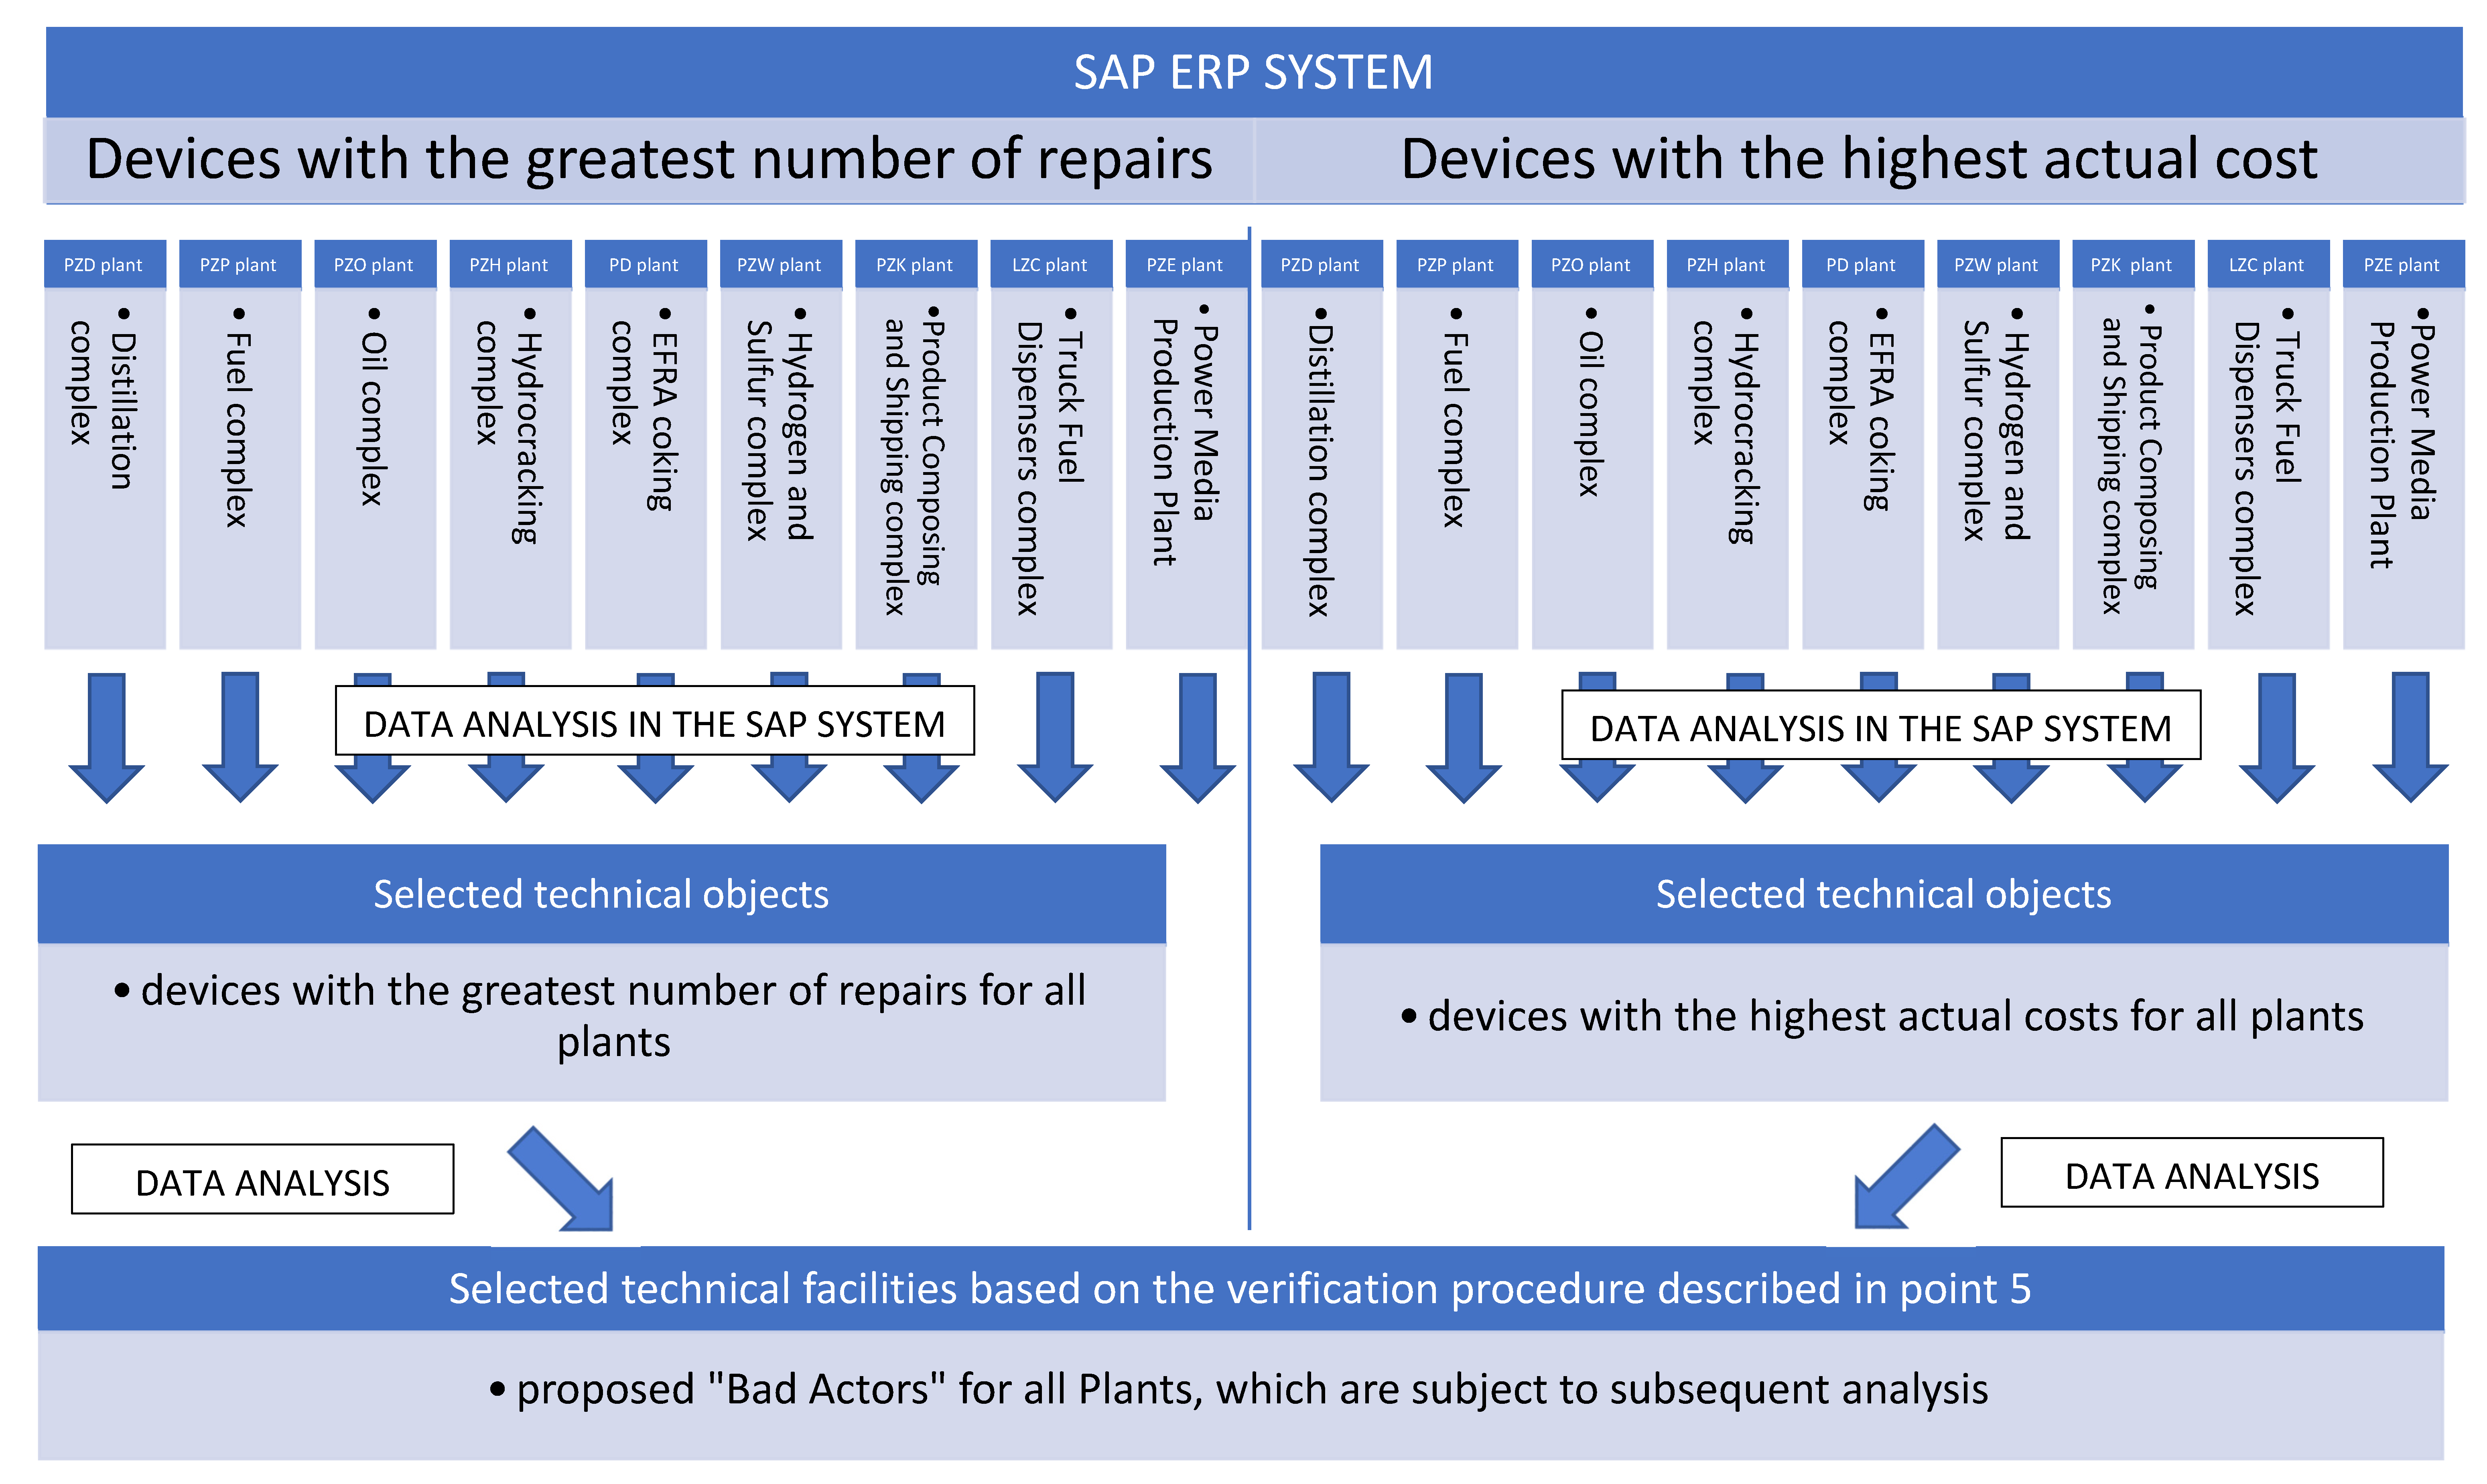
5. Method Based on the Data from the ERP System
- the selection of machines and devices is based on the experience and knowledge of the reliability engineer conducting the analysis;
- devices that are regularly repaired (preventive) cannot be taken into account, e.g., during operational shutdowns or downtime repairs;
- single repair works (even very expensive ones) should be ignored in the analysis, as they may result from modernization or repair in which very expensive spare parts were used;
- equipment repairs that are repeated cyclically, where the reports are similar to the previous ones, are important;
- look for devices with a large number of repairs and, based on historical events (repairs), consider whether they should be included in the list of “Bad Actors”.
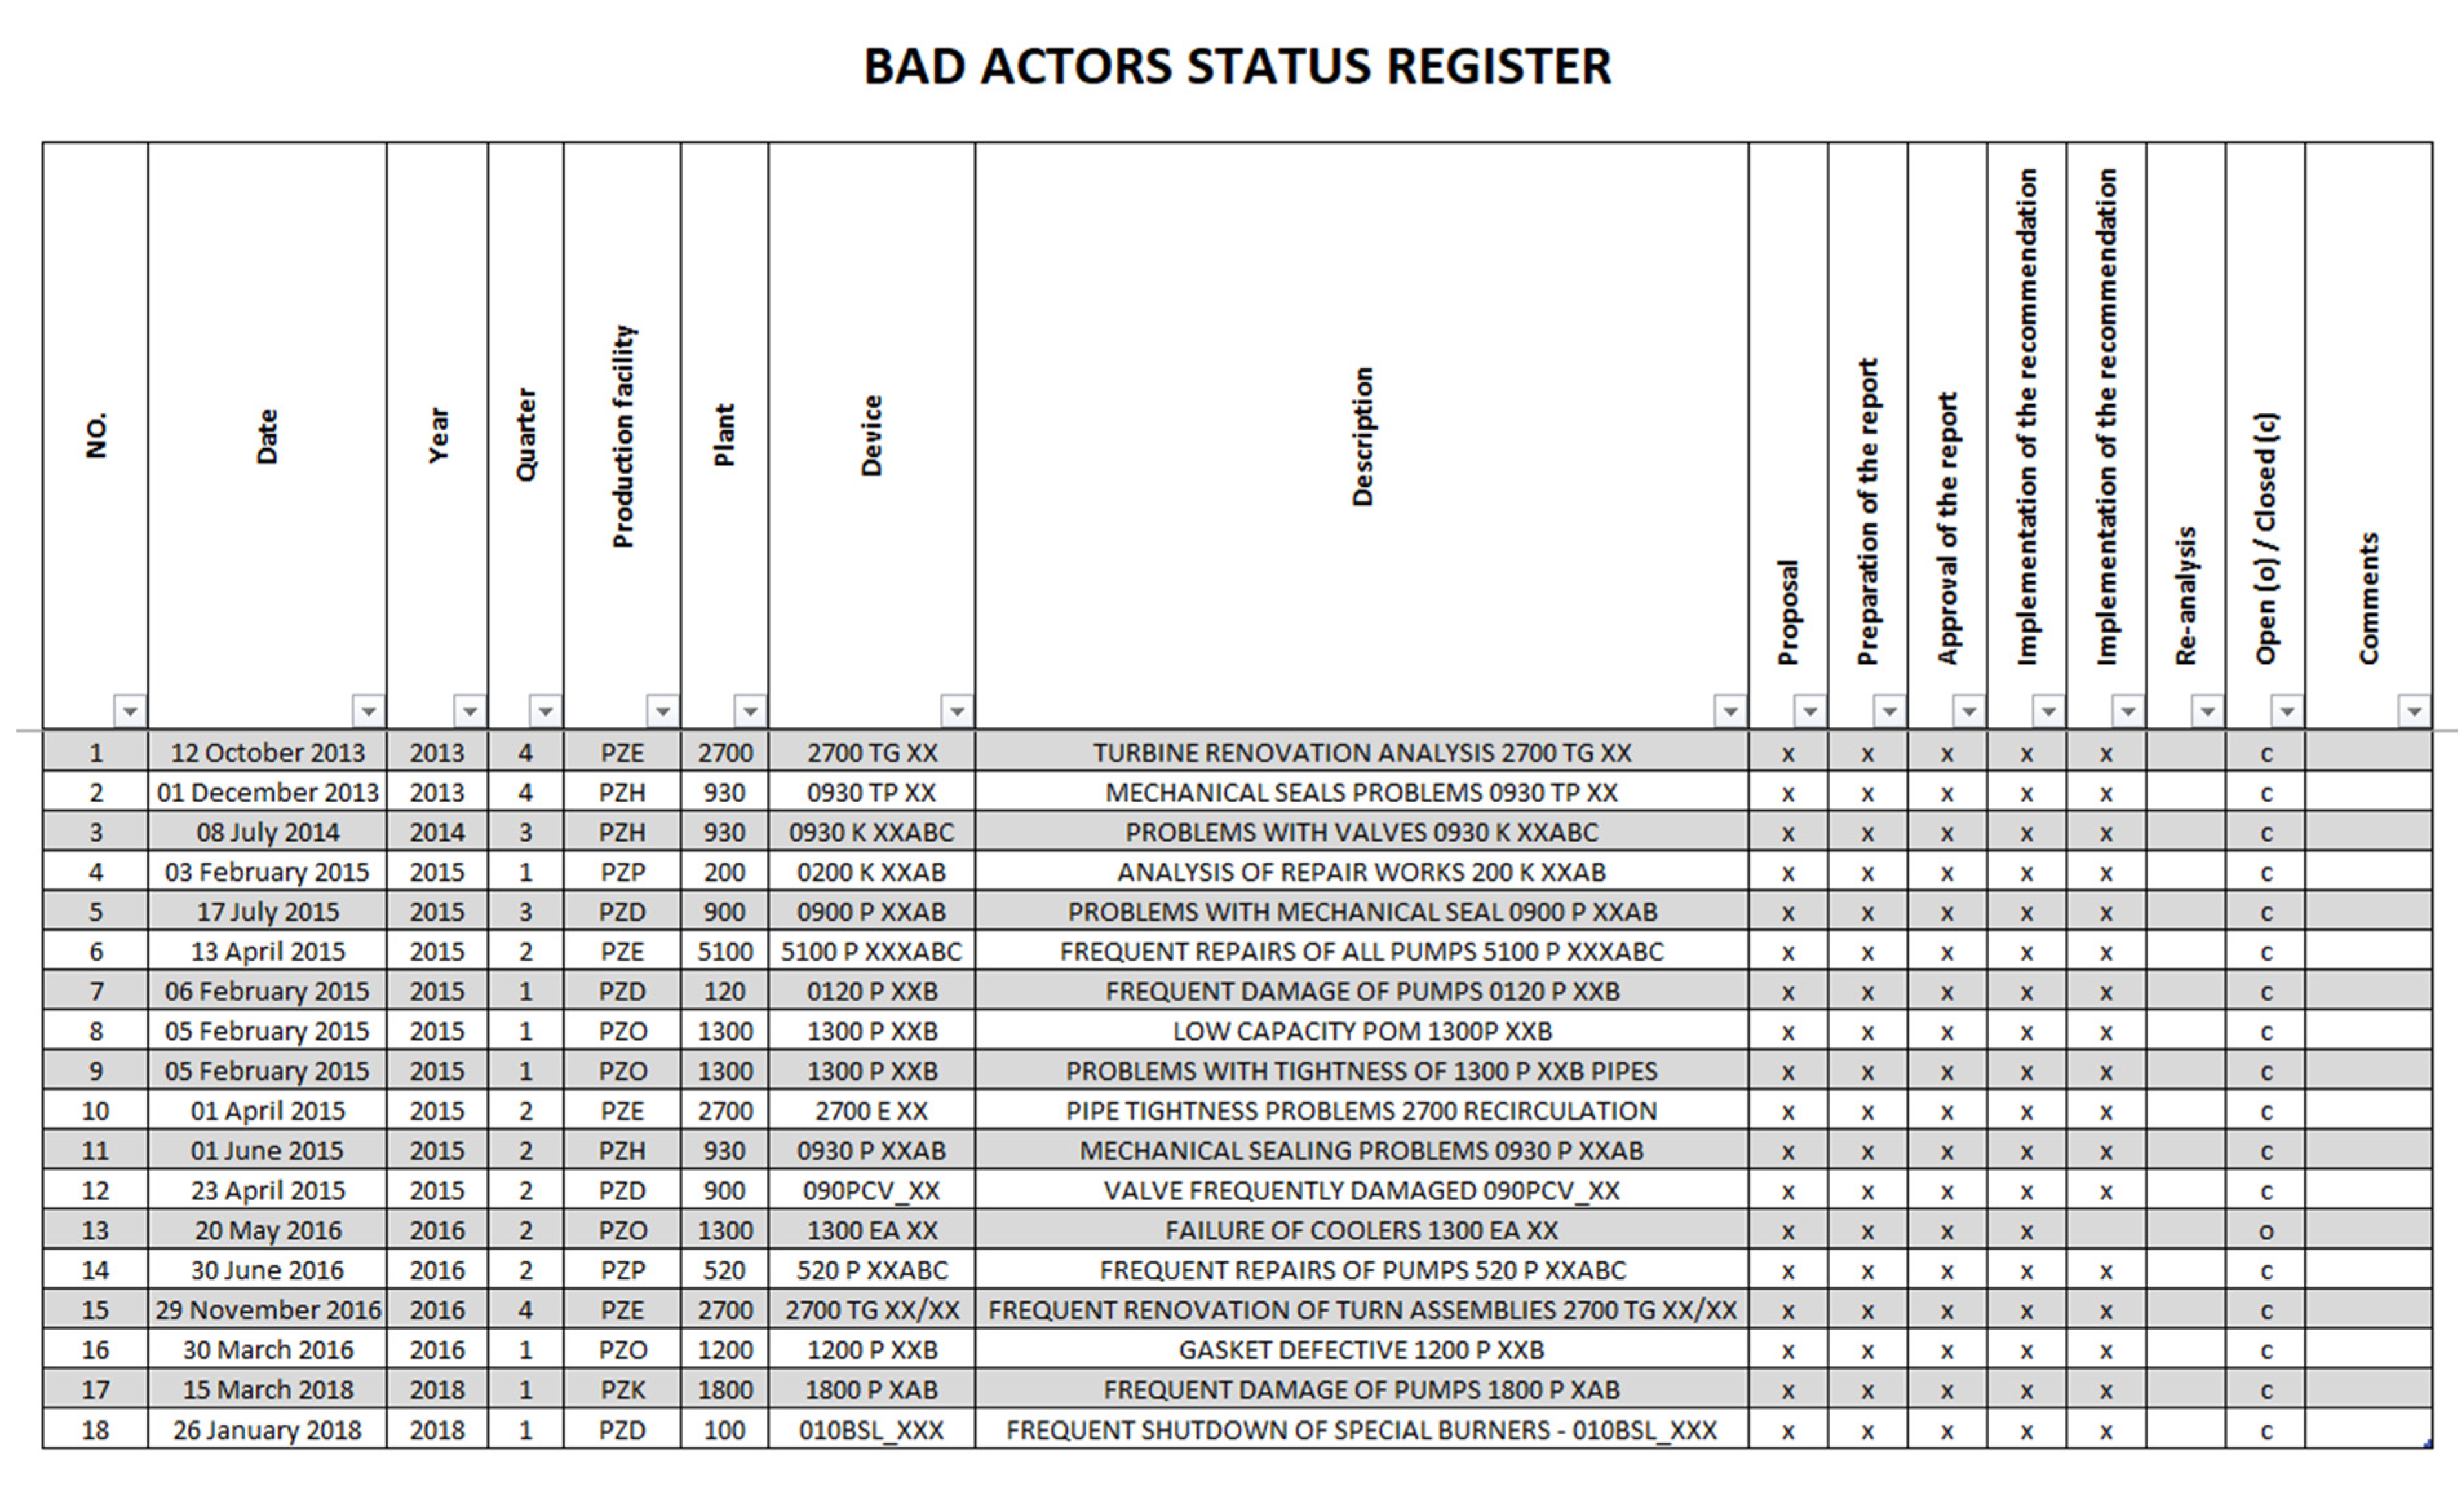
- description and number of the “Bad Actor”;
- report date;
- plant number and technological code of the Unit;
- date of the report and date of effective liquidation of the “Bad Actor”;
- team leader and team composition;
- description of the reasons for selecting the object as a “Bad Actor”;
- analyzes and tests performed (along with documentation and reports);
- conclusions from the conducted analyzes and research;
- list of attachments.
- detailed description of the task;
- criteria for the effectiveness of an implemented recommendation;
- estimated costs;
- proposed methods of implementing the recommendations;
- name and surname of the person responsible for specific tasks;
- task completion date.
6. Extended Method of the Identification of “Bad Actors”
- issuing orders for “future” work, which can sometimes be cancelled—and the order is counted as statistics anyway because it is not deleted;
- counting in the SAP transaction all orders (from all industries) issued for a given technical object, which means that there may be a lot of orders, but exposed to theoretically less important work than repair, such as sensor replacement, oil change or regulatory work;
- issuing duplicate orders because the creator did not notice that the order had already been issued, e.g., by another engineer;
- separate orders for the collection of materials and a separate one for labor.
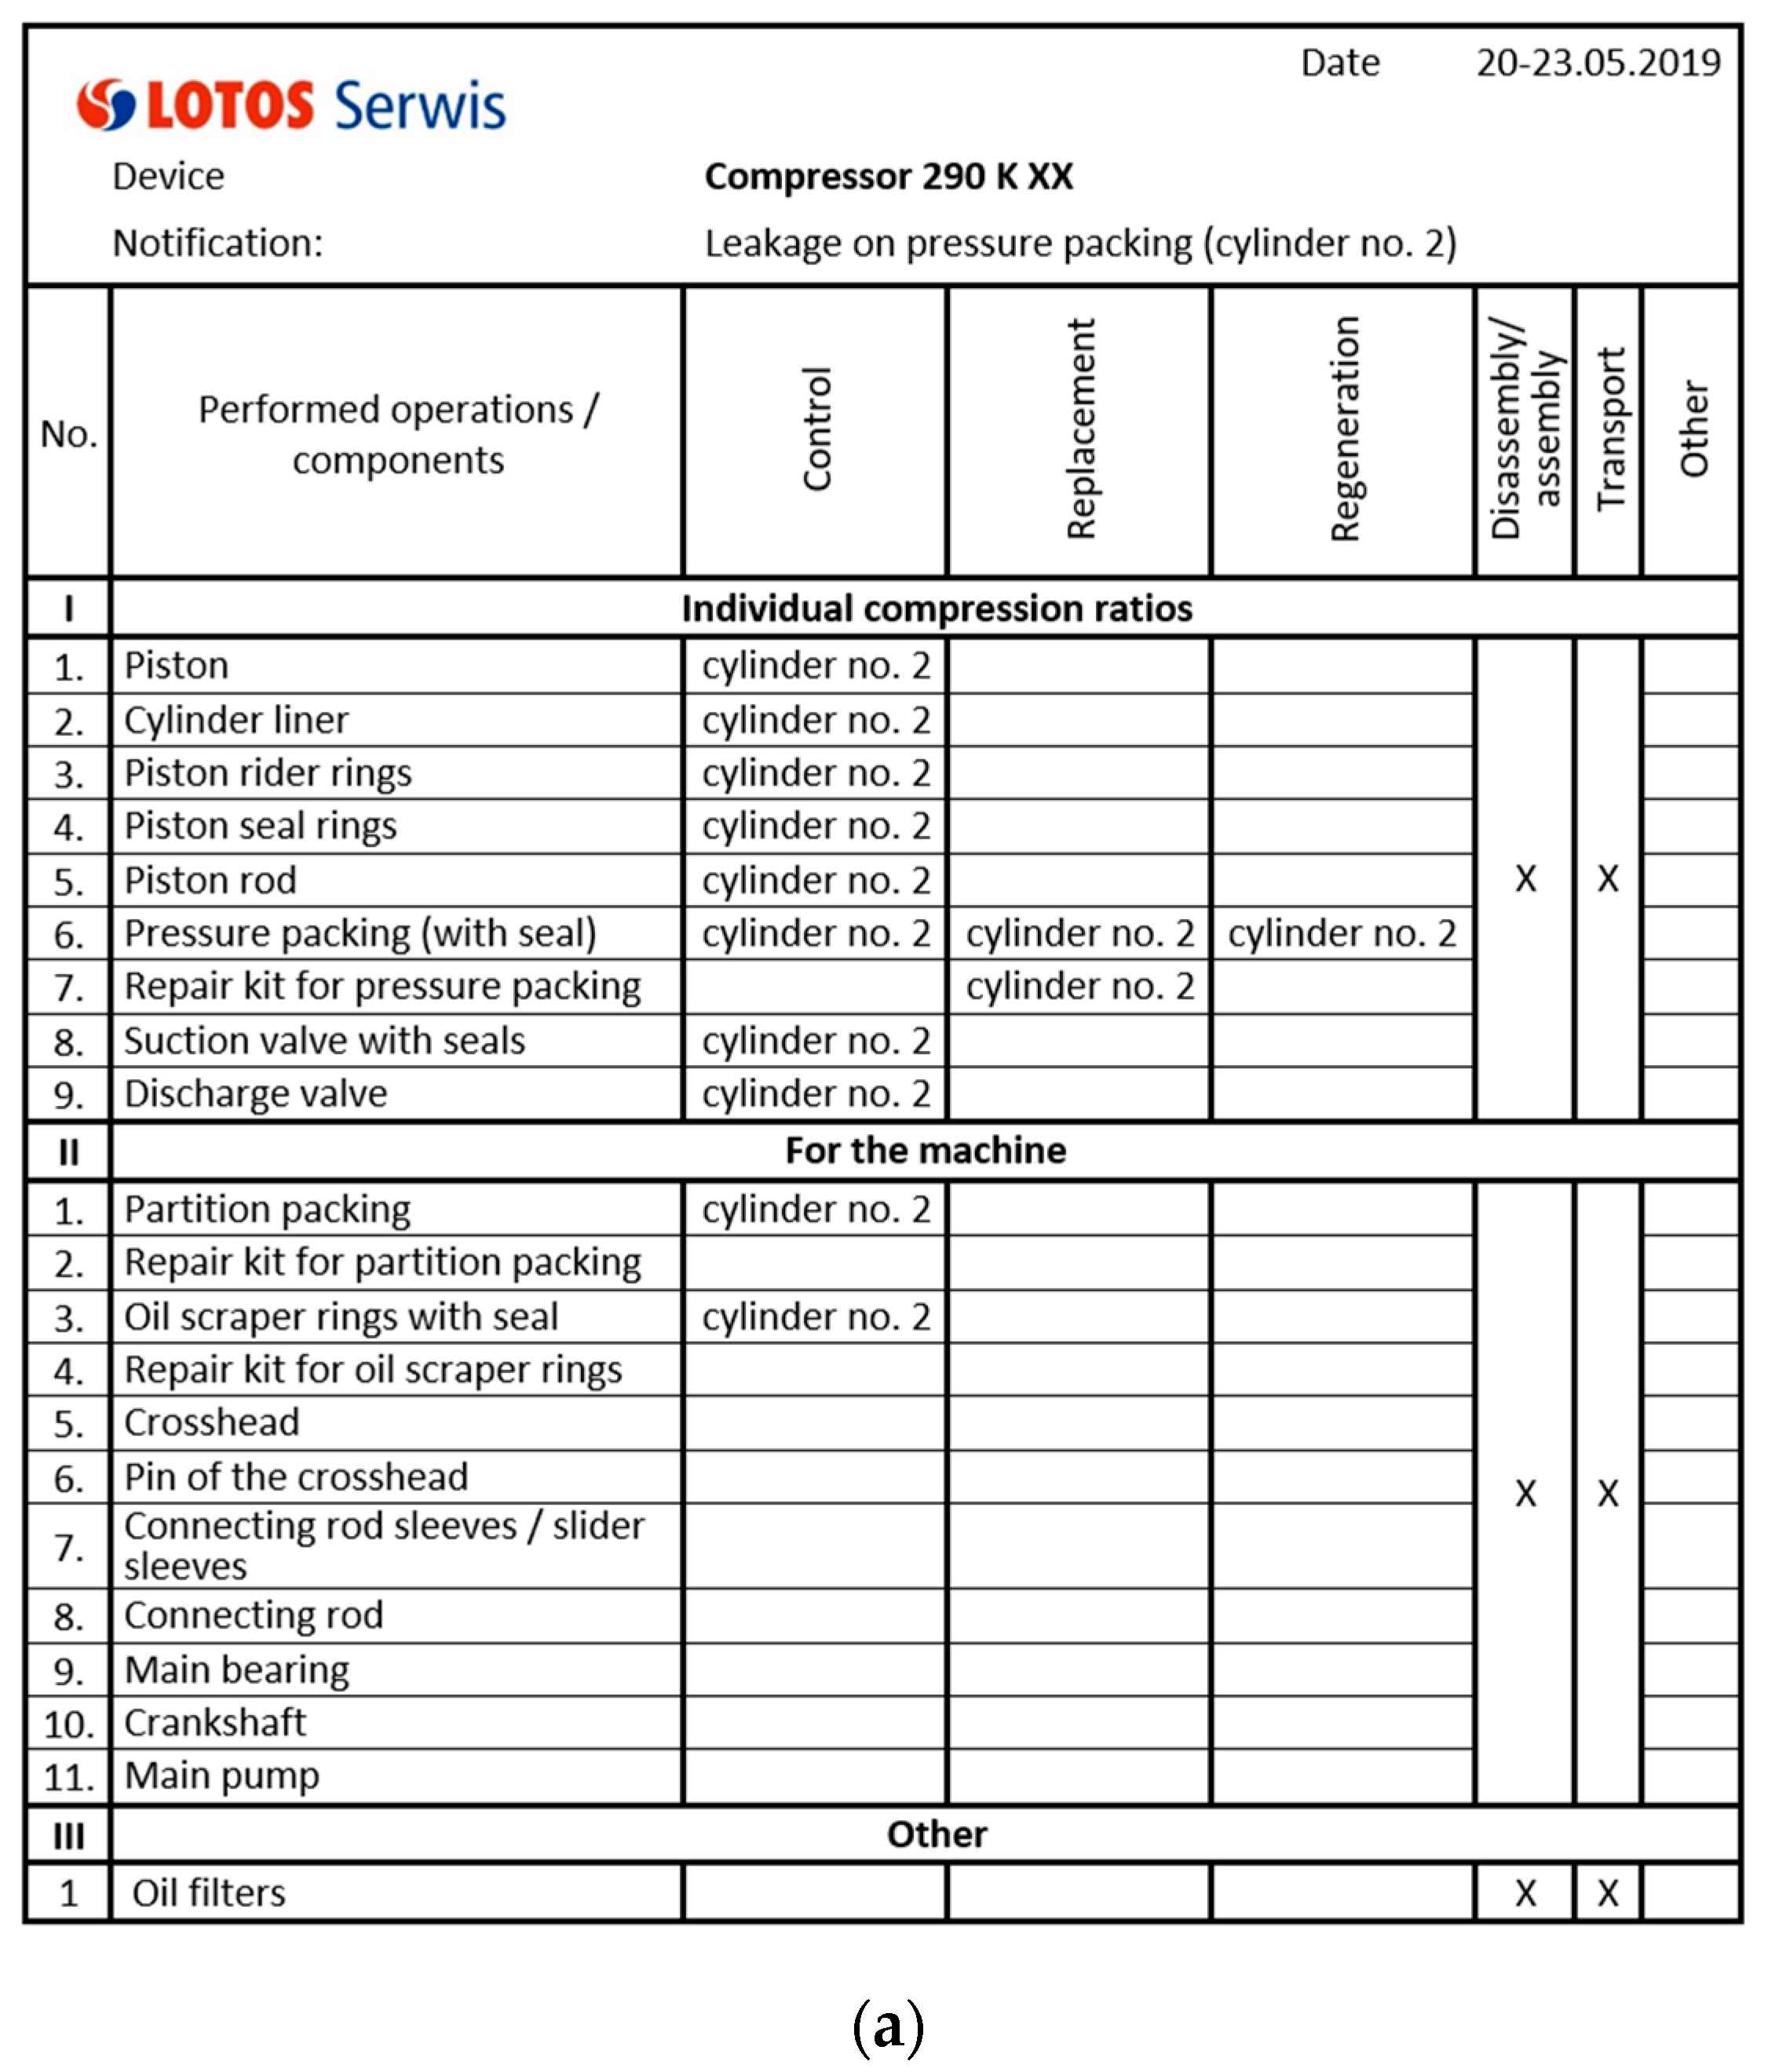
- technological number of the renovated device;
- the reason for the repair;
- date of repair;
- inspected/reconditioned/replaced parts;
- materials taken from the warehouse;
- materials for the order together with the number of the request;
- repair scope;
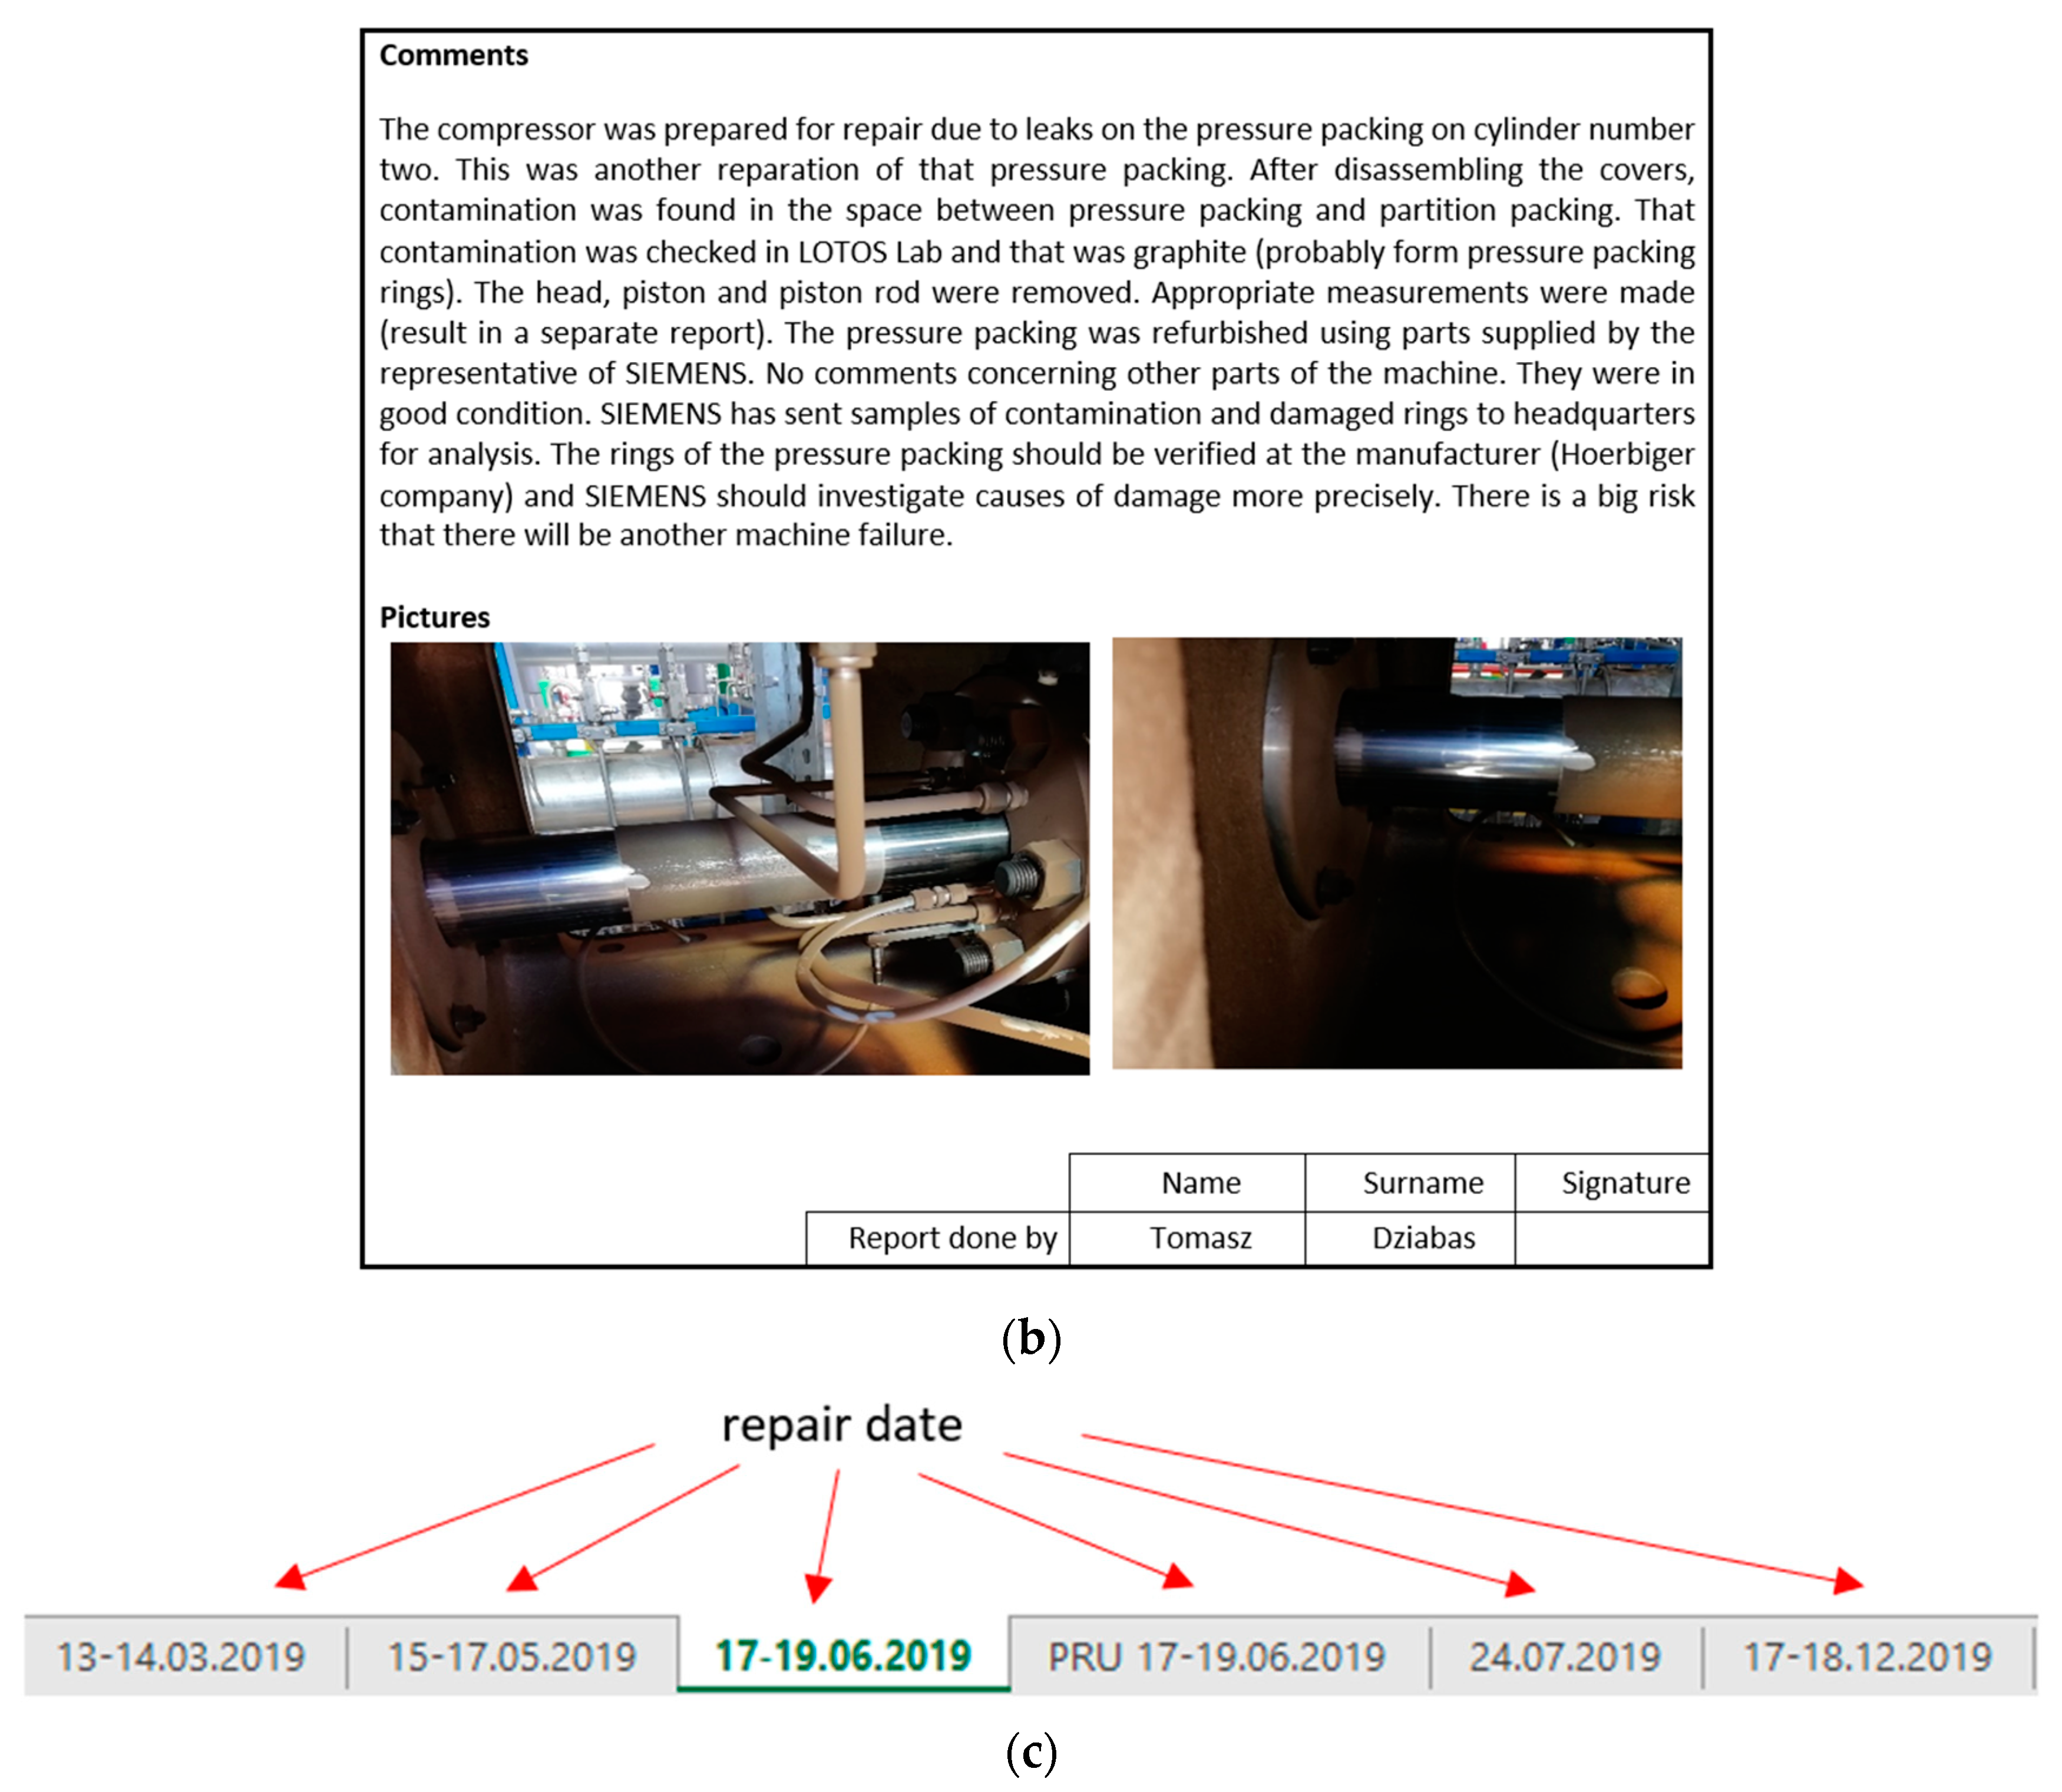
- comments and recommendations of the post-repair;
- photos;
- signature of the person responsible for the repair and creating the report.
7. Discussion and Conclusions
Author Contributions
Funding
Institutional Review Board Statement
Informed Consent Statement
Data Availability Statement
Conflicts of Interest
References
- Tambe, P.P.; Kulkarni, M.S. A superimposition based approach for maintenance and quality plan optimization with production schedule, availability, repair time and detection time constraints for a single machine. J. Manuf. Syst. 2015, 37, 17–32. [Google Scholar] [CrossRef]
- Fusko, M.; Rakyta, M.; Krajcovic, M.; Dulina, L.; Gaso, M.; Grznár, P. Basics of designing maintenance processes in industry 4.0. MM Sci. J. 2018, 2018, 2252–2259. [Google Scholar] [CrossRef]
- Stenström, C.; Norrbin, P.; Parida, A.; Kumar, U. Preventive and corrective maintenance–cost comparison and cost–benefit analysis. Struct. Infrastruct. Eng. 2016, 12, 603–617. [Google Scholar] [CrossRef]
- Amiri, S.; Honarvar, M.; Sadegheih, A. Providing an integrated Model for Planning and Scheduling Energy Hubs and preventive maintenance. Energy 2018, 163, 1093–1114. [Google Scholar] [CrossRef]
- Basri, E.I.; Razak, I.H.A.; Ab-Samat, H.; Kamaruddin, S. Preventive maintenance (PM) planning: A review. J. Qual. Maint. Eng. 2017, 23, 114–143. [Google Scholar] [CrossRef]
- Cvrk, S.; Ilijević, D. Application of diagnostics as a basis of condition based maintenance of the marine propulsion diesel engine. Brodogr. Teor. Praksa Brodogr. Pomor. Teh. 2020, 71, 119–134. [Google Scholar] [CrossRef]
- Ayo-Imoru, R.; Cilliers, A. A survey of the state of condition-based maintenance (CBM) in the nuclear power industry. Ann. Nucl. Energy 2018, 112, 177–188. [Google Scholar] [CrossRef]
- Goodman, D.; Hofmeister, J.P.; Szidarovszky, F. Prognostics and Health Management: A Practical Approach to Improving System Reliability Using Condition-Based Data; John Wiley & Sons: Hoboken, NJ, USA, 2019. [Google Scholar]
- Carvalho, T.P.; Soares, F.A.; Francisco, R.D.; Basto, J.P.; Alcalá, S.G. A systematic literature review of machine learning methods applied to predictive maintenance. Comput. Ind. Eng. 2019, 137, 106024. [Google Scholar] [CrossRef]
- Zonta, T.; da Costa, C.A.; da Rosa Righi, R.; de Lima, M.J.; da Trindade, E.S.; Li, G.P. Predictive maintenance in the Industry 4.0: A systematic literature review. Comput. Ind. Eng. 2020, 150, 106889. [Google Scholar] [CrossRef]
- Agustiady, T.K.; Cudney, E.A. Total productive maintenance. Total Qual. Manag. Bus. Excell. 2018, 1–8. [Google Scholar] [CrossRef]
- Habidin, N.F.; Hashim, S.; Fuzi, N.M.; Salleh, M.I. Total productive maintenance, kaizen event, and performance. Int. J. Qual. Reliab. Manag. 2018, 35, 1853–1867. [Google Scholar] [CrossRef]
- Nurprihatin, F.; Angely, M.; Tannady, H. Total productive maintenance policy to increase effectiveness and maintenance performance using overall equipment effectiveness. J. Appl. Res. Ind. Eng. 2019, 6, 184–199. [Google Scholar] [CrossRef]
- Willmott, P.; McCarthy, D. TPM-: A Route to World Class Performance; Newnes Elsevier Ltd.: Amsterdam, The Netherlands, 2001; p. 264. [Google Scholar]
- Legutko, S. Development Trends in Machines Operation Maintenance. Eksploat. I Niezawodn. Maint. Reliab. 2009, 2, 8–16. [Google Scholar]
- Alrifaey, M.; Hong, T.S.; As’Arry, A.; Supeni, E.E.; Ang, C.K. Optimization and Selection of Maintenance Policies in an Electrical Gas Turbine Generator Based on the Hybrid Reliability-Centered Maintenance (RCM) Model. Processes 2020, 8, 670. [Google Scholar] [CrossRef]
- Sifonte, J.R.; Reyes-PicknellI, J.V. Reliability Centered Maintenance-Reengineered: Practical Optimization of the RCM Process with RCM-R; Productivity Press: Boca Raton, FL, USA, 2017; p. 367. [Google Scholar] [CrossRef]
- García, J.R.; Martinetti, A.; Becker, J.M.; Singh, S.; van Dongen, L.A. Towards an industry 4.0-based maintenance approach in the manufacturing processes. In Research Anthology on Cross-Industry Challenges of Industry 4.0; IGI Global: Hershey, PA, USA, 2021. [Google Scholar]
- Canizo, M.; Onieva, E.; Conde, A.; Charramendieta, S.; Trujillo, S. Real-time predictive maintenance for wind turbines using Big Data frameworks. In Proceedings of the IEEE International Conference on Prognostics and Health Management (ICPHM), Dallas, TX, USA, 19–21 June 2017; pp. 70–77. [Google Scholar] [CrossRef]
- Matyas, K.; Nemeth, T.; Kovacs, K.; Glawar, R. A procedural approach for realizing prescriptive maintenance planning in manufacturing industries. CIRP Ann. 2017, 66, 461–464. [Google Scholar] [CrossRef]
- Marques, H.; Giacotto, A. Prescriptive maintenance: Building alternative plans for smart operations. Marques, Henrique, and Alessandro Giacotto. “Prescriptive maintenance: Building alternative plans for smart operations.” FT2019. In Proceedings of the 10th Aerospace Technology Congress, Stockholm, Sweden, 8–9 October 2019; Linköping University Electronic Press: Stockholm, Sweden; pp. 231–236. [Google Scholar]
- Jasiulewicz-Kaczmarek, M.; Legutko, S.; Kluk, P. Maintenance 4.0 technologies–new opportunities for sustainability driven maintenance. Manag. Prod. Eng. Rev. 2020, 11, 74–87. [Google Scholar]
- Chen, C.; Wang, C.; Lu, N.; Jiang, B.; Xing, Y. A data-driven predictive maintenance strategy based on accurate failure prognostics. Eksploat. i Niezawodn.-Maint. Reliab. 2021, 23, 387–394. [Google Scholar] [CrossRef]
- Jasiulewicz-Kaczmarek, M.; Antosz, K.; Wyczółkowski, R.; Mazurkiewicz, D.; Sun, B.; Qian, C.; Ren, Y. Application of MICMAC, Fuzzy AHP, and Fuzzy TOPSIS for evaluation of the maintenance factors affecting sustainable manufacturing. Energies 2021, 14, 1436. [Google Scholar] [CrossRef]
- Lad, B.K.; Kulkarni, M.S. Optimal maintenance schedule decisions for machine tools considering the user’s cost structure. Int. J. Prod. Res. 2012, 50, 5859–5871. [Google Scholar] [CrossRef]
- Amachree, T.T. Development of an Optimal Planning and Maintenance System (A Case Study of Shell Petroleum Development Company, Obigbo Node). Int. J. Sci. Technol. Res. 2017, 6, 112–124. [Google Scholar]
- Andrawus, J.A.; Watson, J.; Kishk, M.; Adam, A. The selection of a suitable maintenance strategy for wind turbines. Wind. Eng. 2006, 30, 471–486. [Google Scholar] [CrossRef]
- Lee, J.; Mitici, M. An integrated assessment of safety and efficiency of aircraft maintenance strategies using agent-based modelling and stochastic Petri nets. Reliab. Eng. Syst. Saf. 2020, 202, 107052. [Google Scholar] [CrossRef]


| List of the Main Devices of the LOTOS Refinery | ||||
|---|---|---|---|---|
| No. | Machine Type | Quantity of Machines | ||
|
Before 10+ (Until 2009) | After 10+ | After EFRA | ||
| 1. | Pumps | 1260 | 1640 | 1870 |
| 2. | Compressors, turbines | 75 | 91 | 103 |
| 3. | Fans, blowers | 51 | 81 | 105 |
| 4. | Radiator fans | 200 | 380 | 424 |
| 5. | Valve drives | 400 | 500 | 640 |
| 6. | Mixers | 180 | 210 | 220 |
| Total: Rotating machines | 2166 | 2902 | 3362 | |
| 7. | Engines 10000V | 144 | 162 | 178 |
| 8. | Engines 6000V | 22 | 31 | 42 |
| 9. | Engines 380/400V | 2498 | 3238 | 3452 |
| 10. | Engines 230V | 21 | 32 | 44 |
| Total: Engines | 2685 | 3463 | 3716 | |
| 11. | Regulating and on-off valves | 3700 | 4800 | 6000 |
| 12. | Pressure Safety Valves | 1866 | 2433 | 2862 |
| Total: Valves | 5566 | 7233 | 8862 | |
| Sum | 10,417 | 13,598 | 15,940 | |
| Group | Classification | Number of Devices |
|---|---|---|
| I | Critical equipment | 284 |
| II | Semi-critical equipment | 407 |
| III | Important equipment | 1051 |
| IV | Other machines | 969 |
| No. | Technological Number of the Machine | MPK | Criticality | Planned Date of Work Completion | |||||||||||||||||||||||||
| Weeks 1–26 of the Year 2021 | |||||||||||||||||||||||||||||
| 1 | 2 | 3 | 4 | 5 | 6 | 7 | 8 | 9 | 10 | 11 | 12 | 13 | 14 | 15 | 16 | 17 | 18 | 19 | 20 | 21 | 22 | 23 | 24 | 25 | 26 | ||||
| 1. | 0150-KXXX | 1311 | MK | X | X | X | X | X | X | X | X | X | |||||||||||||||||
| 2. | 0150-TKXXX | 1311 | MK | X | X | X | X | X | X | X | X | X | |||||||||||||||||
| 3. | 0150-KXXX-PXXXA | 1311 | SK | X | X | X | X | X | X | X | X | ||||||||||||||||||
| 4. | 0150-KXXX-PXXXB | 1311 | MW | O | O | O | O | O | O | O | X | X | |||||||||||||||||
| 5. | 0150-KXXXA | 1311 | SK | X | X | X | X | X | O | O | X | O | |||||||||||||||||
| 6. | 0150-KXXXA-PXXXA * | 1311 | MK | 13 | 13 | 13 | 13 | 13 | 13 | 13 | 13 | ||||||||||||||||||
| 7. | 0150-KXXXA-PXXXB | 1311 | SK | O | O | O | O | O | X | O | X | ||||||||||||||||||
| 8. | 0150-KXXXA-PXXXA | 1311 | SK | O | O | O | O | X | X | X | X | O | |||||||||||||||||
| 9. | 0150-KXXXA-PXXXB | 1311 | MW | X | X | X | X | X | X | O | X | X | |||||||||||||||||
| 10. | 0150-KXXXB | 1311 | SK | O | O | X | X | X | X | X | X | X | X | X | |||||||||||||||
| 11. | 0150-KXXXB-PXXXA * | 1311 | SK | 13 | 13 | 13 | 13 | 13 | 13 | 13 | 13 | ||||||||||||||||||
| 12. | 0150-KXXXB-PXXXB | 1311 | SK | X | O | O | O | O | O | O | O | ||||||||||||||||||
| 13. | 0150-KXXXC | 1311 | MK | X | X | X | X | O | O | X | X | O | X | ||||||||||||||||
| 14. | 0150-KXXXC-PXXXA * | 1311 | MW | 13 | 13 | 13 | 13 | 13 | 13 | 13 | 13 | ||||||||||||||||||
| 15. | 0150-KXXXC-PXXXB | 1311 | SK | O | X | X | X | O | O | X | O | ||||||||||||||||||
| No. | Technological Number of the Machine | MPK | Criticality | Planned Date of Work Completion | |||||||||||||||||||||||||
| Weeks 27–52 of the Year 2021 | |||||||||||||||||||||||||||||
| 27 | 28 | 29 | 30 | 31 | 32 | 33 | 34 | 35 | 36 | 37 | 38 | 39 | 40 | 41 | 42 | 43 | 44 | 45 | 46 | 47 | 48 | 49 | 50 | 51 | 52 | ||||
| 1. | 0150-KXXX | 1311 | MK | 11 | 11 | 11 | 11 | 11 | 11 | 11 | 11 | 11 | |||||||||||||||||
| 2. | 0150-TKXXX | 1311 | MK | 11 | 11 | 11 | 11 | 11 | 11 | 11 | 11 | 11 | |||||||||||||||||
| 3. | 0150-KXXX-PXXXA | 1311 | SK | 13 | 13 | 13 | 13 | 13 | 13 | 13 | 13 | 13 | |||||||||||||||||
| 4. | 0150-KXXX-PXXXB | 1311 | MW | 13 | 13 | 13 | 13 | 13 | 13 | 13 | 13 | 13 | |||||||||||||||||
| 5. | 0150-KXXXA | 1311 | SK | 11 | 11 | 11 | 11 | 11 | 11 | 11 | 11 | 11 | |||||||||||||||||
| 6. | 0150-KXXXA-PXXXA * | 1311 | MK | 13 | 13 | 13 | 13 | 13 | 13 | 13 | 13 | 13 | |||||||||||||||||
| 7. | 0150-KXXXA-PXXXB | 1311 | SK | 13 | 13 | 13 | 13 | 13 | 13 | 13 | 13 | 13 | |||||||||||||||||
| 8. | 0150-KXXXA-PXXXA | 1311 | SK | 13 | 13 | 13 | 13 | 13 | 13 | 13 | 13 | 13 | |||||||||||||||||
| 9. | 0150-KXXXA-PXXXB | 1311 | MW | 13 | 13 | 13 | 13 | 13 | 13 | 13 | 13 | 13 | |||||||||||||||||
| 10. | 0150-KXXXB | 1311 | SK | 11 | 11 | 11 | 11 | 11 | 11 | 11 | 11 | ||||||||||||||||||
| 11. | 0150-KXXXB-PXXXA * | 1311 | SK | 13 | 13 | 13 | 13 | 13 | 13 | 13 | 13 | 13 | |||||||||||||||||
| 12. | 0150-KXXXB-PXXXB | 1311 | SK | 13 | 13 | 13 | 13 | 13 | 13 | 13 | 13 | 13 | |||||||||||||||||
| 13. | 0150-KXXXC | 1311 | MK | 11 | 11 | 11 | 11 | 11 | 11 | 11 | 11 | ||||||||||||||||||
| 14. | 0150-KXXXC-PXXXA * | 1311 | MW | 13 | 13 | 13 | 13 | 13 | 13 | 13 | 13 | 13 | |||||||||||||||||
| 15. | 0150-KXXXC-PXXXB | 1311 | SK | 13 | 13 | 13 | 13 | 13 | 13 | 13 | 13 | 13 | |||||||||||||||||
| Functional Location | Created Orders | Actual Total Costs in PLN | Own Materials Costs in PLN | Service Costs in PLN | Own Salary Costs in PLN |
|---|---|---|---|---|---|
| Sum | 457 | 3,935,572.81 | 1,924,336.95 | 481,170.00 | 1,530,065.86 |
| 0500-PXXA | 10 | 531,983.16 | 78,983.16 | 453,000 | 0 |
| 0410-KXXB | 9 | 425,095.38 | 381,766.51 | 0 | 43,328.87 |
| 0520-PXXXA | 3 | 299,741.38 | 280,049.6 | 0 | 19,691.78 |
| 0200-KXXA | 12 | 198,447.71 | 10,207.58 | 0 | 188,240.13 |
| 0500-WYYB | 7 | 134,316.68 | 61,970.88 | 0 | 72,345.8 |
| 0440-EAXXF | 6 | 132,764.97 | 132,764.97 | 0 | 0 |
| 0520-PXXXB | 8 | 125,586.93 | 74,244.63 | 0 | 51,342.3 |
| 0440-KXXC | 1 | 99,467.22 | 55,244.82 | 0 | 44,222.4 |
| 0200-PXXXC | 5 | 59,209.67 | 59,209.67 | 0 | 0 |
| 0200-MXXX | 1 | 57,807.29 | 53,071.03 | 0 | 4736.26 |
| 0200-PYYYC | 6 | 55,694.84 | 54,619.16 | 0 | 1075.68 |
| 0500-WXXA | 3 | 53,671.02 | 191.24 | 0 | 53,479.78 |
| 0200-PYYYB | 2 | 50,002.9 | 22,927.35 | 0 | 27,075.55 |
| 0520-PYYYC | 5 | 46,536.11 | 21,768.71 | 0 | 24,767.4 |
| 0440-PXXB | 1 | 44,618.91 | 43,294.23 | 0 | 1324.68 |
| 0520-KXXA | 4 | 41,706.92 | 32,496.95 | 0 | 9209.97 |
| 0470-PXXXA | 3 | 40,184.54 | 15,644.03 | 10,690 | 13,850.51 |
| 0850-PZZZ | 8 | 39,567.4 | 14,766.53 | 0 | 24,800.87 |
| 0710-PXX | 1 | 38,510.04 | 12,504.07 | 0 | 26,005.97 |
| 0120-PXXX | 1 | 36,038.96 | 26,502.72 | 0 | 9536.24 |
| 0520-KXXB | 3 | 34,962.65 | 17,528.13 | 0 | 17,434.52 |
| 0350-PXXXB | 1 | 34,478.95 | 23,990.31 | 0 | 10,488.64 |
| 0200-PXXB | 2 | 33,739.67 | 20,907.58 | 0 | 12,832.09 |
| 0520-KXX | 1 | 33,213.35 | 18,622.72 | 0 | 14,590.63 |
| 0440P-YY | 1 | 32,668.12 | 23,706.02 | 0 | 8962.1 |
| 0350-PYY | 3 | 30,319.96 | 16,951.05 | 0 | 13,368.91 |
| 0500-PYYC | 2 | 28,444.79 | 6188.89 | 17,480 | 4775.9 |
| 0440-PXXA | 1 | 26,996.13 | 20,542.05 | 0 | 6454.08 |
| 0500-PXX | 2 | 25,945.01 | 24,301.61 | 0 | 1643.4 |
| 0200-ZZZB | 1 | 25,926.55 | 11,090.14 | 0 | 14,836.41 |
| Functional Location | Created Orders | Actual Total Costs in PLN | Own Materials Costs in PLN | Service Costs in PLN | Own Salary Costs in PLN |
|---|---|---|---|---|---|
| Sum | 457 | 3,935,572.81 | 1,924,336.95 | 481,170.00 | 1,530,065.86 |
| 0200-KXXA | 12 | 198,447.71 | 10,207.58 | 0 | 188,240.13 |
| 0500-PXXA | 10 | 531,983.16 | 78,983.16 | 453,000 | 0 |
| 0410-KXXB | 9 | 425,095.38 | 381,766.51 | 0 | 43,328.87 |
| 0520-PXXXB | 8 | 125,586.93 | 74,244.63 | 0 | 51,342.3 |
| 0850-PZZZ | 8 | 39,567.4 | 14,766.53 | 0 | 24,800.87 |
| 0500-WYYB | 7 | 134,316.68 | 61,970.88 | 0 | 72,345.8 |
| 0440-EAXXF | 6 | 132,764.97 | 132,764.97 | 0 | 0 |
| 0200-PYYYC | 6 | 55,694.84 | 54,619.16 | 0 | 1075.68 |
| 0200-PXXXC | 5 | 59,209.67 | 59,209.67 | 0 | 0 |
| 0520-PYYYC | 5 | 46,536.11 | 21,768.71 | 0 | 24,767.4 |
| 0520-KXXA | 4 | 41,706.92 | 32,496.95 | 0 | 9209.97 |
| 0520-PXXXA | 3 | 299,741.38 | 280,049.6 | 0 | 19,691.78 |
| 0500-WXXA | 3 | 53,671.02 | 191.24 | 0 | 53,479.78 |
| 0470-PXXXA | 3 | 40,184.54 | 15,644.03 | 10,690 | 13,850.51 |
| 0520-KXXB | 3 | 34,962.65 | 17,528.13 | 0 | 17,434.52 |
| 0350-PYY | 3 | 30,319.96 | 16,951.05 | 0 | 13,368.91 |
| 0200-PYYYB | 2 | 50,002.9 | 22,927.35 | 0 | 27,075.55 |
| 0200-PXXB | 2 | 33,739.67 | 20,907.58 | 0 | 12,832.09 |
| 0500-PYYC | 2 | 28,444.79 | 6188.89 | 17,480 | 4775.9 |
| 0500-PXX | 2 | 25,945.01 | 24,301.61 | 0 | 1643.4 |
| 0440-KXXC | 1 | 99,467.22 | 55,244.82 | 0 | 44,222.4 |
| 0200-MXXX | 1 | 57,807.29 | 53,071.03 | 0 | 4736.26 |
| 0440-PXXB | 1 | 44,618.91 | 43,294.23 | 0 | 1324.68 |
| 0710-PXX | 1 | 38,510.04 | 12,504.07 | 0 | 26,005.97 |
| 0120-PXXX | 1 | 36,038.96 | 26,502.72 | 0 | 9536.24 |
| 0350-PXXXB | 1 | 34,478.95 | 23,990.31 | 0 | 10,488.64 |
| 0520-KXX | 1 | 33,213.35 | 18,622.72 | 0 | 14,590.63 |
| 0440P-YY | 1 | 32,668.12 | 23,706.02 | 0 | 8962.1 |
| 0440-PXXA | 1 | 26,996.13 | 20,542.05 | 0 | 6454.08 |
| 0200-ZZZB | 1 | 25,926.55 | 11,090.14 | 0 | 14,836.41 |
| 2019 | 2020 | 2021 (Until September 2021) | ||||||
|---|---|---|---|---|---|---|---|---|
| Technological No. | Number of Repairs | Amount of Repairs | Technological No. | Number of Repairs | Amount of Repairs | Technological No. | Number of Repairs | Amount of Repairs |
| 1100-KXXA | 13 | 222,913.94 | 1100-KXXXA | 5 | 282,564.08 | 1100-PXXXA | 5 | 274,834.08 |
| 1100-PXXXA | 4 | 407,816.61 | 0100-PXXXB | 4 | 752,633.24 | 0920-PXXXB | 2 | 568 766.85 |
| 0200-PXXX | 8 | 126,242.26 | 0100-PXXXA | 6 | 170,424.05 | 0920-PXXXA | 3 | 684,484.69 |
| 0440-KXXXB | 3 | 487,321.17 | 0520-KXXXB | 6 | 135,084.28 | 1300-PXXXB | 7 | 492,874.42 |
| 1200-PXXXA | 6 | 47,999.32 | 1300-KXXXA | 4 | 150,778.84 | 0270-KXXXC | 6 | 284,830.21 |
| 0930-PXXA | 7 | 239,304.01 | 0930-PXXXA | 5 | 171,740.11 | 0960-PXXX | 12 | 2,572,858.24 |
| 0930-PXXB | 5 | 316,625.83 | 0930-PXXXB | 5 | 400,796.04 | 1800-PXXX | 4 | 155,934.70 |
| 0930-PXXXA | 3 | 168,740.08 | 0860-PXXXA | 9 | 25,265.33 | 4900-PXXXB | 4 | 71,066.95 |
| 0930-PXXXB | 4 | 151,794.09 | 0270-KXXXA | 9 | 245,611.60 | 2700-TGXXX | 6 | 217,495.11 |
| 0930-PYYB | 5 | 137,036.04 | 0270-KXXXB | 8 | 191,088.35 | 0290-KXXX | 5 | 19,354.97 |
| 9700-PXXB | 7 | 70,037.91 | 0270-KXXXC | 6 | 535,032.84 | 0200-KXA | 12 | 198,447.71 |
| 0270-KXXB | 3 | 502,985.66 | 0290-KXXX | 8 | 227,908.63 | 0500-PXXA | 10 | 531,983.16 |
| 0290-KXXX | 11 | 132,095.31 | 0960-PXXX | 6 | 91,038.44 | 0410-KXXB | 9 | 425,095.38 |
| 0960-PXXX | 8 | 51,114.74 | 0960-PXXXA | 3 | 361,022.82 | 1100-KXXA | 8 | 125,586.93 |
| 4060-PXXXA | 13 | 264,895.51 | 4060-PXXXA | 9 | 260,020.00 | |||
| 4060-PXXXB | 6 | 16,725.99 | 1800-PXXX | 3 | 90,194.24 | |||
| 2900-CFXXX | 6 | 193,739.53 | 2700-TGYYY | 8 | 1,986,621.20 | |||
| 2700-TGXXX | 10 | 2,809,496.44 | 2700-TGXXX | 5 | 9170.50 | |||
| Year | Pumps | Compressors and Turbines | Mixers and Fans |
|---|---|---|---|
| 2020 | 52 | 40 | 54 |
| until 09.2021 | 66 | 54 | 64 |
| Production facility | Pumps | Compressors and Turbines | Mixers and Fans | |||
|---|---|---|---|---|---|---|
| - | 2020 | 2021 | 2020 | 2021 | 2020 | 2021 |
| PZD | 37 | 48 | 24 | 53 | 48 | 58 |
| PZP | 56 | 64 | 17 | 30 | 52 | 60 |
| PZO | 44 | 48 | 34 | 21 | 36 | 40 |
| PZH | 36 | 50 | 39 | 42 | 48 | 54 |
| PZF (PD) | 76 | 70 | 69 | 39 | 56 | 62 |
| PZW | 60 | 68 | 38 | 29 | 42 | 50 |
| PZK | 84 | 92 | - | - | 34 | 39 |
| LZC | 69 | 58 | - | - | - | - |
| Production Facility | 2020 | |||||||||||
| 01.2020 | 02.2020 | 03.2020 | 04.2020 | 05.2020 | 06.2020 | 07.2020 | 08.2020 | 09.2020 | 10.2020 | 11.2020 | 12.2020 | |
| PZD | 52 | 48 | 46 | 45 | 42 | 40 | 39 | 39 | 37 | 37 | 37 | 37 |
| PZP | 74 | 73 | 71 | 70 | 70 | 69 | 67 | 65 | 64 | 62 | 64 | 56 |
| PZO | 48 | 44 | 44 | 40 | 39 | 38 | 37 | 35 | 34 | 34 | 36 | 44 |
| PZA | 34 | 33 | 33 | 31 | 30 | 28 | 28 | 28 | 28 | 29 | 36 | 41 |
| PZH | 47 | 47 | 46 | 46 | 44 | 45 | 43 | 41 | 41 | 39 | 37 | 36 |
| PZW | 102 | 95 | 84 | 74 | 70 | 68 | 64 | 61 | 60 | 62 | 60 | 60 |
| PZF (PD) | 146 | 139 | 132 | 126 | 116 | 98 | 94 | 90 | 84 | 86 | 81 | 76 |
| PZK | 98 | 94 | 96 | 95 | 93 | 94 | 91 | 92 | 90 | 87 | 86 | 84 |
| LZC | 47 | 47 | 47 | 47 | 47 | 52 | 56 | 60 | 58 | 62 | 65 | 69 |
| PZE | 88 | 86 | 87 | 84 | 86 | 83 | 80 | 82 | 78 | 76 | 79 | 74 |
| Production Facility | 2021 | |||||||||||
| 01.2021 | 02.2021 | 03.2021 | 04.2021 | 05.2021 | 06.2021 | 07.2021 | 08.2021 | 09.2021 | 10.2021 | 11.2021 | 12.2021 | |
| PZD | 37 | 36 | 37 | 37 | 37 | 38 | 37 | 39 | 39 | 38 | 43 | 48 |
| PZP | 69 | 70 | 76 | 74 | 75 | 75 | 75 | 74 | 71 | 72 | 67 | 64 |
| PZO | 44 | 39 | 38 | 36 | 36 | 35 | 37 | 38 | 39 | 38 | 42 | 48 |
| PZA | 39 | 39 | 37 | 42 | 45 | 50 | 58 | 55 | 55 | 53 | 50 | 46 |
| PZH | 37 | 38 | 38 | 39 | 39 | 40 | 40 | 42 | 42 | 44 | 47 | 50 |
| PZW | 62 | 63 | 63 | 62 | 57 | 55 | 58 | 55 | 53 | 54 | 60 | 68 |
| PZF (PD) | 78 | 74 | 72 | 87 | 84 | 80 | 74 | 76 | 71 | 64 | 67 | 70 |
| PZK | 88 | 90 | 89 | 92 | 90 | 87 | 88 | 90 | 89 | 87 | 88 | 92 |
| LZC | 40 | 38 | 38 | 38 | 38 | 40 | 40 | 42 | 47 | 47 | 56 | 58 |
| PZE | 78 | 76 | 82 | 80 | 78 | 82 | 84 | 83 | 85 | 85 | 84 | 86 |
| YEAR | 2020 | 2021 | TOTAL REPAIRS 2006–2021 | TOTAL REPAIRS FOR 2021 | MTBR FOR THE LAST 24 MONTHS | ||||||||||||||||||||||
|---|---|---|---|---|---|---|---|---|---|---|---|---|---|---|---|---|---|---|---|---|---|---|---|---|---|---|---|
| Technological Number | 1 | 2 | 3 | 4 | 5 | 6 | 7 | 8 | 9 | 10 | 11 | 12 | 1 | 2 | 3 | 4 | 5 | 6 | 7 | 8 | 9 | 10 | 11 | 12 | |||
| 0100-MPXXX | 1 | 0 | NO REPAIR | ||||||||||||||||||||||||
| 0100-PXXA | 8 | 0 | NO REPAIR | ||||||||||||||||||||||||
| 0100-PXXB | 1 | 1 | 1 | 1 | 1 | 1 | 1 | 1 | 26 | 3 | 3 | ||||||||||||||||
| 0100-PXXC | 1 | 1 | 1 | 1 | 2 | 26 | 4 | 4 | |||||||||||||||||||
| 0100-PYYA | 1 | 1 | 1 | 18 | 3 | 8 | |||||||||||||||||||||
| 0100-PYYB | 6 | 0 | NO REPAIR | ||||||||||||||||||||||||
| 0100-PYYC | 1 | 0 | NO REPAIR | ||||||||||||||||||||||||
| 0100-PZZA | 1 | 1 | 24 | 1 | 12 | ||||||||||||||||||||||
| 0100-PZZB | 1 | 0 | NO REPAIR | ||||||||||||||||||||||||
| 0100-PZZC | 24 | 0 | NO REPAIR | ||||||||||||||||||||||||
| 0100-PXYZA | 13 | 0 | NO REPAIR | ||||||||||||||||||||||||
| 0100-PXYZB | 11 | 0 | NO REPAIR | ||||||||||||||||||||||||
| 0100-PXYZC | 1 | 0 | NO REPAIR | ||||||||||||||||||||||||
| 0100-PXXYA | 1 | 1 | 0 | 24 | |||||||||||||||||||||||
| 0100-PXXYB | 1 | 1 | 1 | 13 | 1 | 8 | |||||||||||||||||||||
| 0100-PXXYC | 1 | 1 | 7 | 0 | 12 | ||||||||||||||||||||||
| 0120-PXXXA | 4 | 0 | NO REPAIR | ||||||||||||||||||||||||
| 0120-PXXXB | 1 | 1 | 23 | 1 | 12 | ||||||||||||||||||||||
| 0120-PXXXC | 4 | 0 | NO REPAIR | ||||||||||||||||||||||||
| 0120-PYYYA | 8 | 0 | NO REPAIR | ||||||||||||||||||||||||
| 0120-PYYYB | 1 | 1 | 0 | 24 | |||||||||||||||||||||||
| 0120-PYYYC | 3 | 0 | NO REPAIR | ||||||||||||||||||||||||
| 0120-PZZZA | 1 | 2 | 1 | 24 | |||||||||||||||||||||||
| 0120-PZZZB | 4 | 0 | NO REPAIR | ||||||||||||||||||||||||
| 0120-PZZZC | 2 | 0 | NO REPAIR | ||||||||||||||||||||||||
| 0120-PXZZA | 1 | 10 | 0 | 24 | |||||||||||||||||||||||
| 0120-PXZZB | 8 | 0 | NO REPAIR | ||||||||||||||||||||||||
| 0120-PXZZC | 1 | 1 | 12 | 2 | 12 | ||||||||||||||||||||||
| 0300-PXXXA | 1 | 1 | 1 | 17 | 0 | 8 | |||||||||||||||||||||
| 0300-PXXXB | 1 | 1 | 1 | 11 | 1 | 8 | |||||||||||||||||||||
| 0300-PXXXC | 1 | 7 | 1 | 24 | |||||||||||||||||||||||
| 0300-PYYY | 1 | 12 | 1 | 24 | |||||||||||||||||||||||
| 0300-PXXX | 9 | 0 | NO REPAIR | ||||||||||||||||||||||||
| 2019 | 2020 | 2021 (Until September 2021) | |||
|---|---|---|---|---|---|
| Technological No. | Number of Repairs | Technological No. | Number of Repairs | Technological No. | Number of Repairs |
| 1100-KXXA | 11 | 1100-KXXA | 5 | 1100-PXXXA | 5 |
| 1100-PXXXA | 4 | 0100-PXXXB | 4 | 0920-PXXXB | 2 |
| 0200-PXXX | 6 | 0100-PXXXA | 6 | 0920-PXXXA | 3 |
| 0440-KXXXB | 3 | 0520-KXXXB | 6 | 1300-PXXXB | 7 |
| 1200-PXXXA | 5 | 1300-KXXXA | 4 | 0270-KXXXC | 6 |
| 0930-PXXA | 6 | 0930-PXXXA | 5 | 0960-PXXX | 10 |
| 0930-PXXB | 5 | 0930-PXXXB | 5 | 1800-PXXX | 4 |
| 0930-PXXXA | 3 | 0860-PXXXA | 8 | 4900-PXXXB | 4 |
| 0930-PXXXB | 4 | 0270-KXXXA | 7 | 2700-TGXXX | 5 |
| 0930-PYYB | 5 | 0270-KXXXB | 8 | 0290-KXXX | 5 |
| 9700-PXXB | 7 | 0270-KXXXC | 6 | 0200-KXA | 9 |
| 0270-KXXB | 3 | 0290-KXXX | 7 | 0500-PXXA | 8 |
| 0290-KXXX | 10 | 0960-PXXX | 6 | 0410-KXXB | 7 |
| 0960-PXXX | 8 | 0960-PXXXA | 3 | 1100-KXXA | 4 |
| 4060-PXXXA | 10 | 4060-PXXXA | 6 | ||
| 4060-PXXXB | 6 | 1800-PXXX | 3 | ||
| 2900-CFXXX | 6 | 2700-TGYYY | 8 | ||
| 2700-TGXXX | 8 | 2700-TGXXX | 5 | ||
Publisher’s Note: MDPI stays neutral with regard to jurisdictional claims in published maps and institutional affiliations. |
© 2022 by the authors. Licensee MDPI, Basel, Switzerland. This article is an open access article distributed under the terms and conditions of the Creative Commons Attribution (CC BY) license (https://creativecommons.org/licenses/by/4.0/).
Share and Cite
Dziabas, T.; Deja, M.; Wiśniewska, A. A Strategy for Managing the Operation of Technical Infrastructure Based on the Analysis of “Bad Actors”—A Case Study of LOTOS Group S.A. Sustainability 2022, 14, 4477. https://doi.org/10.3390/su14084477
Dziabas T, Deja M, Wiśniewska A. A Strategy for Managing the Operation of Technical Infrastructure Based on the Analysis of “Bad Actors”—A Case Study of LOTOS Group S.A. Sustainability. 2022; 14(8):4477. https://doi.org/10.3390/su14084477
Chicago/Turabian StyleDziabas, Tomasz, Mariusz Deja, and Aleksandra Wiśniewska. 2022. "A Strategy for Managing the Operation of Technical Infrastructure Based on the Analysis of “Bad Actors”—A Case Study of LOTOS Group S.A." Sustainability 14, no. 8: 4477. https://doi.org/10.3390/su14084477
APA StyleDziabas, T., Deja, M., & Wiśniewska, A. (2022). A Strategy for Managing the Operation of Technical Infrastructure Based on the Analysis of “Bad Actors”—A Case Study of LOTOS Group S.A. Sustainability, 14(8), 4477. https://doi.org/10.3390/su14084477