
Leveraging UAV Capabilities for Vehicle Tracking and Collision Risk Assessment at Road Intersections


Abstract
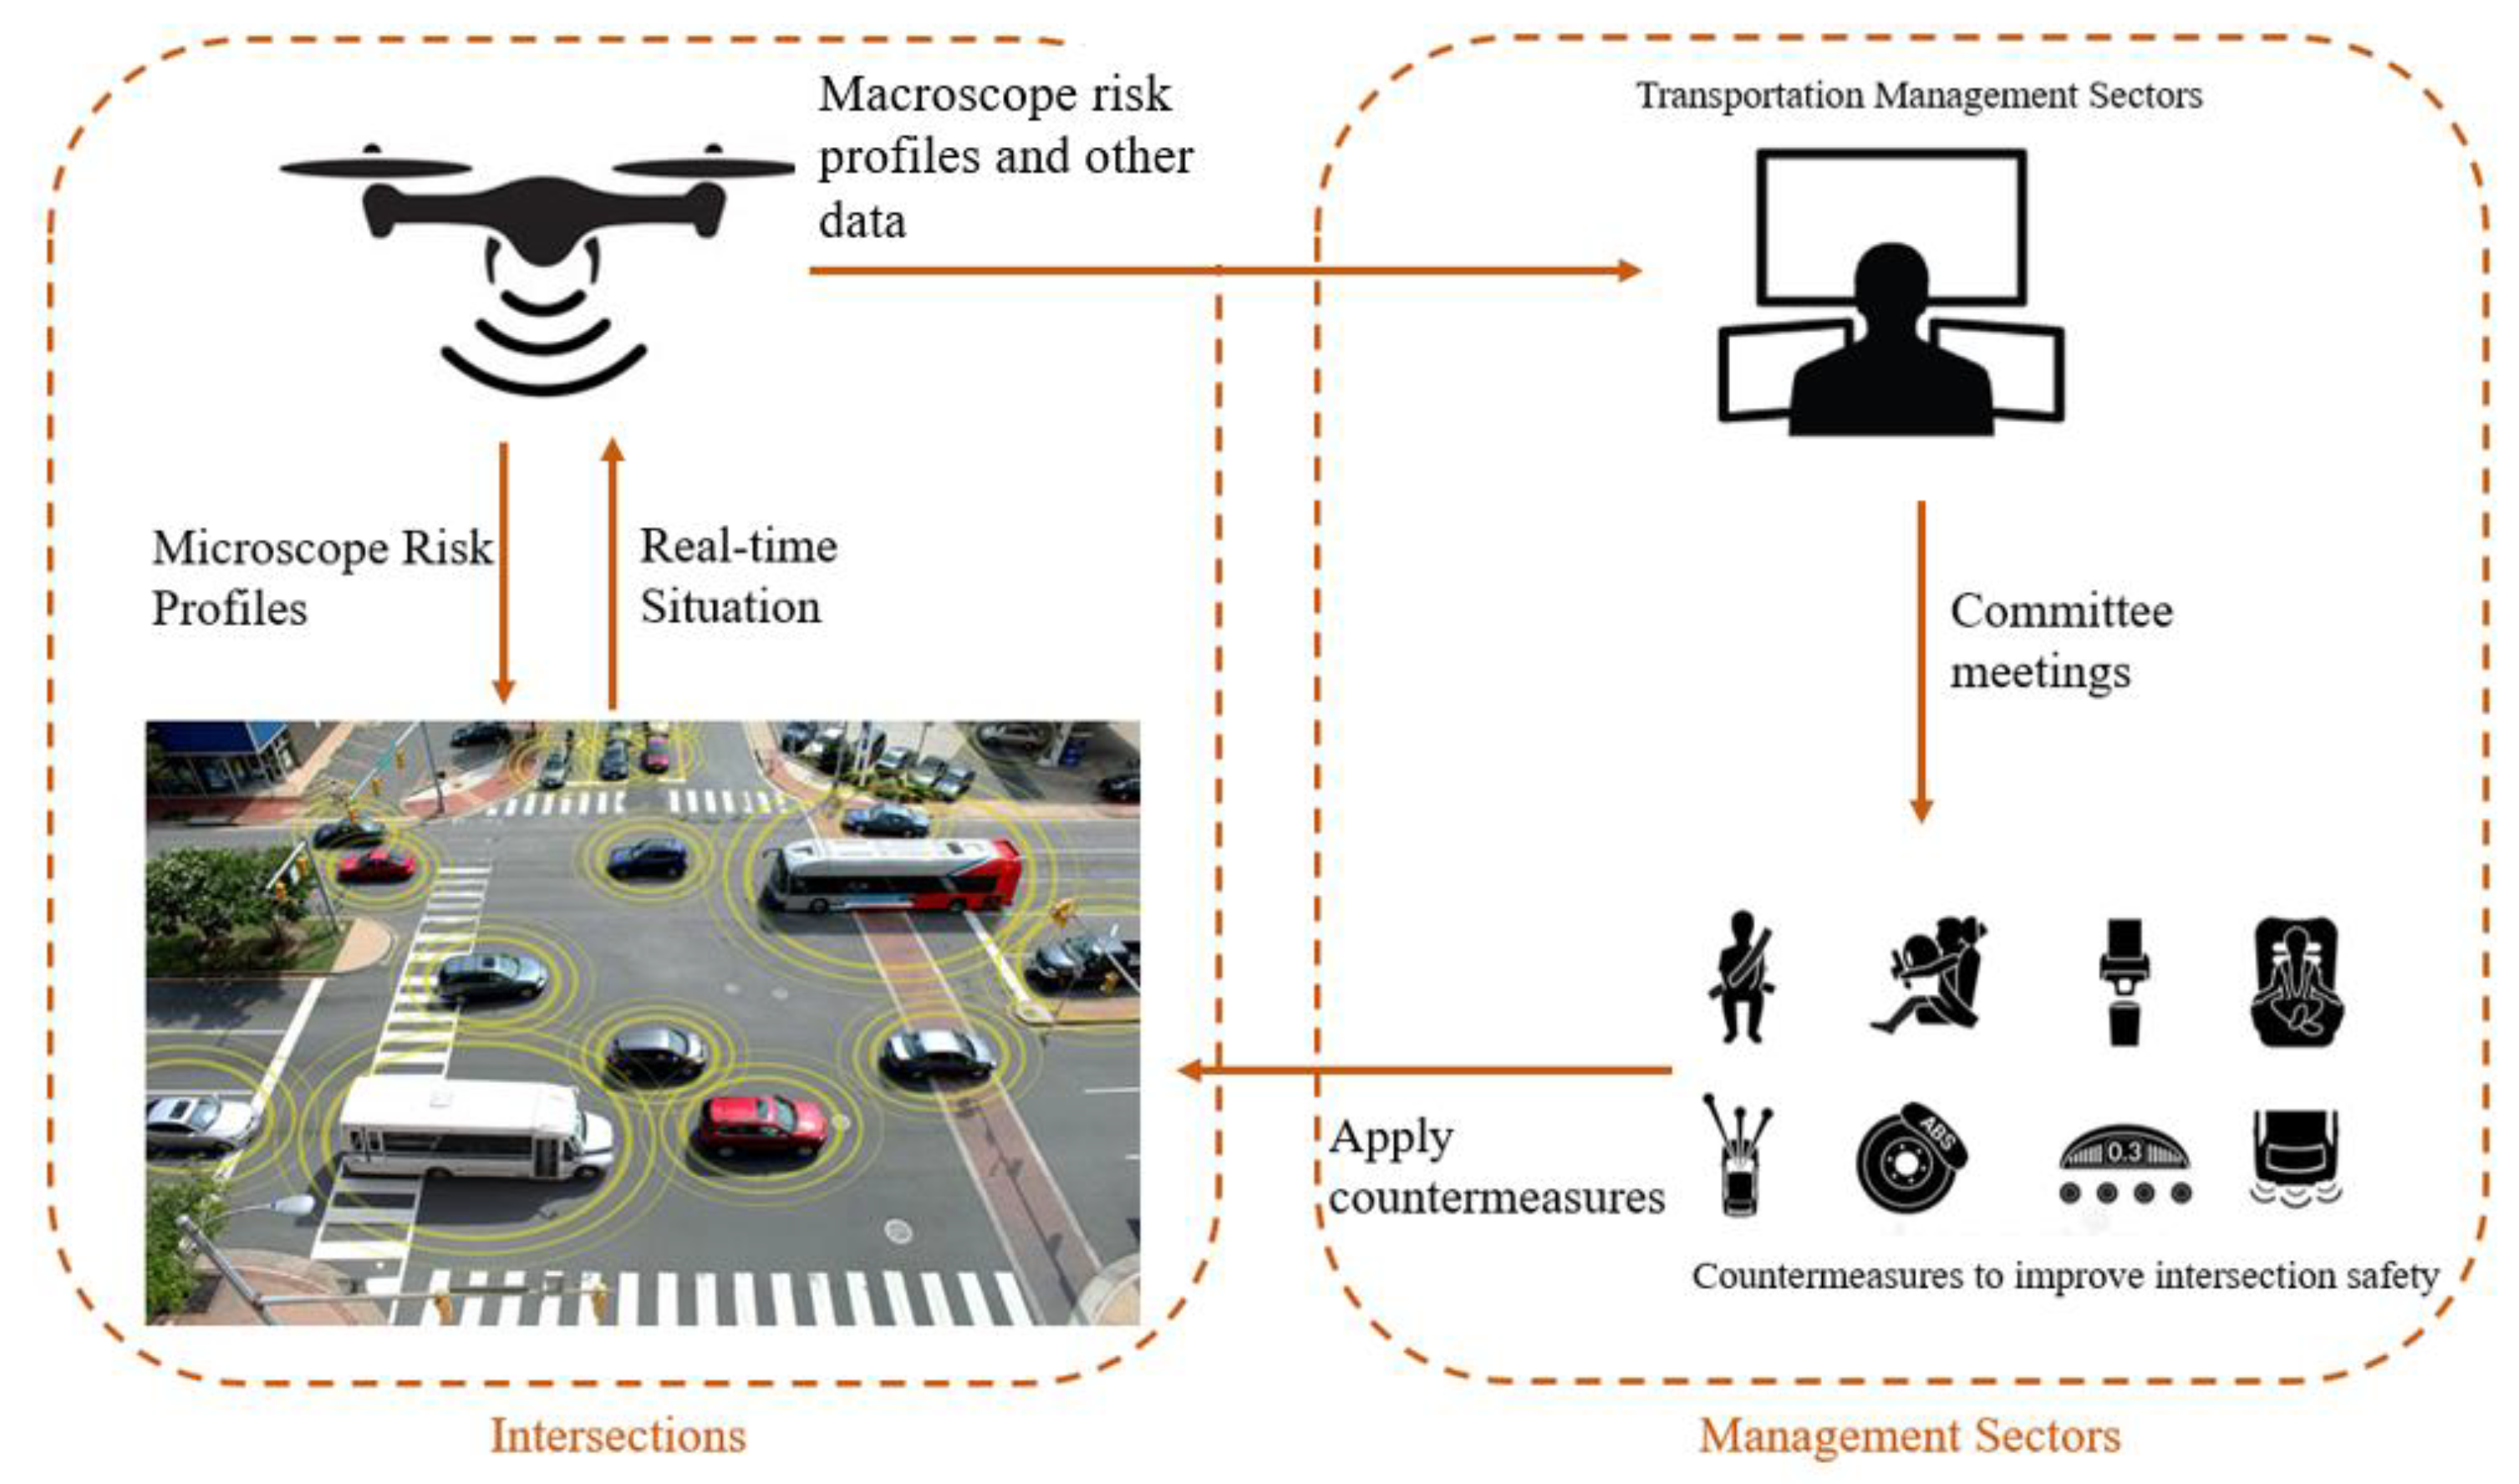
1. Introduction
2. Related Work
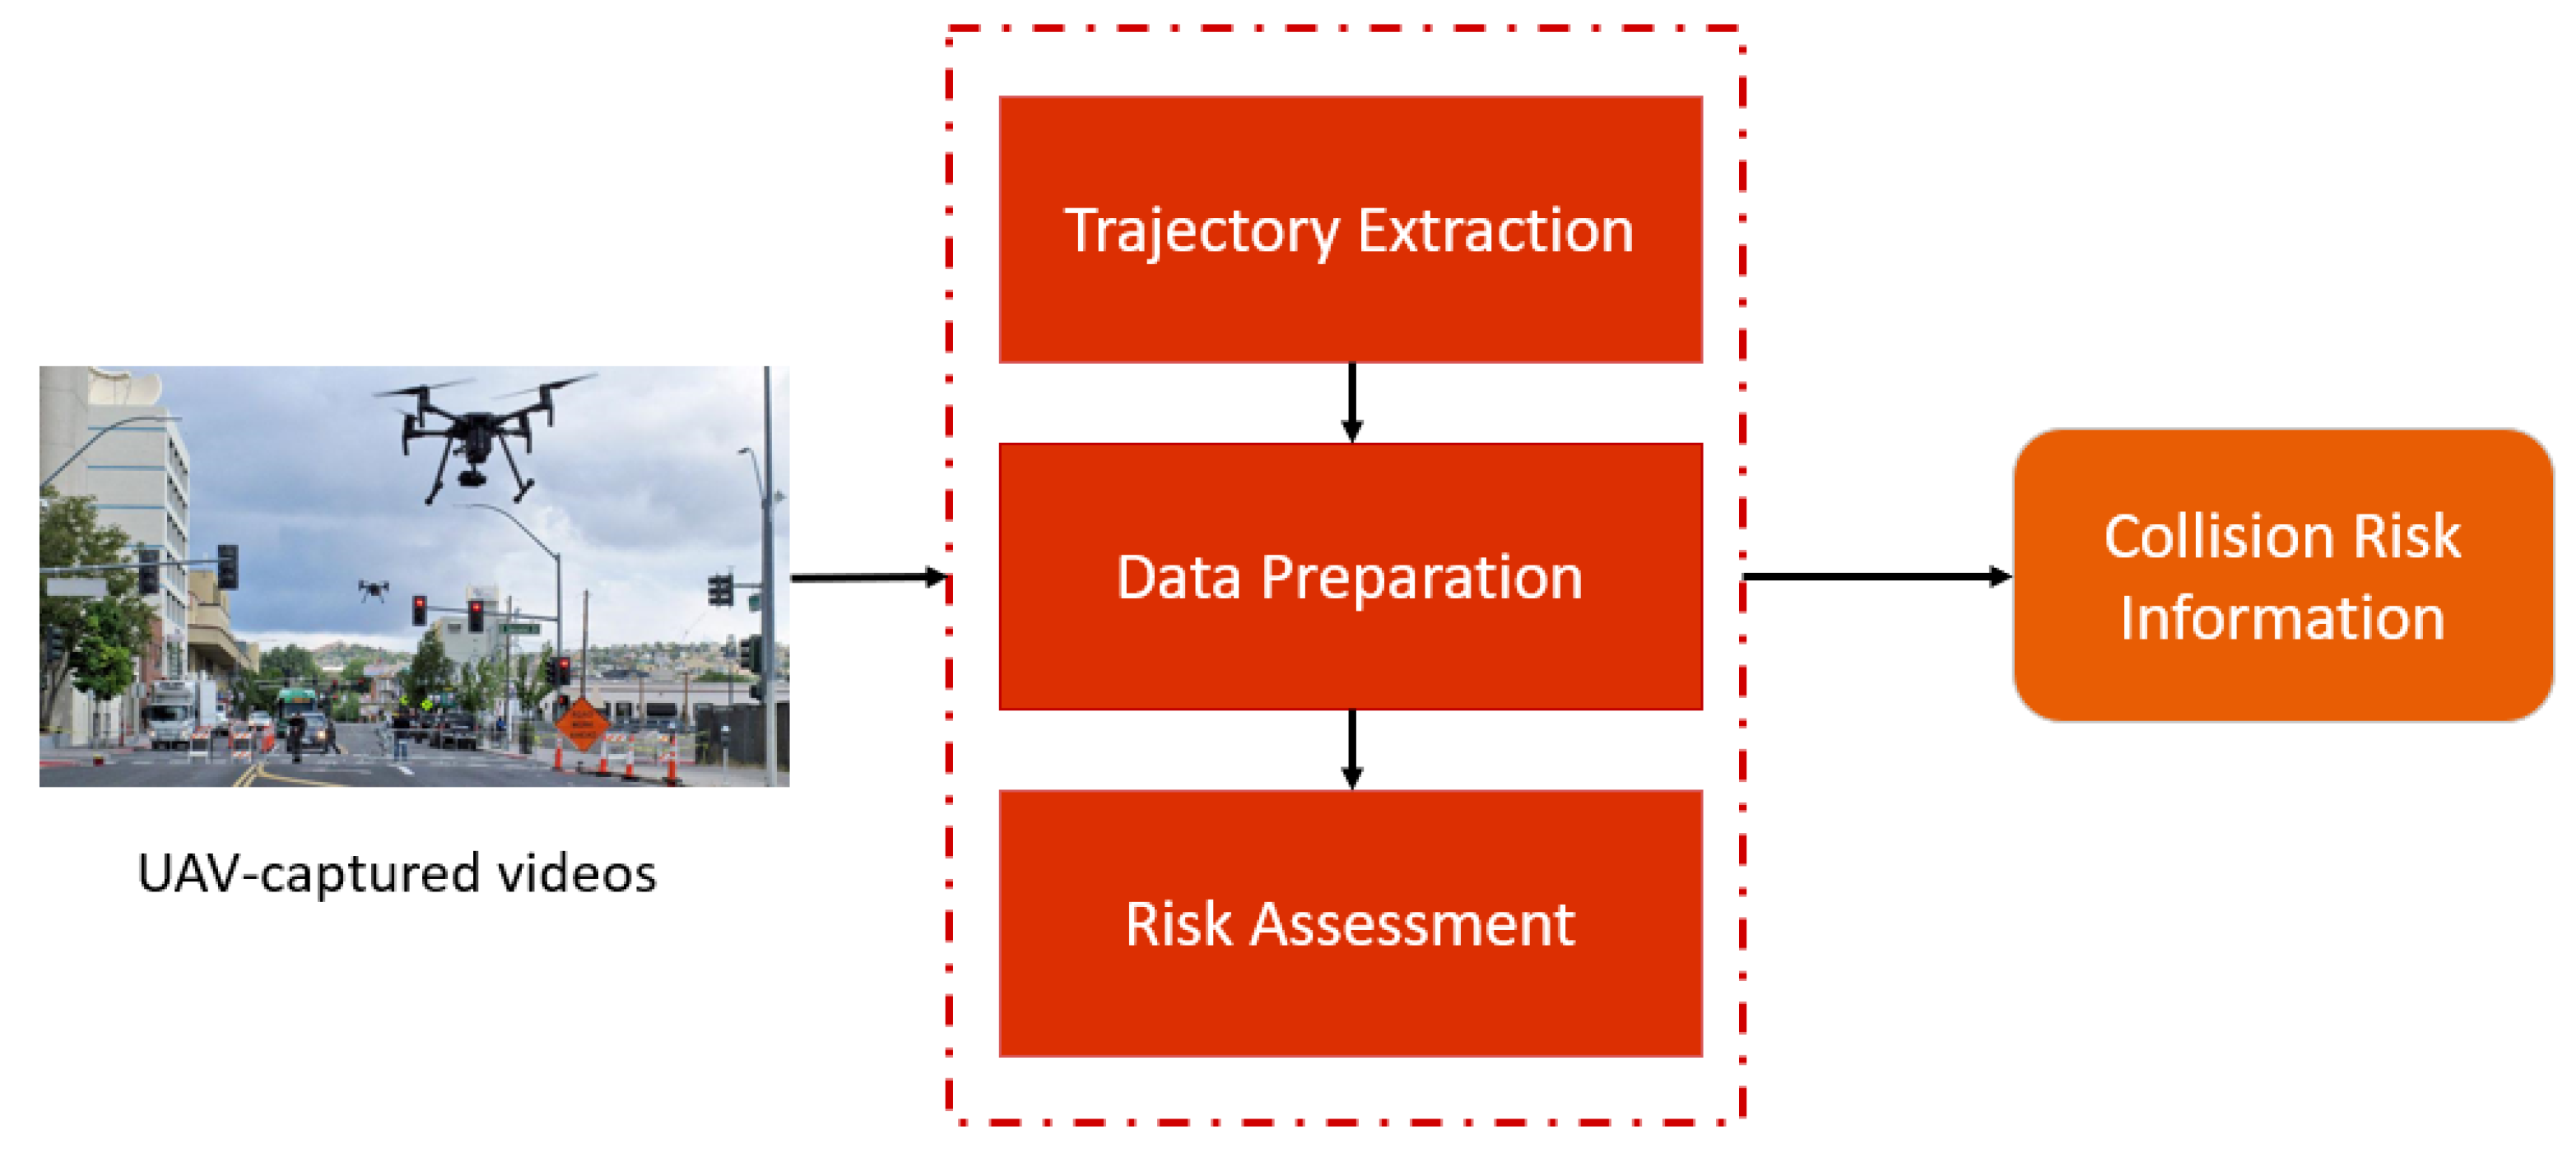
3. Methodology
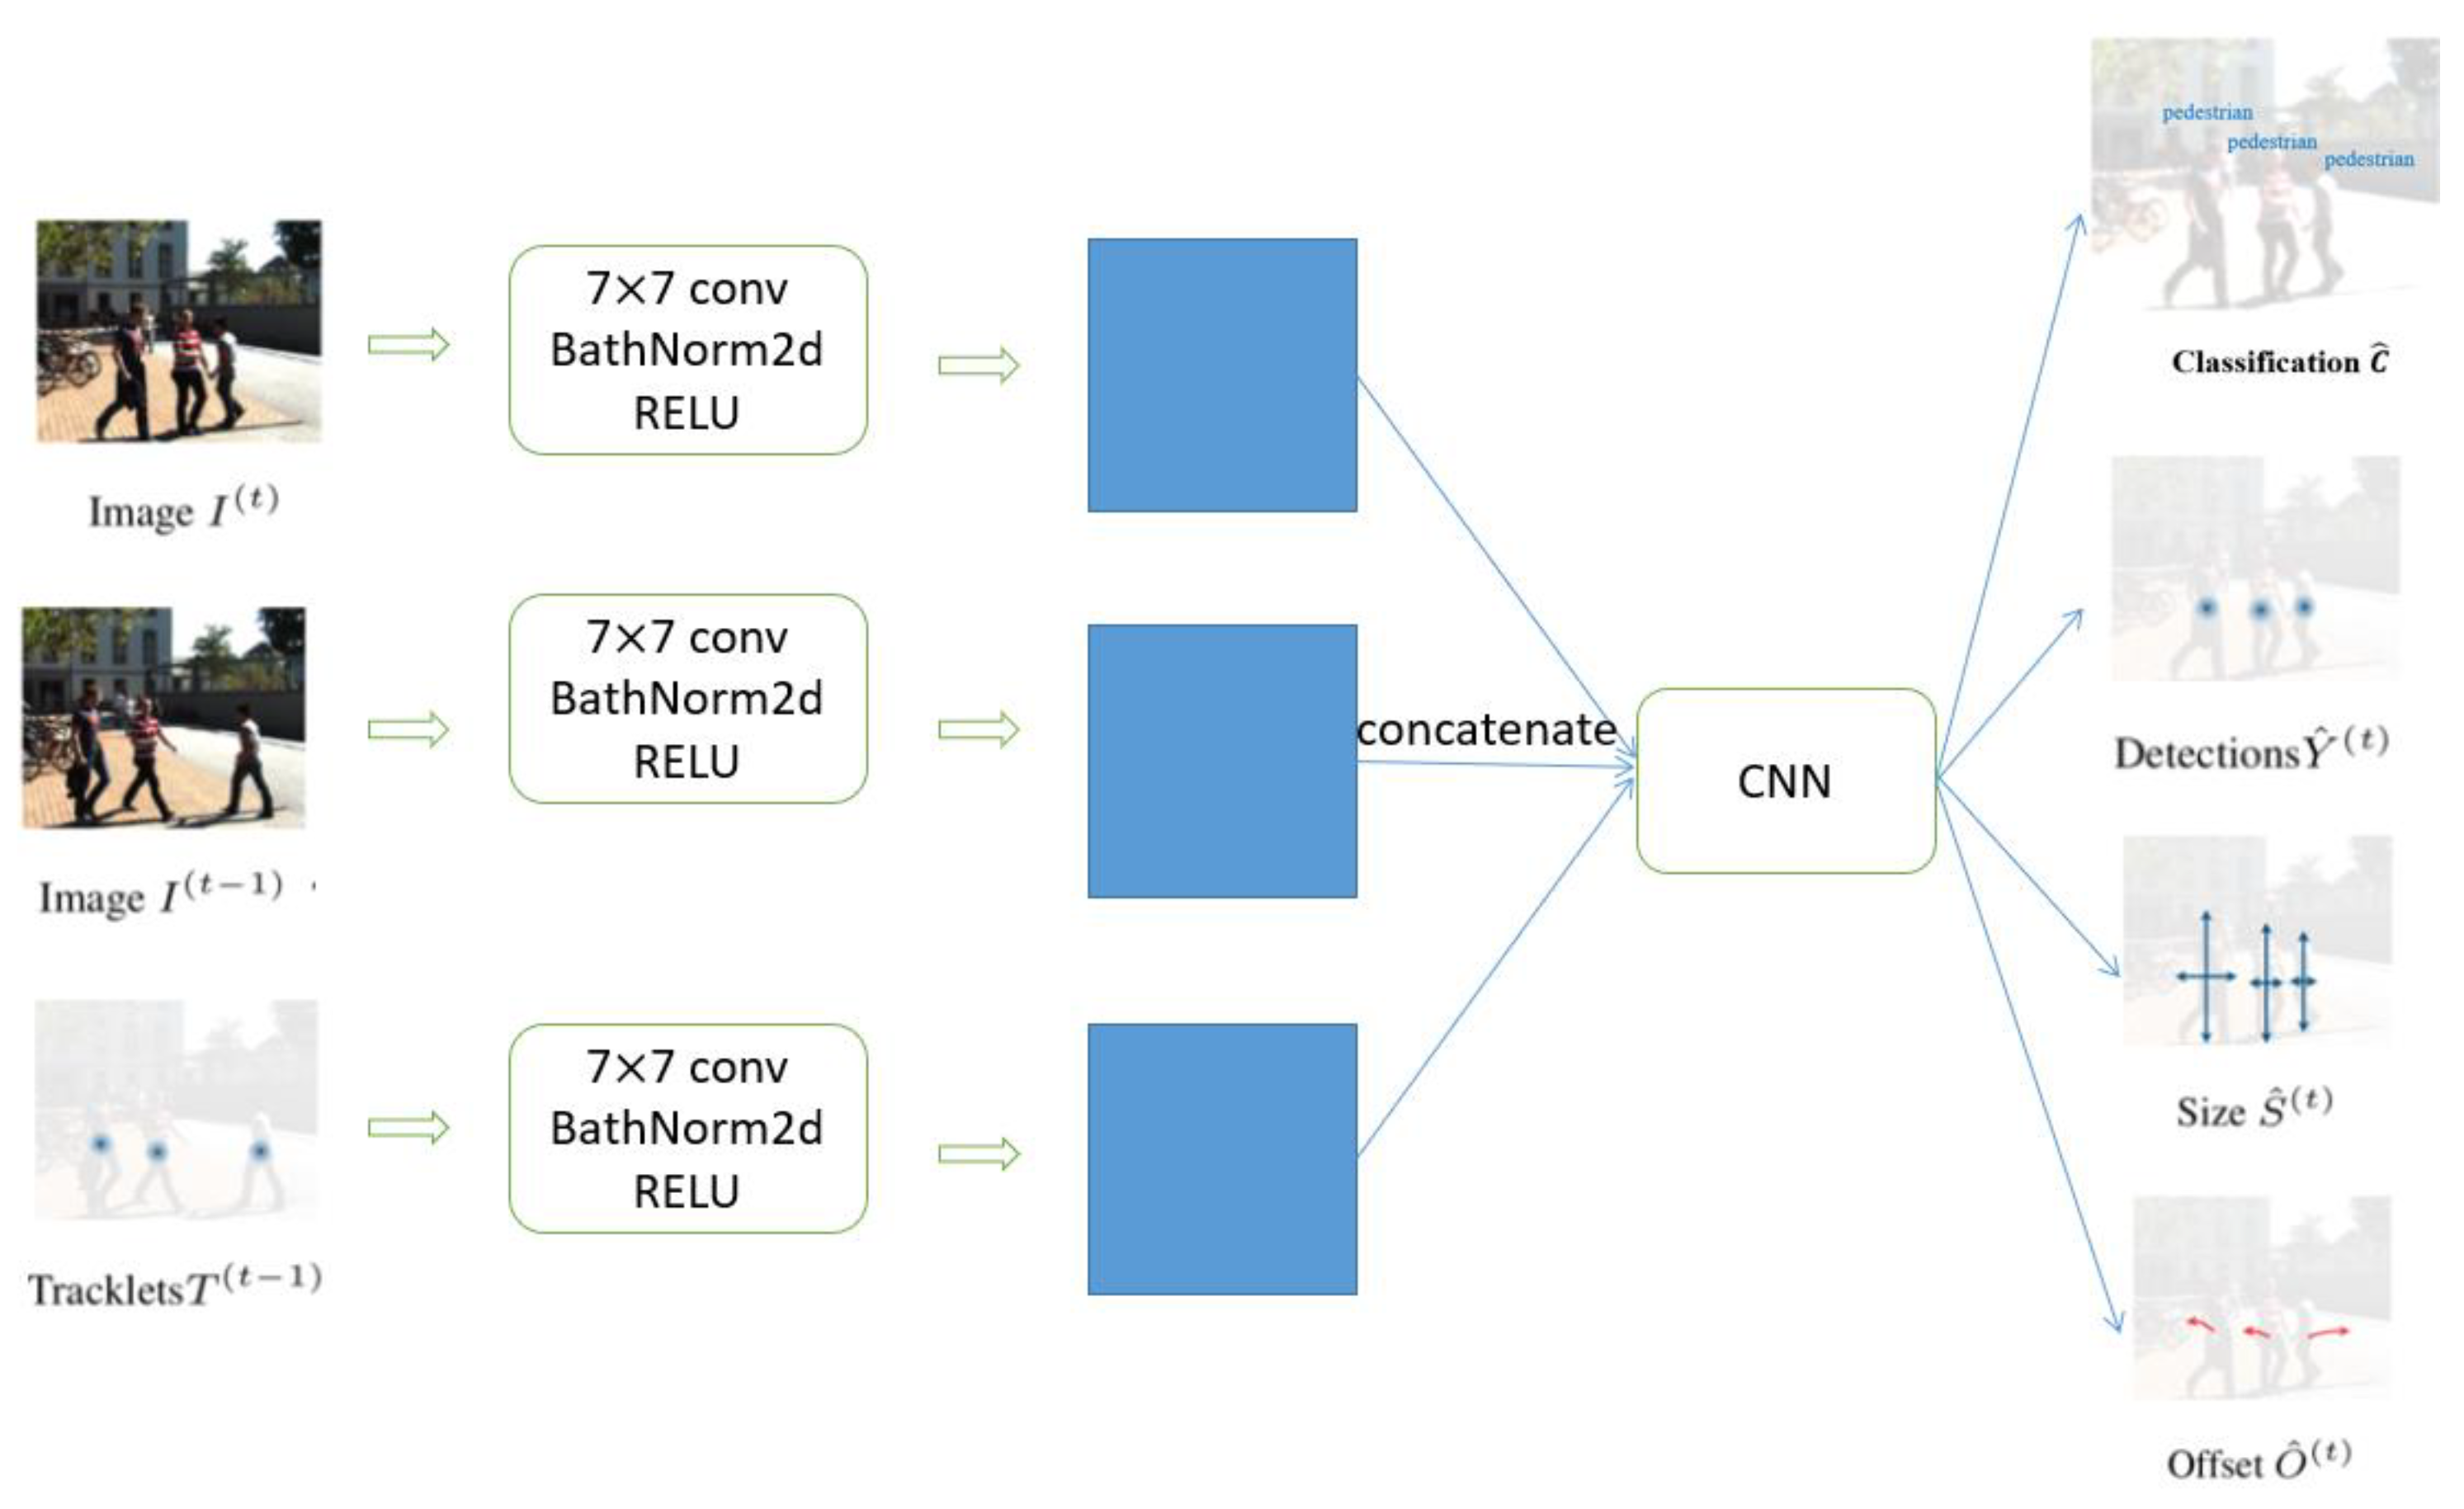
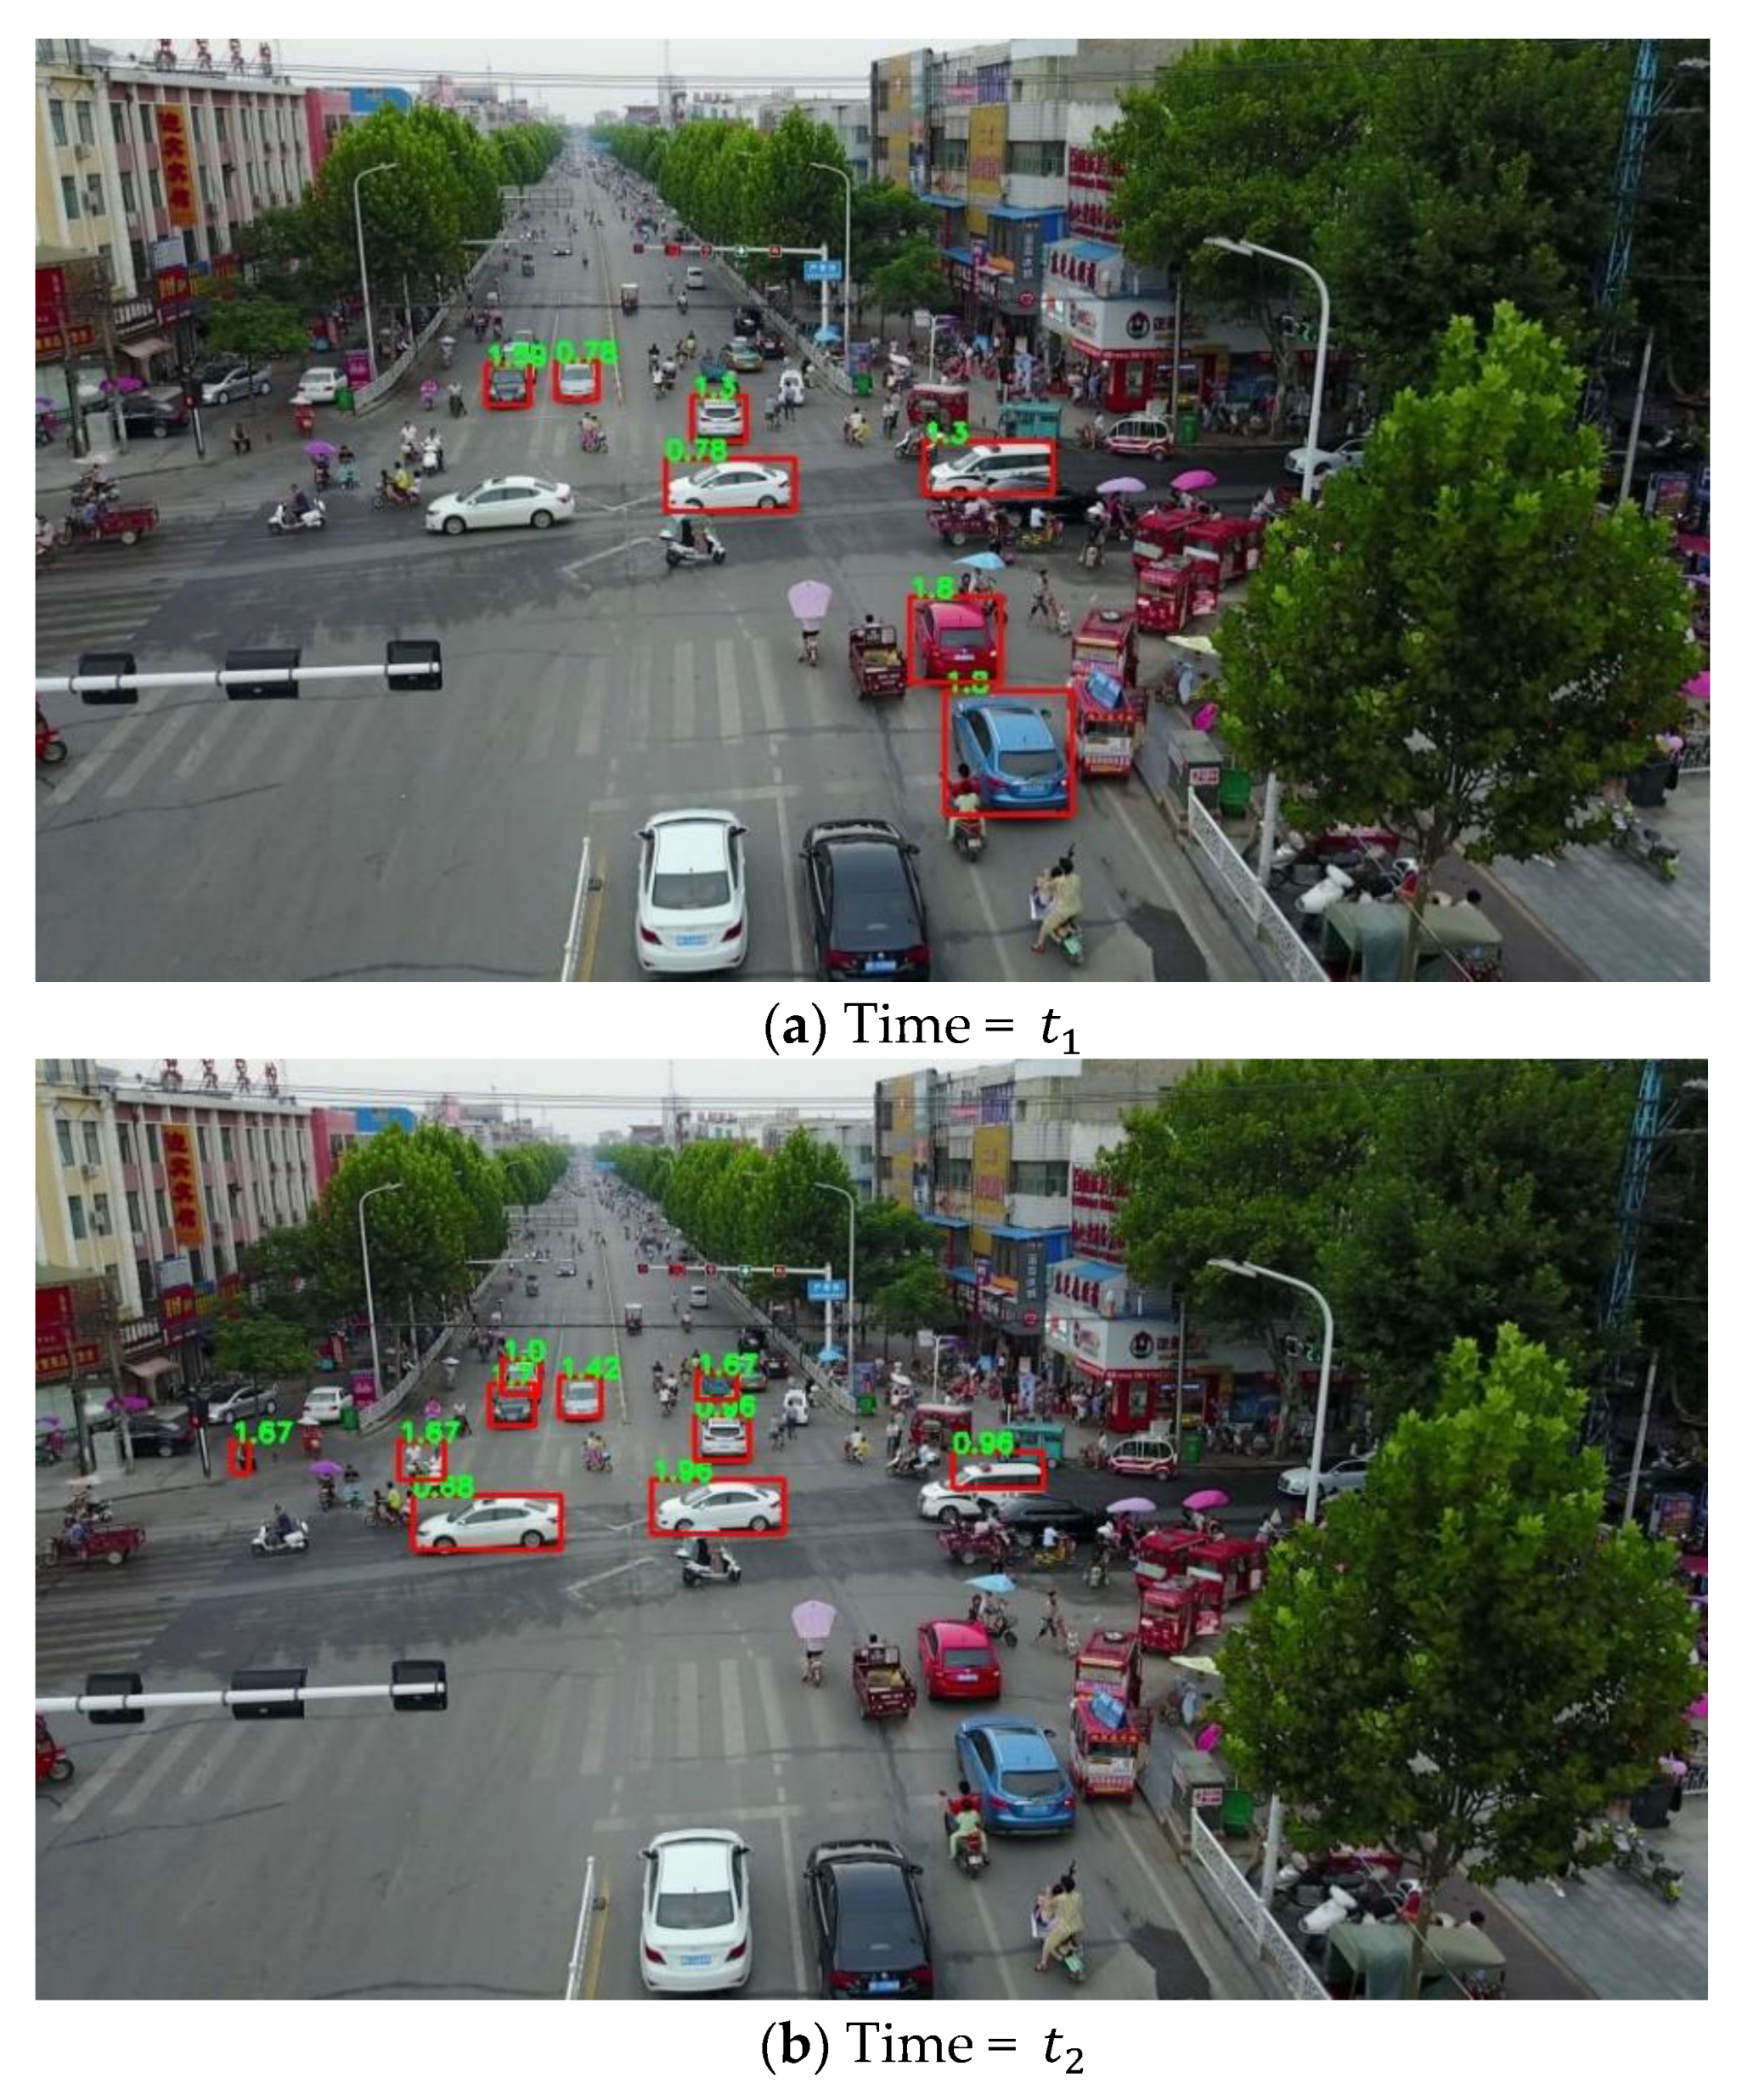
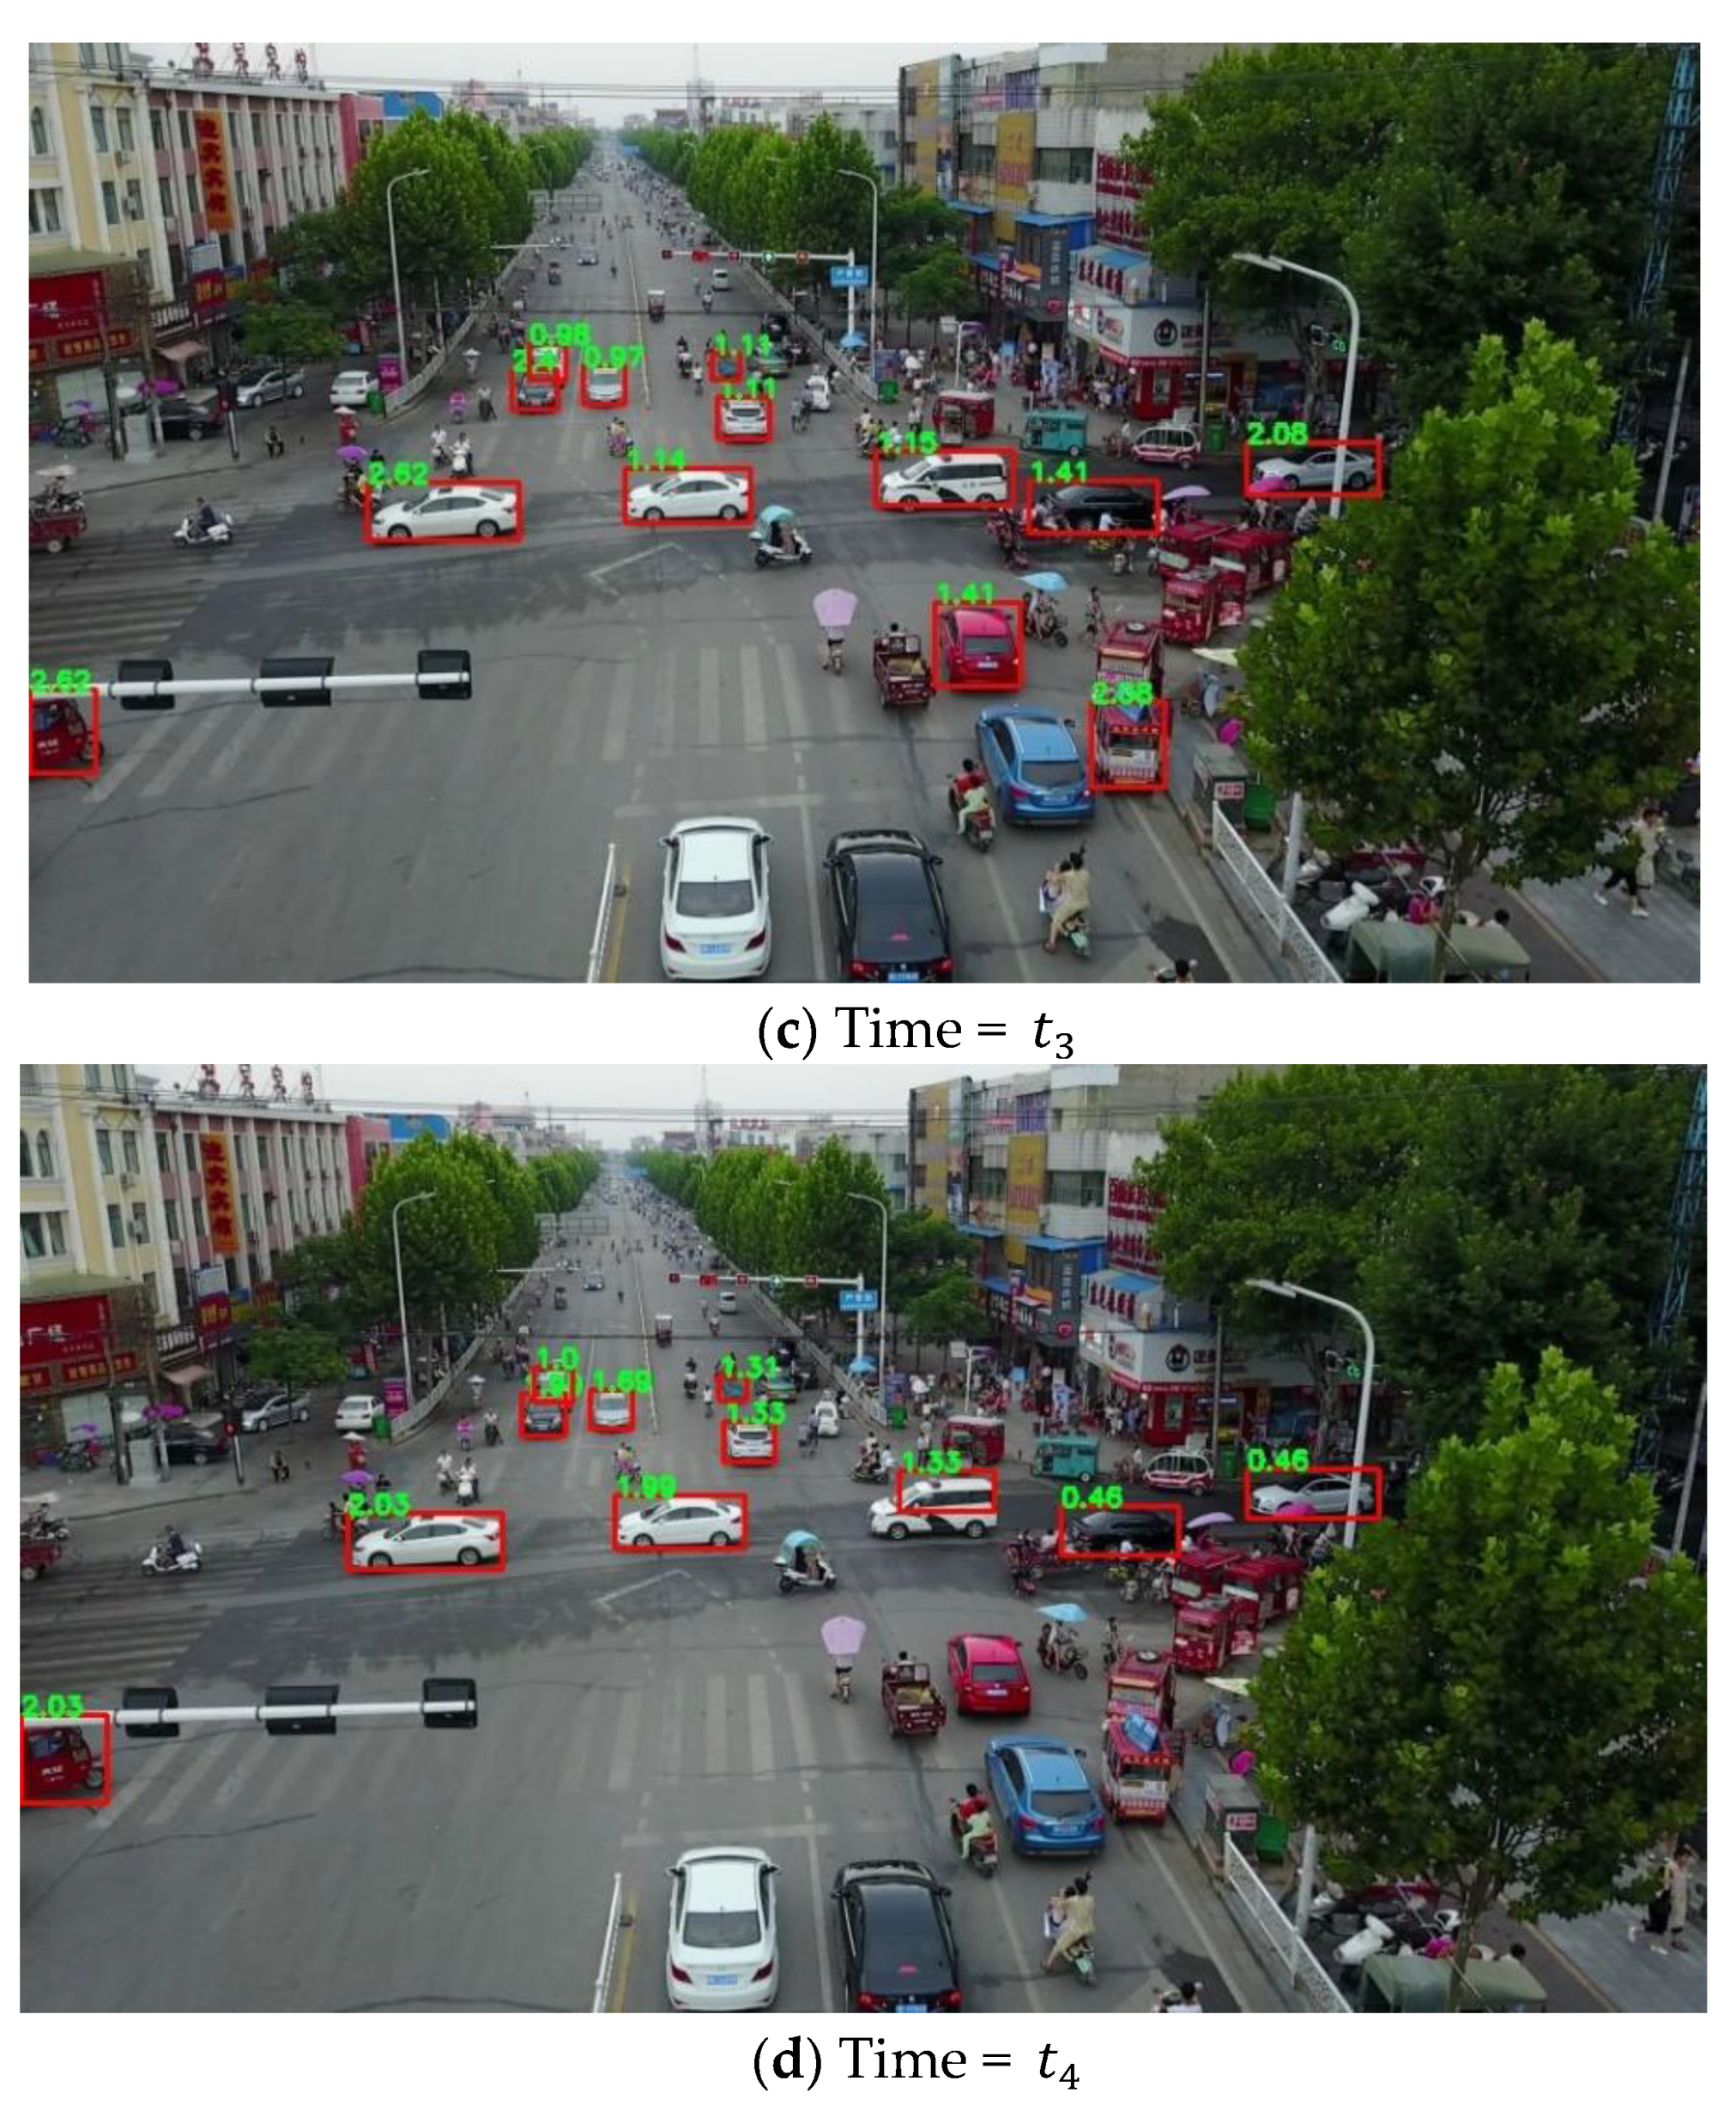
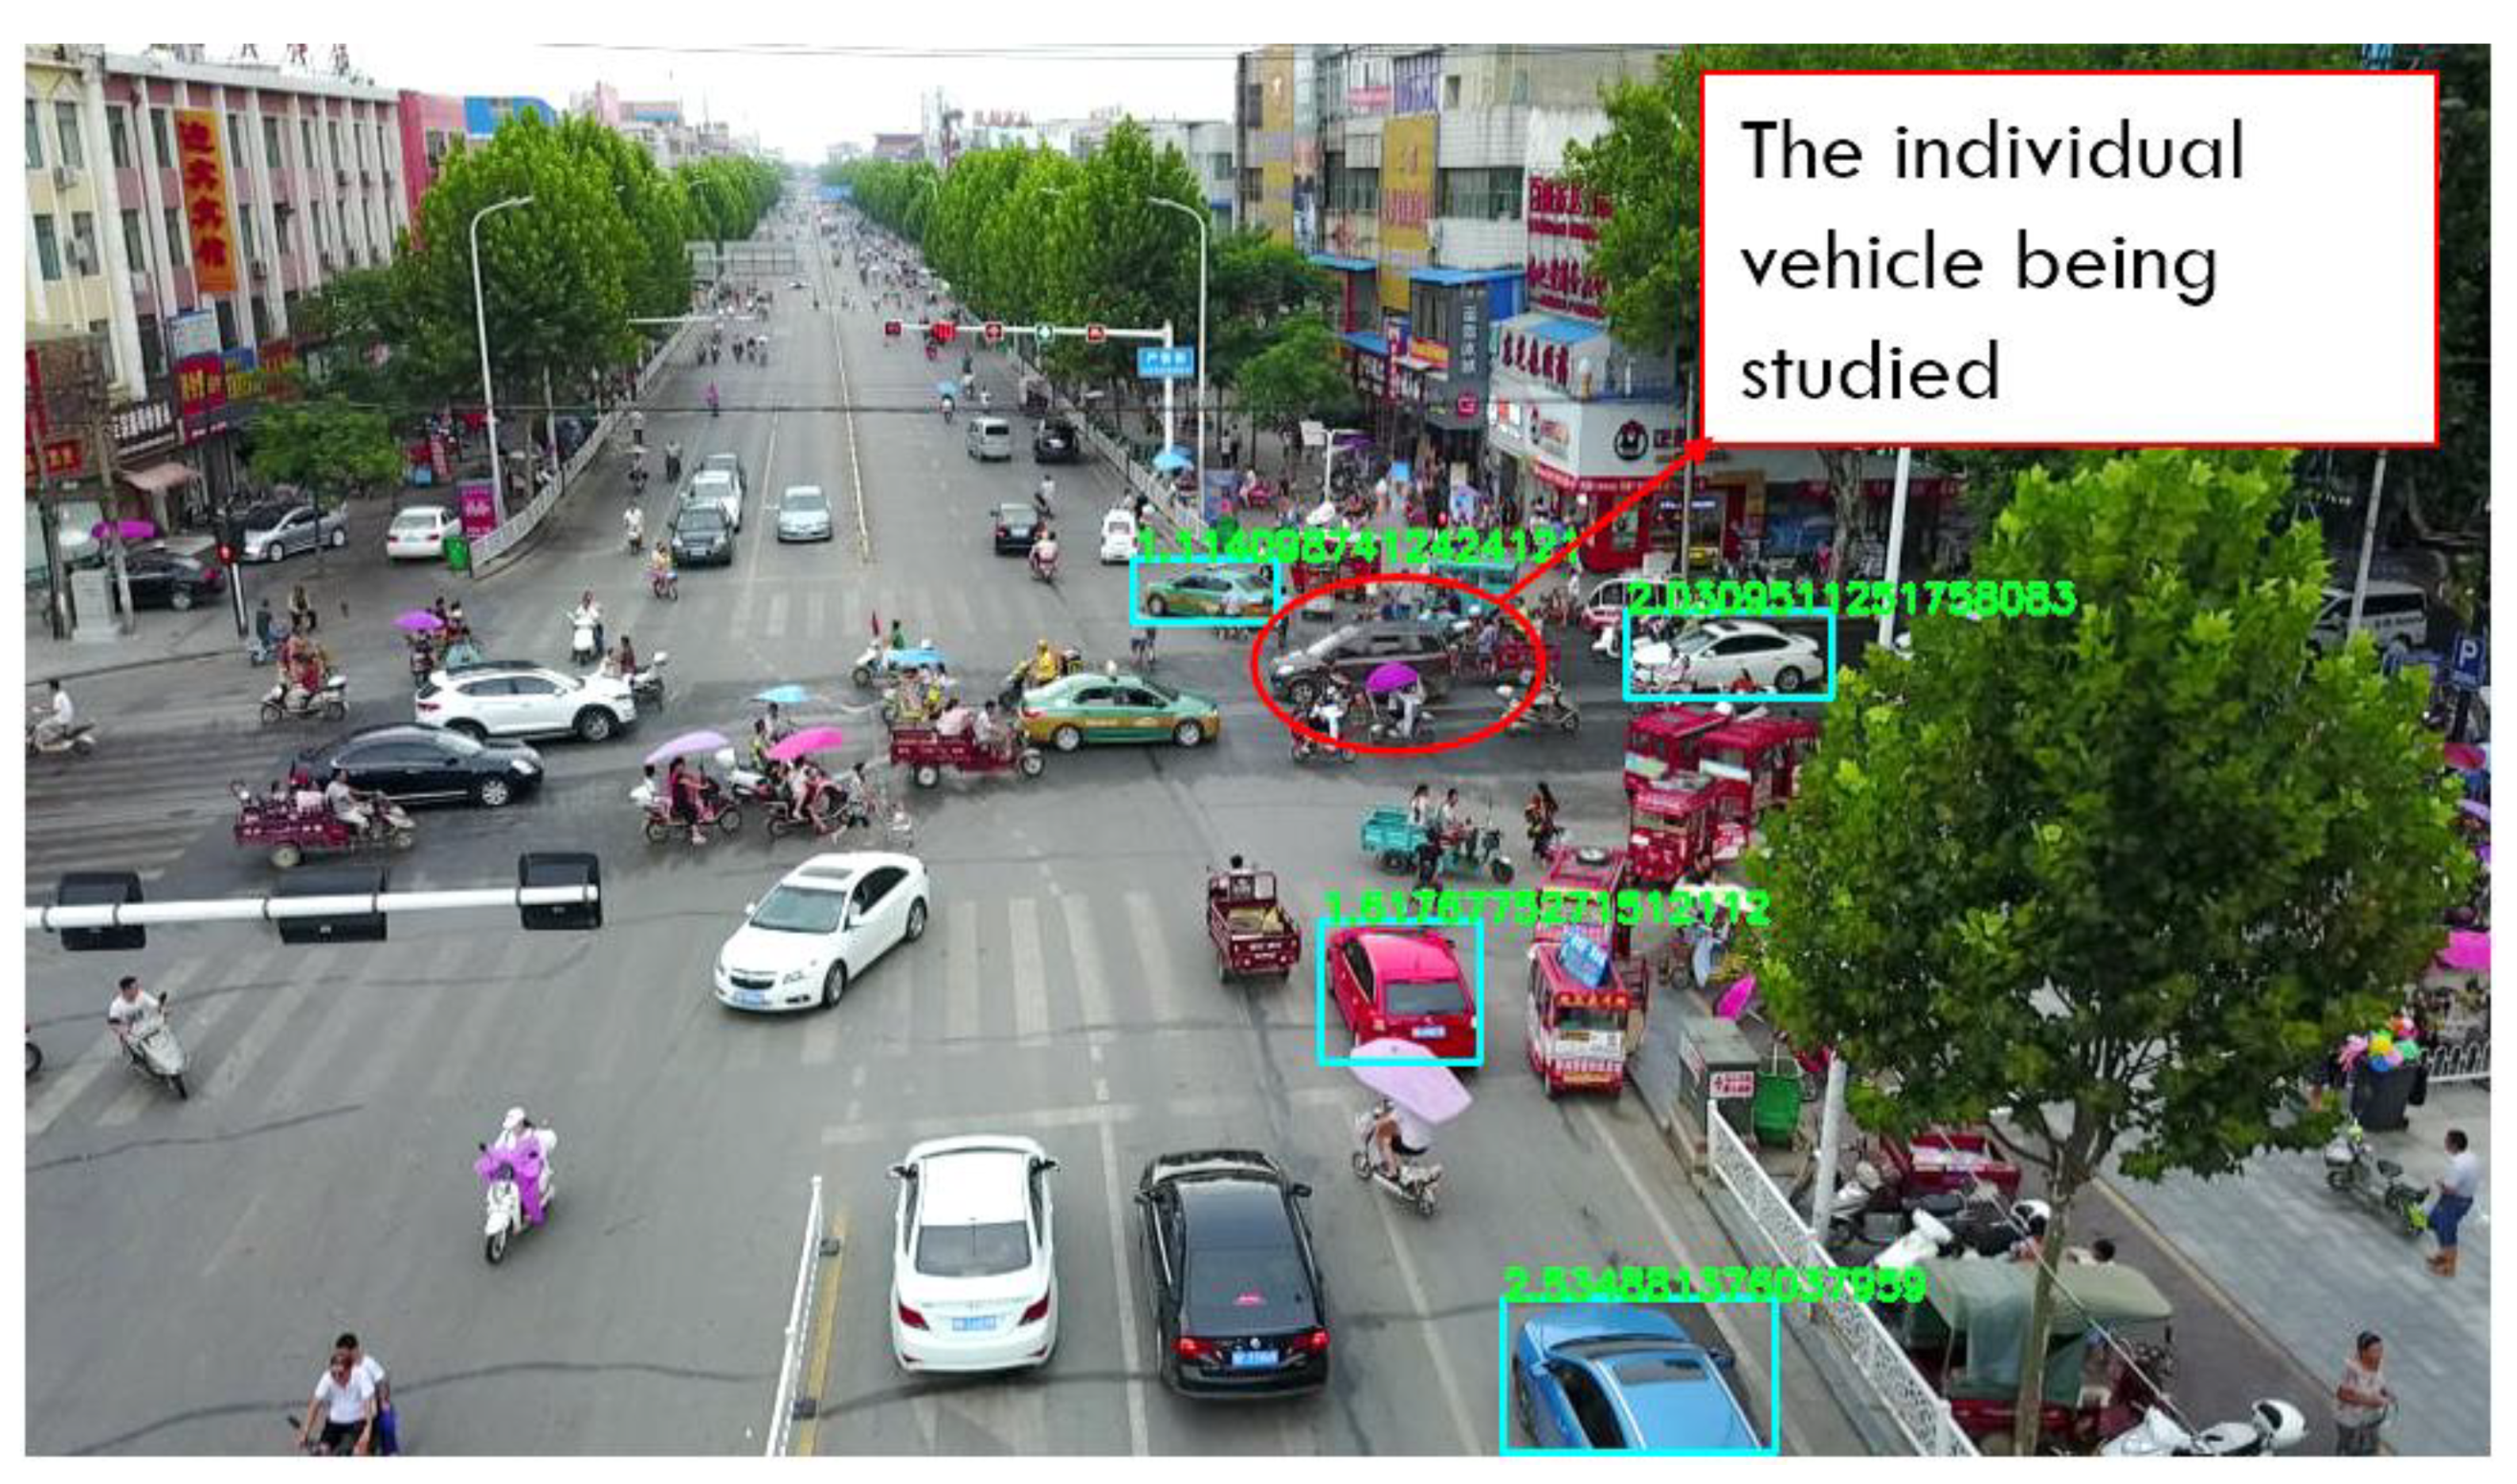
3.1. Trajectory Tracking
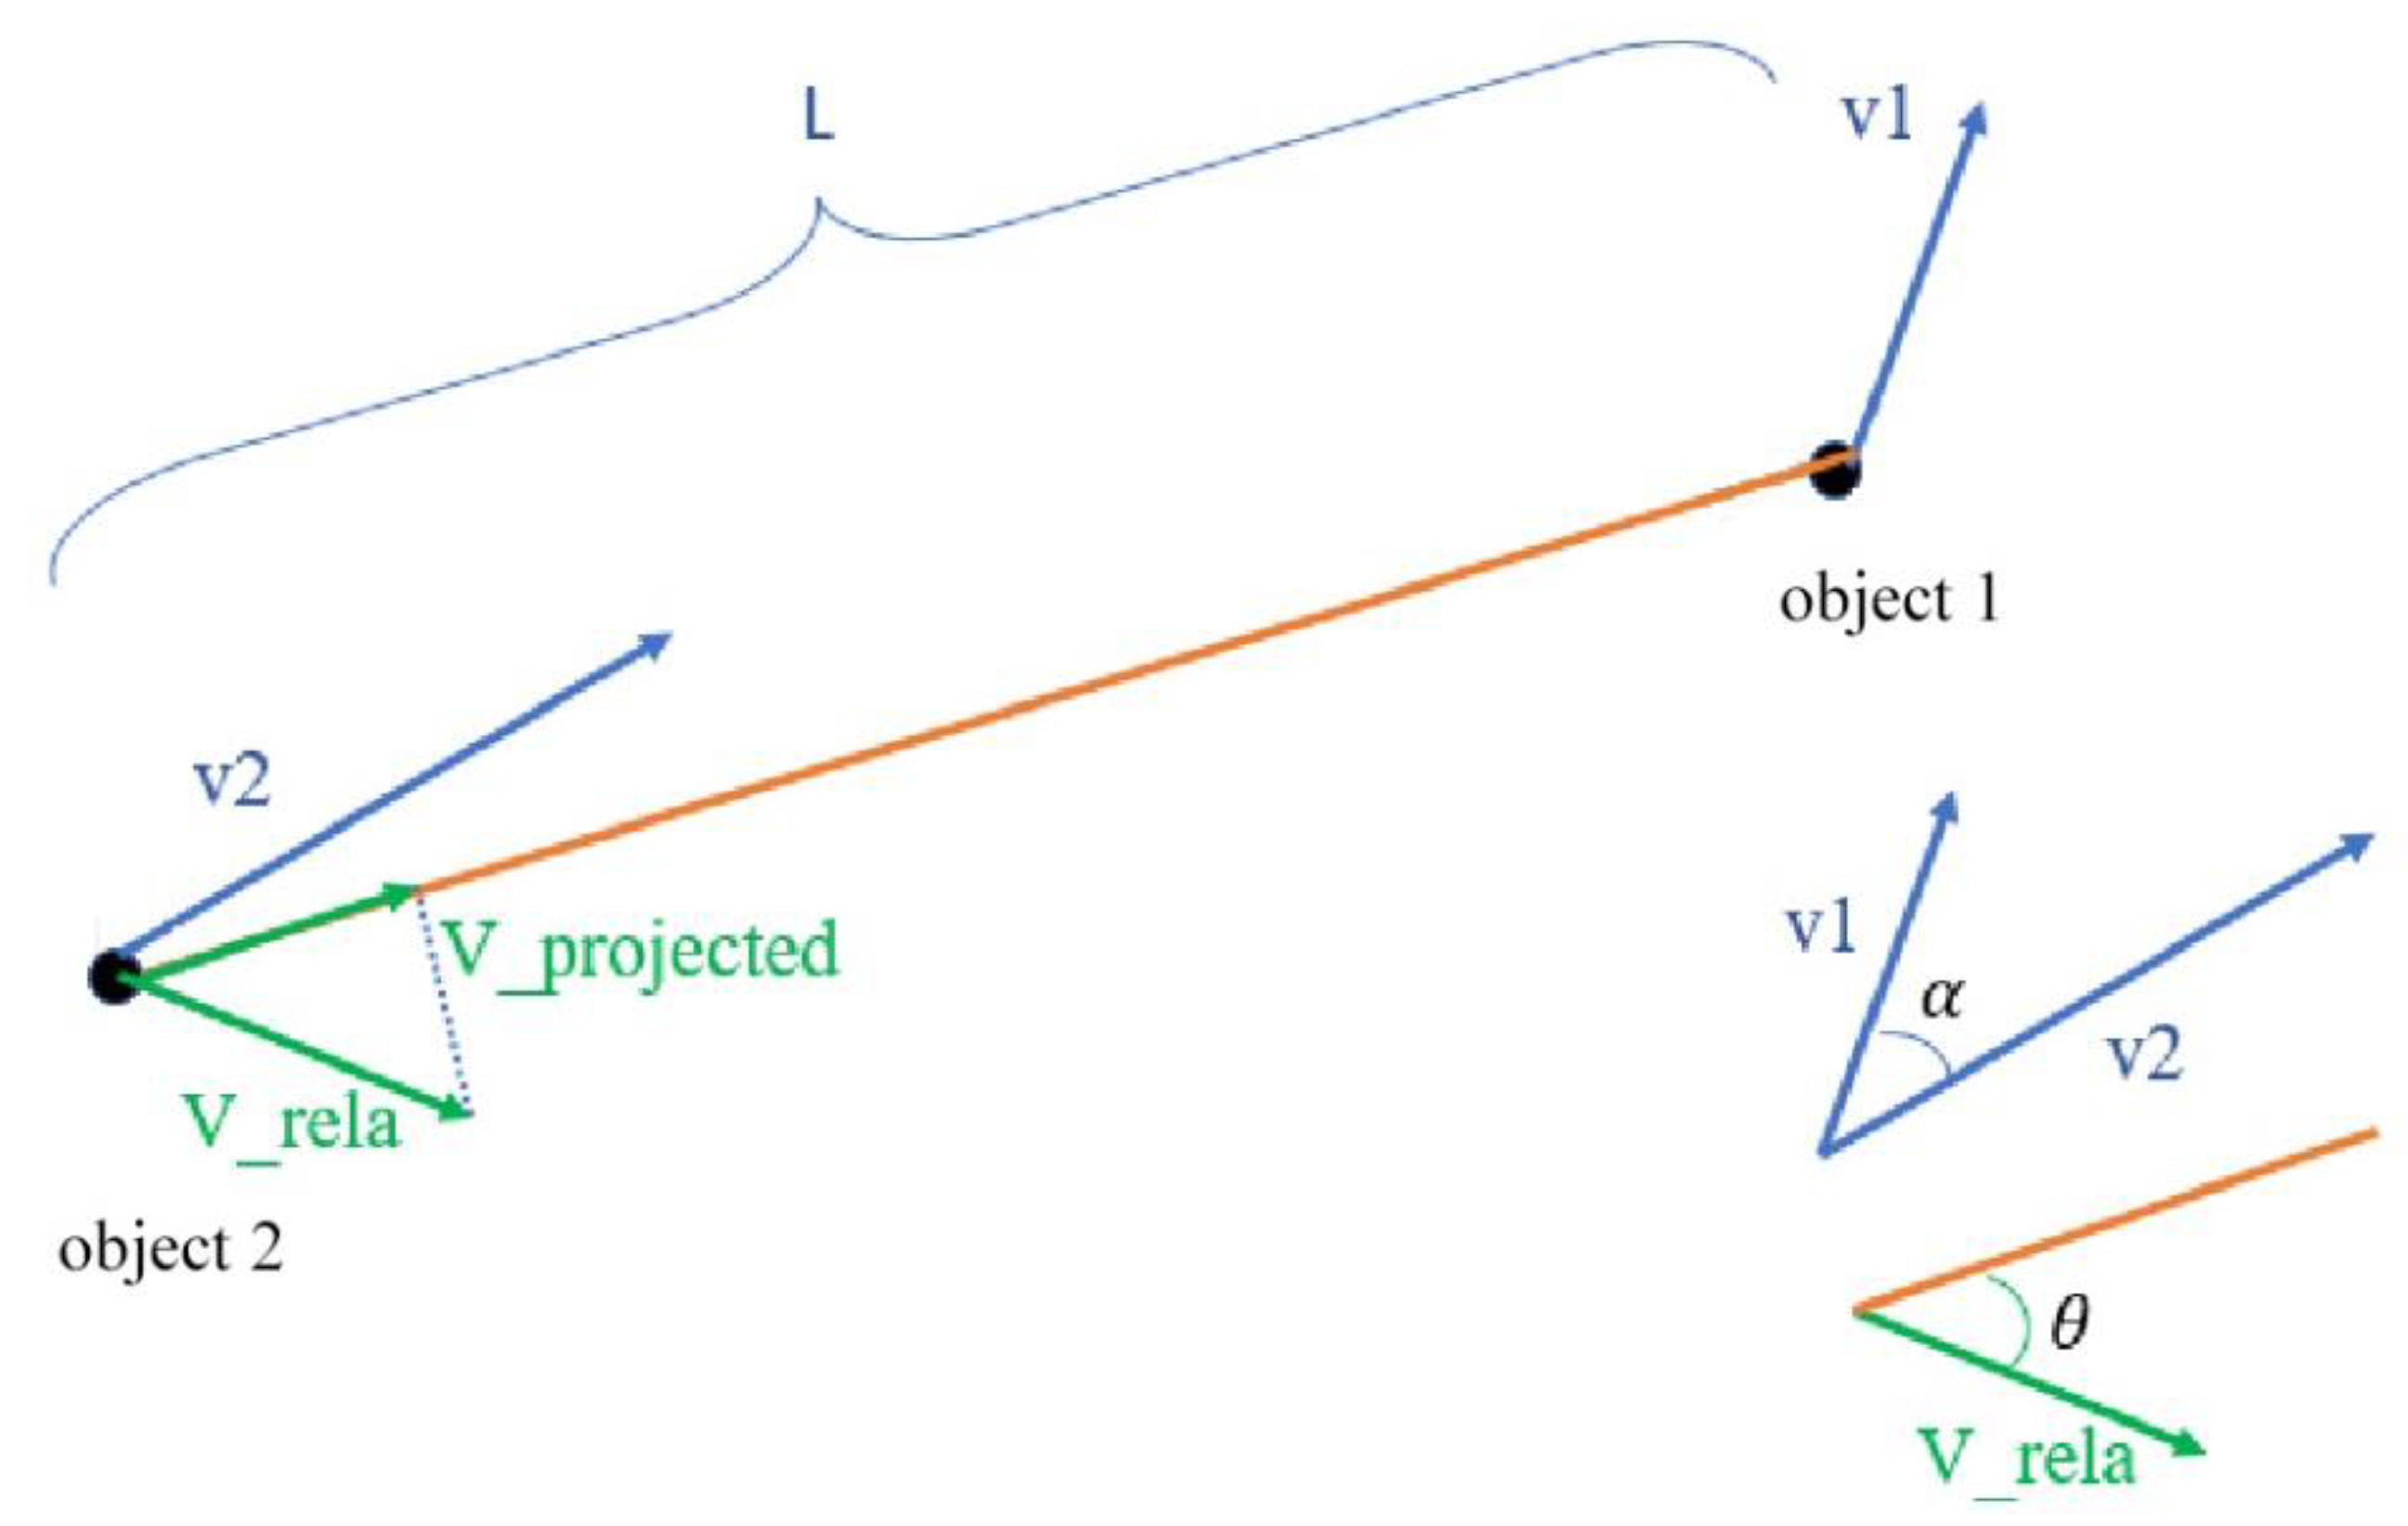
3.2. Data Preparation and Risk Assessment
3.3. Performance Evaluation
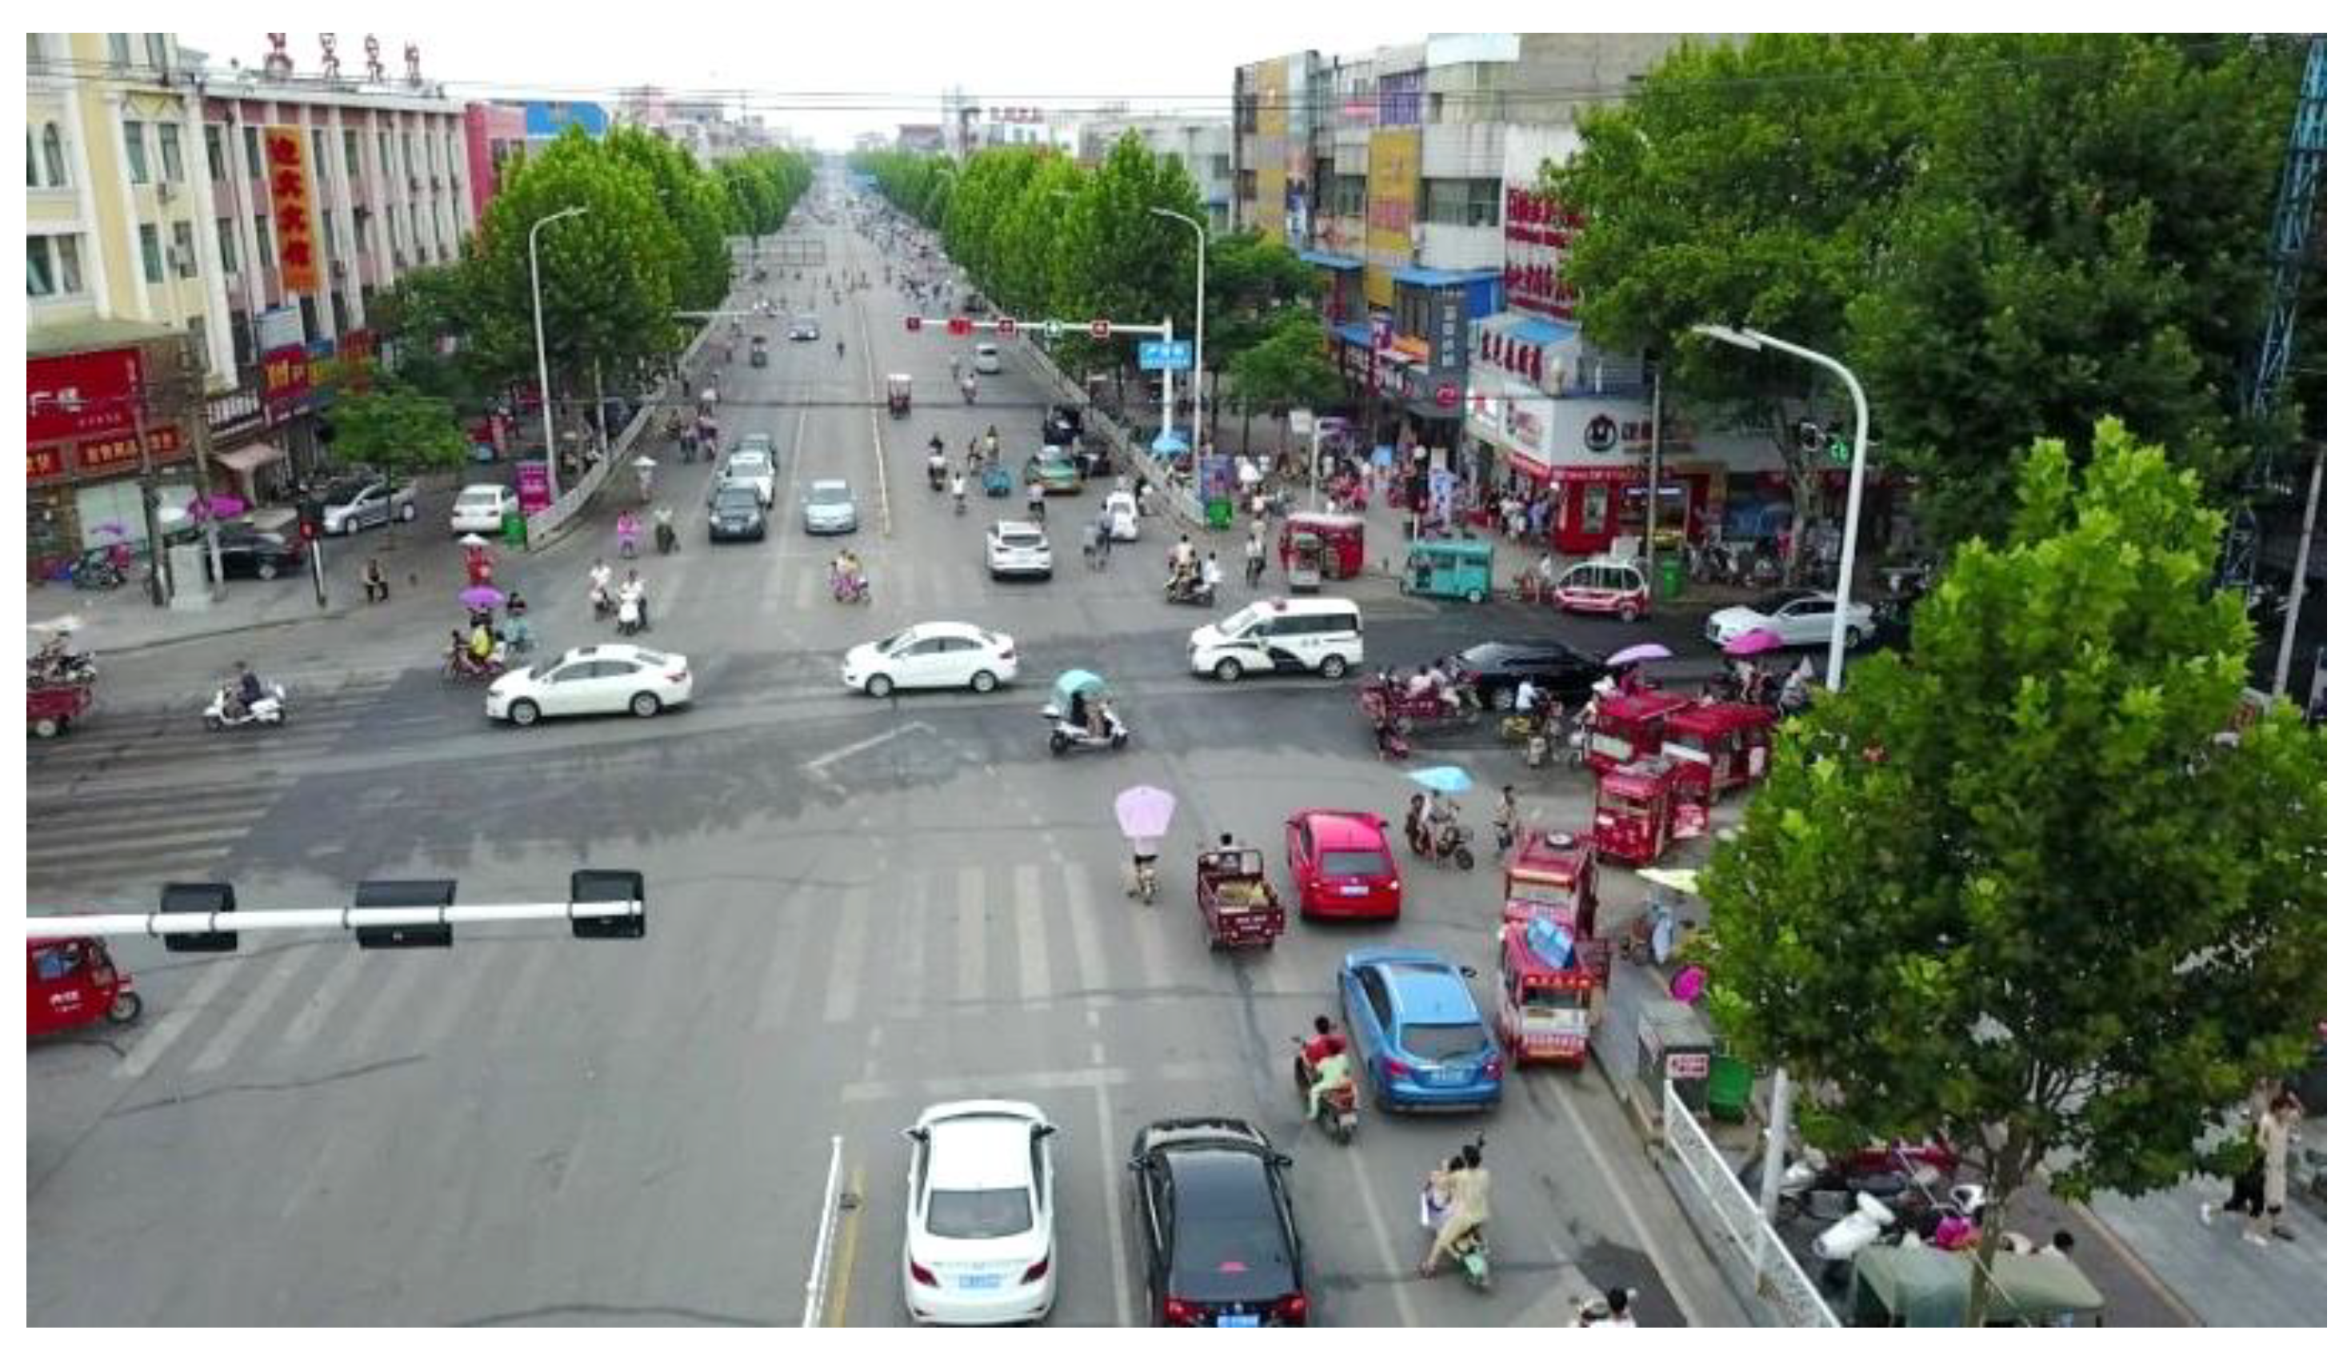
4. Case Study and Analysis
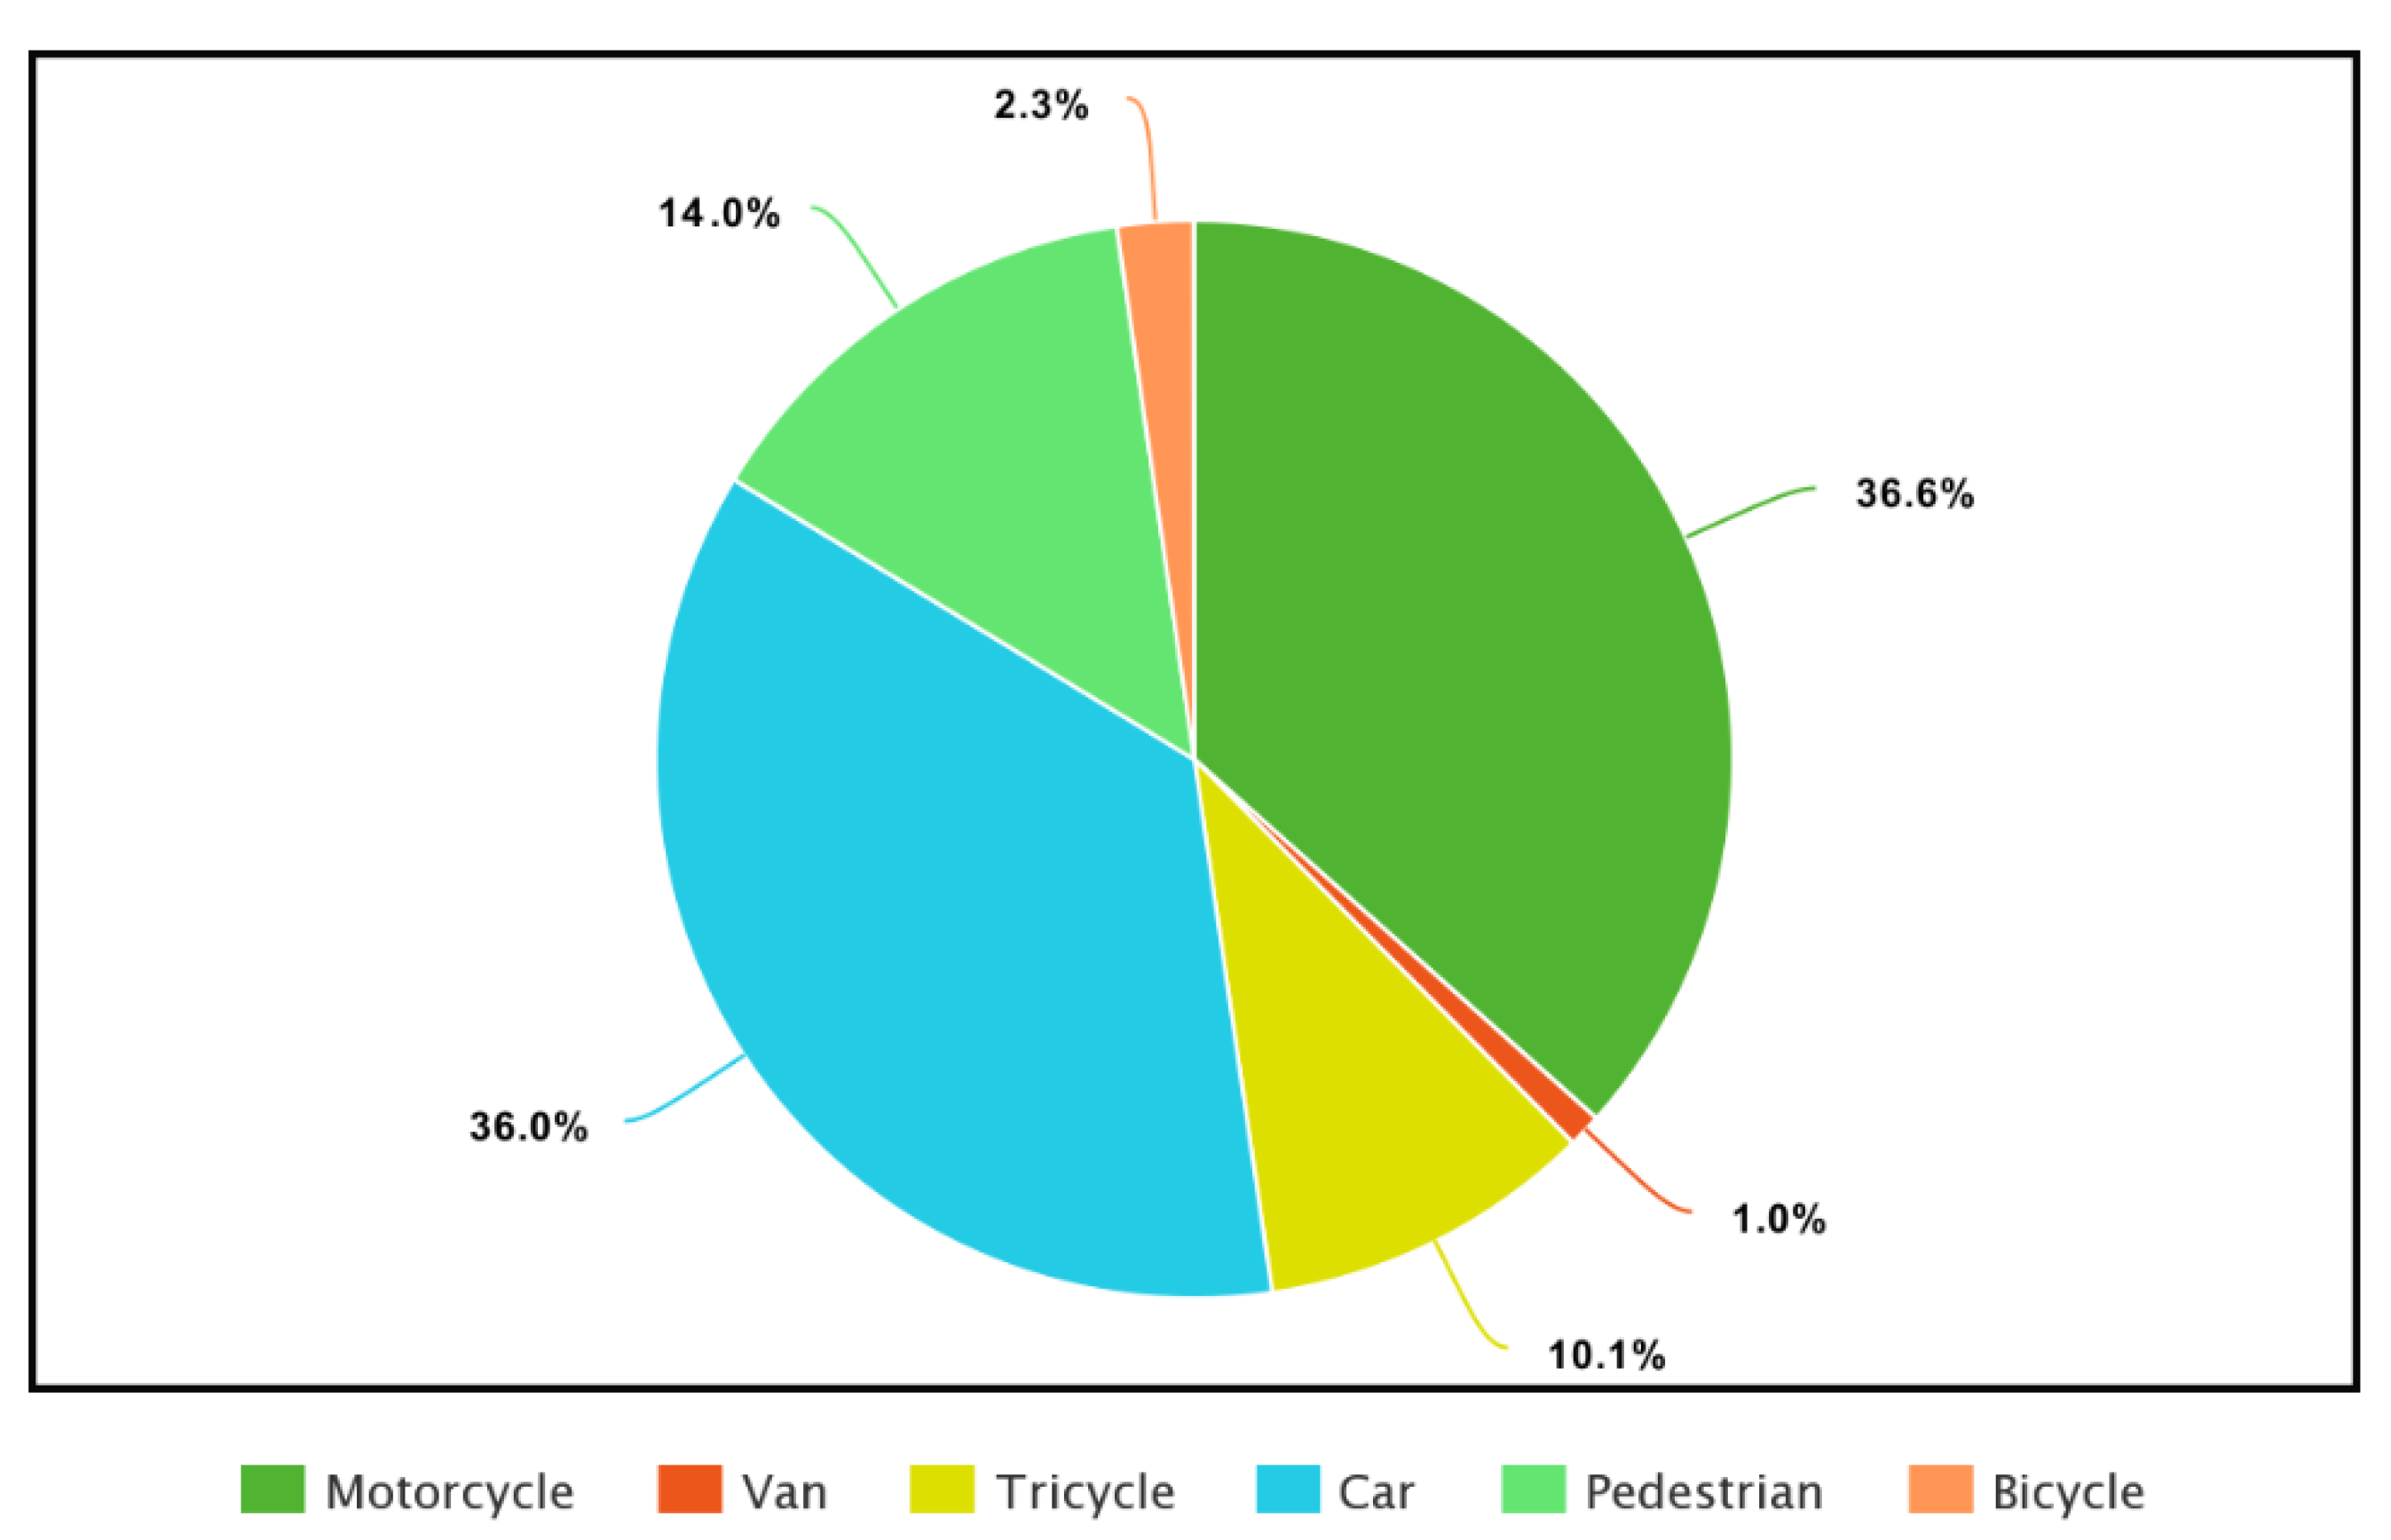
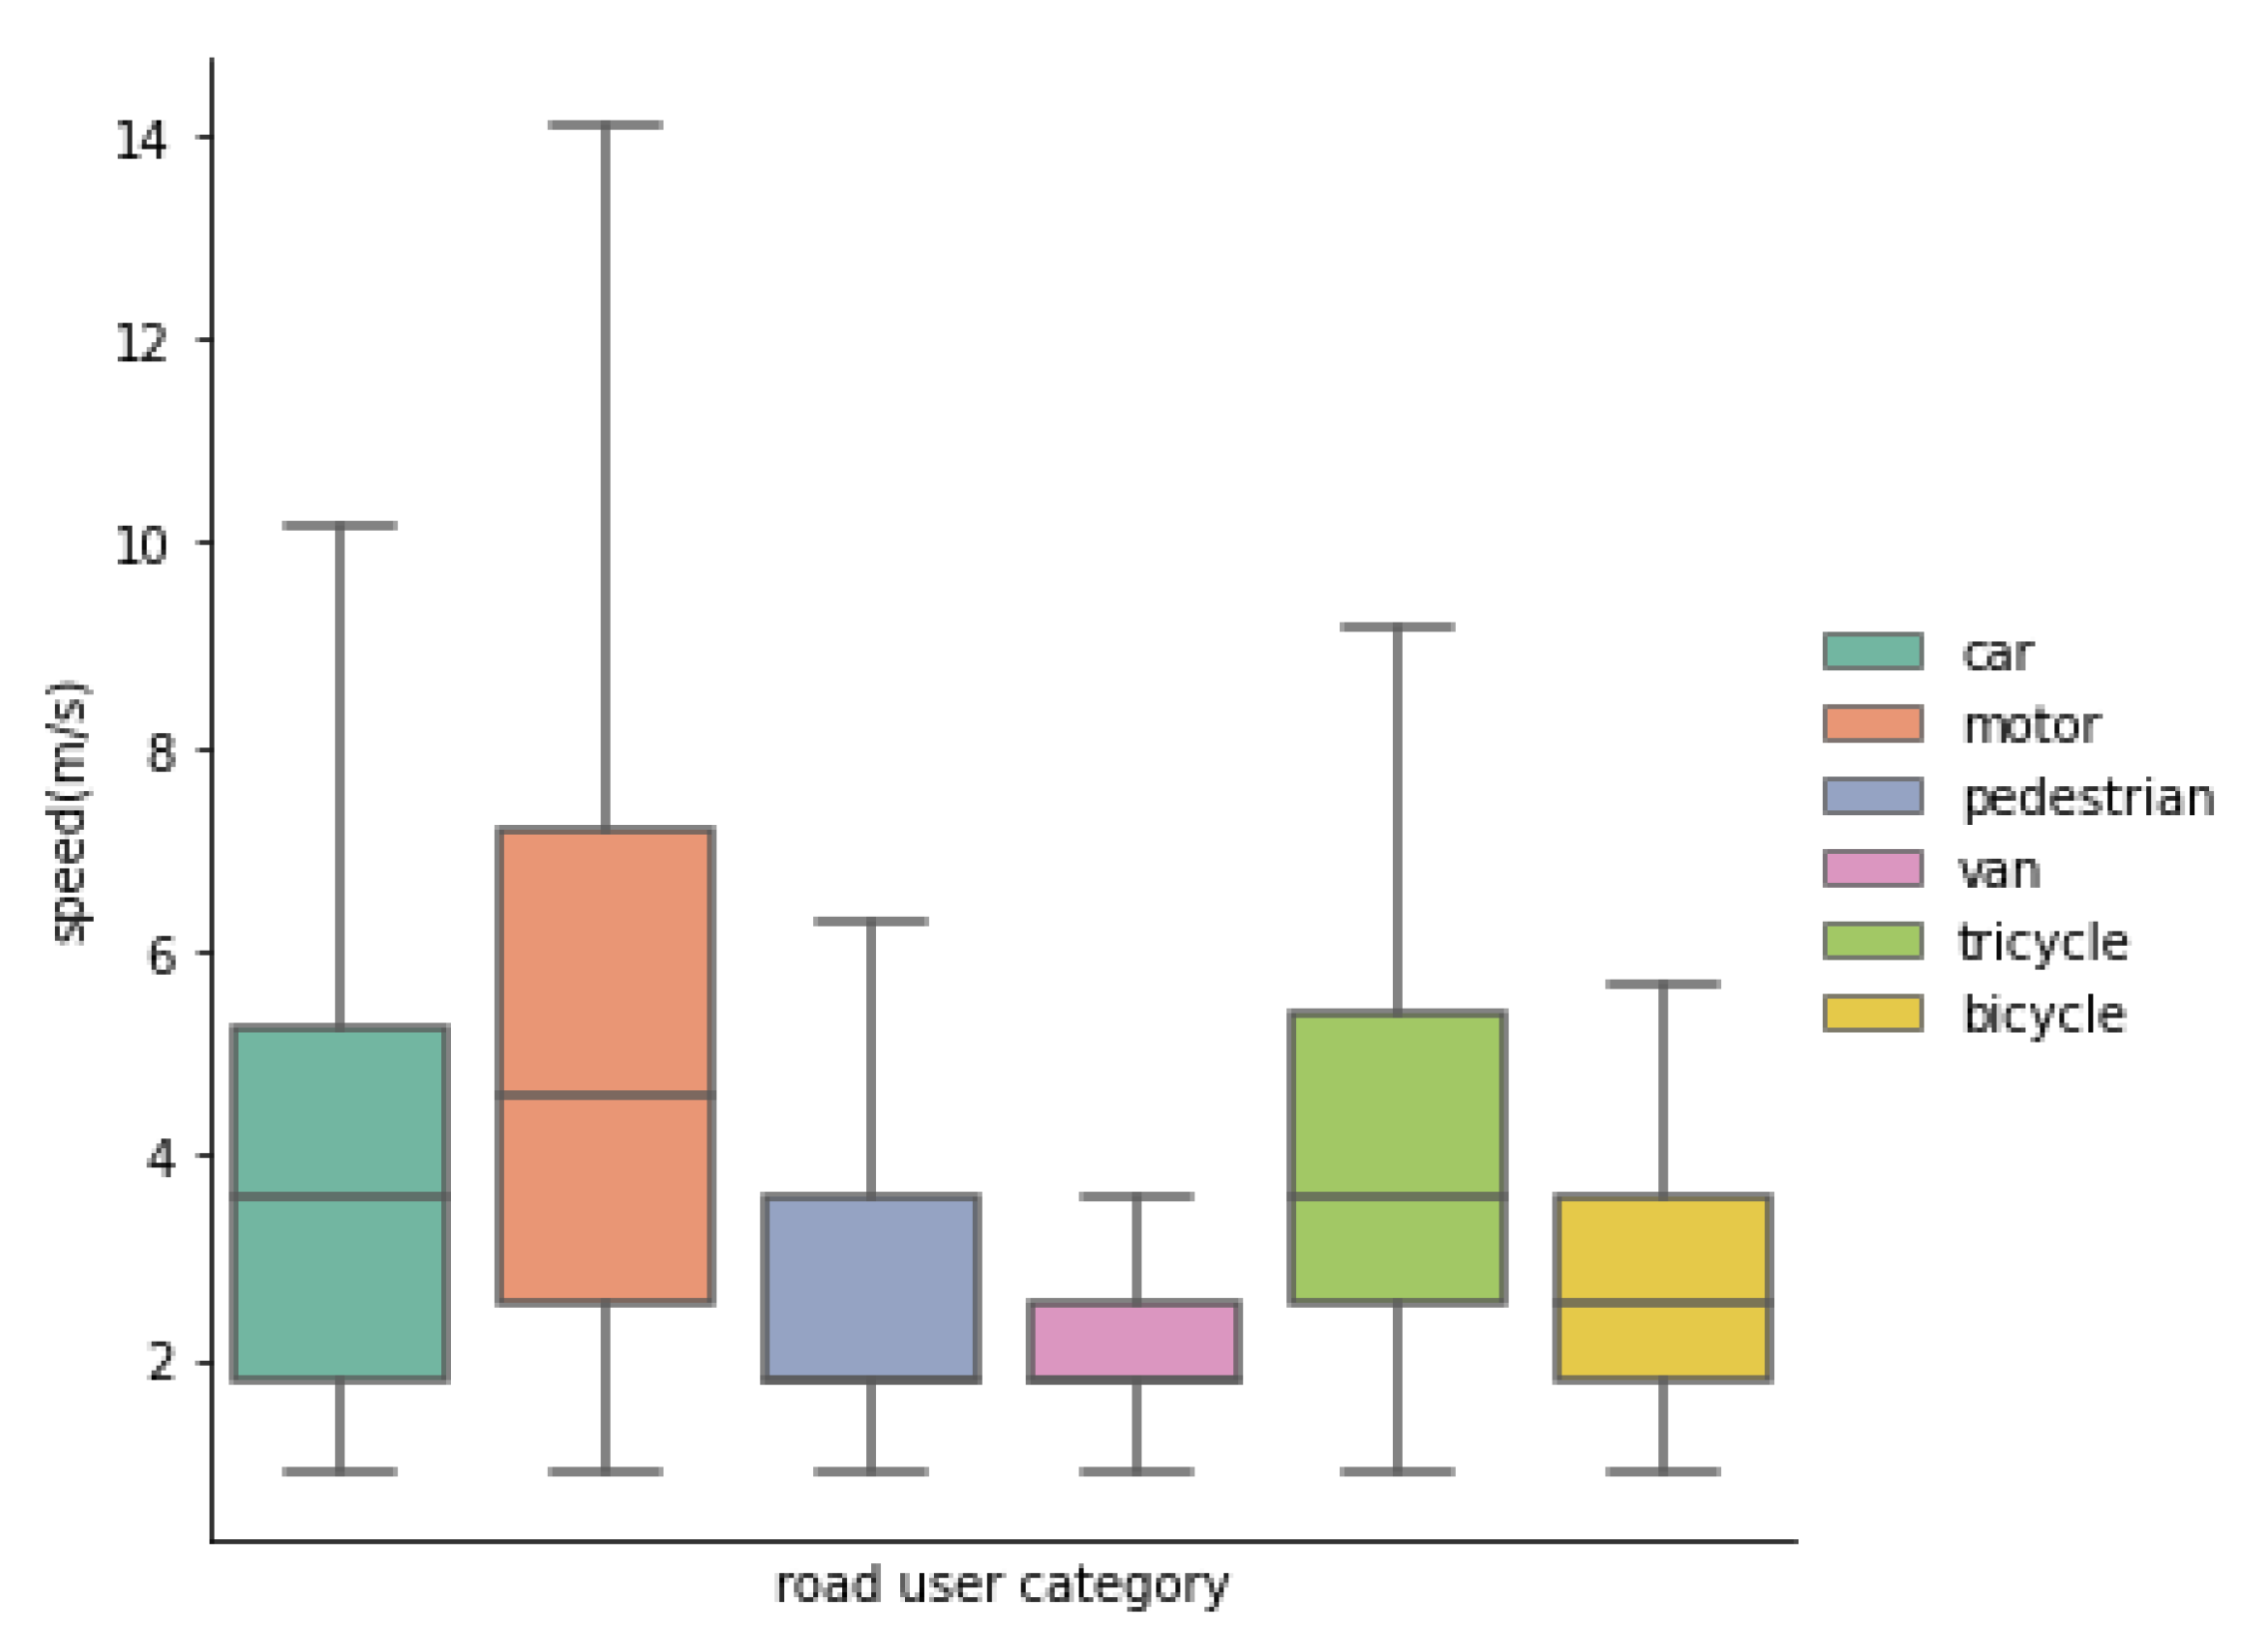
4.1. Road Traffic Performance Characterization
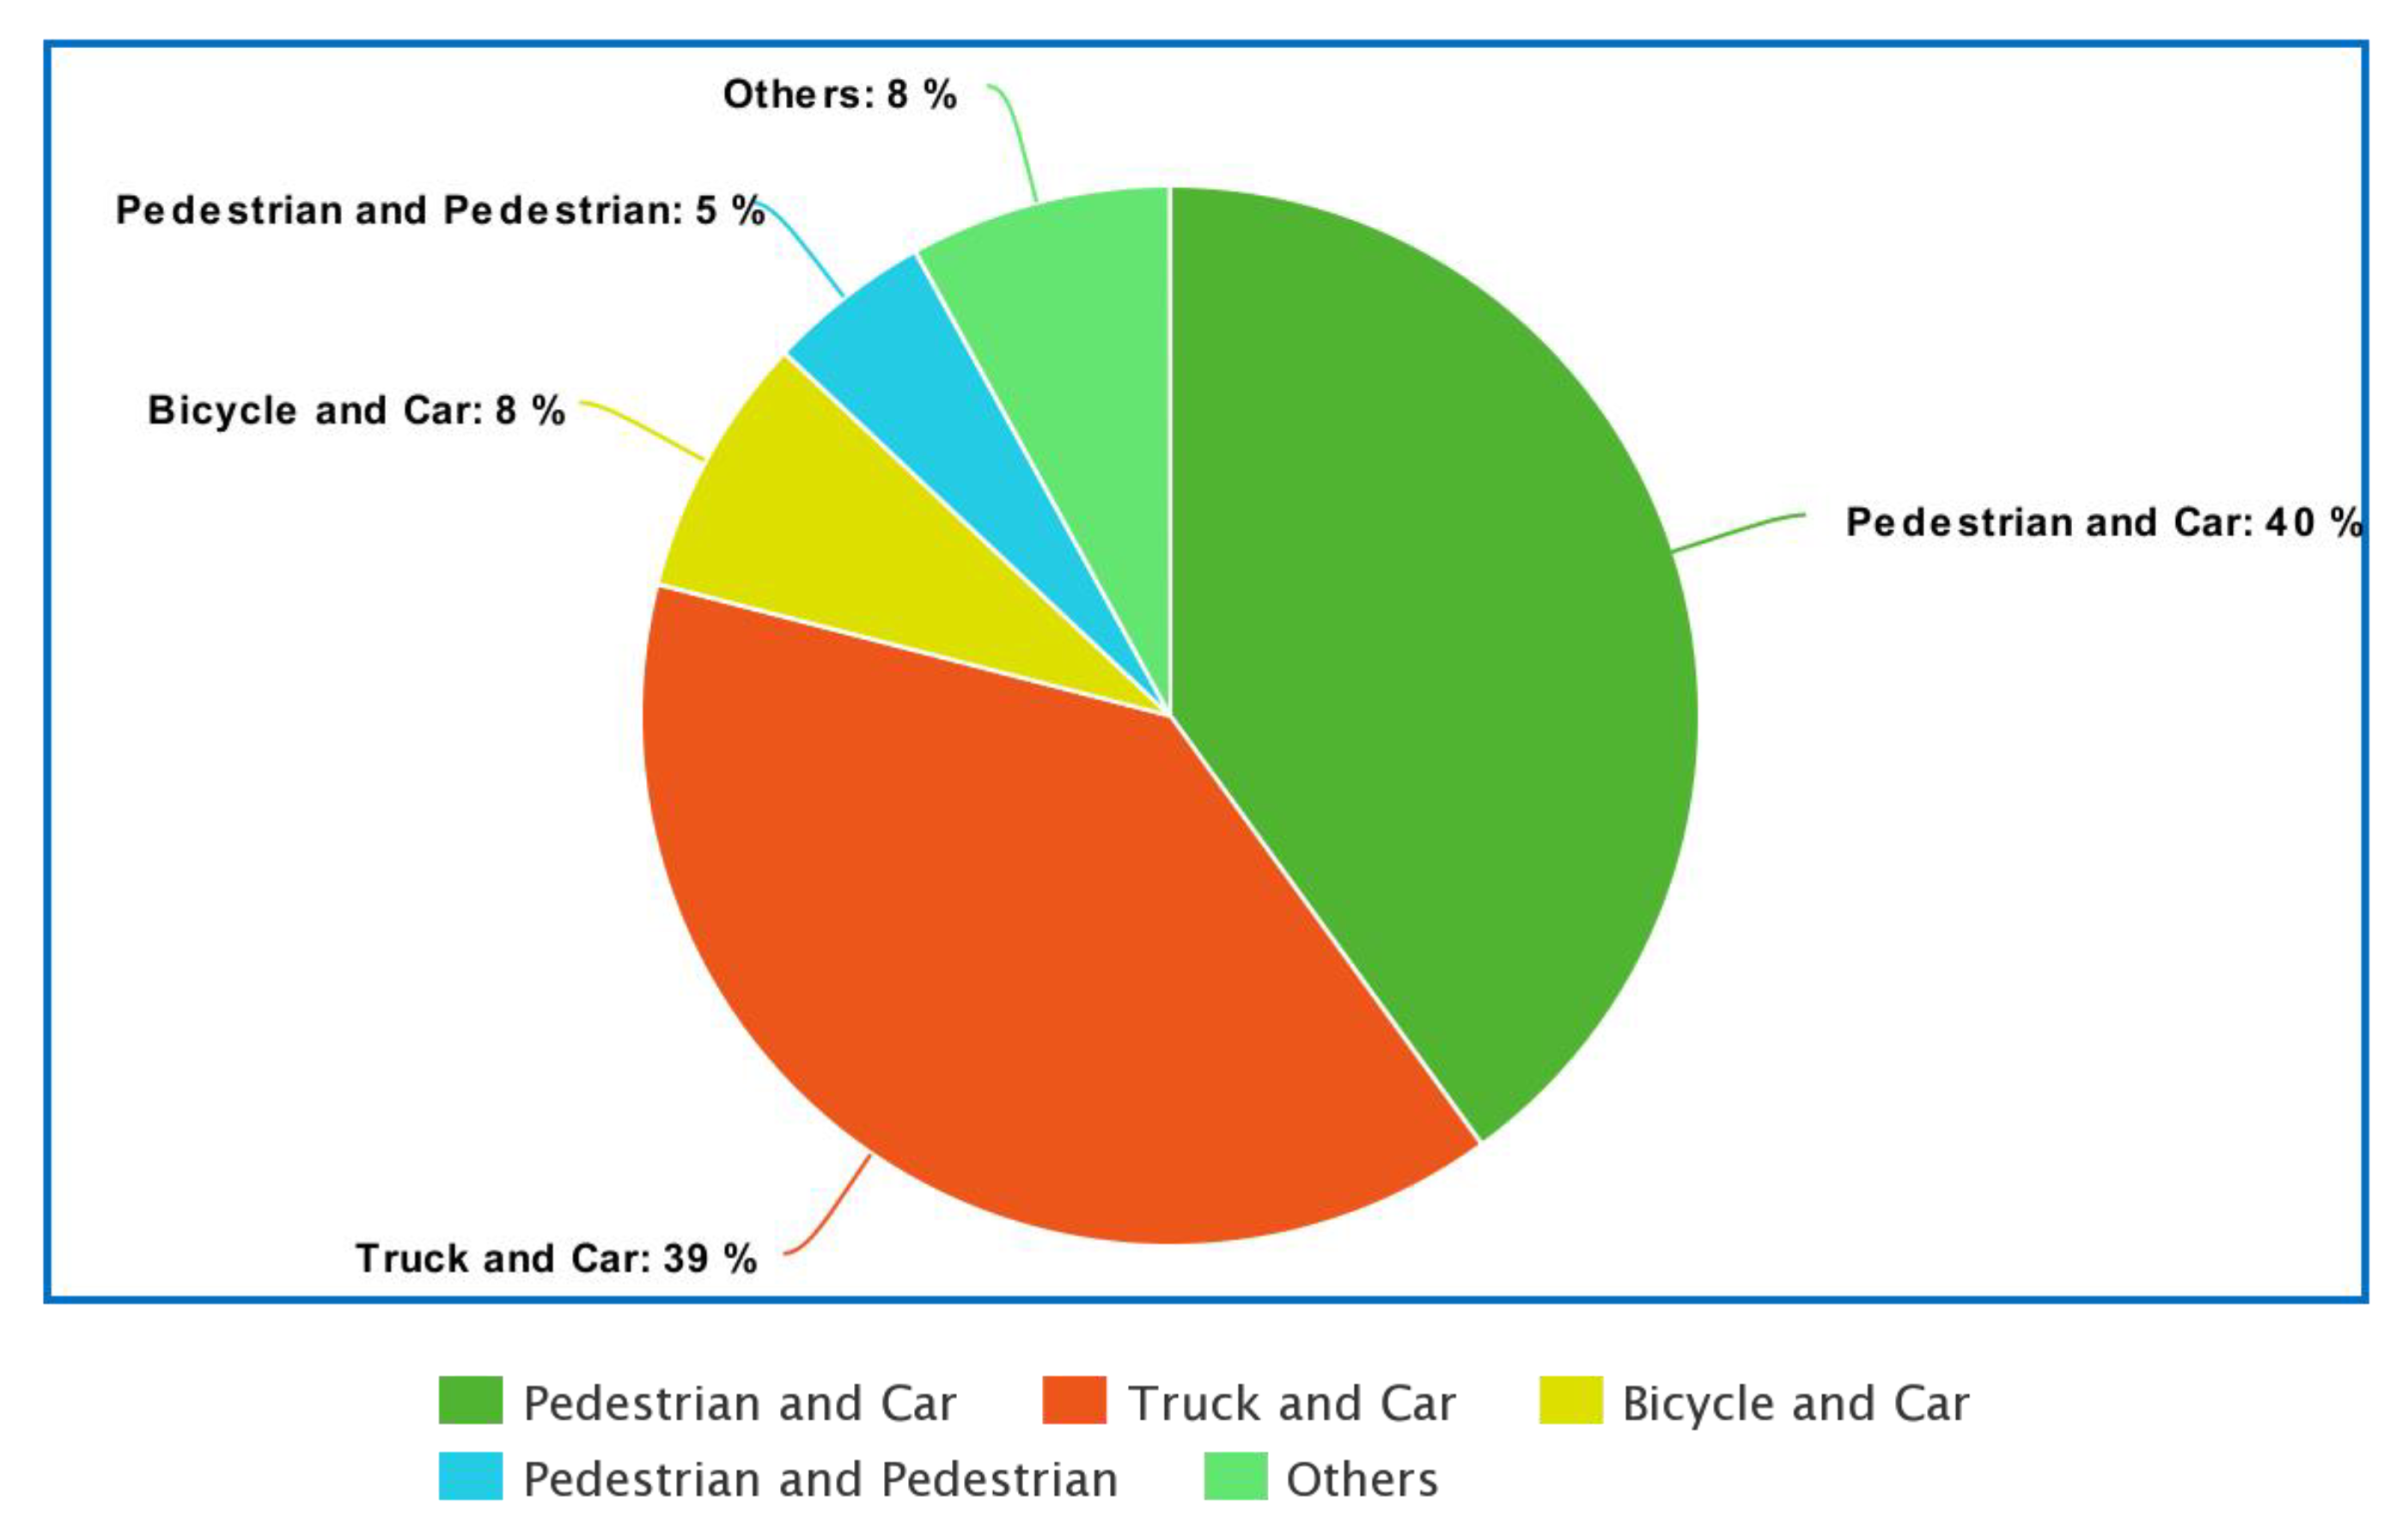
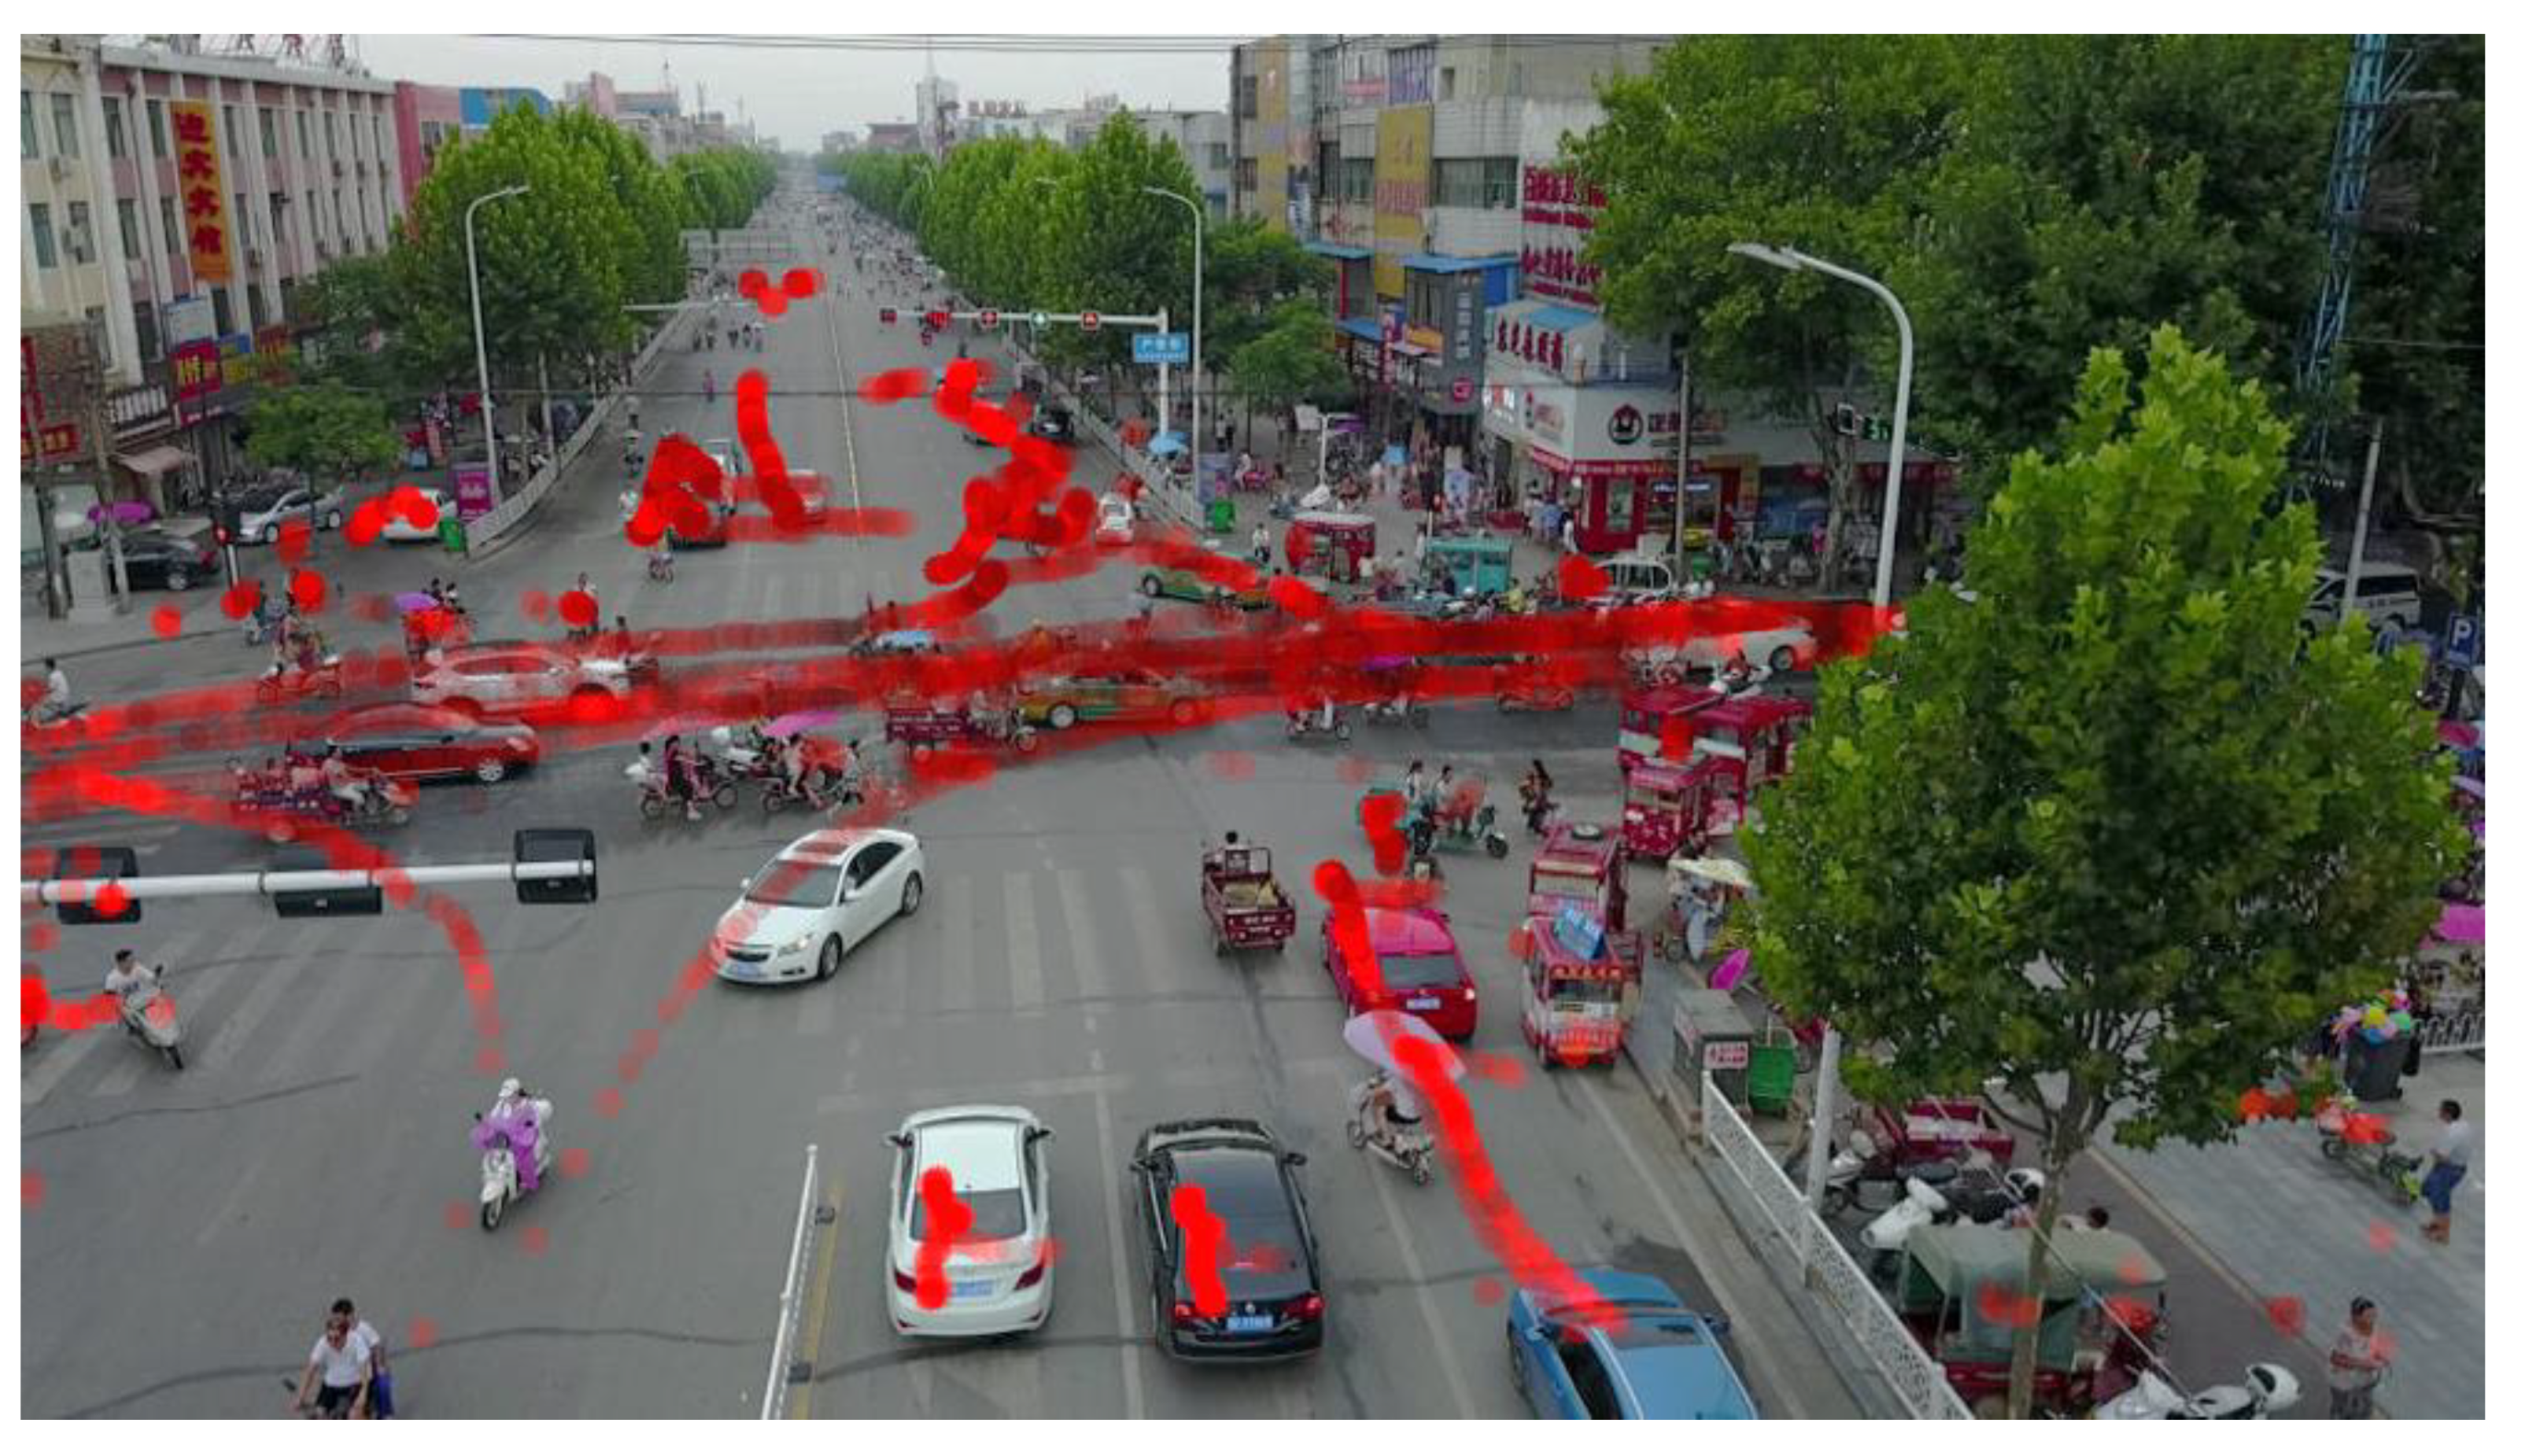
4.2. Risk Profiles
4.3. Risk Prediction
5. Concluding Remarks
Author Contributions
Funding
Acknowledgments
Conflicts of Interest
References
- Prevot, T.; Rios, J.; Kopardekar, P.; Robinson, J.E., III; Johnson, M.; Jung, J. The UAS Traffic Management (UTM) Concept of Operations to Safely Enable Low Altitude Flight Operations. In Proceedings of the 16th American Institute of Aeronautics and Astronautics (AIAA) Aviation Technology, Integration, and Operations Conference, Washington, DC, USA, 13 June 2016. [Google Scholar]
- Shahmoradi, J.; Talebi, E.; Roghanchi, P.; Hassanalian, M. A Comprehensive Review of Applications of Drone Technology in the Mining Industry. Drones 2020, 4, 34. [Google Scholar] [CrossRef]
- Michał, M.; Adam, W.; Jeffery, M. PwC’s Global Report on the Commercial Applications of Drone Technology. Available online: https://www.pwc.pl/pl/pdf/clarity-from-above-pwc.pdf (accessed on 20 February 2022).
- Nath, T. How Drones Are Changing the Business World. Available online: https://www.investopedia.com/articles/investing/010615/how-drones-are-changing-business-world.asp (accessed on 20 February 2022).
- Outay, F.; Mengash, H.A.; Adnan, M. Applications of Unmanned Aerial Vehicle (UAV) in Road Safety, Traffic and Highway Infrastructure Management: Recent Advances and Challenges. Transp. Res. Part A Policy Pract. 2020, 141, 116–129. [Google Scholar] [CrossRef]
- Kure, M. How Drones Become a Valuable Tool for the Auto Insurance Industry. Available online: https://www.forbes.com/sites/sap/2020/01/29/how-drones-become-a-valuable-tool-for-the-auto-insurance-industry/?sh=691002aa1ac9 (accessed on 20 February 2022).
- Zhang, H.; Liptrott, M.; Bessis, N.; Cheng, J. Real-Time Traffic Analysis Using Deep Learning Techniques and UAV Based Video. In Proceedings of the 16th IEEE International Conference on Advanced Video and Signal Based Surveillance, Washington, DC, USA, 20 September 2019. [Google Scholar]
- Ke, R.; Li, Z.; Kim, S.; Ash, J.; Cui, Z.; Wang, Y. Real-Time Bidirectional Traffic Flow Parameter Estimation from Aerial Videos. IEEE Trans. Intell. Transp. Syst. 2017, 18, 890–901. [Google Scholar] [CrossRef]
- Raj, C.V.; Sree, B.N.; Madhavan, R. Vision Based Accident Vehicle Identification and Scene Investigation. In Proceedings of the 2017 IEEE Region 10 Symposium (TENSYMP), Cochin, India, 14–16 July 2017; pp. 1–5. [Google Scholar]
- Lovelace, B. Unmanned Aerial Vehicle Bridge Inspection Demonstration Project. Available online: https://www.lrrb.org/pdf/201540.pdf (accessed on 20 February 2022).
- Timmermans, J.S.; Beroggi, G.E.G. Conflict Resolution in Sustainable Infrastructure Management. Saf. Sci. 2000, 35, 175–192. [Google Scholar] [CrossRef]
- Mihyeon Jeon, C.; Amekudzi, A. Addressing Sustainability in Transportation Systems: Definitions, Indicators, and Metrics. J. Infrastruct. Syst. 2005, 11, 31–50. [Google Scholar] [CrossRef]
- Shen, L.; Wu, Y.; Zhang, X. Key Assessment Indicators for the Sustainability of Infrastructure Projects. J. Constr. Eng. Manag. 2011, 137, 441–451. [Google Scholar] [CrossRef]
- WHO. WHO: Road Traffic Injuries. Available online: https://www.who.int/news-room/fact-sheets/detail/road-traffic-injuries (accessed on 20 February 2022).
- Blincoe, L.; Miller, T.R.; Zaloshnja, E.; Lawrence, B.A. The Economic and Societal Impact of Motor Vehicle Crashes. 2010. Available online: https://crashstats.nhtsa.dot.gov/Api/Public/ViewPublication/812013 (accessed on 20 February 2022).
- Peden, M. Global Collaboration on Road Traffic Injury Prevention. Int. J. Inj. Control. Saf. Promot. 2005, 12, 85–91. [Google Scholar] [CrossRef] [PubMed]
- Kim, N.V.; Chervonenkis, M.A. Situation Control of Unmanned Aerial Vehicles for Road Traffic Monitoring. Mod. Appl. Sci. 2015, 9, 1. [Google Scholar] [CrossRef]
- Sharma, V.; Chen, H.C.; Kumar, R. Driver Behaviour Detection and Vehicle Rating Using Multi-UAV Coordinated Vehicular Networks. J. Comput. Syst. Sci. 2017, 86, 3–32. [Google Scholar] [CrossRef]
- Ammoun, S.; Nashashibi, F. Real Time Trajectory Prediction for Collision Risk Estimation between Vehicles. In Proceedings of the 2009 IEEE 5th International Conference on Intelligent Computer Communication and Processing, Cluj-Napoca, Romania, 28 August 2009; pp. 417–422. [Google Scholar]
- Gelbal, S.Y.; Arslan, S.; Wang, H.; Aksun-Guvenc, B.; Guvenc, L. Elastic Band Based Pedestrian Collision Avoidance Using V2X Communication. In Proceedings of the IEEE Intelligent Vehicles Symposium, Los Angeles, CA, USA, 11–14 June 2017; pp. 270–276. [Google Scholar]
- Ha, P.Y.J.; Chen, S.; Du, R.; Dong, J.; Li, Y.; Labi, S. Vehicle Connectivity and Automation: A Sibling Relationship. Front. Built Environ. 2020, 6, 199. [Google Scholar] [CrossRef]
- Dong, J.; Chen, S.; Li, Y.; Du, R.; Steinfeld, A.; Labi, S. Space-Weighted Information Fusion Using Deep Reinforcement Learning: The Context of Tactical Control of Lane-Changing Autonomous Vehicles and Connectivity Range Assessment. Transp. Res. Part C Emerg. Technol. 2021, 128, 103192. [Google Scholar] [CrossRef]
- Kiela, K.; Barzdenas, V.; Jurgo, M.; Macaitis, V.; Rafanavicius, J.; Vasjanov, A.; Kladovscikov, L.; Navickas, R. Review of V2X–IoT Standards and Frameworks for ITS Applications. Appl. Sci. 2020, 10, 4314. [Google Scholar] [CrossRef]
- Ghosal, A.; Conti, M. Security Issues and Challenges in V2X: A Survey. Comput. Netw. 2020, 169, 107093. [Google Scholar] [CrossRef]
- Federal Highway Administration Intersection Safety|FHWA. Available online: https://highways.dot.gov/research/research-programs/safety/intersection-safety (accessed on 18 October 2021).
- Mehmood, S.; Ahmed, S.; Kristensen, A.S.; Ahsan, D. Multi Criteria Decision Analysis (Mcda) of Unmanned Aerial Vehicles (Uavs) as a Part of Standard Response to Emergencies. In Proceedings of the 4th International Conference on Green Computing and Engineering Technologies, Esbjerg, Denmark, 18 August 2018; p. 31. [Google Scholar]
- Pérez, J.A.; Gonçalves, G.R.; Rangel, J.M.G.; Ortega, P.F. Accuracy and Effectiveness of Orthophotos Obtained from Low Cost UASs Video Imagery for Traffic Accident Scenes Documentation. Adv. Eng. Softw. 2019, 132, 47–54. [Google Scholar] [CrossRef]
- Su, S.; Liu, W.; Li, K.; Yang, G.; Feng, C.; Ming, J.; Liu, G.; Liu, S.; Yin, Z. Developing an Unmanned Aerial Vehicle-Based Rapid Mapping System for Traffic Accident Investigation. Aust. J. Forensic Sci. 2016, 48, 454–468. [Google Scholar] [CrossRef]
- Gu, X.; Abdel-Aty, M.; Xiang, Q.; Cai, Q.; Yuan, J. Utilizing UAV Video Data for In-Depth Analysis of Drivers’ Crash Risk at Interchange Merging Areas. Accid. Anal. Prev. 2019, 123, 159–169. [Google Scholar] [CrossRef]
- Ke, R.; Li, Z.; Tang, J.; Pan, Z.; Wang, Y. Real-Time Traffic Flow Parameter Estimation from UAV Video Based on Ensemble Classifier and Optical Flow. IEEE Trans. Intell. Transp. Syst. 2018, 20, 54–64. [Google Scholar] [CrossRef]
- Bose, B.; Wang, X.; Grimson, E. Multi-Class Object Tracking Algorithm That Handles Fragmentation and Grouping. In Proceedings of the 2007 IEEE Conference on Computer Vision and Pattern Recognition, Minneapolis, MN, USA, 17–22 June 2007; pp. 1–8. [Google Scholar]
- Song, B.; Jeng, T.-Y.; Staudt, E.; Roy-Chowdhury, A.K. A Stochastic Graph Evolution Framework for Robust Multi-Target Tracking. In Proceedings of the European Conference on Computer Vision, Crete, Greece, 10 September 2010; pp. 605–619. [Google Scholar]
- Hu, W.; Li, X.; Luo, W.; Zhang, X.; Maybank, S.; Zhang, Z. Single and Multiple Object Tracking Using Log-Euclidean Riemannian Subspace and Block-Division Appearance Model. IEEE Trans. Pattern Anal. Mach. Intell. 2012, 34, 2420–2440. [Google Scholar]
- Zhang, L.; van der Maaten, L. Structure Preserving Object Tracking. In Proceedings of the IEEE Conference on Computer Vision and Pattern Recognition, Portland, OR, USA, 23 June 2013; pp. 1838–1845. [Google Scholar]
- Zhou, X.; Koltun, V.; Krähenbühl, P. Tracking Objects as Points. In Proceedings of the European Conference on Computer Vision, Online, 23 August 2020; pp. 474–490. [Google Scholar]
- Abrari Vajari, M.; Aghabayk, K.; Sadeghian, M.; Shiwakoti, N. A Multinomial Logit Model of Motorcycle Crash Severity at Australian Intersections. J. Saf. Res. 2020, 73, 17–24. [Google Scholar] [CrossRef] [PubMed]
- Northmore, A.; Hildebrand, E. Intersection Characteristics That Influence Collision Severity and Cost. J. Saf. Res. 2019, 70, 49–57. [Google Scholar] [CrossRef]
- Shah, D.; Lee, C. Analysis of Effects of Driver’s Evasive Action Time on Rear-End Collision Risk Using a Driving Simulator. J. Saf. Res. 2021, 78, 242–250. [Google Scholar] [CrossRef] [PubMed]
- Wachtel, A.; Lewiston, D. Risk Factors for Bicycle-Motor Vehicle Collisions at Intersections. J. Saf. Res. 1996, 27, 195. [Google Scholar] [CrossRef][Green Version]
- American National Standard. Association of Transportation Safety Information Professionals Manual on Classification of Motor Vehicle Traffic Crashes. Available online: https://www.nhtsa.gov/sites/nhtsa.gov/files/documents/ansi_d16-2017.pdf (accessed on 20 February 2022).
- Wu, C.; Peng, L.; Huang, Z.; Zhong, M.; Chu, D. A Method of Vehicle Motion Prediction and Collision Risk Assessment with a Simulated Vehicular Cyber Physical System. Transp. Res. Part C Emerg. Technol. 2014, 47, 179–191. [Google Scholar] [CrossRef]
- Du, R.; Chen, S.; Li, Y.; Ha, P.; Dong, J.; Labi, S.; Anastasopoulos, P.C. A Cooperative Crash Avoidance Framework for Autonomous Vehicle under Collision-Imminent Situations in Mixed Traffic Stream. In Proceedings of the IEEE Intelligent Transportation Systems Conference (ITSC), Indianapolis, IN, USA, 19–22 September 2021. [Google Scholar]
- Peng, L.; Sotelo, M.A.; He, Y.; Ai, Y.; Li, Z. A Method for Vehicle Collision Risk Assessment through Inferring Driver’s Braking Actions in Near-Crash Situations. arXiv 2020, arXiv:2004.13761. [Google Scholar] [CrossRef]
- Kim, J.; Kum, D. Collision Risk Assessment Algorithm via Lane-Based Probabilistic Motion Prediction of Surrounding Vehicles. IEEE Trans. Intell. Transp. Syst. 2017, 19, 2965–2976. [Google Scholar] [CrossRef]
- Misener, J.A.; Biswas, S.; Larson, G. Development of V-to-X Systems in North America: The Promise, the Pitfalls and the Prognosis. Comput. Netw. 2011, 55, 3120–3133. [Google Scholar] [CrossRef]
- Themann, P.; Kotte, J.; Raudszus, D.; Eckstein, L. Impact of Positioning Uncertainty of Vulnerable Road Users on Risk Minimization in Collision Avoidance Systems. In Proceedings of the 2015 IEEE Intelligent Vehicles Symposium (IV), Seoul, Korea, 28 June–1 July 2015; pp. 1201–1206. [Google Scholar]
- Tu, Y.; Wang, W.; Li, Y.; Xu, C.; Xu, T.; Li, X. Longitudinal Safety Impacts of Cooperative Adaptive Cruise Control Vehicle’s Degradation. J. Saf. Res. 2019, 69, 177–192. [Google Scholar] [CrossRef] [PubMed]
- Taleb, T.; Benslimane, A.; Letaief, K.B. Toward an Effective Risk-Conscious and Collaborative Vehicular Collision Avoidance System. IEEE Trans. Veh. Technol. 2010, 59, 1474–1486. [Google Scholar] [CrossRef]
- Hayward, J.C. Near Miss Determination through Use of a Scale of Danger. Available online: https://mdpi-res.com/data/mdpi_references_guide_v5.pdf (accessed on 20 February 2022).
- Nadimi, N.; NaserAlavi, S.S.; Asadamraji, M. Calculating Dynamic Thresholds for Critical Time to Collision as a Safety Measure. Proc. Inst. Civ. Eng.-Transp. 2020, 6, 1–10. [Google Scholar] [CrossRef]
- Zhu, P.; Wen, L.; Du, D.; Bian, X.; Hu, Q.; Ling, H. Vision Meets Drones: Past, Present and Future. arXiv 2020, arXiv:2001.06303. [Google Scholar]
- Angah, O.; Chen, A.Y. Tracking Multiple Construction Workers through Deep Learning and the Gradient Based Method with Re-Matching Based on Multi-Object Tracking Accuracy. Autom. Constr. 2020, 119, 103308. [Google Scholar] [CrossRef]
- Vivek, A.K.; Khan, T.; Mohapatra, S.S. Safety and Associated Parameters Influencing Performance of Rail Road Grade Crossings: A Critical Review of State of the Art. J. Saf. Res. 2021, 79, 257–272. [Google Scholar] [CrossRef]
- Feizi, A.; Joo, S.; Kwigizile, V.; Oh, J.S. A Pervasive Framework toward Sustainability and Smart-Growth: Assessing Multifaceted Transportation Performance Measures for Smart Cities. J. Transp. Health 2020, 19, 100956. [Google Scholar] [CrossRef]
- U.S. Federal Highway Administration. National Performance Management Measures. Available online: https://www.federalregister.gov/documents/2018/05/31/2018-11652/national-performance-management-measures-assessing-performance-of-the-national-highway-system (accessed on 20 February 2022).
- U.S. Department of Transportation. Evaluation of the Focused Approach to Pedestrian Safety Program. Available online: https://rosap.ntl.bts.gov/view/dot/9008 (accessed on 20 February 2022).
- Hamilton, L.; Wuellner, C.; Grove, K.; Amsden, M.; Cambridge, N.; Arnold, M.; van Houten, R. 2011 PEDESTRIAN CRASH ANALYSIS. Available online: https://www.chicago.gov/content/dam/city/depts/cdot/pedestrian/2011PedestrianCrashAnalysisTechnicalReport.pdf (accessed on 20 February 2022).
- Federal Highway Administration. Fhwa Case Studies for FHWA Pedestrian and Bicycle Focus States and Cities. Available online: https://safety.fhwa.dot.gov/ped_bike/ped_focus/ (accessed on 20 February 2022).
- Monticello, M. Car Safety Systems That Could Save Your Life-Consumer Reports. Available online: https://www.consumerreports.org/automotive-technology/car-safety-systems-that-could-save-your-life/ (accessed on 18 October 2021).
- Consumer Reports Guide to Forward Collision Warning-Consumer Reports. Available online: https://www.consumerreports.org/car-safety/forward-collision-warning-guide/ (accessed on 18 October 2021).
- Vukadinovic, V.; Bakowski, K.; Marsch, P.; Garcia, I.D.; Xu, H.; Sybis, M.; Sroka, P.; Wesolowski, K.; Lister, D.; Thibault, I. 3GPP C-V2X and IEEE 802.11 p for Vehicle-to-Vehicle Communications in Highway Platooning Scenarios. Ad. Hoc. Netw. 2018, 74, 17–29. [Google Scholar] [CrossRef]


| Data | Notes |
|---|---|
| Scale | Match the video to real-world scales |
| Categories | Log all categories of different road users |
| Location of the center of the bounding box at time t | |
| Height of the center of the bounding box at time t | |
| Width of the center of the bounding box at time t | |
| The speed at time t | |
| Category of the detected road user at time t |
| Dataset | MOTA |
|---|---|
| Train set | 64.89 |
| Test set | 63.12 |
| Evaluation Metric | Value |
|---|---|
| Accuracy 1 | 78.2% |
| True positive rate | 80% |
| False positive rate | 31% |
Publisher’s Note: MDPI stays neutral with regard to jurisdictional claims in published maps and institutional affiliations. |
© 2022 by the authors. Licensee MDPI, Basel, Switzerland. This article is an open access article distributed under the terms and conditions of the Creative Commons Attribution (CC BY) license (https://creativecommons.org/licenses/by/4.0/).
Share and Cite
Zong, S.; Chen, S.; Alinizzi, M.; Labi, S. Leveraging UAV Capabilities for Vehicle Tracking and Collision Risk Assessment at Road Intersections. Sustainability 2022, 14, 4034. https://doi.org/10.3390/su14074034
Zong S, Chen S, Alinizzi M, Labi S. Leveraging UAV Capabilities for Vehicle Tracking and Collision Risk Assessment at Road Intersections. Sustainability. 2022; 14(7):4034. https://doi.org/10.3390/su14074034
Chicago/Turabian StyleZong, Shuya, Sikai Chen, Majed Alinizzi, and Samuel Labi. 2022. "Leveraging UAV Capabilities for Vehicle Tracking and Collision Risk Assessment at Road Intersections" Sustainability 14, no. 7: 4034. https://doi.org/10.3390/su14074034
APA StyleZong, S., Chen, S., Alinizzi, M., & Labi, S. (2022). Leveraging UAV Capabilities for Vehicle Tracking and Collision Risk Assessment at Road Intersections. Sustainability, 14(7), 4034. https://doi.org/10.3390/su14074034