
Ultrasound as a Potential Technology to Improve the Quality of Meat Produced from a Mexican Autochthonous Bovine Breed


 ,
,  ,
,  , ,
, ,  and
and 
Abstract
1. Introduction
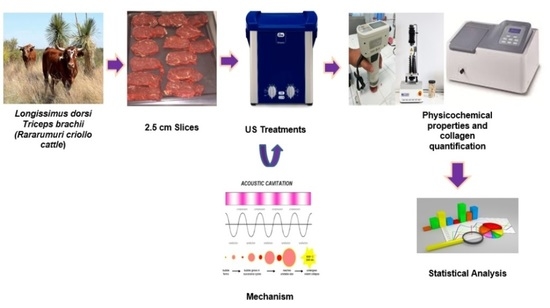
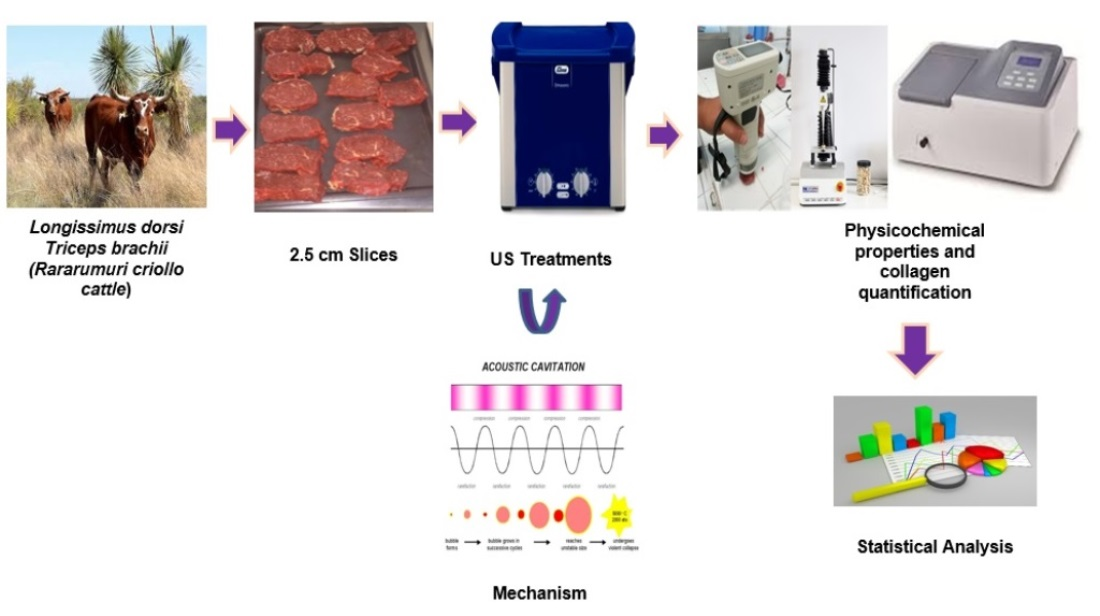
2. Materials and Methods
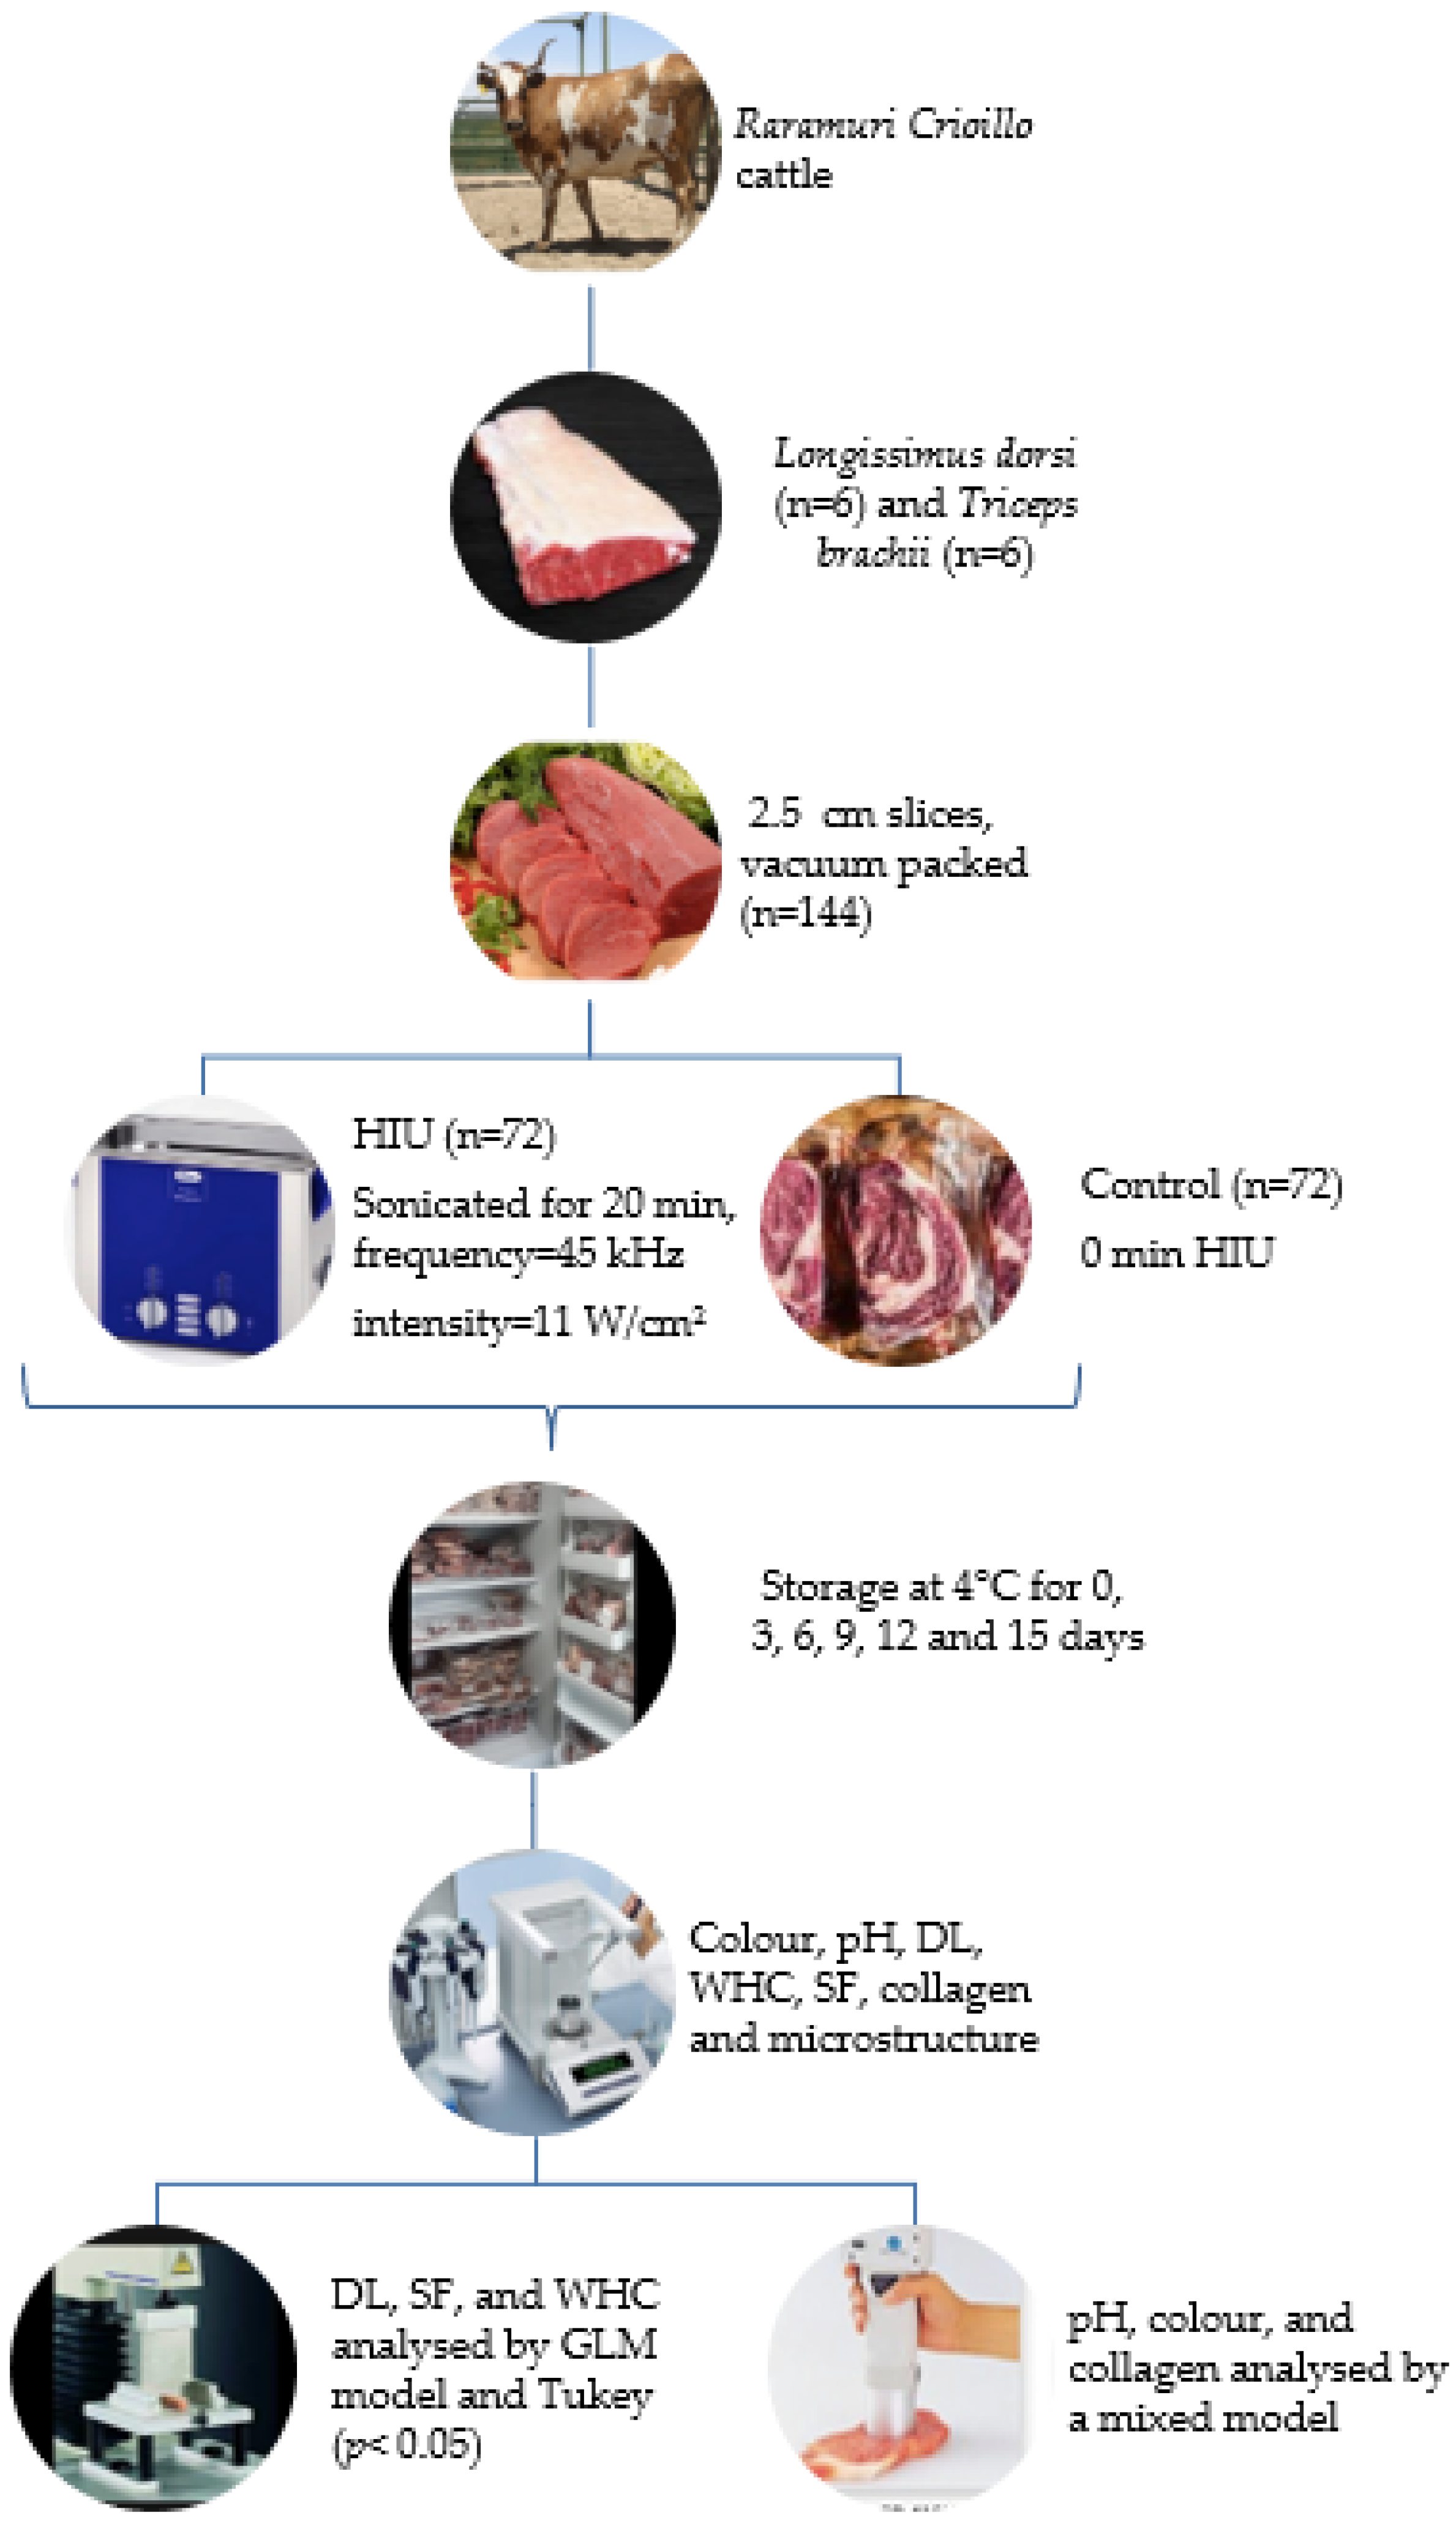
2.1. Animals
2.2. Meat Samples
2.3. Ultrasound Treatment
2.4. Colour Determination
2.5. pH Determination
2.6. Drip Loss
2.7. Water-Holding Capacity
2.8. Shear Force
2.9. Collagen
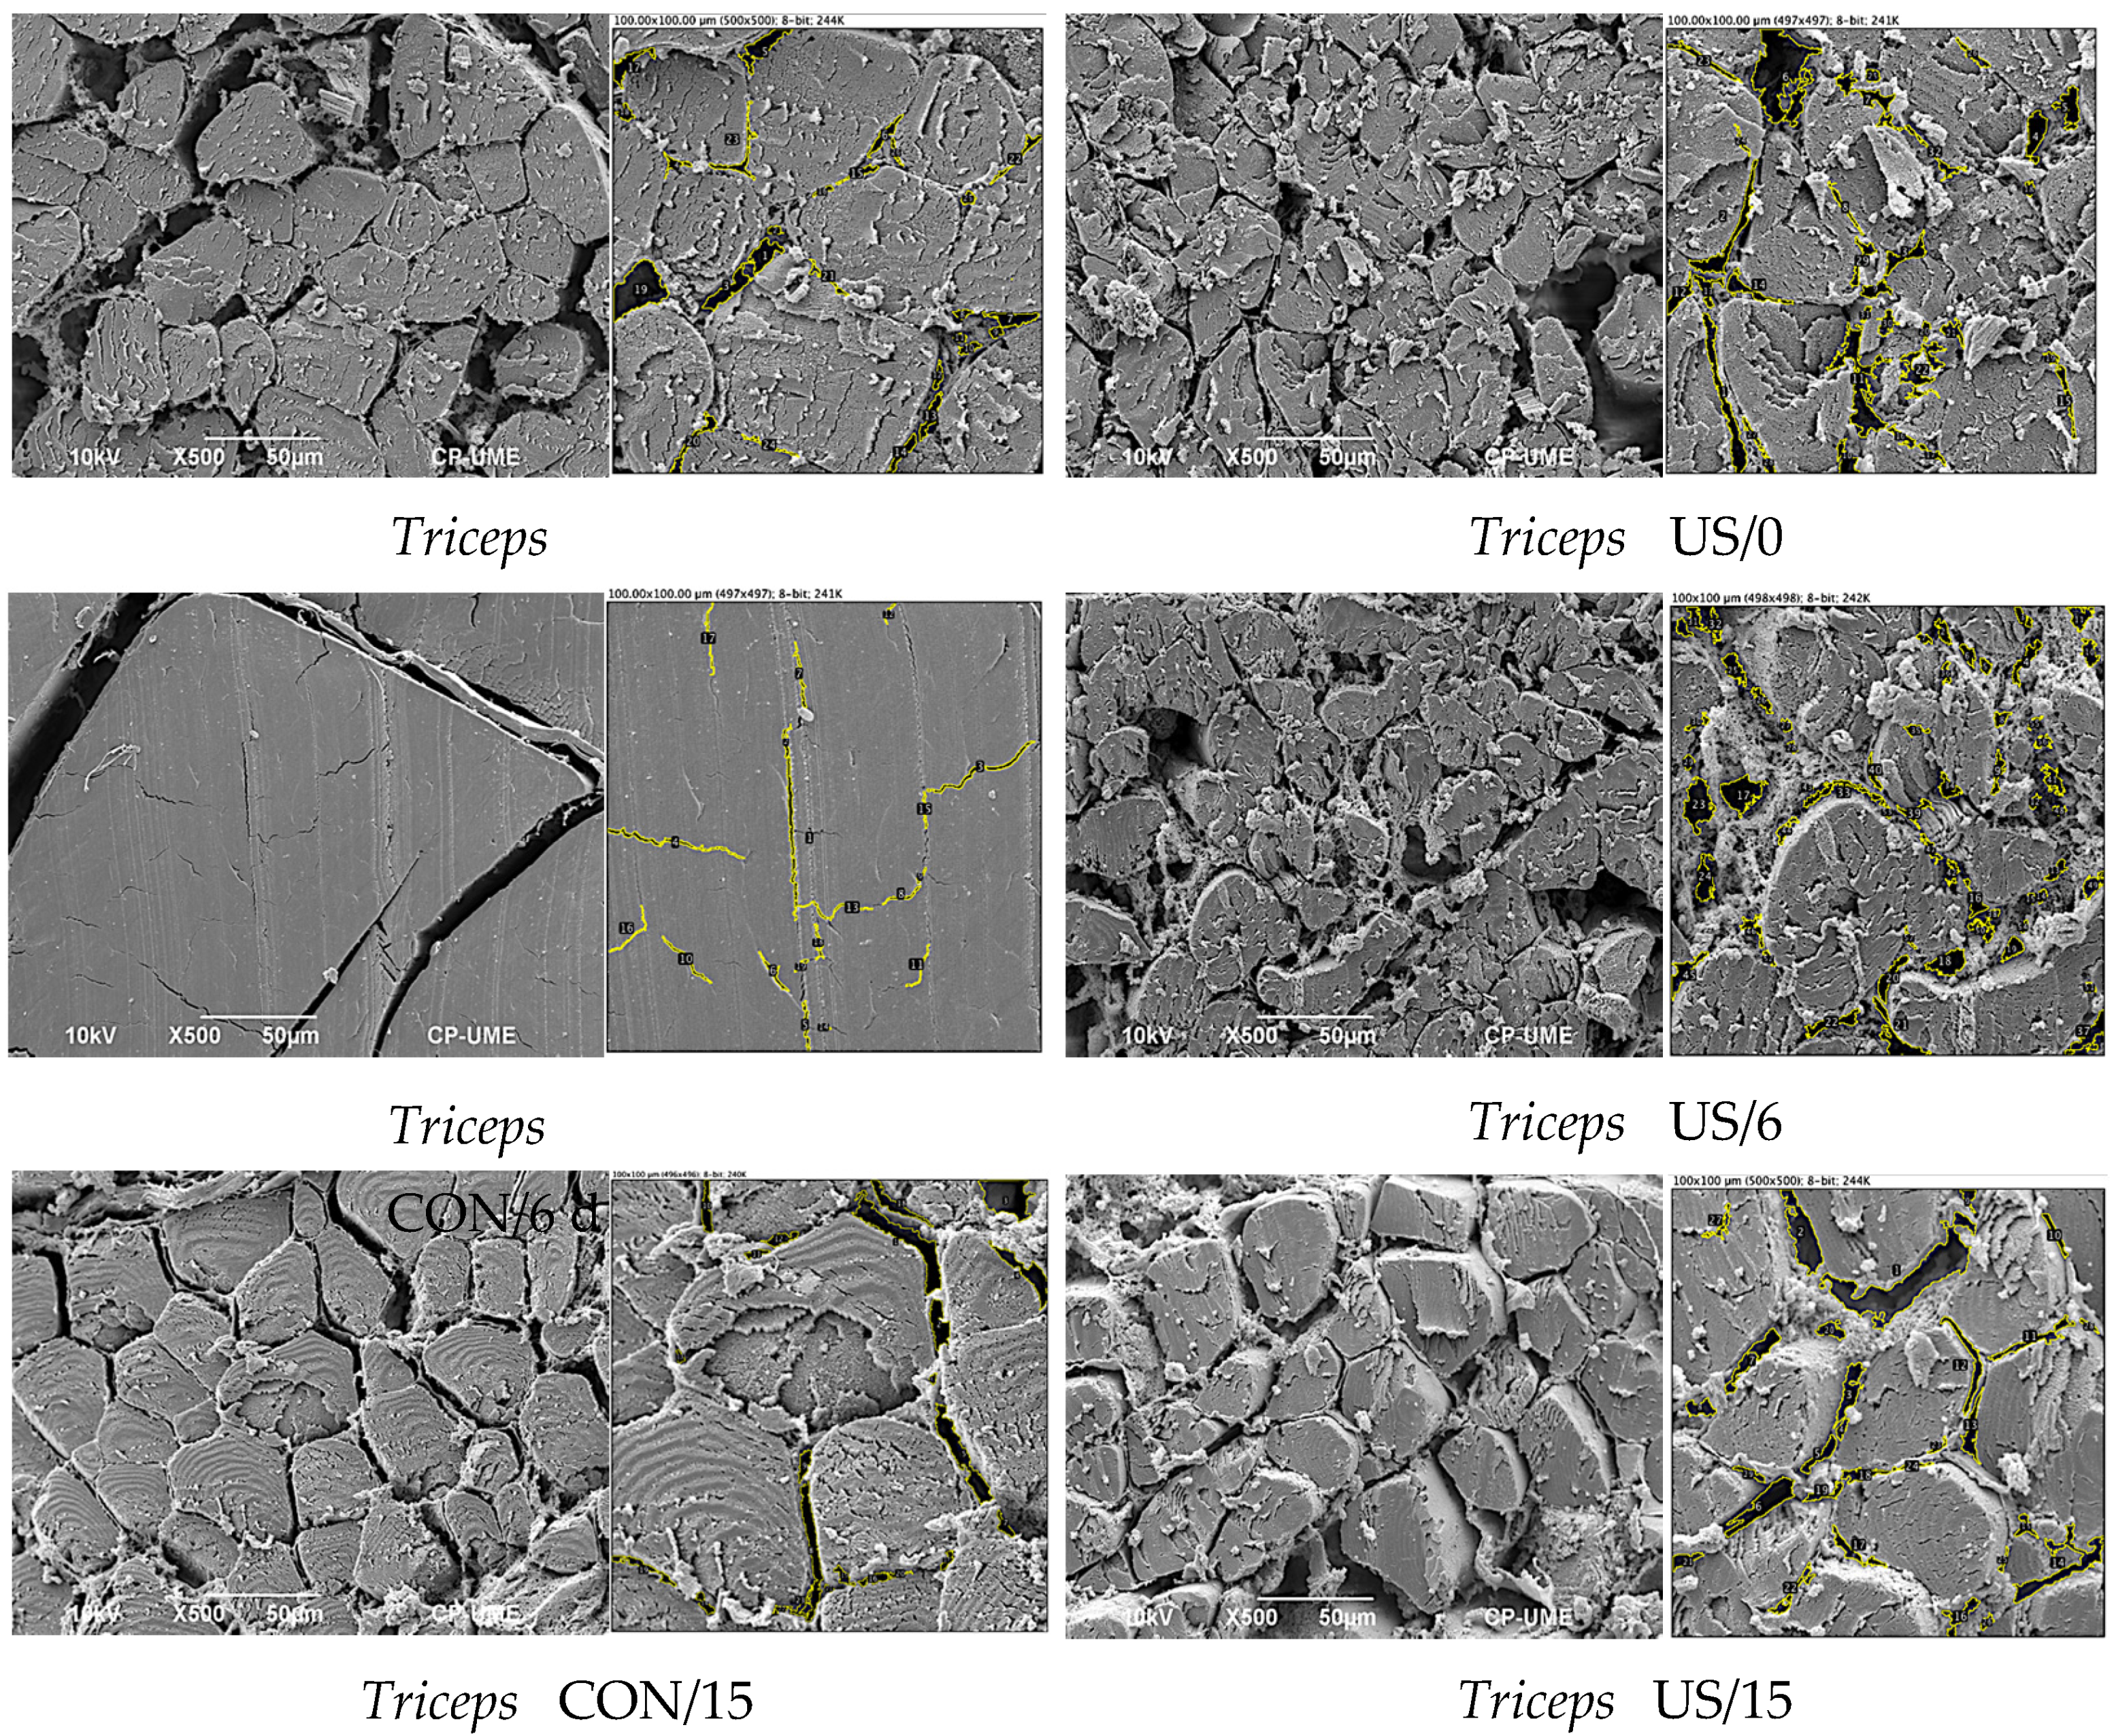
2.10. Scanning Electron Microscopy (SEM)
2.11. Statistical Analysis
3. Results and Discussion
3.1. Colour
3.2. pH
3.3. Drip Loss
3.4. Water-Holding Capacity
3.5. Shear Force
3.6. Collagen
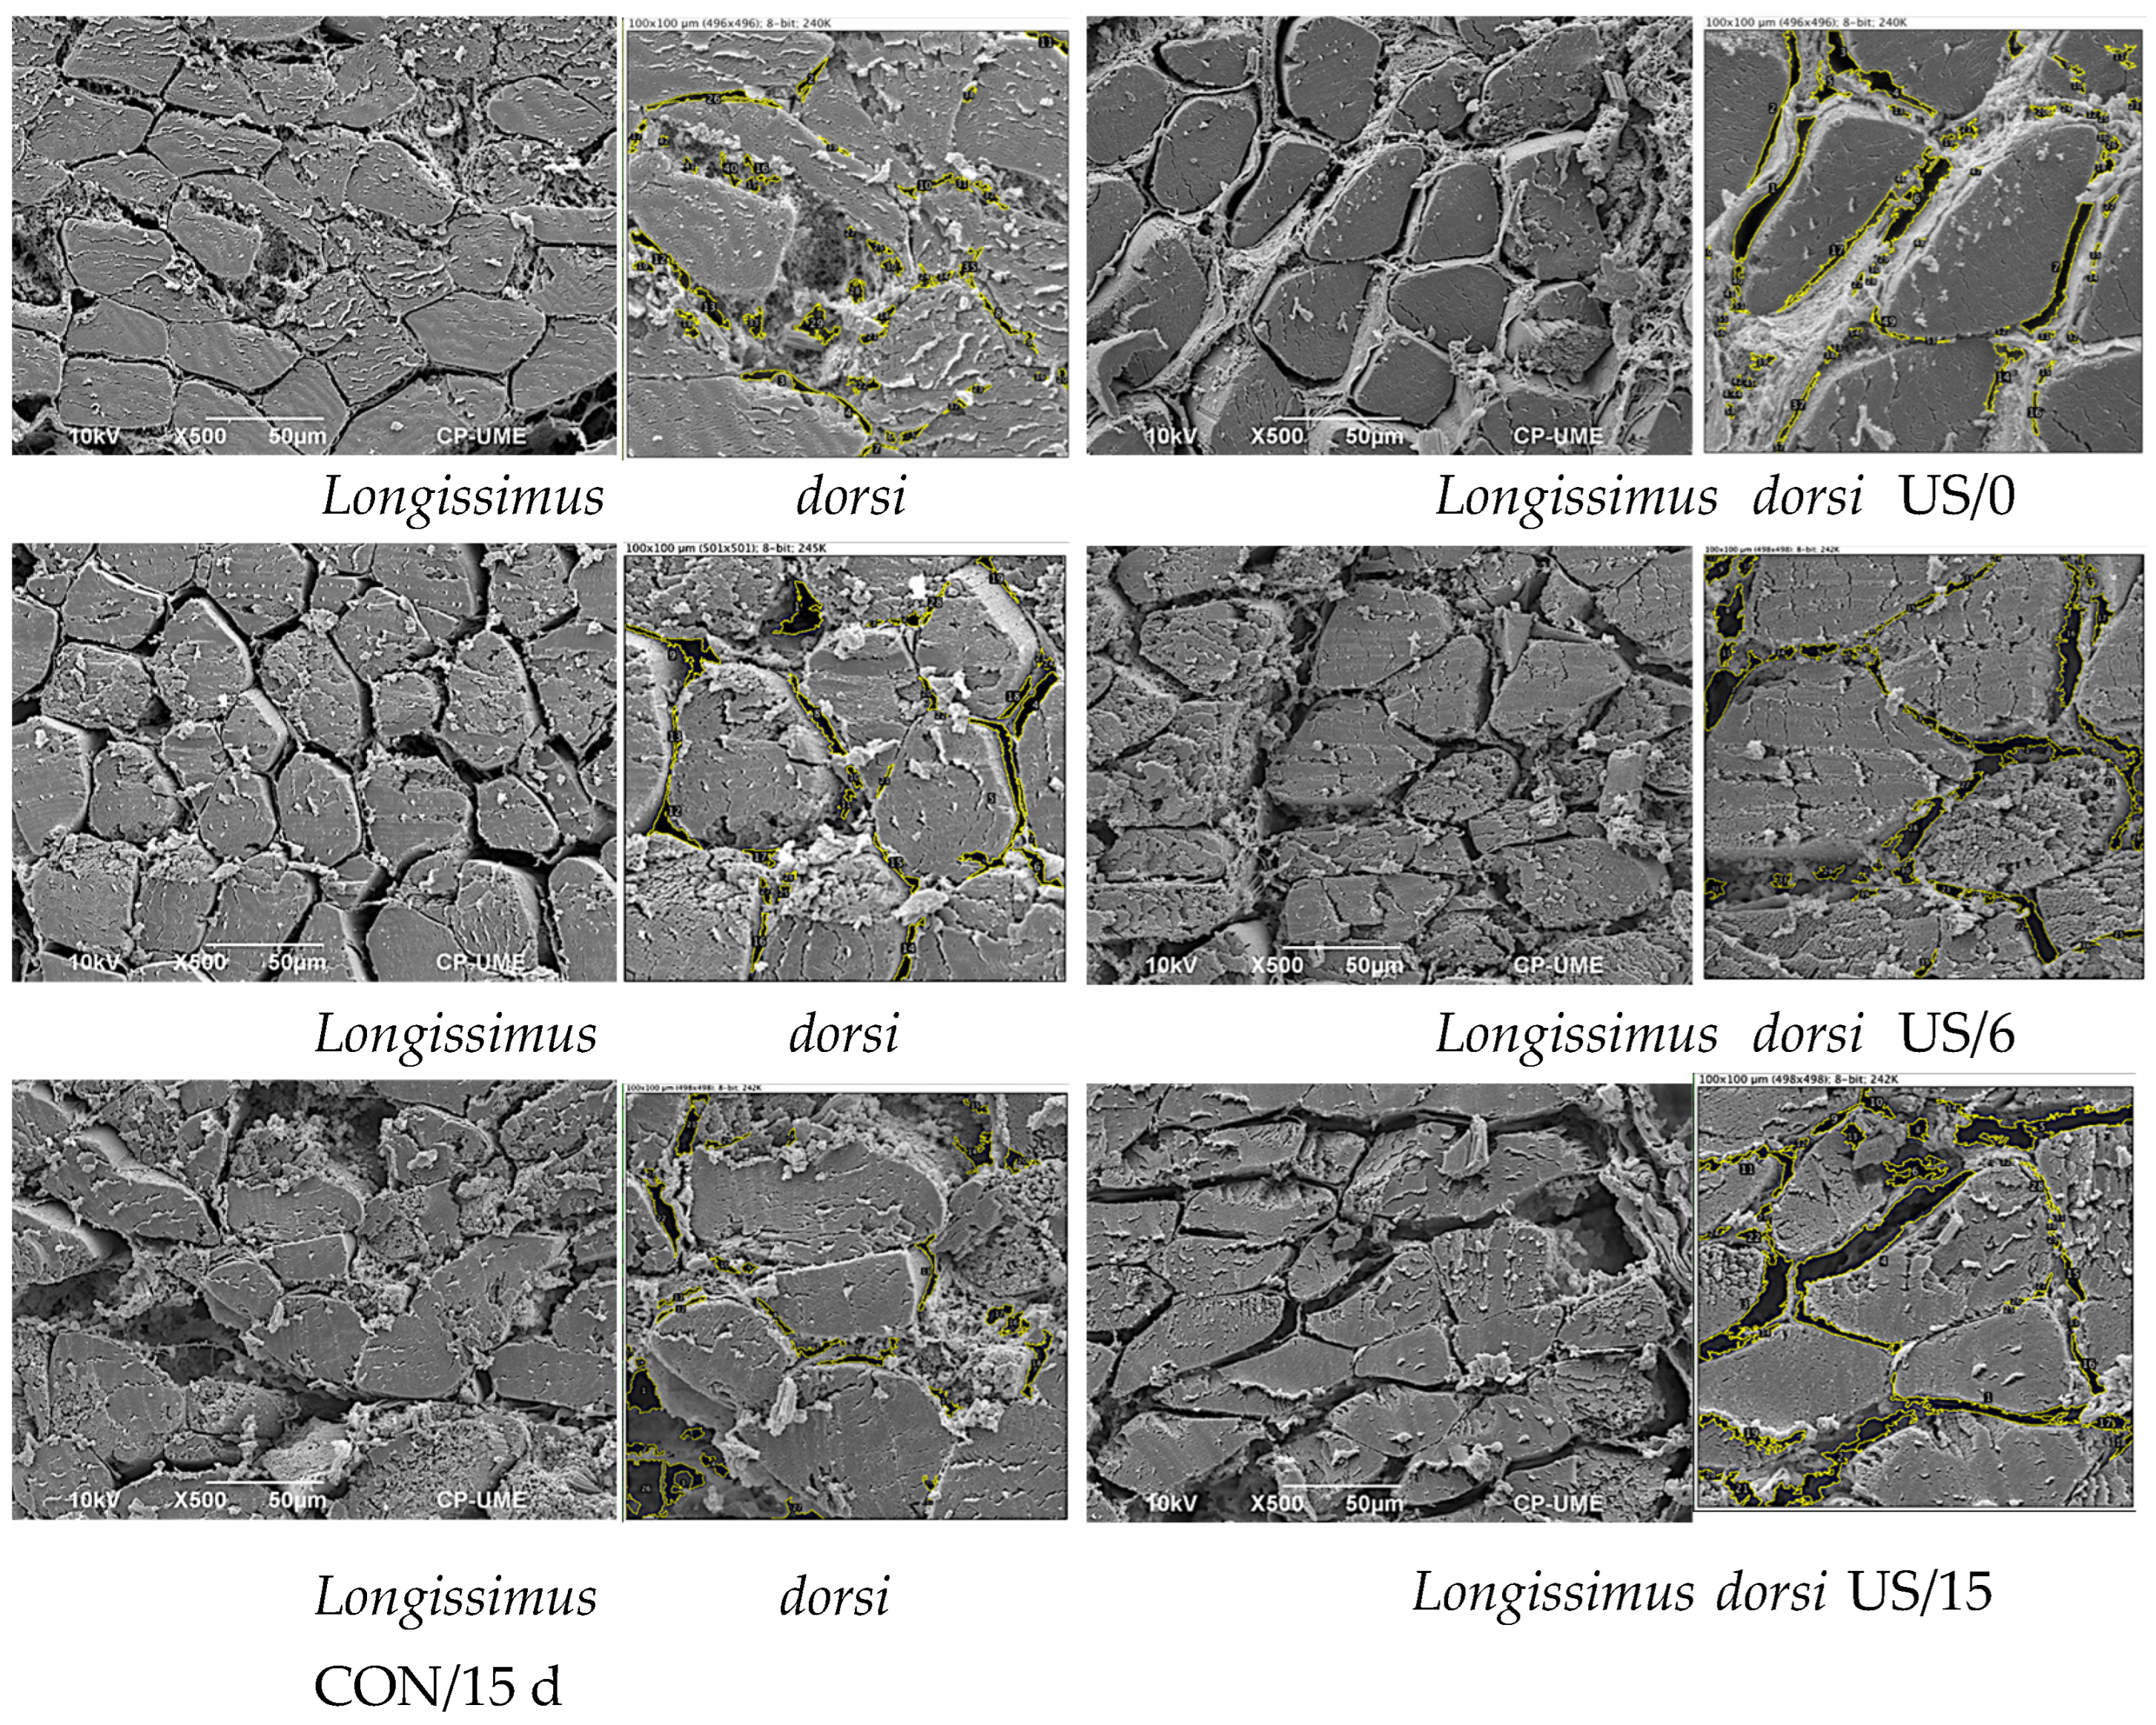
3.7. Microstructure
4. Conclusions
Author Contributions
Funding
Institutional Review Board Statement
Informed Consent Statement
Conflicts of Interest
References
- FAO. The Future of Food and Agriculture–Trends and Challenges; FAO: Rome, Italy, 2017; Available online: http://www.fao.or/3/i6583e/i6583e.pdf (accessed on 19 July 2021).
- Petrescu, D.C.; Vermeir, I.; Petrescu-Mag, R.M. Consumer understanding of food quality, healthiness, and environmental impact: A cross-national perspective. Int. J. Environ. Res. Public Health 2020, 17, 169. [Google Scholar] [CrossRef]
- Turantaş, F.; Kılıç, G.B.; Kılıç, B. Ultrasound in the meat industry: General applications and decontamination efficiency. Int. J. Food Microbiol. 2015, 198, 59–69. [Google Scholar] [CrossRef]
- Terefe, N.S.; Sikes, A.L.; Juliano, P. Ultrasound for structural modification of food products. In Innovative Food Processing Technologies: Extraction, Separation, Component Modification and Process Intensification; Knoerzer, K., Juliano, P., Smithers, G.W., Eds.; Woodhead Publishing: Cambridge, UK, 2016; pp. 209–230. [Google Scholar]
- Leong, T.; Ashokkumar, M.; Kentish, S. The fundamentals of power ultrasound-a review. Acoust. Aust. 2011, 39, 43–52. Available online: https://hdl.handle.net/11343/123494 (accessed on 25 March 2021).
- Gonzalez-Gonzalez, L.; Alarcon-Rojo, A.D.; Carrillo-Lopez, L.M.; Garcia-Galicia, I.A.; Huerta-Jimenez, M.; Paniwnyk, L. Does ultrasound equally improve the quality of beef? An insight into longissimus lumborum, infraspinatus and cleidooccipitalis. Meat Sci. 2020, 160, 107963. [Google Scholar] [CrossRef]
- Peña-Gonzalez, E.; Alarcon-Rojo, A.D.; Garcia-Galicia, I.; Carrillo-Lopez, L.; Huerta-Jimenez, M. Ultrasound as a potential process to tenderize beef: Sensory and technological parameters. Ultrason. Sonochem. 2019, 53, 134–141. [Google Scholar] [CrossRef]
- Biscarini, F.; Nicolazzi, E.L.; Stella, A.; Boettcher, P.J.; Gandini, G. Challenges and opportunities in genetic improvement of local livestock breeds. Front. Genet. 2015, 6, 33. [Google Scholar] [CrossRef]
- Joost, S.; Bruford, M.W. Editorial: Advances in Farm Animal Genomic Resources. Front. Genet. 2015, 6, 333. [Google Scholar] [CrossRef]
- Coutinho, P.; Simões, M.; Pereira, C.; Paiva, T. Sustainable local exploitation and innovation on meat products based on the autochthonous bovine breed jarmelista. Sustainability 2021, 13, 2515. [Google Scholar] [CrossRef]
- Horcada-Ibáñez, A.; Polvillo-Polo, O.; Lafuente-García, A.; González-Redondo, P.; Molina-Alcalá, A.; Luque-Moya, A. Beef quality of native pajuna breed calves in two production systems. Agrociencia 2016, 50, 167–182. [Google Scholar]
- Avilez, J.P.; Nahed, J.; Mena, Y.; Grande, D.; Ruiz, F.A.; Camúñez, J.A.; Meyer, J.; Castel, J.M. Sustainability Assessment of Extensive Cattle and Sheep Production Systems in Southern Chile. Chil. J. Agric. Anim. Sci. 2021, 37, 228–243. [Google Scholar] [CrossRef]
- Anderson, D.M.; Estell, R.E.; Gonzalez, A.L.; Cibils, A.F.; Torell, L.A. Criollo cattle: Heritage genetics for arid landscapes. Rangelands 2015, 37, 62–67. [Google Scholar] [CrossRef]
- Armstrong, E.; Rodriguez Almeida, F.A.; McIntosh, M.M.; Poli, M.; Cibils, A.F.; Martínez-Quintana, J.A.; Félix-Portillo, M.; Estell, R.E. Genetic and productive background of Criollo cattle in Argentina, Mexico, Uruguay and the United States. J. Arid Environ. 2022, 200, 104722. [Google Scholar] [CrossRef]
- Spiegal, S.; Cibils, A.F.; Bestelmeyer, B.T.; Steiner, J.L.; Estell, R.E.; Archer, D.W.; Auvermann, B.W.; Bestelmeyer, S.V.; Boucheron, L.E.; Cao, H.; et al. Beef Production in the Southwestern United States: Strategies Toward Sustainability. Front. Sustain. Food Syst. 2020, 4, 114. [Google Scholar] [CrossRef]
- Cheung, R.; McMahon, P. Back to Grass: The Market Potential for US Grassfed Beef; CONCORDIA; Stone Barns Center for Food and Agriculture: New York, NY, USA, 2017; Available online: https://www.concordia.net/events/back-to-grass/ (accessed on 19 July 2021).
- National Academies of Sciences, Engineering, and Medicine. Nutrient Requirements of Beef Cattle, 8th ed.; The National Academies Press: Washington, DC, USA, 2016. [Google Scholar] [CrossRef]
- Norma Oficial Mexicana NOM-033-SAG/ZOO-2014: Métodos Para dar Muerte a los Animales Domésticos y Silvestres. Available online: https://www.dof.gob.mx/nota_detalle.php?codigo=5405210&fecha=26/08/2015 (accessed on 30 September 2021).
- Moon, S.S.; Seong, P.N.; Jeong, J.Y. Evaluation of meat color and physiochemical characteristics in forequarter muscles of Holstein steers. Korean J. Food Sci. Anim. Resour. 2015, 35, 646. [Google Scholar] [CrossRef][Green Version]
- Honikel, K.O.; Hamm, R. Measurement of water-holding capacity and juiciness. In Quality Attributes and Their Measurement in Meat, Poultry and Fish Products; Springer: Boston, MA, USA, 1994; pp. 125–161. [Google Scholar]
- Grau, R.; Hamm, R. Eine einfache Methode zur Bestimmung der Wasserbildung im Muskel. Naturwissenschaften 1953, 40, 29–31. [Google Scholar] [CrossRef]
- Tsai, T.C.; Ockerman, H.W. Water binding measurement of meat. J. Food Sci. 1981, 46, 697–701. [Google Scholar] [CrossRef]
- Research Guidelines for Cookery, Sensory Evaluation, and Instrumental Tenderness Measurements of Meat. Available online: https://meatscience.org/docs/default-source/publications-resources/amsa-sensory-and-tenderness-evaluation-guidelines/research-guide/amsa-research-guidelines-for-cookery-and-evaluation-1-02.pdf?sfvrsn=2 (accessed on 19 July 2021).
- ISO 3496:1994; Determination of Hydroxyproline Content (Reference Method). International Organization for Standardization: Geneva, Switzerland, 1994.
- Molee, W.; Khosinklang, W.; Tongduang, P.; Thumanu, K.; Yongsawatdigul, J.; Molee, A. Biomolecules, fatty acids, meat quality, and growth performance of slow-growing chickens in an organic raising system. Animals 2022, 12, 570. [Google Scholar] [CrossRef]
- SAS Institute. SAS/STAT User’s Guide; SAS Inst. Inc.: Cary, NC, USA, 2004. [Google Scholar]
- Neethling, N.E.; Suman, S.P.; Sigge, G.O.; Hoffman, L.C.; Hunt, M.C. Exogenous and Endogenous Factors Influencing Color of Fresh Meat from Ungulates. Meat Muscle Biol. 2017, 1. [Google Scholar] [CrossRef]
- Hughes, J.M.; Clarke, F.M.; Purslow, P.P.; Warner, R.D. Meat color is determined not only by chromatic heme pigments but also by the physical structure and achromatic light scattering properties of the muscle. Compr. Rev. Food Sci. Food Saf. 2020, 19, 44–63. [Google Scholar] [CrossRef]
- Orellana, C.; Peña, F.; García, A.; Perea, J.; Martos, J.; Domenech, V.; Acero, R. Carcass characteristics, fatty acid composition, and meat quality of Criollo Argentino and Braford steers raised on forage in a semi-tropical region of Argentina. Meat Sci. 2009, 81, 57–64. [Google Scholar] [CrossRef]
- Sañudo, C.; Albertí, P.; Campo, M.M.; Olleta, J.L.; Panea, B. Instrumental quality of beef meat from seven Spanish breeds. Arch. Zootec. 1998, 47, 397–402. [Google Scholar]
- CIE. Colorimetry, 2nd ed.; CIE Publications: Vienna, Austria, 1986. [Google Scholar]
- Lawrie, R.A.; Ledward, D. Lawrie’s Meat Science, 7th ed.; Woodhead Publishing: Cambridge, UK, 2006. [Google Scholar]
- Gallinger, M.M.; Garriz, C.; Mezzadra, C. Calidad de la carne de novillos Criollo Argentino, A. Angus y sus cruzas recíprocas. Rev. Arg. Prod. Anim. 1992, 12, 125–126. [Google Scholar]
- Chang, H.J.; Wang, Q.; Tang, C.H.; Zhou, G.H. Effects of ultrasound treatment on connective tissue collagen and meat quality of beef semitendinosus muscle. J. Food Qual. 2015, 38, 256–267. [Google Scholar] [CrossRef]
- Van Wijngaarden, L. Mechanics of collapsing cavitation bubbles. Ultrason Sonochem. 2016, 29, 524–527. [Google Scholar] [CrossRef]
- Barekat, S.; Soltanizadeh, N. Effects of ultrasound on microstructure and enzyme penetration in beef longissimus lumborum muscle. Food Bioproc. Tech. 2018, 11, 680–693. [Google Scholar] [CrossRef]
- Fallavena, L.P.; Marczak, L.D.F.; Mercali, G.D. Ultrasound application for quality improvement of beef Biceps femoris physicochemical characteristics. LWT Food Sci Technol. 2020, 118, 108817. [Google Scholar] [CrossRef]
- Kaur, L.; Hui, S.X.; Morton, J.D.; Kaur, R.; Chian, F.M.; Boland, M. Endogenous Proteolytic Systems and Meat Tenderness: Influence of Post-Mortem Storage and Processing. Food Sci. Anim. Resour. 2021, 41, 589–607. [Google Scholar] [CrossRef]
- Bhat, Z.F.; Morton, J.D.; Mason, S.L.; Bekhit, A.E.D.A. Role of Calpain System in Meat Tenderness: A Review. Food Sci. Hum. Wellness 2018, 7, 196–204. [Google Scholar] [CrossRef]
- Gagaoua, M.; Monteils, V.; Couvreur, S.; Picard, B. Beef Tenderness Prediction by a Combination of Statistical Methods: Chemometrics and Supervised Learning to Manage Integrative Farm-To-Meat Continuum Data. Foods 2019, 8, 274. [Google Scholar] [CrossRef]
- Li, G.; Wan, Y.; Song, X.; Wang, Y.; Zan, L.; Zhu, J. Effects of various processing methods on the ultrastructure of tendon collagen fibrils from Qinchuan beef cattle observed with atomic force microscopy. J. Food Qual. 2018. [Google Scholar] [CrossRef]
- Nishimura, T.; Liu, A.; Hattori, A.; Takahashi, K. Changes in mechanical strength of intramuscular connective tissue during postmortem aging of beef. J. Anim. Sci. 1998, 76, 528–532. [Google Scholar] [CrossRef] [PubMed]
- Carrillo-Lopez, L.M.; Huerta-Jimenez, M.; Garcia-Galicia, I.A.; Alarcon-Rojo, A.D. Bacterial control and structural and physicochemical modification of bovine Longissimus dorsi by ultrasound. Ultrason Sonochem. 2019, 58, 104608. [Google Scholar] [CrossRef] [PubMed]
- Li, K.; Kang, Z.-L.; Zhao, Y.-Y.; Xu, X.-L.; Zhou, G.-H. Use of high-intensity ultrasound to improve functional properties of batter suspensions prepared from pse-like chicken breast meat. Food Bioprocess Technol. 2014, 7, 3466–3477. [Google Scholar] [CrossRef]
- Zhang, W.; Xiao, S.; Ahn, D.U. Protein oxidation: Basic principles and implications for meat quality. Crit. Rev. Food Sci. Nutr. 2013, 53, 1191–1201. [Google Scholar] [CrossRef]


| Variable 1 | Factor/Interaction | ||||||
|---|---|---|---|---|---|---|---|
| HIU | Storage (S) | Muscle (M) | HIU × M | HIU × S | M × S | HIU × M × S | |
| pH | 0.1991 | <0.001 | <0.0001 | 0.2505 | 0.0352 | 0.0015 | 0.4041 |
| L* | 0.0030 | 0.7416 | 0.1007 | 0.2187 | 0.4160 | <0.0001 | 0.0667 |
| a* | 0.6512 | 0.0015 | 0.5546 | 0.2366 | 0.0828 | <0.0001 | 0.0014 |
| b* | 0.0227 | 0.0475 | <0.001 | 0.9913 | 0.0785 | 0.1346 | 0.3168 |
| C* | 0.7564 | 0.0031 | 0.3369 | 0.3834 | 0.1345 | 0.0002 | 0.0068 |
| HUE | 0.0139 | <0.001 | <0.001 | 0.1620 | 0.0073 | <0.001 | 0.0021 |
| ΔE | 0.0801 | <0.001 | 0.5612 | 0.3063 | <0.0001 | 0.9844 | 0.7458 |
| DL | 0.996 | 0.214 | 0.6719 | 0.2178 | 0.1039 | 0.0155 | 0.4338 |
| WHC | 0.0539 | 0.0580 | 0.0030 | 0.2117 | 0.0056 | 0.0247 | 0.1970 |
| SF | 0.0096 | <0.001 | <0.001 | 0.8602 | 0.0005 | 0.0023 | 0.0011 |
| Fsoluble | 0.1675 | <0.001 | <0.001 | 0.2206 | 0.2666 | <0.001 | 0.4050 |
| Finsoluble | 0.1690 | <0.001 | <0.001 | 0.2191 | 0.2653 | <0.001 | 0.4073 |
| Total collagen | 0.1680 | <0.001 | <0.001 | 0.2182 | 0.2643 | <0.001 | 0.4080 |
| CIE L*a*b* 1 | ||||||
|---|---|---|---|---|---|---|
| Factor | L* | a* | b* | C* | HUE | ΔE |
| HIU (min) | ||||||
| 0 | 31.67 ± 0.26 b | 13.90 ± 0.29 a | 9.12 ± 0.14 b | 16.66 ± 0.30 a | 33.80 ± 5.30 b | 0.93 ± 0.024 a |
| 20 | 32.81 ± 0.26 a | 13.72 ± 0.29 a | 9.60 ± 0.14 a | 16.79 ± 0.30 a | 35.30 ± 4.67 a | 0.87 ± 0.024 a |
| Muscle (M) | ||||||
| T. brachii | 32.62 ± 0.26 a | 13.93 ± 0.29 a | 8.82 ± 0.14 b | 16.52 ± 0.30 a | 32.73 ± 3.62 b | 0.89 ± 0.024 a |
| L. dorsi | 31.93 ± 0.26 a | 13.69 ± 0.29 a | 9.90 ± 0.14 a | 16.93 ± 0.30 a | 36.37 ± 5.58 a | 0.91 ± 0.024 a |
| Storage (d) | ||||||
| 0 | 32.62 ± 0.45 a | 14.71 ± 0.49 ab | 9.20 ± 0.25 ab | 17.38 ± 0.52 a | 34.47 ± 3.64 c | 0.00 ± 0.04 f |
| 3 | 32.58 ± 0.45 a | 12.66 ± 0.49 bc | 9.54 ± 0.25 ab | 15.98 ± 0.52 ab | 37.83 ± 7.42 a | 0.52 ± 0.04 e |
| 6 | 31.74 ± 0.45 a | 13.89 ± 0.49 abc | 9.40 ± 0.25 ab | 16.81 ± 0.52 ab | 34.22 ± 4.00 bc | 1.10 ± 0.04 c |
| 9 | 32.29 ± 0.45 a | 12.44 ± 0.49 c | 8.77 ± 0.25 b | 15.13 ± 0.52 b | 35.55 ± 3.48 ab | 0.76 ± 0.04 d |
| 12 | 31.93 ± 0.45 a | 14.06 ± 0.49 abc | 9.20 ± 0.25 ab | 16.90 ± 0.52 ab | 33.46 ± 3.95 bc | 1.36 ± 0.04 b |
| 15 | 32.11 ± 0.45 a | 15.10 ± 0.49 a | 9.20 ± 0.25 a | 18.16 ± 0.52 a | 33.78 ± 5.54 bc | 1.68 ± 0.04 a |
| HIU * storage | ||||||
| 0 min | ||||||
| 0 d | 32.56 ± 0.63 a | 15.19 ± 0.70 a | 9.30 ± 0.35 a | 17.87 ± 0.74 a | 32.23 ± 0.14 | 0.00 ± 0.06 g |
| 3 d | 32.04 ± 0.63 a | 12.38 ± 0.70 a | 9.38 ± 0.35 a | 15.65 ± 0.74 a | 37.63 ± 0.07 | 0.61 ± 0.06 e |
| 6 d | 31.01 ± 0.63 a | 14.43 ± 0.70 a | 8.62 ± 0.35 b | 16.84 ± 0.74 a | 31.18 ± 0.14 | 0.86 ± 0.06 d |
| 9 d | 31.79 ± 0.63 a | 12.92 ± 0.70 a | 8.61 ± 0.35 b | 15.31 ± 0.74 a | 33.89 ± 0.11 | 0.77 ± 0.06 de |
| 12 d | 30.76 ± 0.63 a | 12.84 ± 0.70 a | 8.76 ± 0.35 a | 15.58 ± 0.74 a | 34.29 ± 0.05 | 1.39 ± 0.06 c |
| 15 d | 31.87 ± 0.63 a | 15.63 ± 0.70 a | 10.07 ± 0.35 a | 18.73 ± 0.74 a | 33.58 ± 0.04 | 1.59 ± 0.06 b |
| 20 min | ||||||
| 0 d | 32.67 ± 0.63 a | 14.23 ± 0.70 a | 9.11 ± 0.35 a | 16.91 ± 0.74 a | 32.71 ± 0.14 | 0.00 ± 0.06 g |
| 3 d | 33.12 ± 0.63 a | 12.94 ± 0.70 a | 9.69 ± 0.35 a | 16.31 ± 0.74 a | 38.04 ± 0.13 | 0.42 ± 0.06 f |
| 6 d | 32.47 ± 0.63 a | 13.34 ± 0.70 a | 10.17 ± 0.35 a | 16.79 ± 0.74 a | 37.27 ± 0.17 | 1.34 ± 0.06 c |
| 9 d | 32.80 ± 0.63 a | 11.95 ± 0.70 b | 8.93 ± 0.35 a | 14.95 ± 0.74 a | 37.21 ± 0.06 | 0.74 ± 0.06 e |
| 12 d | 33.46 ± 0.63 a | 15.28 ± 0.70 a | 9.88 ± 0.35 a | 18.22 ± 0.74 a | 32.64 ± 0.08 | 1.33 ± 0.06 c |
| 15 d | 32.34 ± 0.63 a | 14.57 ± 0.70 a | 9.81 ± 0.35 a | 17.59 ± 0.74 a | 33.87 ± 0.05 | 1.77 ± 0.06 a |
| M * storage | ||||||
| L. dorsi | ||||||
| 0 d | 31.21 ± 0.63 b | 16.13 ± 0.70 a | 9.58 ± 0.35 a | 18.80 ± 0.74 a | 31.16 ± 3.84 | 0.00 ± 0.06 a |
| 3 d | 32.72 ± 0.63 ab | 10.2 ± 0.70 d | 9.99 ± 0.35 a | 14.30 ± 0.74 c | 44.45 ± 3.50 | 0.51 ± 0.06 a |
| 6 d | 30.74 ± 0.63 b | 14.4 ± 0.70 b | 9.71 ± 0.35 a | 17.50 ± 0.74 ab | 34.07 ± 5.39 | 1.10 ± 0.06 a |
| 9 d | 30.7 ± 0.63 b | 13.84 ± 0.70 bc | 9.07 ± 0.35 a | 16.33 ± 0.74 ab | 33.59 ± 3.10 | 0.78 ± 0.06 a |
| 12 d | 33.34 ± 0.63 a | 14.17 ± 0.70 b | 10.49 ± 0.35 a | 17.65 ± 0.74 a | 36.60 ± 3.20 | 1.36 ± 0.06 a |
| 15 d | 32.84 ± 0.63 a | 13.33 ± 0.70 c | 10.54 ± 0.35 a | 17.02 ± 0.74 a | 38.38 ± 3.23 | 1.71 ± 0.06 a |
| T. brachii | ||||||
| 0 d | 34.02 ± 0.63 a | 13.2 ± 0.70 c | 8.83 ± 0.35 a | 15.97 ± 0.74 b | 33.78 ± 3.20 | 0.00 ± 0.06 a |
| 3 d | 32.44 ± 0.63 ab | 15.13 ± 0.70 ab | 9.09 ± 0.35 a | 17.65 ± 0.74 a | 31.22 ± 1.97 | 0.51 ± 0.06 a |
| 6 d | 32.75 ± 0.63 a | 13.31 ± 0.70 c | 9.09 ± 0.35 a | 16.13 ± 0.74 b | 34.37 ± 2.48 | 1.10 ± 0.06 a |
| 9 d | 33.83 ± 0.63 a | 11.04 ± 0.70 d | 8.47 ± 0.35 a | 13.92 ± 0.74 c | 37.51 ± 2.78 | 0.73 ± 0.06 a |
| 12 d | 30.87 ± 0.63 b | 13.95 ± 0.70 b | 8.15 ± 0.35 a | 16.15 ± 0.74 b | 30.33 ± 0.77 | 1.36 ± 0.06 a |
| 15 d | 31.37 ± 0.63 b | 16.87 ± 0.70 a | 9.34 ± 0.35 a | 19.30 ± 0.74 a | 29.17 ± 2.50 | 1.65 ± 0.06 a |
| Physicochemical Variables | ||||
|---|---|---|---|---|
| Variable 1 | pH | DL | WHC | SF |
| HIU (min) | ||||
| 0 | 5.33 ± 0.004 a | 1.79 ± 0.13 a | 69.13 ± 0.57 a | 3.75 ± 0.08 a |
| 20 | 5.35 ± 0.004 a | 1.78 ± 0.13 a | 67.54 ± 0.57 a | 3.46 ± 0.08 b |
| Muscle (M) | ||||
| Triceps brachii | 5.41 ± 0.004 a | 1.83 ± 0.13 a | 67.08 ± 0.57 b | 4.15 ± 0.08 a |
| L. dorsi | 5.27 ± 0.004 b | 1.75 ± 0.13 a | 69.59 ± 0.57 a | 3.07 ± 0.08 b |
| Storage (d) | ||||
| 0 | 5.34 ± 0.004 b | 1.71 ± 0.23 a | 70.83 ± 0.98 a | 2.49 ± 0.13 b |
| 3 | 5.35 ± 0.004 ab | 1.92 ± 0.23 a | 67.33 ± 0.98 ab | 3.66 ± 0.13 a |
| 6 | 5.28 ± 0.004 b | 1.68 ± 0.23 a | 67.87 ± 0.98 ab | 3.57 ± 0.13 a |
| 9 | 5.32 ± 0.004 b | 2.28 ± 0.23 a | 66.64 ± 0.98 b | 3.95 ± 0.13 a |
| 12 | 5.33 ± 0.004 b | 1.47 ± 0.23 a | 69.22 ± 0.98 ab | 4.06 ± 0.13 a |
| 15 | 5.43 ± 0.004 a | 1.68 ± 0.23 a | 68.12 ± 0.98 ab | 3.92 ± 0.13 a |
| HIU * storage | ||||
| 0 min | ||||
| 0 d | 5.26 ± 0.03 c | 1.68 ± 0.32 a | 72.50 ± 1.39 a | 2.31 ± 0.18 c |
| 3 d | 5.35 ± 0.03 b | 1.50 ± 0.32 a | 67.15 ± 1.39 b | 4.11 ± 0.18 a |
| 6 d | 5.28 ± 0.03 c | 1.61 ± 0.32 a | 66.31 ± 1.39 c | 3.49 ± 0.18 b |
| 9 d | 5.32 ± 0.03 bc | 2.85 ± 0.32 a | 69.43 ± 1.39 ab | 4.38 ± 0.18 a |
| 12 d | 5.34 ± 0.03 bc | 1.45 ± 0.32 a | 68.38 ± 1.39 b | 4.45 ± 0.18 a |
| 15 d | 5.43 ± 0.03 a | 1.64 ± 0.32 a | 71.00 ± 1.39 a | 3.77 ± 0.18 b |
| 20 min | ||||
| 0 d | 5.41 ± 0.03 a | 1.74 ± 0.32 a | 69.16 ± 1.39 ab | 2.66 ± 0.18 c |
| 3 d | 5.35 ± 0.03 b | 2.34 ± 0.32 a | 67.51 ± 1.39 b | 3.22 ± 0.18 b |
| 6 d | 5.28 ± 0.03 c | 1.75 ± 0.32 a | 69.44 ± 1.39 ab | 3.64 ± 0.18 b |
| 9 d | 5.32 ± 0.03 bc | 1.70 ± 0.32 a | 63.84 ± 1.39 d | 3.52 ± 0.18 b |
| 12 d | 5.32 ± 0.03 bc | 1.48 ± 0.32 a | 70.05 ± 1.39 a | 3.67 ± 0.18 b |
| 15 d | 5.43 ± 0.03 a | 1.72 ± 0.32 a | 65.26 ± 1.39 | 4.07 ± 0.18 a |
| M * storage | ||||
| L. dorsi | ||||
| 0 d | 5.24 ± 0.03 b | 1.52 ± 0.32 b | 74.91 ± 1.39 a | 2.31 ± 0.18 d |
| 3 d | 5.27 ± 0.03 b | 2.47 ± 0.32 a | 68.30 ± 1.39 c | 2.92 ± 0.18 cd |
| 6 d | 5.14 ± 0.03 c | 1.52 ± 0.32 b | 67.48 ± 1.39 c | 3.06 ± 0.18 c |
| 9 d | 5.27 ± 0.03 b | 1.62 ± 0.32 b | 68.70 ± 1.39 c | 3.63 ± 0.18 c |
| 12 d | 5.30 ± 0.03 b | 1.54 ± 0.32 b | 70.29 ± 1.39 b | 3.13 ± 0.18 c |
| 15 d | 5.41 ± 0.03 a | 1.82 ± 0.32 a | 67.86 ± 1.39 c | 3.34 ± 0.18 c |
| T. brachii | ||||
| 0 d | 5.43 ± 0.03 a | 1.90 ± 0.32 a | 66.75 ± 1.39 c | 2.66 ± 0.18 d |
| 3 d | 5.43 ± 0.03 a | 1.37 ± 0.32 b | 66.36 ± 1.39 c | 4.40 ± 0.18 b |
| 6 d | 5.41 ± 0.03 a | 1.84 ± 0.32 a | 68.27 ± 1.39 c | 4.07 ± 0.18 b |
| 9 d | 5.37 ± 0.03 a | 2.94 ± 0.32 a | 64.58 ± 1.39 d | 4.28 ± 0.18 b |
| 12 d | 5.36 ± 0.03 b | 1.40 ± 0.32 b | 68.15 ± 1.39 c | 4.99 ± 0.18 a |
| 15 d | 5.45 ± 0.03 a | 1.53 ± 0.32 b | 68.39 ± 1.39 c | 4.50 ± 0.18 b |
| Collagen μg /mL | |||
|---|---|---|---|
| Variable | Soluble Fraction | Insoluble Fraction | Total Collagen |
| HIU (min) | |||
| 0 | 3.60 ± 0.016 a | 3.47 ± 0.015 a | 7.06 ± 0.031 a |
| 20 | 3.63 ± 0.016 a | 3.50 ± 0.015 a | 7.13 ± 0.031 a |
| Muscle type | |||
| Triceps brachii | 4.23 ± 0.016 a | 4.08 ± 0.015 a | 8.31 ± 0.031 a |
| L. dorsi | 2.99 ± 0.016 b | 2.88 ± 0.015 b | 5.88 ± 0.031 b |
| Storage (d) | |||
| 0 | 5.19± 0.028 a | 5.00 ± 0.027 a | 10.2 ± 0.054 a |
| 3 | 3.05± 0.028 e | 2.94± 0.027 e | 6.00 ± 0.054 e |
| 6 | 3.24± 0.028 d | 3.13± 0.027 d | 6.37 ± 0.054 d |
| 9 | 3.49± 0.028 c | 3.37± 0.027 c | 6.86 ± 0.054 c |
| 12 | 1.83 ± 0.028 f | 1.77± 0.027 f | 3.60 ± 0.054 f |
| 15 | 4.86 ± 0.028 b | 4.69± 0.027 b | 9.55 ± 0.054 b |
| HIU * storage | |||
| 0 min | |||
| 0 d | 5.14 ± 0.039 a | 4.96 ± 0.038 a | 10.1 ± 0.077 a |
| 3 d | 3.05 ± 0.039 a | 2.94 ± 0.038 a | 5.99 ± 0.077 a |
| 6 d | 3.26 ± 0.039 a | 3.14 ± 0.038 a | 6.41 ± 0.077 a |
| 9 d | 3.50 ± 0.039 a | 3.37 ± 0.038 a | 6.87 ± 0.077 a |
| 12 d | 1.77 ± 0.039 a | 1.71 ± 0.038 a | 3.49 ± 0.077 a |
| 15 d | 4.86 ± 0.039 a | 4.68 ± 0.038 a | 9.54 ± 0.077 a |
| 20 min | |||
| 0 d | 5.25 ± 0.039 a | 5.06 ± 0.038 a | 10.3 ± 0.077 a |
| 3 d | 3.06 ± 0.039 a | 2.95 ± 0.038 a | 6.00 ± 0.077 a |
| 6 d | 3.22 ± 0.039 a | 3.11 ± 0.038 a | 6.33 ± 0.077 a |
| 9 d | 3.48 ± 0.039 a | 3.36 ± 0.038 a | 6.84 ± 0.077 a |
| 12 d | 1.89 ± 0.039 a | 1.82 ± 0.038 a | 3.71 ± 0.077 a |
| 15 d | 4.87 ± 0.039 a | 4.69 ± 0.038 a | 9.56 ± 0.077 a |
| M * storage | |||
| L. dorsi | |||
| 0 min | |||
| 0 d | |||
| 3 d | 5.75 ± 0.039 a | 5.55 ± 0.038 a | 11.30 ± 0.077 a |
| 6 d | 2.54 ± 0.039 d | 2.45 ± 0.038 c | 4.99 ± 0.077 d |
| 9 d | 1.81 ± 0.039 d | 1.74 ± 0.038 d | 3.55 ± 0.077 d |
| 12 d | 2.69 ± 0.039 d | 2.59 ± 0.038 c | 5.28 ± 0.077 d |
| 15 d | 1.67 ± 0.039 d | 1.61 ± 0.038 d | 3.27 ± 0.077 d |
| T. brachii | 3.50 ± 0.039 c | 3.38 ± 0.038 b | 6.88 ± 0.077 c |
| 0 min | |||
| 0 d | 4.63 ± 0.039 b | 4.46 ± 0.038 b | 9.09 ± 0.077 b |
| 3 d | 3.57 ± 0.039 c | 3.44± 0.038 b | 7.01 ± 0.077 c |
| 6 d | 4.68 ± 0.039 b | 4.51 ± 0.038 b | 9.19 ± 0.077 b |
| 9 d | 2.30 ± 0.039 d | 4.14 ± 0.038 b | 8.44 ± 0.077 b |
| 12 d | 2.00 ± 0.039 d | 1.93 ± 0.038 d | 3.93 ± 0.077 d |
| 15 d | 6.22 ± 0.039 a | 6.00 ± 0.038 a | 12.22 ± 0.077 a |
Publisher’s Note: MDPI stays neutral with regard to jurisdictional claims in published maps and institutional affiliations. |
© 2022 by the authors. Licensee MDPI, Basel, Switzerland. This article is an open access article distributed under the terms and conditions of the Creative Commons Attribution (CC BY) license (https://creativecommons.org/licenses/by/4.0/).
Share and Cite
Caraveo-Suarez, R.O.; Garcia-Galicia, I.A.; Santellano-Estrada, E.; Carrillo-Lopez, L.M.; Huerta-Jimenez, M.; Morales-Rodriguez, S.; Vargas-Bello-Pérez, E.; Alarcon-Rojo, A.D. Ultrasound as a Potential Technology to Improve the Quality of Meat Produced from a Mexican Autochthonous Bovine Breed. Sustainability 2022, 14, 3886. https://doi.org/10.3390/su14073886
Caraveo-Suarez RO, Garcia-Galicia IA, Santellano-Estrada E, Carrillo-Lopez LM, Huerta-Jimenez M, Morales-Rodriguez S, Vargas-Bello-Pérez E, Alarcon-Rojo AD. Ultrasound as a Potential Technology to Improve the Quality of Meat Produced from a Mexican Autochthonous Bovine Breed. Sustainability. 2022; 14(7):3886. https://doi.org/10.3390/su14073886
Chicago/Turabian StyleCaraveo-Suarez, Reyes Omaro, Iván Adrián Garcia-Galicia, Eduardo Santellano-Estrada, Luis Manuel Carrillo-Lopez, Mariana Huerta-Jimenez, Simon Morales-Rodriguez, Einar Vargas-Bello-Pérez, and Alma Delia Alarcon-Rojo. 2022. "Ultrasound as a Potential Technology to Improve the Quality of Meat Produced from a Mexican Autochthonous Bovine Breed" Sustainability 14, no. 7: 3886. https://doi.org/10.3390/su14073886
APA StyleCaraveo-Suarez, R. O., Garcia-Galicia, I. A., Santellano-Estrada, E., Carrillo-Lopez, L. M., Huerta-Jimenez, M., Morales-Rodriguez, S., Vargas-Bello-Pérez, E., & Alarcon-Rojo, A. D. (2022). Ultrasound as a Potential Technology to Improve the Quality of Meat Produced from a Mexican Autochthonous Bovine Breed. Sustainability, 14(7), 3886. https://doi.org/10.3390/su14073886