1. Introduction
Water-related disasters such as floods have increased due to an increase in the global population and climatic variations [
1,
2,
3,
4]. Human lives and existing ecosystems, including public health [
5,
6], are affected by floods. Several studies have been conducted to address flood control and mitigate risks to ecosystems and public health [
7,
8,
9,
10,
11,
12,
13,
14].
For example, Zhou et al. [
15] investigated the major causes of flooding and its characteristics in Shanghai and concluded that flood management should be conducted with a strategic perspective of disaster prevention, even though significant improvements in flood management in Shanghai have been achieved. Shi et al. [
16] constructed an indicator system for flood disaster risk management in Xiamen. The results showed that the drainage and flood control capacity is insufficient, especially in the old city.
Dam construction does not directly relate to ecosystems and public health. However, floods can significantly affect ecosystems and public health since they can abruptly change the environment of a basin and threaten public health in flooded areas. Fewtrell and Kay [
17] reported that flooding in the United Kingdom (UK), such as the Easter flood of 1998, frequent winter floods, and the extensive summer flood of 2007, which caused mental health problems characterized as psychological distress. The European Parliament and Council [
18] reiterated in their preamble that “Floods have the potential to cause fatalities, displacement of people and damage to the environment”.
Dam construction has been performed to mitigate flood risk and render lower-stream areas more resilient [
19,
20,
21,
22,
23]. Dams have been built for multiple purposes, such as flood protection, water supply, and hydropower generation [
24,
25]. However, these purposes conflict with each other [
14,
26]. For example, a dam that has the purpose of conserving the water supply requires operation at the dam’s high-water level. In contrast, a high-water level might cause flooding by discharging a large amount of flow in a sudden high rainfall event, especially when the water level is near the maximum dam capacity [
27]. Zhang et al. [
28] investigated the causes of dam failures with more than 1600 cases. One of the reasons for dam failure is the loss of reservoir capacity for flood control due to over storage prior to the flood season while the major reasons are technical deficiencies and overtopping, which led to over 80 percent of all failures.
A flood event occurred on 8–9 August 2020; the event was caused by discharging outflow from the Hapcheon Dam (HCD), which located in the middle of the Hwang River basin. The downstream section of the HCD was flooded from the outflow, and the stream outlets connected to the Hwang River, including the levees of the Hwang River, overflowed or suffered from piping erosion. The cause of this flood must be inspected to carefully mitigate future flood events and improve dam management for flood control. Therefore, the purpose of the current study is to investigate (1) the causes of flooding downstream of the HCD; (2) the main reason for the high outflow; and (3) how floods can be avoided.
The remaining part of the paper is organized as follows: The mathematical background is introduced in
Section 2.
Section 3 contains the description of the study area and governmental background. The detailed investigation results for the 2020 flood event were prepared and presented in
Section 4,
Section 5,
Section 6 and
Section 7, in the order shown in
Figure 1. The 2020 flood event was described in detail in
Section 4. The hydrological frequency analysis and dam management analysis were presented in
Section 5 and
Section 6, respectively. Further simulation analysis was performed and described in
Section 7. In
Section 8, the discussion about the 2020 flood event result was presented followed by the summary and conclusion in
Section 9.
2. Mathematical Background
2.1. Frequency Analysis and IDF Curve Estimation
To extract detailed frequency information, the intensity-duration-frequency (IDF) curves for the GS and HS were estimated with the Gumbel distribution and the probability-weighted moment (PWM). The Gumbel distribution has been popularly employed in hydrological extremes; this distribution was selected as the most feasible distribution for extreme rainfall over Korea [
3,
29]. Other distributions, such as the general extreme value and logistic distributions, were also tested. The Gumbel distribution was selected since the distribution was recommended for rainfall extremes over Korea stations; the distribution goodness-of-fit test supported this distribution. Additionally, the PWM was chosen to estimate the Gumbel distribution parameters since it is commonly employed for rainfall extremes in the literature [
30,
31]. In the following, the detailed explanation of the frequency analysis and IDF curve estimation procedure are explained.
The probability distribution function and cumulative distribution function of the Gumbel distribution are denoted as
where
α and
β are the location and scale parameters, respectively.
A quantile value (
xT) of a certain return period (
T) can be estimated as
Among a number of parameter estimation methods, the method of PWM was employed in the current study as follows:
where
δr is the
rth probability weighted moment defined as
δr =
E[
X F(
x)
r] or
δ0 =
E[
X] and
δ1 =
E[
X F(
x)].
To estimate a design rainfall, intensity-duration-frequency (IDF) curves are essential and have been widely employed in hydrologic and hydraulic design. An IDF curve can be estimated as follows:
- (1)
Acquire annual maximum series of hourly precipitation depth (x) for given durations. Here, the durations applied are d = 1, 2, 3, 4, 6, 9, 12, 15, 18, 24, 48, and 72 h;
- (2)
Apply the annual maximum series of different durations (d) to a Gumbel distribution with the probability weighted moment (PWM) method;
- (3)
Estimate quantiles (xT) for different return periods (T = 10, 20, 30, 50, 80, 100, and 200 years);
- (4)
Divide the estimated quantiles by the corresponding durations (zT (d) = xT/d) so that rainfall intensity (mm/h) is estimated;
- (5)
Illustrate the estimated rainfall intensities (zT (d)) versus duration for different return periods zT (d).
2.2. Flood Water Level Estimation
The water level of the HCD was estimated with the predefined relationship between the dam water level and storage curve, while the water levels of the levees in the downstream of the HCD were simulated with the HEC-RAS program. The relationship water level and storage has been defined by the ruling company (i.e., K-water) and its detailed equation is shown in
Table S1 in Supplementary Materials. The current storage (
S(
t)) was calculated by subtracting outflow from inflow and adding to the previous storage (
S(
t − 1)) (i.e., d
S/d
t = Inflow − Outflow) where d
S =
S(
t) −
S(
t − 1).
To estimate the water level of the downstream levees, a rainfall-runoff simulation was made with the Hydrologic Engineering Center’s River Analysis System (HEC-RAS). The HEC-RAS is developed to calculate one-dimensional steady flow and two-dimensional unsteady flow for a full network of channels. Water surface profiles of steady flow are computed from one cross section to the next by solving the energy equation in the following:
where
Z is the elevation of the main channel and
Y is the depth of water at cross sections.
V and
α are the average velocity and its weighting coefficient, while
g is the gravitational acceleration.
he is the energy head loss between two cross section including friction losses and contraction or expansion losses.
3. Study Area and Governmental Background
3.1. Description of Study Area
The current study area is the HCD, which is located in the middle of the Hwang River Basin (HRB), as shown in
Figure 2. The area and length of the upper stream based on the HCD are 925 km
2 and 63 km, respectively, while those of the lower stream are 687 km
2 and 52 km, respectively. The region has high humidity and temperature during the summer and low humidity and temperature during the winter. Its total average precipitation per year is 1308 mm. Extreme flash floods also occur often during the summer season in this area, due to the East Asia monsoons and typhoons. Monsoons occur from late June to mid-July, and most precipitation occurs over South Korea, including the HCD area. The lower stream area was damaged by the 2020 flood event. Most of the downstream area was damaged from the 2020 flood event, including Guntae, Nakmin, Kiri, Yuljin, and Moonlim villages.
The HCD was built in 1988, with a height of 63 m and a width of 472 m, and is a concrete gravity dam. The dam provides flood control, water supply, and hydroelectric power supply. The storage capacity of the dam is 790 × 106 m3. The elevation of the dam height is 181.0 m, and the low water level (LWL) and flood water level (FWL) are at elevations of EL. 140 m and EL. 179 m, respectively, and the normal high-water level (NHWL) and restricted water level (RWL) are the same at EL. 176 m. The effective storage for the water supply is 5.6 × 10⁸ m3.
3.2. Water Governmental Organization for Flood Control
Water-related tasks have been implemented by the Ministry of Land, Infrastructure and Transport (MOLIT) in South Korea, and public enterprises (K-water) have the role of managing dams and waterworks under the MOLIT. Since 2019, in South Korea, most water-related tasks have been transferred from the MOLIT to the Ministry of Environment (ME) according to the policy of integrated water management (or one water management), including K-water management. Related laws such as the River Act were transferred to the ME, including the decision of instream flow amount, multi-reservoir and weir operation, management, and employment of river water [
32]. Currently, flood control is performed by the Flood Control Office (FCO) under the ME, and the water public enterprise (K-water) has the duty to operate dam gates designated by the FCO.
As a consequence of the government organizations’ transfer, the emphasis of water-related policies has shifted from water resource development to environmental water usage, including clean water without further development, which requires water conservation. Especially at the beginning of 2020, the ME announced the water-related task plans for 2020 [
33]. Part of the plans was directly related to the HCD. One of the plans was to incubate clean environmental energy. According to the project, the floating photovoltaic system was planned to generate 41 MW of electricity in the HCD, and the system with 500 kW was placed in 2012.
4. Description of the 2020 Flood Event in the HCD Area
4.1. Weather and Hydrologic Conditions over the Hapcheon Basin
During the flood event on 7–9 August 2020, the first part of the rainfall started in the late morning of 7 August. After rainfall deceased for a few hours, most of the rainfall event started in the early morning of 8 August. The spatial distribution of the daily precipitation on 7 and 8 August is presented in
Figure 3 by spatial smoothing with ArcGIS for seven weather stations nearby Hapcheon Dam (see
Table S2 in Supplementary Materials). The daily precipitation indicated that the upper part of the Hapcheon Basin had a higher precipitation amount than the lower part on both days. The upper right side of the basin had the highest precipitation on 7 August (range approximately 62–170 mm/day), and the upper left side of the basin had the highest precipitation on 8 August (range approximately 143–191 mm/day). The weather condition in the regional scale during the event is shown in
Figure S1 (see Supplementary Materials), showing that the monsoon front was located during the day from the east coast of China to Japan.
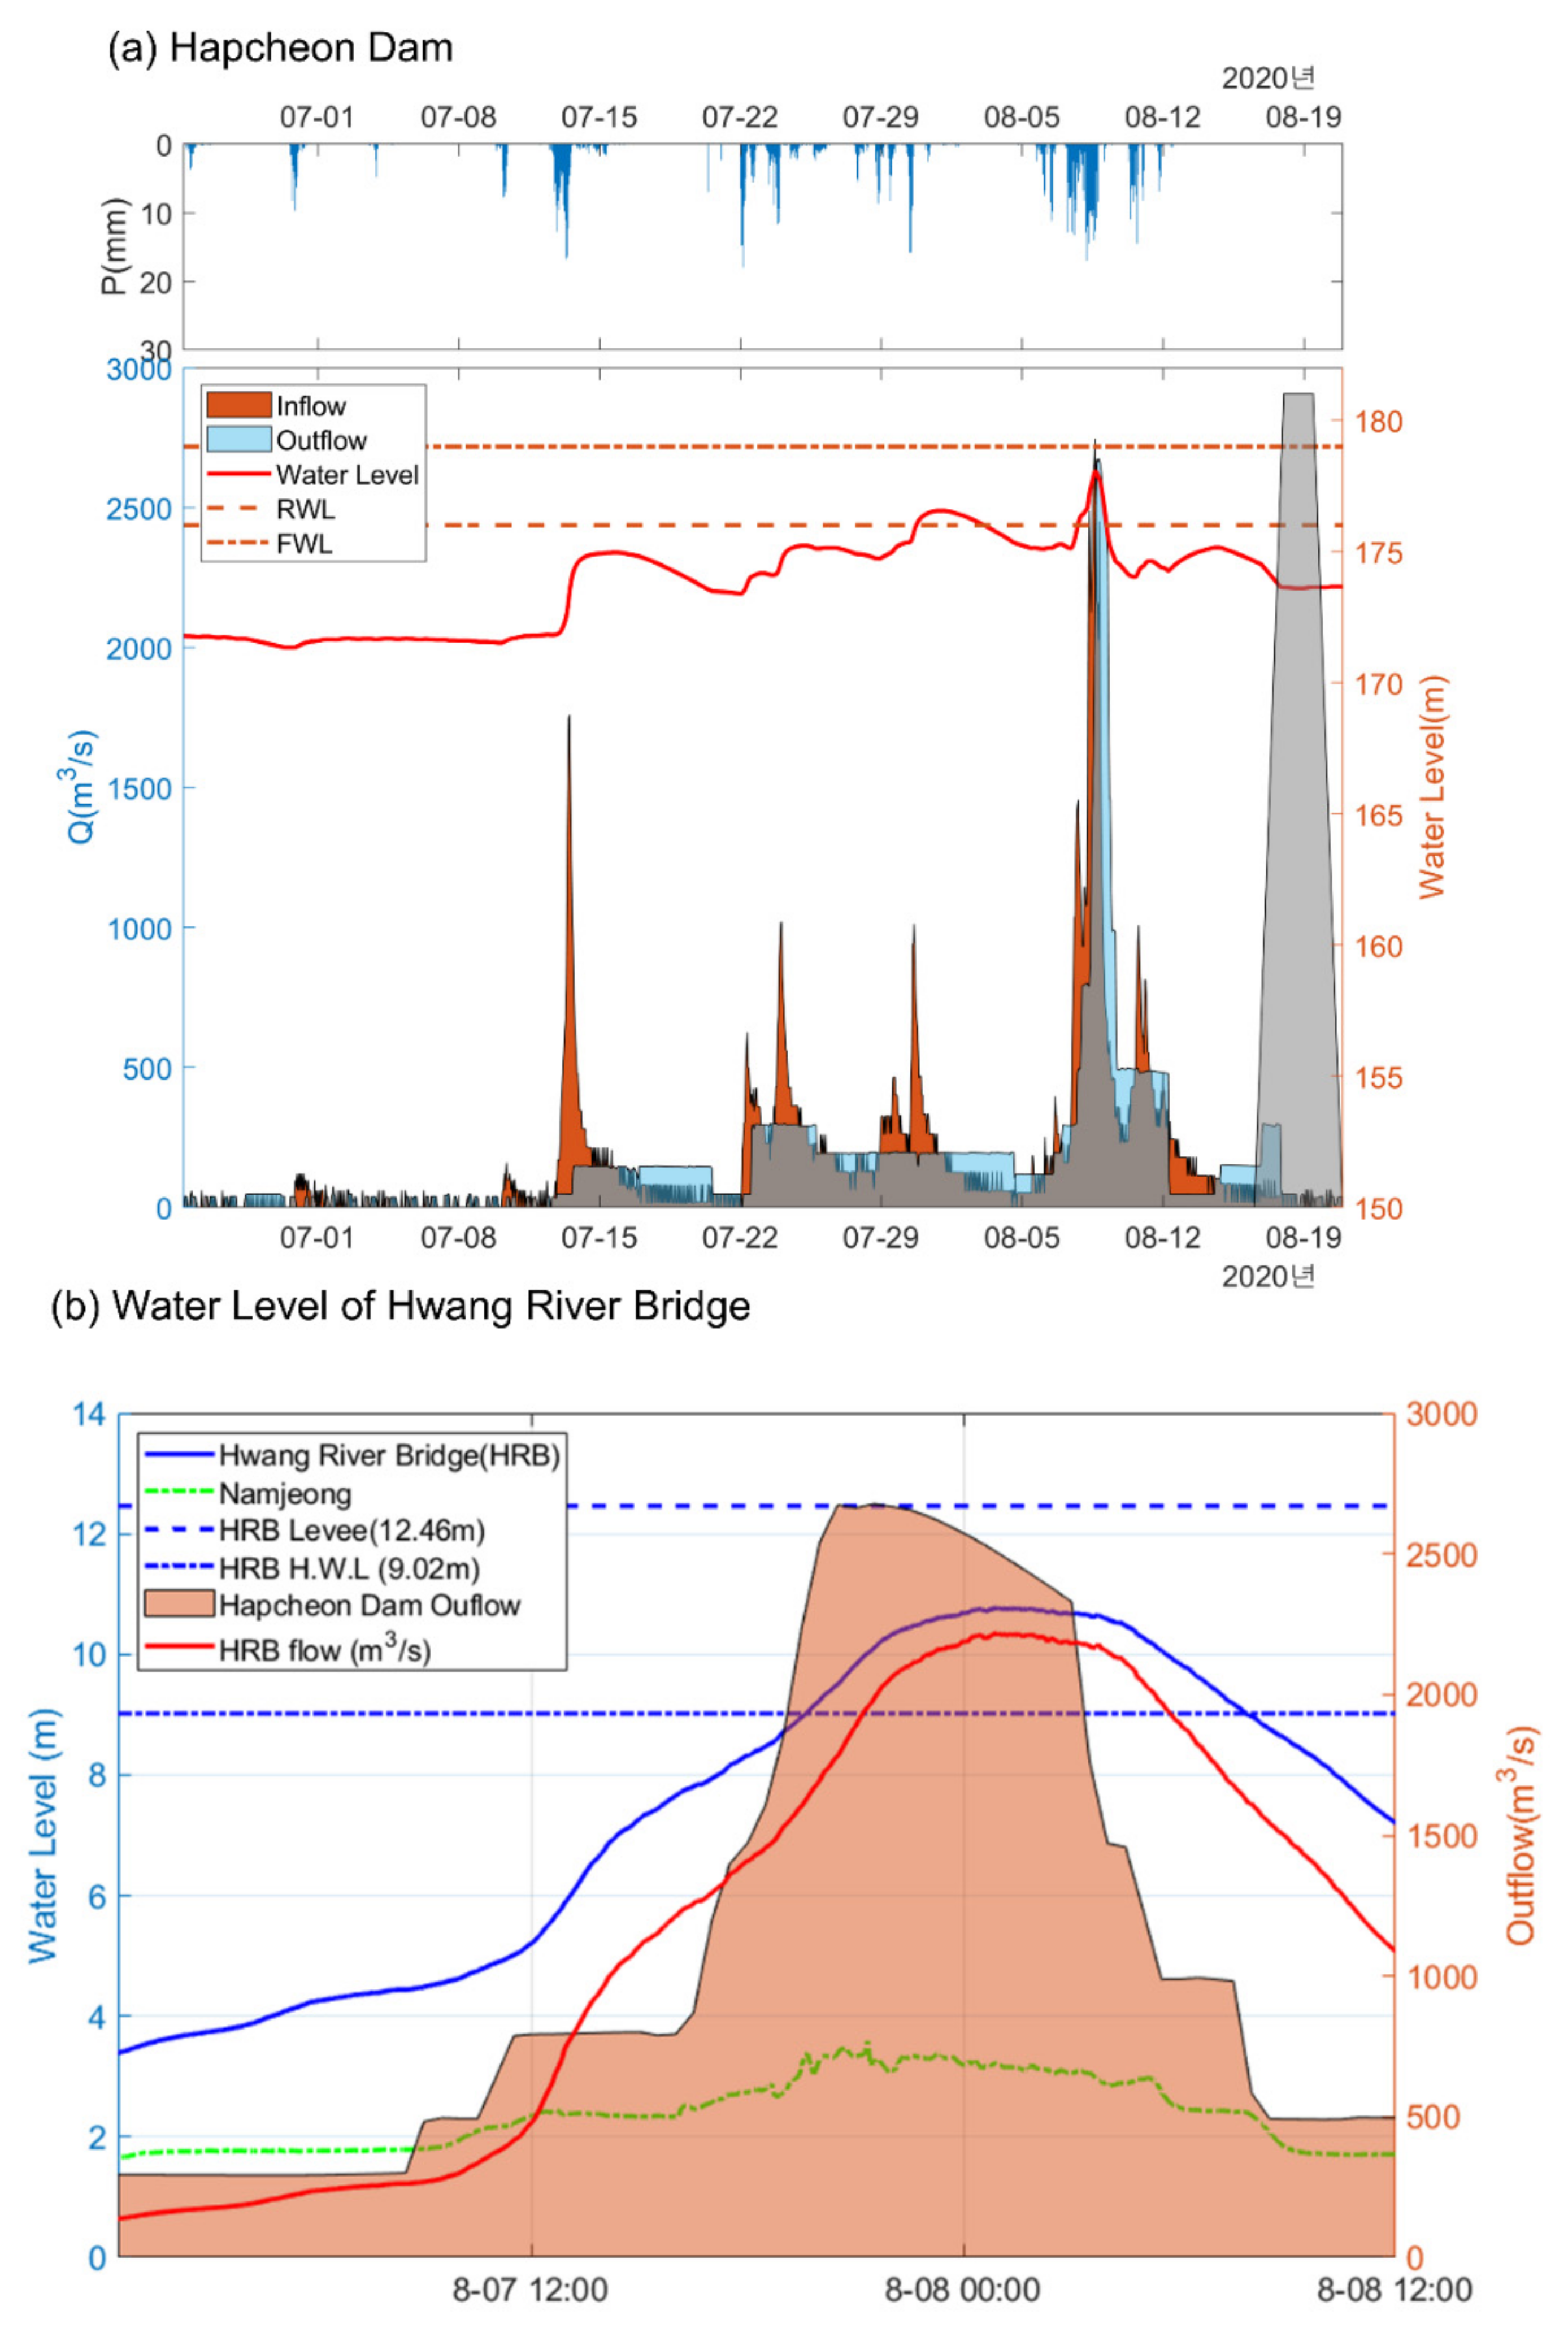
The inflow and outflow and the water level of the HCD are presented in
Table S3 in Supplementary Materials and
Figure 4a. The water level of the HCD at the beginning of July was already as high as 172 m. Before the 2020 flood event on 7 August, the water level was approximately 175.25 m near the RWL (176 m), as shown in
Table S3 in Supplementary Materials and
Figure 4a. The outflow of the HCD was less than 300 m
3/s, while its inflow was approximately 230 m
3/s. At 11:00 on 7 August, the inflow started to increase to 500 m
3/s, reached 1500 m
3/s, and then decreased to 950 m
3/s at 1:00 on 8 August. Afterward, the inflow increased drastically and soon exceeded 2000 m
3/s at 7:00. The inflow continued to increase to 2750 m
3/s at 14:00 and then decreased. The inflow, which exceed 2000 m
3/s, continued until 20:00 9 August.
With the inflow increase, the water level of the HCD continued to increase to EL. 178.05 m on 14:00 8 August, when the maximum inflow occurred (
Table S3 in Supplementary Materials and
Figure 4a). Accordingly, the dam was managed to prevent the water level from reaching the FWL (EL. 179 m) by increasing the outflow from the HCD. From 8 August at 10:00, the outflow exceeded 1000 m
3/s. When the inflow reached the peak, the outflow exceeded 2000 m
3/s, and the water level exceeded 178 m at this time. The outflow continuously exceeded 2000 m
3/s for 16 h until the water level decreased below EL. 175.5 m, which was near the starting water level of the event. A discharge higher than 500 m
3/s continued until 9 August at 16:00.
4.2. Flood Damage Description in Chronological Order
Major flood damage occurred on 8 August since the peak outflow from the HCD was reached during the day. At 9:30 on 8 August, the entrance road of Kiri village (H and I in
Figure 5) started to become inundated since the outflow from the HCD (shown in
Figure 2b) exceeded 500 m
3/s (refer to
Figure 4b). This event was confirmed from an interview with a barn owner and the farmland’s remaining flood traces. Sixty percent of the livestock died from the flood. At 11:00, the Hapcheon sports complex park (refer to K in
Figure S2b) was inundated due to low ground elevation by an outflow greater than 1000 m
3/s, as shown in
Figure 4b. The football and gateball fields were subsequently destroyed.
Inundation started at Maeho village at 13:00 with an HCD outflow of approximately 1500 m3/s. Three houses were flooded, forcing 24 people to evacuate, and 0.1 km2 of farmland was flooded and damaged. At 14:00, the Naecheon stream levee collapsed in Naecheon village with an HCD outflow greater than 1500 m3/s, and the river overflowed. The levee height in the village was low, and the Hwang River’s water level increased from the Hapcheon Dam’s outflow. These events might be the major causes of floods in this village. Note that Maeho and Naecheon villages are located in Sangcheck-myeon, with populations of 1277 and 783 families, respectively.
At 16:00, the major flood occurred since the HCD outflow reached its peak. The levee’s failure in Guntae village (E in
Figure 5) started at 13:00, and at approximately 16:00, the village was inundated from backflow (D in
Figure 5). A Guntae villager witnessed that the water level in the houses in the village began to increase and the residents evacuated by boat. Twenty-two houses were submerged in the village. The levee of the Sangshin stream near the Hwang River outlet broke from piping due to the Hwang River’s high-water level (refer to
Figure S2d, see Supplementary Materials). The maximum flood depth was 7 m in this region, as shown in D of
Figure 5b and
Table 1. More than 100 greenhouses were inundated, and numerous livestock were carried away.
The part of the levee at the Nakmin stream collapsed at 16:00 (B in
Figure 5). The Doosa bridge located at the Nakmin stream’s outlet to the Hwang River was destroyed (A in
Figure 5). The road and rice fields near the levee were flooded (refer to
Figure S2a in Supplementary Materials). The overflowed water from the Nakmin stream inundated Nakmin village (C at
Figure 5). Thirty-three houses and 0.9 km
2 of farmland in this region were flooded, killing 3000 livestock.
In Naecheon village, at 16:00 (J in
Figure 5), the road and rice field at low ground elevations were submerged. The head of the village witnessed that the water level increased in his house increased by as much as 1.5 m. Sixteen homes and 0.42 km
2 of the village area, including 400 greenhouses, were inundated.
5. Hydrologic Frequency Analysis
5.1. Rainfall Frequency Analysis
The maximum precipitation amounts for different durations downloaded from Korea Meteorological Agency (KMA,
https://www.weather.go.kr/, accessed on 1 February 2022) were extracted from the GS and HS (see
Figure 2) for the current 2020 event (see
Table 2). These maximum precipitation amounts are presented with the time series of the annual maximum precipitation (AMP) for the GS and HS in
Figures S3 and S4 in Supplementary Materials, respectively, with a red star marker in 2020.
As indicated, the 2020 flood event precipitation amounts were not as large as those of the other AMPs for all durations and stations. For example, the 1 h maximum precipitation of the 2020 flood event at the GS (left-top panel of
Figure S3 in Supplementary Materials) was approximately 20 mm. Most of the AMPs are higher than this value. For higher durations, the precipitation amount of the 2020 event was comparatively than those of the other AMPs. For example, the 72-h maximum precipitation of the 2020 event (right-bottom panel of
Figure S3) exceeded 300 mm. There are only two or three AMP values higher than the 72 h maximum precipitation of the 2020 event. A similar pattern is observed at the Hapcheon station (refer to
Figure S4).
With the IDFs for the Geochang and Hapcheon AMPs, the intensities that corresponds to the 2020 flood event durations are represented in
Figure 6 with red diamond markers. The detailed return periods of the 2020 flood event for each station are shown in
Table 2. The results indicate that the intensity is very low during short and middle durations. For a maximum of 15 h (900 min) durations, all the return periods of the rainfall amount for the 2020 flood event are less than ten years (
Table 2). Only the rainfall amounts greater than 24 h for the 2020 flood event have return periods longer than ten years, and the maximum return periods are less than 30 years for both stations. Note that the concentration-time when the major flood reached the HCD from the farthest point is approximately 3–7 h [
34] since the length of the upper part of the Hwang River basin (i.e., upstream of the HCD) is only 63 km. This upper part mainly consists of mountains (i.e., steep slope and high flow velocity approximately 2–5 m/s).
The rainfall frequency analysis results indicate that the 2020 flood event’s rainfall amount was not dramatically high and that rainfall event with only a 2–30 year return period occurred.
5.2. Flood Frequency Analysis of Inflow
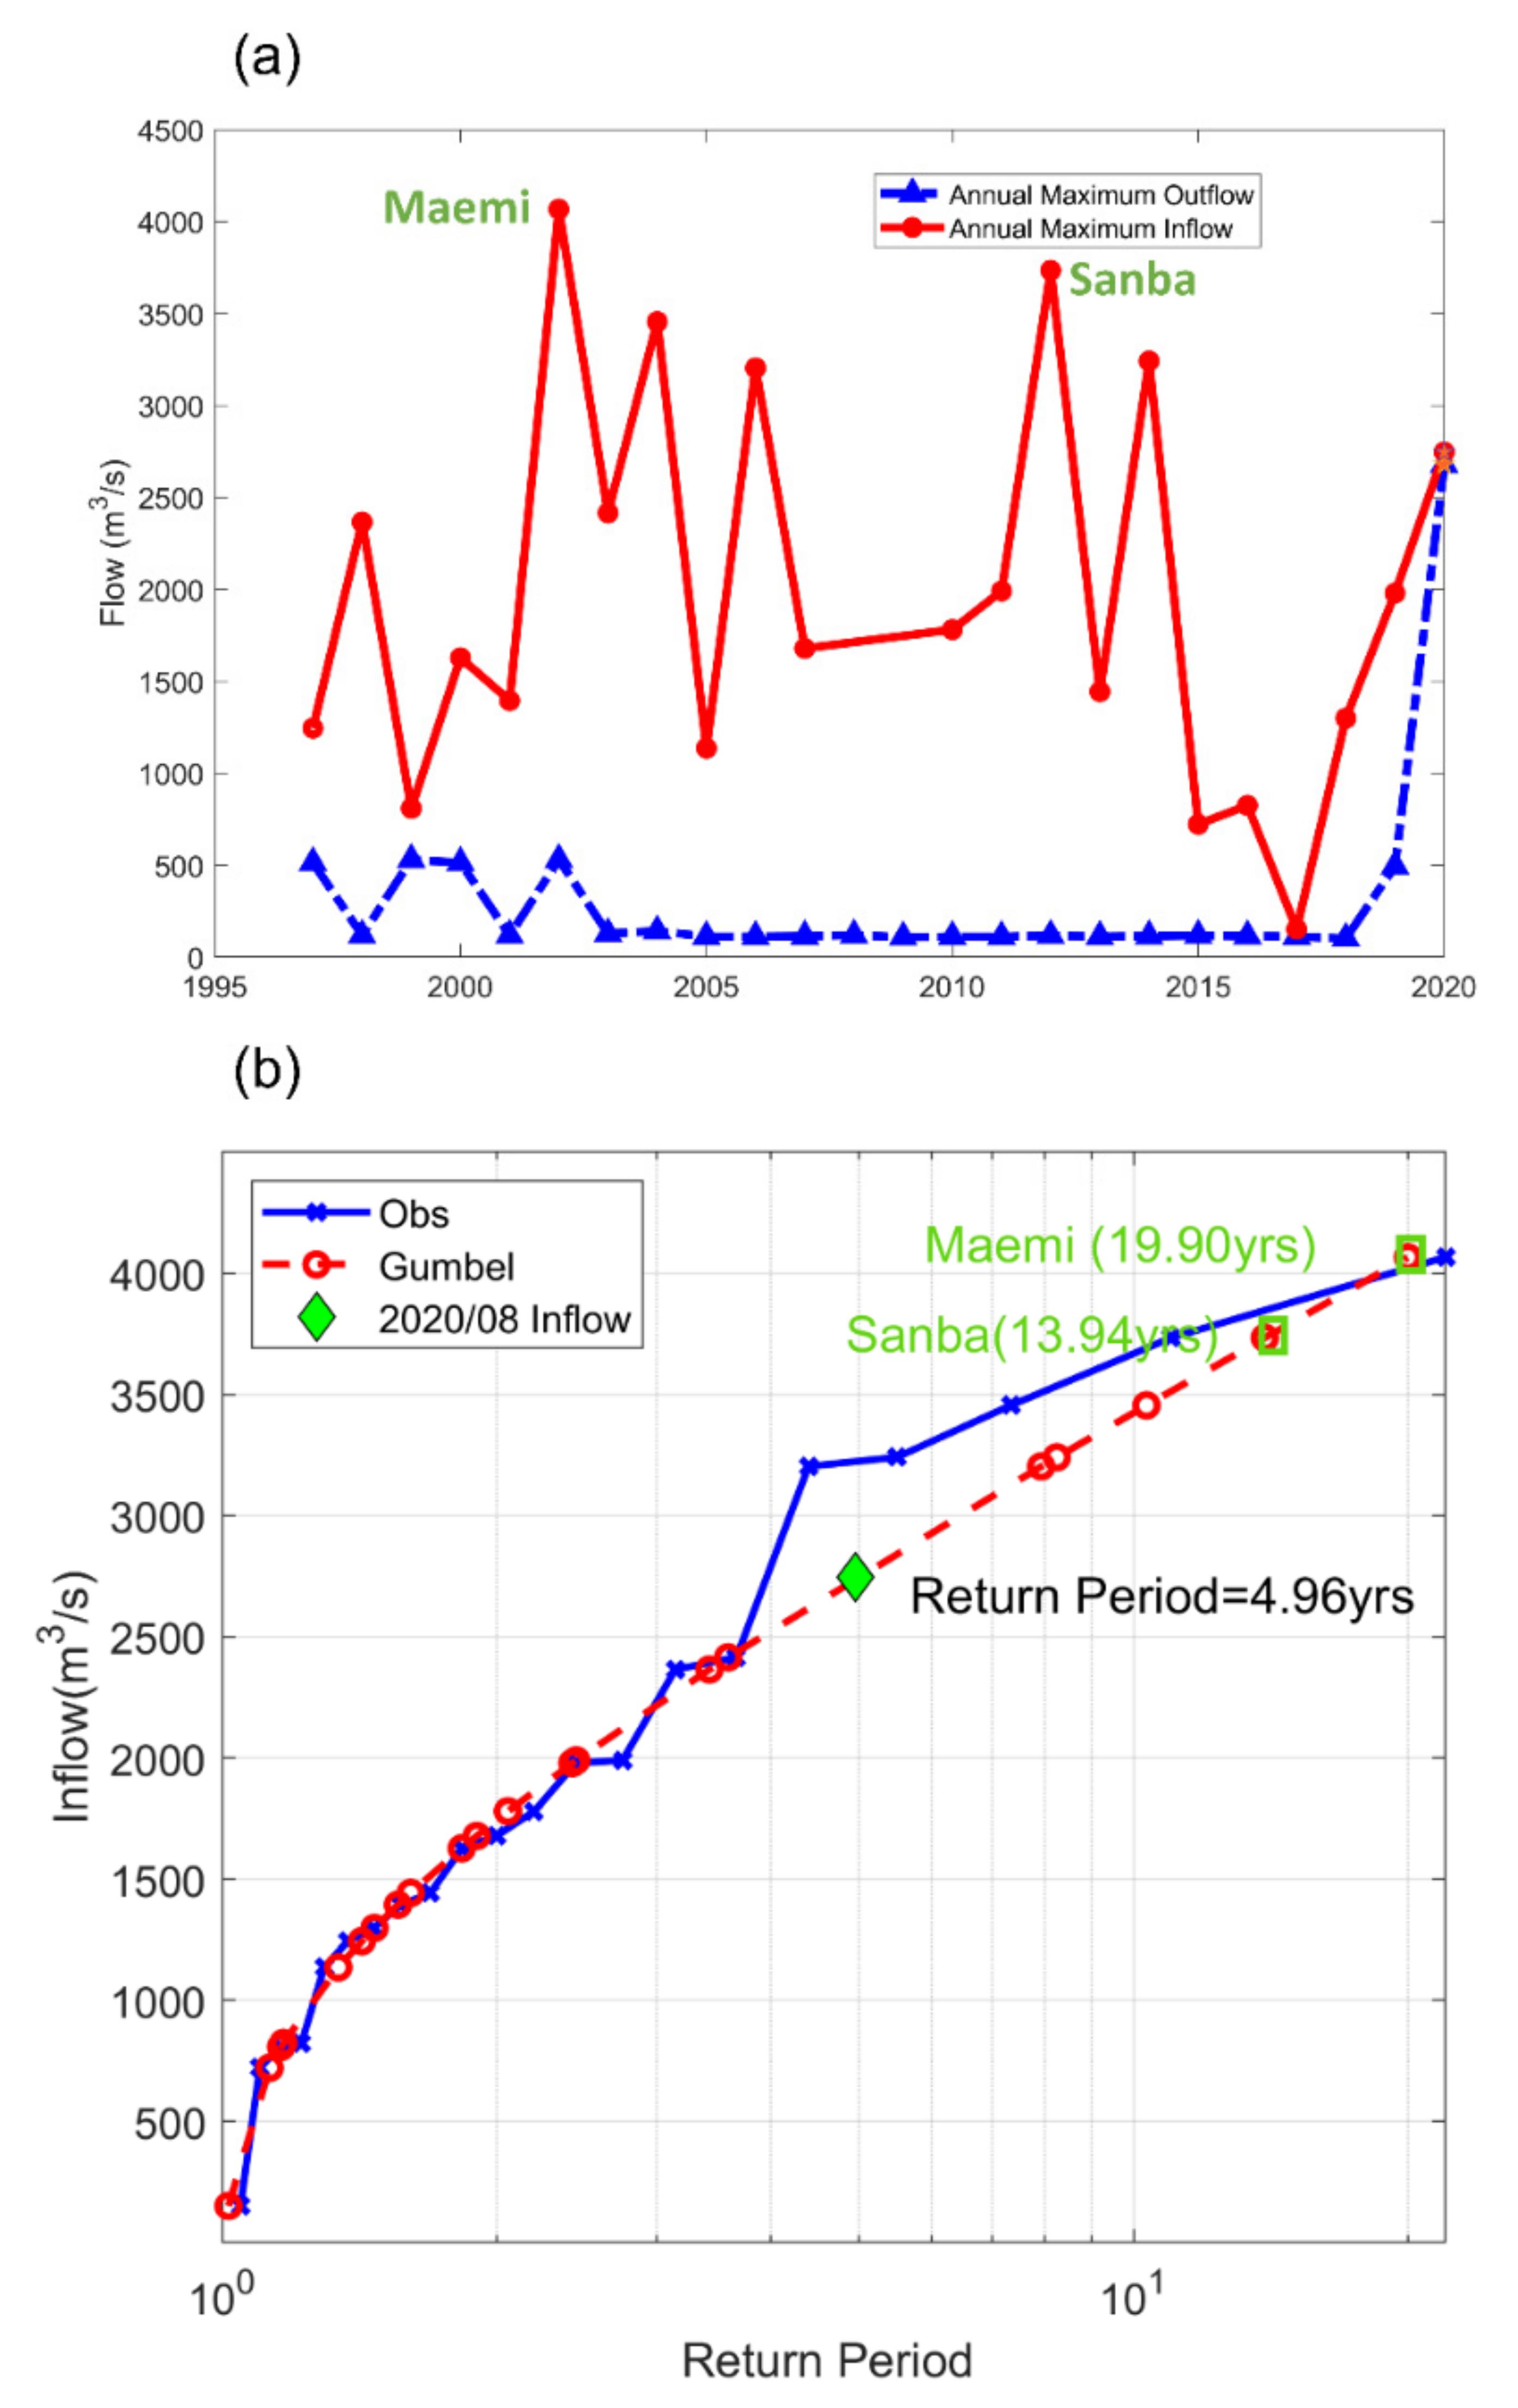
The maximum inflow data to the HCD for the 2020 flood event were analyzed and compared with other years, as shown in
Figure 7a. The maximum annual inflow in 2020 was approximately 2746 m
3/s (
Table S3 in Supplementary Materials and
Figure 7a). This value has been exceeded five times during the last 23 years, which indicates an average return period of approximately 5 years.
The frequency analysis was performed with the observed maximum precipitation data for 23 years with the Gumbel distribution and PWM for the parameter estimation presented in
Figure 7b (thick dashed line with a circle marker). The Gumbel distribution and PWM were employed here with the same reasoning as the rainfall data. The fitted distribution fairly matches the empirical distribution (solid line with a cross marker in
Figure 7b). The results show that the 2020 flood event’s maximum inflow has an approximately 5-year return period similar to the observed data, which indicates that the inflow of the 2020 flood event was not very unusual. Note that the rainfall data’s frequency analysis shows that the return period of the 2020 flood event’s maximum rainfall is less than 30 years, and the return period of the design rainfall is 100 years for the HCD. The frequency analysis of the maximum inflow and the maximum rainfall indicates that the 2020 flood event was not caused by an unprecedented natural disaster and might be attributed dam management. Additionally, note that the employed record of the inflow data is only 23 years. The uncertainty of the estimate with this short record cannot be ignorable. Therefore, care must be taken to interpret the results of the flood frequency analysis.
Operation of water gates controls the outflow of the HCD. The outflows corresponding to the maximum inflow events are shown in
Figure 7a (thick dash-dotted line with a triangle marker). The plot illustrates that the maximum outflow from the HCD for 23 years was only approximately 500 m
3/s before 2020. In contrast, the outflow at the 2020 flood event was 2677 m
3/s (last column of
Table S3 in Supplementary Materials and
Figure 7a). This value is more than five times higher than the past maximum inflow over the previous 23 years, even with an inflow of only a 5-year return period. Further analysis of the operation of the HCD is presented in the following section. The analysis focuses on reasons for the high outflow, compared to the historical annual maximum outflow data, even with the 5-year low inflow to the HCD in the 2020 flood event.
6. Dam Management Analysis
A historical dataset for dam operation was analyzed to investigate the reasons for the high outflow during the 2020 flood event by the low return period’s inflow and precipitation data. A few simulations were performed with the assumptions of different outflows and initial water levels of the HCD to evaluate the major reasons for the 2020 flood event.
6.1. Historical Dam Management
The top panel of
Figure 8 illustrates the time series of the water level of the HCD for each year, from November of the previous year to October of the following year, since in South Korea the flood season ends in October and the dry season starts in November. For all years, except 2019 and 2020, after the governmental organization transfer to the ME, the HCD water level decreased to lower than EL. 155 m in the middle of June, which is the beginning of the flood season in South Korea. There are two reasons for the water level decrease: the continuous water supply from the HCD during the dry season and the preparation for the flood season summer.
However, a water level higher than EL. 165 m has been sustained since 2019. The water level was already higher than 172 m in the middle of June in 2020, while in the other years, the water level did not exceed EL. 155 m during the same time due to the preparation for the flood season and the water supply for the dry season. This high-water level policy might have caused the emergency situation during the 2020 flood event, due to inadequate space for flood control at water levels higher than EL. 172 m. It is suspected that this high-water level at the HCD led to a five times larger outflow in the 2020 event and exceeded the past maximum record, even though the rainfall and inflow were not much higher. The extremely large outflow damaged the downstream region of the HCD, as previously discussed.
The bottom panel of
Figure 8 illustrates the cumulative outflow by year from the HCD. The outflow was limited throughout 2019 and before the middle of July 2020. This limited outflow indicates that the water resources in the HCD were contracted and conserved. During the 2020 flood event, a large amount of the outflow was generated, which led to a steep slope in the 2020 cumulative flow line to avoid dam overflow and dam failure conditions.
6.2. Dam Management for the Observed Typhoon Events: Maemi and Sanba
In
Figure 9, the historical hydrologic and dam operational data for 2003 and 2012, when the typhoons of Maemi and Sanba, respectively, penetrated the Korean Peninsula, are presented. On 12–13 September 2003, Typhoon Maemi struck throughout Korea, including the Hwang River basin, and a maximum inflow similar to that of the 2020 flood event (refer to
Table S3 in Supplementary Materials) was discharged due to rainfall (refer to
Figure 9a). Note that a few floods occurred before the major 2003 flood. However, a small outflow amount was discharged for long periods, decreasing the water level to below 165 m. Since the water level was lower than EL. 165 m, the dam operated with a small amount of outflow during the 2003 flood event by Typhoon Maemi.
In the period 17–18 September 2012, Typhoon Sanba affected the Hwang River basin. During this event, the maximum inflow to the HCD reached 4000 m
3/s, which is a much greater amount than the maximum inflow of the 2020 flood event (refer to
Figure 9b). The initial water level before the Sanba event was near EL. 169 m. Even with this high-water level, minimal outflow was released from the HCD, and the water level only reached near the RWL (EL. 176 m). This finding implies that slightly lowering the water level before the event might have avoided discharging such a high outflow. A few simulations have been tested to determine what dam operation scenarios could have avoided the high HCD outflow during the 2020 flood event.
The difference between the 2020 flood event and two typhoon events is clear. The outflow from the HCD during two typhoon events was limited to less than 500 m3/s, but the water level did not exceed the RWL, even though the inflow of the two typhoon events was much larger than the one of the 2020 flood event. Meanwhile, the outflow from the 2020 event exceeded 2500 m3/s, with lower inflow than the one from two typhoon events, but the water level was above RWL and almost reached to the FWL. The critical factor to cause such large outflow at the 2020 flood event was the initial water level of the HCD.
7. Simulation Analysis
7.1. Simulation Results in Operating HCD
A few simulations were performed to illustrate the effects of the initial water level and the water level variation with limited outflow, as shown in
Figure 10. The first simulation was run by assuming that the discharge was limited to 500 m
3/s during the 2020 flood event when the actual outflow exceeded 500 m
3/s (i.e., 22:00, 7 August–6:00, 8 August; refer to the last column of
Table S3 in Supplementary Materials). As presented in
Figure 10a, the HCD water level reached the dam crest elevation (EL. 181 m) after a few hours of peak inflow, and the level fluctuated over the crest. It is certain that with the high 2020 flood event outflow greater than 500 m
3/s, dam overflow was inevitable, and the dam body protection was not possible since the water level of the HCD was already near the RWL (EL. 176 m) just before the event.
The second simulation was carried out by setting the initial water level to 155 m in the middle of June, which is almost the highest water level for this season in the period 2000–2018 (refer to
Figure 8), except in 2019 and 2020, after the government transfer for water-related tasks. Note that the real water level for this time was EL. 171.78 m. The outflow limit was 500 m
3/s, as shown in the first simulation in
Figure 10a. The result of the second simulation is presented in
Figure 10b. By lowering the initial water level to EL. 155 m, the maximum water level was below EL. 170 m. The other simulation (result not shown) revealed that using an initial water level of EL. 170 m instead of EL. 171.78 m did not cause an overflow of the dam crest with the limited outflow of 500 m
3/s.
The third simulation was performed according to the designated flow. Before the main 2020 flood event, several rainfall events induced inflow to greater than 1500 m
3/s, as shown in
Figure 10. Due to these preceding inflows, the HCD water managing company requested to designate 300 m
3/s from the Nakdong River FCO under the ME from 30 July. In this way, the HCD could be operated to discharge a maximum of 300 m
3/s outflow from the HCD to prepare for the following flood event. This situation was evaluated with by releasing 300 m
3/s from 31 July to when the outflow exceeded 500 m
3/s. The following outflow was limited to 500 m
3/s. As shown in
Figure 10c, the water level decreased to EL. 171.3 m before the inflow reached the peak, and the peak water level did not reach the dam crest or even the HWL.
The simulation results show that the exceptionally high flow greater than 2600 m3/s in the 2020 flood event seems inevitable considering the high water level near the RWL. However, lowering the water level before the flood season and operating the outflow as designated might reduce or avoid damage to the area downstream of the HCD.
7.2. Simulation for Downstream
Some of the main damage from the 2020 flood event originated from the exceptionally high outflow. This condition resulted in an overflow at the stream outlet’s levee that was connected to the area downstream of the HCD in the Hwang River, as shown in
Figure 5. Due to the high-water level before the 2020 flood event near the RWL (176 m), there was not enough space for flood control in the HCD. Different RWLs were considered to prepare additional space for flood control related to the levee’s water level downstream.
The Hydrologic Engineering Center’s (HEC) River Analysis System (
HEC-
RAS) [
35,
36,
37,
38] was employed to simulate the water level of the levees for the streams connected to the Hwang River (i.e., the downstream of the HCD) as presented in
Figure 11a. The HEC-RAS model was validated with the 2020 flood event and then employed to simulate the other cases. Different RWLs were tested to operate the HCD during the 2020 flood event and were investigated in terms of how the stream levees’ water level could vary. The water levels of the Nakmin Stream (B in
Figure 5) and Kiri Stream (near H in
Figure 5) are presented in
Figure 11b,c, respectively, by simulating different RWLs at the HCD. The results indicate that both streams’ levees might not have overflowed if the RWL was restricted to lower than EL. 173 m, instead of EL. 176 m, during the 2020 flood event. The reasons for this result are that lowering the RWL would allow more space for flood control, and high outflow might not be necessary.
8. Discussion
The majority of the damage over the downstream area of the HCD occurred due to the 2020 flood event in the period 8–9 August, such as livestock loss and residential and agricultural areas flooding. The analyzed results from the current study indicate that the transfer of the government organization from the MOLIT to the ME might have led to the HCD water level increase to acquire water resources during the following dry season after the flood season. Eventually, the HCD high water level caused an increased outflow greater than 2600 m3/s, approximately five times larger than the past maximum outflow, even with a rainfall event with only a 2–30-year return period and a maximum inflow of about a 5-year return period.
The flood mitigation plan in the downstream area was not sufficient for large floods, such as the 2020 flood event. The levee height might have been too low for such high flows from the HCD (refer to the last column of
Table 2). Additionally, many downstream levees of the Hwang River experienced piping during the 2020 flood event. The Hwang River’s high-water level prohibited internal drainage of the flow from the other side of the Hwang River. More drainage pumping stations are required in some places to prevent further flood events from the outflow of the HCD, especially in Yuljin area and Moonlim area (L and M in
Figure 5).
The adequate amounts of HCD outflow and appropriate RWL before the flood season must be reevaluated to provide a safe environment for the downstream region and the HCD itself. Further analysis was performed regarding the reservoir operation method (ROM). However, the exact operation rule of HCD is not available to the public, and its analysis is limited.
The weather forecast is critical for managing the water levels in a basin run by the Korea Meteorological Agency (KMA) in South Korea, and the K-water has its own forecasting system. Allegedly, KMA did not forecast significant rainfall amount before the main rainfall event on 8 August, although the detailed forecasting results are not available from the Internet. However, the major point is that the water level was too high for the flooding season to safely manage the dam. Furthermore, the rainfall event and the inflow were not significantly high during the event, as discussed in the results section.
The failure of a dam operation causing floods has not been reported much, since a dam company does not want to reveal its faulty dam operation unless the operation had reached dam failure. Meanwhile, the International Commission on Large Dams (ICOLD) reported large dam incidents [
39,
40,
41,
42,
43,
44] classifying large dams as those that are higher than 15 m or that store over 3 hm
3. There are 6000 large concrete dams and about 15 of these dams have failed prior to 1960 due to a poor foundation. From the report, it can be seen that the probability of failure by flood for concrete dams appears to be very low. Therefore, the high amount of the HCD outflow from the 2020 event to avoid the dam break is not easily acceptable. Further investigation must be made to reveal real causes of the high outflow and high-water level before the flood season.
9. Summary and Conclusions
The present study performed an investigation of the 2020 flood event to evaluate the causes of the flooding and how it could have been avoided, including a detailed description of the downstream situation. The results revealed that the HCD water level was too high to perform flood control in the HCD even from regular floods in the 2020 flood event. It can be concluded that lowering the HCD water level at the beginning of the flood season might have prevented high outflow. Furthermore, it is concluded that the flood mitigation plan over the damaged downstream area of the HCD must be strengthened by (1) increasing the levee heights, especially at the stream outlet connected to the Hwang River, (2) installing drainage pumping stations for the villages that were damaged from backflow during the 2020 flood event, such as Yuljin and Moonlim, and (3) intensifying the emergency action plan during a flood for the villagers downstream of the HCD. The government still faces conflict regarding the responsibility of the flood, since this responsibility is linked to damage compensation. However, people whose home and living environment were damaged by the flood have suffered and should wait until a final decision is made by the courts.
As discussed, flooding at the HCD was not caused by general high precipitation or dam failure but by problems with dam operation, especially with the high water level of the HCD. This exceptional case study can serve as a reasonable guide for water managers and researchers on the risk management. The 2020 flood event provides an imperative lesson for water managers and governors. Even if environmental improvements in aquatic ecosystems and water quality are prioritized, dam safety and the lives of people in village downstream should not be disregarded. After securing public safety, further water conservation and environmental usage must be addressed.
In addition, this case study shows the critical point of how governmental decisions can impact dam management. This finding can be generalized for global impact assessment of climate change; for example, it could be assumed that future precipitation in a basin is projected to decrease. If water managers disregard flood management and only focus on drought management, then a basin might experience significant flooding, even from a small precipitation event, as shown in the HCD case. Subsequently, this real HCD case study delivers a critical lesson that governmental handling of dam management, and the use of water for other purposes must not obstruct the aim of flood risk management.
Supplementary Materials
The following supporting information can be downloaded at:
https://www.mdpi.com/article/10.3390/su14052975/s1, Figure S1: Weather condition in a regional scale during the 2020 flood event; Figure S2: Photos during the 2020 flood event on the Hapcheon Dam and its downstream region provided by Hapcheon-gun; Figure S3: Time series of AMP for different durations (1, 2, 3, 4, 6, 9, 12, 15, 18, 24, 48, and 72 h) for the GS. Note that the precipitation amounts for the current 2020 flood event are depicted with a red star marker; Figure S4: Time series of AMP for different durations (1, 2, 3, 4, 6, 9, 12, 15, 18, 24, 48, and 72 h) for the HS. Note that the precipitation amounts for the current 2020 flood event are depicted with a red star marker. Table S1: Predefined relationship between dam water level (H) and storage (S); Table S2: Employed additional weather stations; Table S3: Hydrologic conditions of the Hapcheon Dam during the 2020 flood.
Author Contributions
Conceptualization, T.L. and S.O.L.; methodology, T.L.; software, K.S. and H.J.Y.; validation, T.L. and H.J.Y.; formal analysis, K.S.; investigation, T.L.; resources, S.O.L.; data curation, K.S. and H.J.Y.; writing—original draft preparation, T.L. and K.S.; writing—review and editing, S.O.L.; visualization, H.J.Y. and T.L.; supervision, S.O.L.; project administration, S.O.L.; funding acquisition, S.O.L. All authors have read and agreed to the published version of the manuscript.
Funding
This research was funded by Korea Ministry of Environment (127572).
Institutional Review Board Statement
Not applicable.
Informed Consent Statement
Informed consent was obtained from all subjects involved in the study.
Data Availability Statement
The links of all the employed data were provided. Further detailed data information can be acquired from the corresponding authors up on request.
Acknowledgments
This work was supported by Korea Environment Industry and Technology Institute (KEITI) through Water Management Research Program, funded by Korea Ministry of Environment (127572).
Conflicts of Interest
The authors declare no conflict of interest.
References
- Lee, T. Climate change inspector with intentionally biased bootstrapping (CCIIBB ver. 1.0)—Methodology development. Geosci. Model Dev. 2017, 10, 525–536. [Google Scholar] [CrossRef] [Green Version]
- Lee, T.; Salas, J.D. Record Extension of Monthly Flows for the Colorado River System; US Breau of Reclamation: Denver, CO, USA, 2006; p. 155.
- Son, C.; Lee, T.; Kwon, H.H. Integrating nonstationary behaviors of typhoon and non-typhoon extreme rainfall events in East Asia. Sci. Rep. 2017, 7, 5097. [Google Scholar] [CrossRef] [Green Version]
- Murphy, E.A.; Post, G.B.; Buckley, B.T.; Lippincott, R.L.; Robson, M.G. Future challenges to protecting public health from drinking-water contaminants. Annu. Rev. Public Health 2012, 33, 209–224. [Google Scholar] [CrossRef] [PubMed] [Green Version]
- Barbeau, D.N.; Grimsley, L.F.; White, L.E.; El-Dahr, J.M.; Lichtveld, M. Mold exposure and health effects following hurricanes Katrina and Rita. Annu. Rev. Public Health 2010, 31, 165–178. [Google Scholar] [CrossRef] [PubMed]
- Balsiger, J.; Ingold, K. In the Eye of the Beholder: Network location and sustainability perception in flood prevention. Environ. Policy Gov. 2016, 26, 242–256. [Google Scholar] [CrossRef]
- Ali, R.; Kuriqi, A.; Abubaker, S.; Kisi, O. Hydrologic alteration at the upper and middle part of the Yangtze river, China: Towards sustainable water resource management under increasing water exploitation. Sustainability 2019, 11, 5176. [Google Scholar] [CrossRef] [Green Version]
- Ali, R.; Kuriqi, A.; Abubaker, S.; Kisi, O. Long-term trends and seasonality detection of the observed flow in Yangtze River using Mann-Kendall and Sen’s innovative trend method. Water 2019, 11, 1855. [Google Scholar] [CrossRef] [Green Version]
- Chen, J.; Li, Q.; Wang, H.; Deng, M. A machine learning ensemble approach based on random forest and radial basis function neural network for risk evaluation of regional flood disaster: A case study of the yangtze river delta, China. Int. J. Environ. Res. Public Health 2020, 17, 49. [Google Scholar] [CrossRef] [Green Version]
- Chen, S.; Li, Y.; Tian, Z.; Fan, Q. On dam-break flow routing in confluent channels. Int. J. Environ. Res. Public Health 2019, 16, 4384. [Google Scholar] [CrossRef] [Green Version]
- Dwirahmadi, F.; Rutherford, S.; Phung, D.; Chu, C. Understanding the operational concept of a flood-resilient urban community in Jakarta, Indonesia, from the perspectives of disaster risk reduction, climate change adaptation and development agencies. Int. J. Environ. Res. Public Health 2019, 16, 3993. [Google Scholar] [CrossRef] [Green Version]
- Fan, C.; An, R.; Li, J.; Li, K.; Deng, Y.; Li, Y. An approach based on the protected object for dam-break flood risk management exemplified at the Zipingpu reservoir. Int. J. Environ. Res. Public Health 2019, 16, 3786. [Google Scholar] [CrossRef] [Green Version]
- Mian, S. Pakistan’s Flood Challenges: An assessment through the lens of learning and adaptive governance. Environ. Policy Gov. 2014, 24, 423–438. [Google Scholar] [CrossRef]
- Plummer, R.; Baird, J.; Bullock, R.; Dzyundzyak, A.; Dupont, D.; Gerger Swartling, Å.; Johannessen, Å.; Huitema, D.; Lyth, A.; de Lourdes Melo Zurita, M.; et al. Flood Governance: A multiple country comparison of stakeholder perceptions and aspirations. Environ. Policy Gov. 2018, 28, 67–81. [Google Scholar] [CrossRef]
- Zhou, Z.; Liu, S.; Zhong, G.; Cai, Y. Flood Disaster and Flood Control Measurements in Shanghai. Nat. Hazards Rev. 2017, 18. [Google Scholar] [CrossRef]
- Shi, Y.; Zhai, G.; Zhou, S.; Lu, Y.; Chen, W.; Deng, J. How can cities respond to flood disaster risks under multi-scenario simulation? A case study of Xiamen, China. Int. J. Environ. Res. Public Health 2019, 16, 618. [Google Scholar] [CrossRef] [Green Version]
- Fewtrell, L.; Kay, D. An attempt to quantify the health impacts of flooding in the UK using an urban case study. Public Health 2008, 122, 446–451. [Google Scholar] [CrossRef] [PubMed]
- The European Parliament and the Council. Directive 2007/60/EC of the European Parliament and the Council of 23 October 2007 on the Assessment and Management of Flood Risks; OJ L 288; EU: 2007; pp. 27–34. Available online: https://www.eea.europa.eu/policy-documents/directive-2007-60-ec-of (accessed on 1 February 2022).
- Azeez, O.; Elfeki, A.; Kamis, A.S.; Chaabani, A. Dam break analysis and flood disaster simulation in arid urban environment: The Um Al-Khair dam case study, Jeddah, Saudi Arabia. Nat. Hazards 2020, 100, 995–1011. [Google Scholar] [CrossRef]
- Dewals, B.; Erpicum, S.; Detrembleur, S.; Archambeau, P.; Pirotton, M. Failure of dams arranged in series or in complex. Nat. Hazards 2011, 56, 917–939. [Google Scholar] [CrossRef] [Green Version]
- Xiong, B.; Xiong, L.; Guo, S.; Xu, C.Y.; Xia, J.; Zhong, Y.; Yang, H. Nonstationary Frequency Analysis of Censored Data: A Case Study of the Floods in the Yangtze River From 1470 to 2017. Water Resour. Res. 2020, 56, e2020WR027112. [Google Scholar] [CrossRef]
- Yang, M.; Qian, X.; Zhang, Y.; Sheng, J.; Shen, D.; Ge, Y. Spatial multicriteria decision analysis of flood risks in aging-dam management in China: A framework and case study. Int. J. Environ. Res. Public Health 2011, 8, 1368–1387. [Google Scholar] [CrossRef]
- Zhang, K.; Shen, J.; Han, H.; Zhang, J. Study of the allocation of regional flood drainage rights in watershed based on entropy weight TOPSIS model: A case study of the Jiangsu section of the Huaihe River, China. Int. J. Environ. Res. Public Health 2020, 17, 5020. [Google Scholar] [CrossRef] [PubMed]
- Nieuwenhuijsen, M.J. Green Infrastructure and Health. Annu. Rev. Public Health 2021, 42, 317–328. [Google Scholar] [CrossRef] [PubMed]
- Beaney, P. China’s Superdam: The Three Gorges Project. Environ. Politics 1995, 4, 333–336. [Google Scholar] [CrossRef]
- Huntjens, P.; Pahl-Wostl, C.; Rihoux, B.; Schlüter, M.; Flachner, Z.; Neto, S.; Koskova, R.; Dickens, C.; Nabide Kiti, I. Adaptive Water Management and Policy Learning in a Changing Climate: A Formal Comparative Analysis of Eight Water Management Regimes in Europe, Africa and Asia. Environ. Policy Gov. 2011, 21, 145–163. [Google Scholar] [CrossRef]
- Han, H. Authoritarian environmentalism under democracy: Korea’s river restoration project. Environ. Politics 2015, 24, 810–829. [Google Scholar] [CrossRef]
- Zhang, L.; Xu, Y.; Jia, J.S. Analysis of earth dam failures: A database approach. Georisk 2009, 3, 184–189. [Google Scholar] [CrossRef] [Green Version]
- Lee, T.; Jeong, C. Frequency analysis of nonidentically distributed hydrometeorological extremes associated with large-scale climate variability applied to South Korea. J. Appl. Meteorol. Climatol. 2014, 53, 1193–1212. [Google Scholar] [CrossRef]
- Rao, A.R.; Hamed, K.H. Flood Frequency Analysis; CRC Press: New York, NY, USA, 2000; p. 350. [Google Scholar]
- Hosking, J.R.M.; Wallis, J.R. Regional Frequency Analysis: An Approach Based on L-Moments; Cambridge University Press: Cambridge, UK, 2005. [Google Scholar]
- Koo, J. A discussion on the water management organization of the Korean government in the era of one water management. J. Korean Soc. Water Wastewater 2019, 33, 1–8. [Google Scholar] [CrossRef]
- Environment Missouri. Water-Related Task Plan for 2020 in the Ministry of Environment. Available online: http://www.me.go.kr/home/web/board/read.do;jsessionid=yww7ChzSTI-xtnP+vpzdY9EL.mehome1?pagerOffset=0&maxPageItems=10&maxIndexPages=10&searchKey=&searchValue=&menuId=286&orgCd=&boardId=1342740&boardMasterId=1&boardCategoryId=39&decorator= (accessed on 1 February 2022).
- BRCMA. River Basic Plan for Hwang River; Busan Regional Construction Management Administration: Busan, Korea, 2016; p. 690. [Google Scholar]
- Hu, H.H.; Walton, R. Advanced guidance on use of steady HEC-RAS. In Proceedings of the World Environmental and Water Resources Congress 2008, Honolulu, HI, USA, 12–16 May 2008. [Google Scholar]
- Rivera, S.; Hernandez, A.J.; Douglas Ramsey, R.; Suarez, G.; Rodriguez, S.A. Predicting flood hazard areas: A SWAT and HEC-RAS simulations conducted in aguan river basin of honduras, central America. Am. Soc. Photogramm. Remote Sens. ASPRS 2007, 2, 594–603. [Google Scholar] [CrossRef]
- Shelley, J.; Parr, A.D. Using HEC-RAS hydraulic design functions for geomorphic channel design and analysis. In Proceedings of the World Environmental and Water Resources Congress 2009: Great Rivers, Kansas City, MO, USA, 17–21 May 2009; pp. 3722–3731. [Google Scholar]
- Thomas, I.M.; Williams, D.T. Common modeling mistakes using HEC-RAS. In Proceedings of the 2007 World Environmental and Water Resources Congress: Restoring Our Natural Habitat, Tampa, FL, USA, 15–19 May 2007. [Google Scholar]
- Lempérière, F. Dams and Floods. Engineering 2017, 3, 144–149. [Google Scholar] [CrossRef]
- ICOLD. Lessons From Dam Incidents; Complete Edition; International Commission on Large Dams: Paris, France, 1974; p. 1069. [Google Scholar]
- ICOLD. Dam Failures—Statistical Analysis, Bulletin 99; Technical Report; International Commission on Large Dams: Paris, France, 1995; Available online: https://www.icold-cigb.org/GB/publications/bulletins.asp?IDA=81 (accessed on 1 February 2022).
- ICOLD. Dams Less than 30 m High—Cost Savings and Safety Improvements, Bulletin 109; Technical Report; International Commission on Large Dams: Paris, France, 1998; Available online: https://www.icold-cigb.org/GB/publications/bulletins.asp?IDA=91 (accessed on 1 February 2022).
- ICOLD. Dam Break Floods—Cost Savings and Safety Improvements, Bulletin 111; Technical Report; International Commission on Large Dams: Paris, France, 1998; Available online: https://www.icold-cigb.org/GB/publications/bulletins.asp?IDA=93 (accessed on 1 February 2022).
- ICOLD. Dams and Floods—Guidelines and Case Histories, Bulletin 125; Technical Report; International Commission on Large Dams: Paris, France, 2003; Available online: https://www.icold-cigb.org/GB/publications/bulletins.asp?IDA=107 (accessed on 1 February 2022).
Figure 1.
Flowchart of the applied analysis in the current study including the employed data information.
Figure 1.
Flowchart of the applied analysis in the current study including the employed data information.
Figure 2.
Map of the study area (Hwang River Basin, (
b)) over South Korea (
a). The basin is separated into two parts: the upper part of the HCD and the downstream part of the HCD, as shown on the right side. Two dots indicate the locations of the Geochang weather station (GS) and the Hapcheon weather station (HS), while the trapezoid represents the Hapcheon Dam (HCD). Note that the coordinate of the center of South Korea is 35.9078° N and 127.7668° E, while the one of HCD is 35.5315° N and 128.0315° E. Further detailed geological coordinate information can be seen in
Figure 3.
Figure 3.
Daily rainfall for the Hwang River basin. Note that two weather stations (Hapcheon and Geochang) are presented as well as the location of the HCD.
Figure 3.
Daily rainfall for the Hwang River basin. Note that two weather stations (Hapcheon and Geochang) are presented as well as the location of the HCD.
Figure 4.
Time series of (a) hydrologic conditions and management of the Hapcheon Dam during the flood event of August 2020 including the precipitation of the GS and (b) flood damage occurrence along with the Hapcheon dam outflow (m3/s, filled polygon with the right axis for scale). The straight dashed line and dash-dotted line present the top height of the Hwang River bridge (HRB) levee and the flood water level, respectively. The two thick solid lines present the water level (see the left side for Y-axis) and the flow amount (refer to the right side for Y-axis). Note that the gray polygon on the right side of the panel (a) presents the height of the HCD.
Figure 5.
Flood inundation area (a) and flood depth (b) from the 2020 flood event. Note that the light blue indicates the submerged area inside the Hwang River while the orange color area indicates the inundated area from the current 2020 flood event.
Figure 5.
Flood inundation area (a) and flood depth (b) from the 2020 flood event. Note that the light blue indicates the submerged area inside the Hwang River while the orange color area indicates the inundated area from the current 2020 flood event.
Figure 6.
IDF curve for different durations (1, 2, 3, 4, 6, 9, 12, 15, 18, 24, 48, and 72 h) and different return periods (2, 5, 10, 20, 30, 50, 80, 100, 200 years) of the GS (a) and HS (b) stations. Note that the estimated intensities of the current 2020 flood event are depicted with the red diamond markers.
Figure 7.
Time series of annual maximum inflow and outflows of the Hapcheon Dam (a) and flood frequency analysis of the annual maximum inflow (b) for the Hapcheon Dam region. The fitted distribution (dotted line with circle) is the Gumbel distribution, and a PWM is employed to estimate the parameters of the distribution. The empirical distribution of the historical annual maximum inflow is shown with the solid line and cross marker.
Figure 8.
Dam water levels (top) and cumulative outflow volumes (bottom) of the Hapcheon Dam for each year (from 2000 to 2020). Note that the 2019 data are presented with the thick blue dash-dotted line, and the 2020 data are presented with the thick red solid line. Note that the lines of 2003 and 2012 were thickened for better illustration of the critical typhoon events such as Maemi and Sanba.
Figure 9.
Hydrologic conditions and dam management during historical floods for (a) Maemi and (b) Sanba. Note that the gray polygon on the right side represents the height of the HCD, and the GS data on the precipitation are applied.
Figure 9.
Hydrologic conditions and dam management during historical floods for (a) Maemi and (b) Sanba. Note that the gray polygon on the right side represents the height of the HCD, and the GS data on the precipitation are applied.
Figure 10.
Simulated water level with changing initial water level and/or outflow. (
a) Outflow is limited to 500 m
3/s when the outflow exceeded 500 m
3/s in the 2020 event (refer to
Table S3 in Supplementary Materials), with the same initial water level; (
b) the initial water level is changed to 155 m and the outflow is limited to 500 m
3/s when it exceeded 500 m
3/s in the 2020 flood event; (
c) between 30 July and 7 August, 300 m
3/s outflow is achieved, since 300 m
3/s was designated from the ME in advance and the outflow is limited to 500 m
3/s when it exceeded 500 m
3/s in the 2020 flood event. Note that the gray polygon on the right side represents the height of the HCD and the GS data on precipitation are employed.
Figure 11.
Geographical map (a) for HEC-RAS and simulated water levels by varying the flood water level of the HCD for (b) levee of Nakmin Stream and (c) levee near Kiri village with the observational water level during the 2020 flood event.
Figure 11.
Geographical map (a) for HEC-RAS and simulated water levels by varying the flood water level of the HCD for (b) levee of Nakmin Stream and (c) levee near Kiri village with the observational water level during the 2020 flood event.
Table 1.
Flood damage information due to the 2020 flood event. Note that the spatial areas for the indices (A–M) in the second column are presented in
Figure 5.
Table 1.
Flood damage information due to the 2020 flood event. Note that the spatial areas for the indices (A–M) in the second column are presented in
Figure 5.
| Location | Index | Flood Depth (m) | Flood Area (km²) | Time | Flood Reason |
|---|
| Nakmin | Doosa Br | A | 3.22 | 0.33 | 16:00 | Levee break from overflow |
| Nakmin Levee | B | 2.82 | 16:00 |
| Yulgok Road | C | 1.89 | 17:00 |
| Guntae village | Guntae village | D | 1.60~2.30 | 0.39 | 17:30 | Backflow in drainage from HWL |
| Guntae Levee | Sangsin stream outlet | E | 7.00 | 17:30 | Levee break from piping with HWL |
| Drainage Pump station | F | 2.55 | 17:30 |
| Daol Farm | G | 3.03 | 17:30 |
| Kiri village | Barn | H | 1.00 | 0.25 | 9:00 | Flooded from low levee height |
| Rice Field | I | 1.83 | 9:00 |
| Naecheon village | J | 4.14 | 0.63 | 14:00 |
| Hwang River Sports Complex | K | 1.00 | 0.135 | 11:00 | Inundation from HWL of Hwang River |
| Yuljin village | L | 1.00~1.50 | 0.41 | 17:00 | Flood with no Drainage Pump and HWL |
| Moonlim village | M | 2.56 | 0.35 | 14:00 |
Table 2.
Maximum precipitation of the 2020 flood event.
Table 2.
Maximum precipitation of the 2020 flood event.
| | | Geochang | Hapcheon |
|---|
| Dur (h) | Dur (min) | Max Precip of 2020 (mm) | Return Period (Years) | Max Precip. of 2020 (mm) | Return Period (Years) |
|---|
| 1 | 60 | 22.4 | 1.2 | 34.9 | 2.1 |
| 2 | 120 | 37.3 | 1.4 | 45.3 | 1.6 |
| 3 | 180 | 51.5 | 1.7 | 55.7 | 1.6 |
| 4 | 240 | 61.4 | 1.9 | 72.1 | 2 |
| 6 | 360 | 76.3 | 2 | 89.2 | 2.2 |
| 9 | 540 | 112.8 | 3.8 | 126.3 | 3.5 |
| 12 | 720 | 148.5 | 7.5 | 144.7 | 3.9 |
| 15 | 900 | 161.8 | 7.9 | 173.9 | 6 |
| 18 | 1080 | 171 | 7.4 | 199.8 | 8.2 |
| 24 | 1440 | 197.1 | 9 | 248.7 | 14.5 |
| 48 | 2880 | 283.3 | 29.2 | 283.7 | 13.3 |
| 72 | 4320 | 316.7 | 29.6 | 326.7 | 19.3 |
| Publisher’s Note: MDPI stays neutral with regard to jurisdictional claims in published maps and institutional affiliations. |
© 2022 by the authors. Licensee MDPI, Basel, Switzerland. This article is an open access article distributed under the terms and conditions of the Creative Commons Attribution (CC BY) license (https://creativecommons.org/licenses/by/4.0/).


