Article

Roles of Economic Development Level and Other Human System Factors in COVID-19 Spread in the Early Stage of the Pandemic

1
Center for Global Change and Earth Observations, Michigan State University, East Lansing, MI 48823, USA
2
School of Planning, Design and Construction, Michigan State University, East Lansing, MI 48824, USA
3
Department of Geography, Environment & Spatial Sciences, Michigan State University, East Lansing, MI 48824, USA
*
Author to whom correspondence should be addressed.
Sustainability 2022, 14(4), 2342; https://doi.org/10.3390/su14042342
Submission received: 31 January 2022 / Revised: 5 February 2022 / Accepted: 14 February 2022 / Published: 18 February 2022
(This article belongs to the Special Issue Global Environmental Health and Safety)

Abstract

:
We identified four distinct clusters of 151 countries based on COVID-19 prevalence rate from 1 February 2020 to 29 May 2021 by performing nonparametric K-means cluster analysis (KmL). We forecasted future development of the clusters by using a nonlinear 3-parameter logistic (3PL) model, and found that peak points of development are the latest for Cluster I and earliest for Cluster IV. Based on partial least squares structural equation modeling (PLS-SEM) for the first twenty weeks after 1 February 2020, we found that the prevalence rate of COVID-19 has been significantly influenced by major elements of human systems. Better health infrastructure, more restriction of human mobility, higher urban population density, and less urban environmental degradation are associated with lower levels of prevalence rate (PR) of COVID-19. The most striking discovery of this study is that economic development hindered the control of COVID-19 spread among countries in the early stage of the pandemic. Highlights: While richer countries have advantages in health and other urban infrastructures that may alleviate the prevalence rate of COVID-19, the combination of high economic development level and low restriction on human mobility has led to faster spread of the virus in the first 20 weeks after 1 February 2020.

1. Introduction

After the first recorded outbreak in Wuhan, China, in December 2019, COVID-19 spread rapidly and became a global pandemic that significantly changed many aspects of the earth, societies, and people. By 15 November 2021, there were more than 253.2 million confirmed cases associated with over 5.1 million deaths (WHO Coronavirus Dashboard at http://covid19.who.int, accessed on 19 November 2021). By that date (15 November 2021), America, Europe, and Southeast Asia were the most severely affected regions based on accumulated number of cases of 95.1 million, 81.2 million, and 44.3 million, respectively, and deaths of 2.3 million, 1.5 million, and 0.7 million, respectively.
While the medical community has been actively investigating the underlying mechanisms of the pandemic and has been developing vaccines, the general public, aided by the available data and reporting of the media, became aware of differences in pandemic severity among global nations. These differences are often attributed to disparities in human systems at the national level, including health infrastructure, socioeconomic status, built environment characteristics, cultural attitudes, and institutional actions such as government initiatives and policies on restrictions on mobility [1,2,3,4,5]. Despite the urgent need and its extremely relevant policy implications, there are only a few research publications devoted to human system determinants of virus spread at the global scale [1,4,5]. Published results on this topic are often small in geographic scope, e.g., 42 Asian countries [1], England and Wales [2], or 401 counties in Germany [3]. Even for investigations with a global scope, the findings are constrained by methodologies (i.e., correlation regression analysis, Bayesian model averaging) that are ineffective at revealing the complicated relationships among COVID-19 and multiple determinants, although they provide a preliminary base for understanding the possible human system determinants for COVID-19 spread. A preliminary study conducted by Stojkoski et al. [4] examined 31 socioeconomic factors to identify explanatory variables by using Bayesian model averaging on 106 countries. Hassan et al. [5] performed correlation and multivariate multinominal logistic regression analysis on mostly demographic factors (economic status, population density, the median age of the population, and urban population rate) for COVID-19 on 163 countries. The only economic factor was a categorical variable showing the country’s economic status based on GDP as “high income,” “upper-middle income,” “lower-middle income,” or “low income”. However, our understanding can be further improved by examining the trends of different clusters and capturing complicated relationships among the prevalence rate of COVID 19 and multiple major determinants of human systems.
As global society is confronted with one of its most serious challenges since World War II, it is urgent to advance our scientific knowledge to understand the distinctions among countries for development dynamics and on human system determinants of the pandemic. This paper has two specific objectives: (1) to understand and predict the dynamic evolution of the pandemic at the global level based on the data on confirmed cases in 151 countries from early in the pandemic, 1 February 2020, when data became available daily, to 29 May 2021; and (2) to identify and quantify the co-evolved interrelationships between key human system forces for COVID-19 for the first 20 weeks after 1 February 2020. We combined a wide range of data sources and used different methods to achieve our objectives. To diagnose the dynamic evolution of COVID-19 cases at the country level, we first applied cluster analysis to divide the 151 countries based on prevalence rate (PR) trajectory into four distinct groups; we then made predictions of the future for each country using a nonlinear 3-parameter logistic (3PL) model.
To disentangle the co-evolved interrelationships between key human forces and COVID-19 severity, we challenged ourselves with the following question: What are the interdependent relationships among factors affecting COVID-19 spread, including key human system elements? We sought answers through partial least squares structural equation modeling (PLS-SEM) by hypothesizing various casual relationships and feedbacks between the potential determinants and the prevalence rate (PR) of COVID-19. While there may be other important components such as cultural differences and implementation of social distancing regulations, we identified the following four major factors of human systems due to their measurability and widely acknowledged influences on COVID-19: health infrastructure, economic development level, institutional mechanisms, and built environment. Details are provided in the next section, “Data and Methods”, on the cluster analysis, 3PL modeling, and PLS-SEM.

2. Data and Methods

In this paper, we relied on a wide range of global data sources on COVID-19, including data on health infrastructure, economic development, institutional mechanisms, and urban built environments (Please see the Appendix A for data source and other details). In the following four subsections, we described the COVID-19 data and processing, cluster analysis on COVID-19 prevalence trajectory, 3-parameter logistic modeling (3PL) for trajectory forecasting, and partial least squares structural equation modeling (PLS-SEM) for key determinants of the human system on COVID-19.

2.1. COVID-19 Data and Processing

We used John Hopkins University’s data depository for COVID-19 [6] to derive the cumulative weekly cases for each country. In epidemiology, prevalence is defined as the proportion of a population who have the disease or health condition at a specific time period [7]. The weekly prevalence rate of COVID-19 was calculated for the targeted countries for our study period of 70 weeks (the week of 1 February 2020, to the week of 29 May 2021) by the following formula:
PC19 = (Nweek/Pop) × 105
where
PC19 = prevalence of COVID-19
Pop = population of targeted country
Nweek = number of weekly confirmed cases
We considered all 193 UN countries in our analysis. Some countries had late pandemic spread, were delayed in reporting official cases, or had trajectories containing a few missing values in the early weeks. We excluded countries with more than ten consecutive missing values from our analysis. In addition, we also excluded countries with populations smaller than one million, resulting in a total of 151 countries in our analysis. We conducted the weekly prevalence trajectory analysis for the study period from 1 February 2020 to 29 May 2021. We also explored the impacts of human system drivers on prevalence in the early stage of the outbreak for the first 20 weeks, i.e., the weekly data of the first reported cases of each country starting from 1 February 2020, by using PLS-SEM.

2.2. Cluster Analysis on COVID-19 Prevalence Trajectories

Clustering is an unsupervised method that partitions a set of data points based on their similarities [8]. Our aim in this study is to determine homogenous PR trajectories of countries; these were measured in different time periods. Keeping this in mind, we performed partitional clustering and nonparametric K-means cluster analysis (KmL) to identify the distinct, homogenous clusters of countries based on COVID-19 prevalence trajectories [9]. The K-means algorithm is based on the Euclidean distance metric, and this method was adopted for clustering longitudinal data in the R package KmL. K-means tries to find a partition that the minimizes within-group distance metric. We chose the KmL algorithm over other approaches because this nonparametric hill-climbing approach requires no assumptions about the forms of longitudinal trajectories or regarding the distributions of the observations [10]. It can handle missing values and it is simple to execute the algorithm several times by altering the starting conditions. Its graphical user interface assists the user in selecting the appropriate number of clusters. The KmL analysis was specified to allow 2 to 5 cluster structures, with each obtained by running 500 permutations. The Calinski–Harabasz criterion is widely used in KmL as the primary selection criterion along with two other criteria (e.g., Ray and Turi, and Davis and Bouldin). However, it has been reported that it is not necessarily the appropriate method for identifying a true cluster number [11]. In this study, the optimal 4-cluster solution was chosen based on Calinski–Harabasz criterion value and researcher judgement [10]. Longitudinal analyses were conducted using R Studio and R version 4.0.2 provided by R Foundation for Statistical Computing, Vienna, Austria (22 June 2020) (https://www.r-project.org/foundation/, accessed on 14 August 2021).

2.3. Logistic Model (3PL) for Trajectory Forecasting

To understand and explain the spread of the pandemic, we analyzed the prevalence trajectory of clusters of countries by using a nonlinear 3-parameter logistic model because of its ability to capture the dynamics of the prevalence of the pandemic. A logistic function or logistic curve is known as an S-curve, and it has been widely used in disciplines such as statistics, economics, and epidemiology [12]. The function was developed by Verhulst [13] to describe the growth rate equation of a population by adjusting the exponential model. Logistic growth is defined by the following differential equation:
d P t / d t = r P t 1 P t / K
where P(t) represents population size at time t, r   and K   indicate the intrinsic growth rate and carrying capacity of the environment, respectively. The value of 1 P t / K is close to 1 when the P value is small compared to K and close to 0 when the P value approaches K. Thus, as long as P << K, the population grows exponentially then begins to stop gradually as the population approaches the maximum value (when P = K).
Rearranging Equation (2), we get Equation (3), as follows:
d P t / P t K P = r / K d t
For the specific boundary condition, we can consider P0 as the population at time t = 0.
The solution of Equation 3 can be expressed as,
P(t) = K/(1 + e−rt(K − P0)/P0)
The shape of this solution is often defined as sigmoid shaped or S shaped with a symmetrical slope or peak time for the value of
tp = (log(K − P0))/P0r
In this study, P t represents the prevalence rate of COVID-19 (number of confirmed cases per 105 population) at a certain time t ; the parameter r thus represents the growth rate of P(t), whereas K here stands for the maximum prevalence rate at the end of the endemic period, where further growth is negligible.

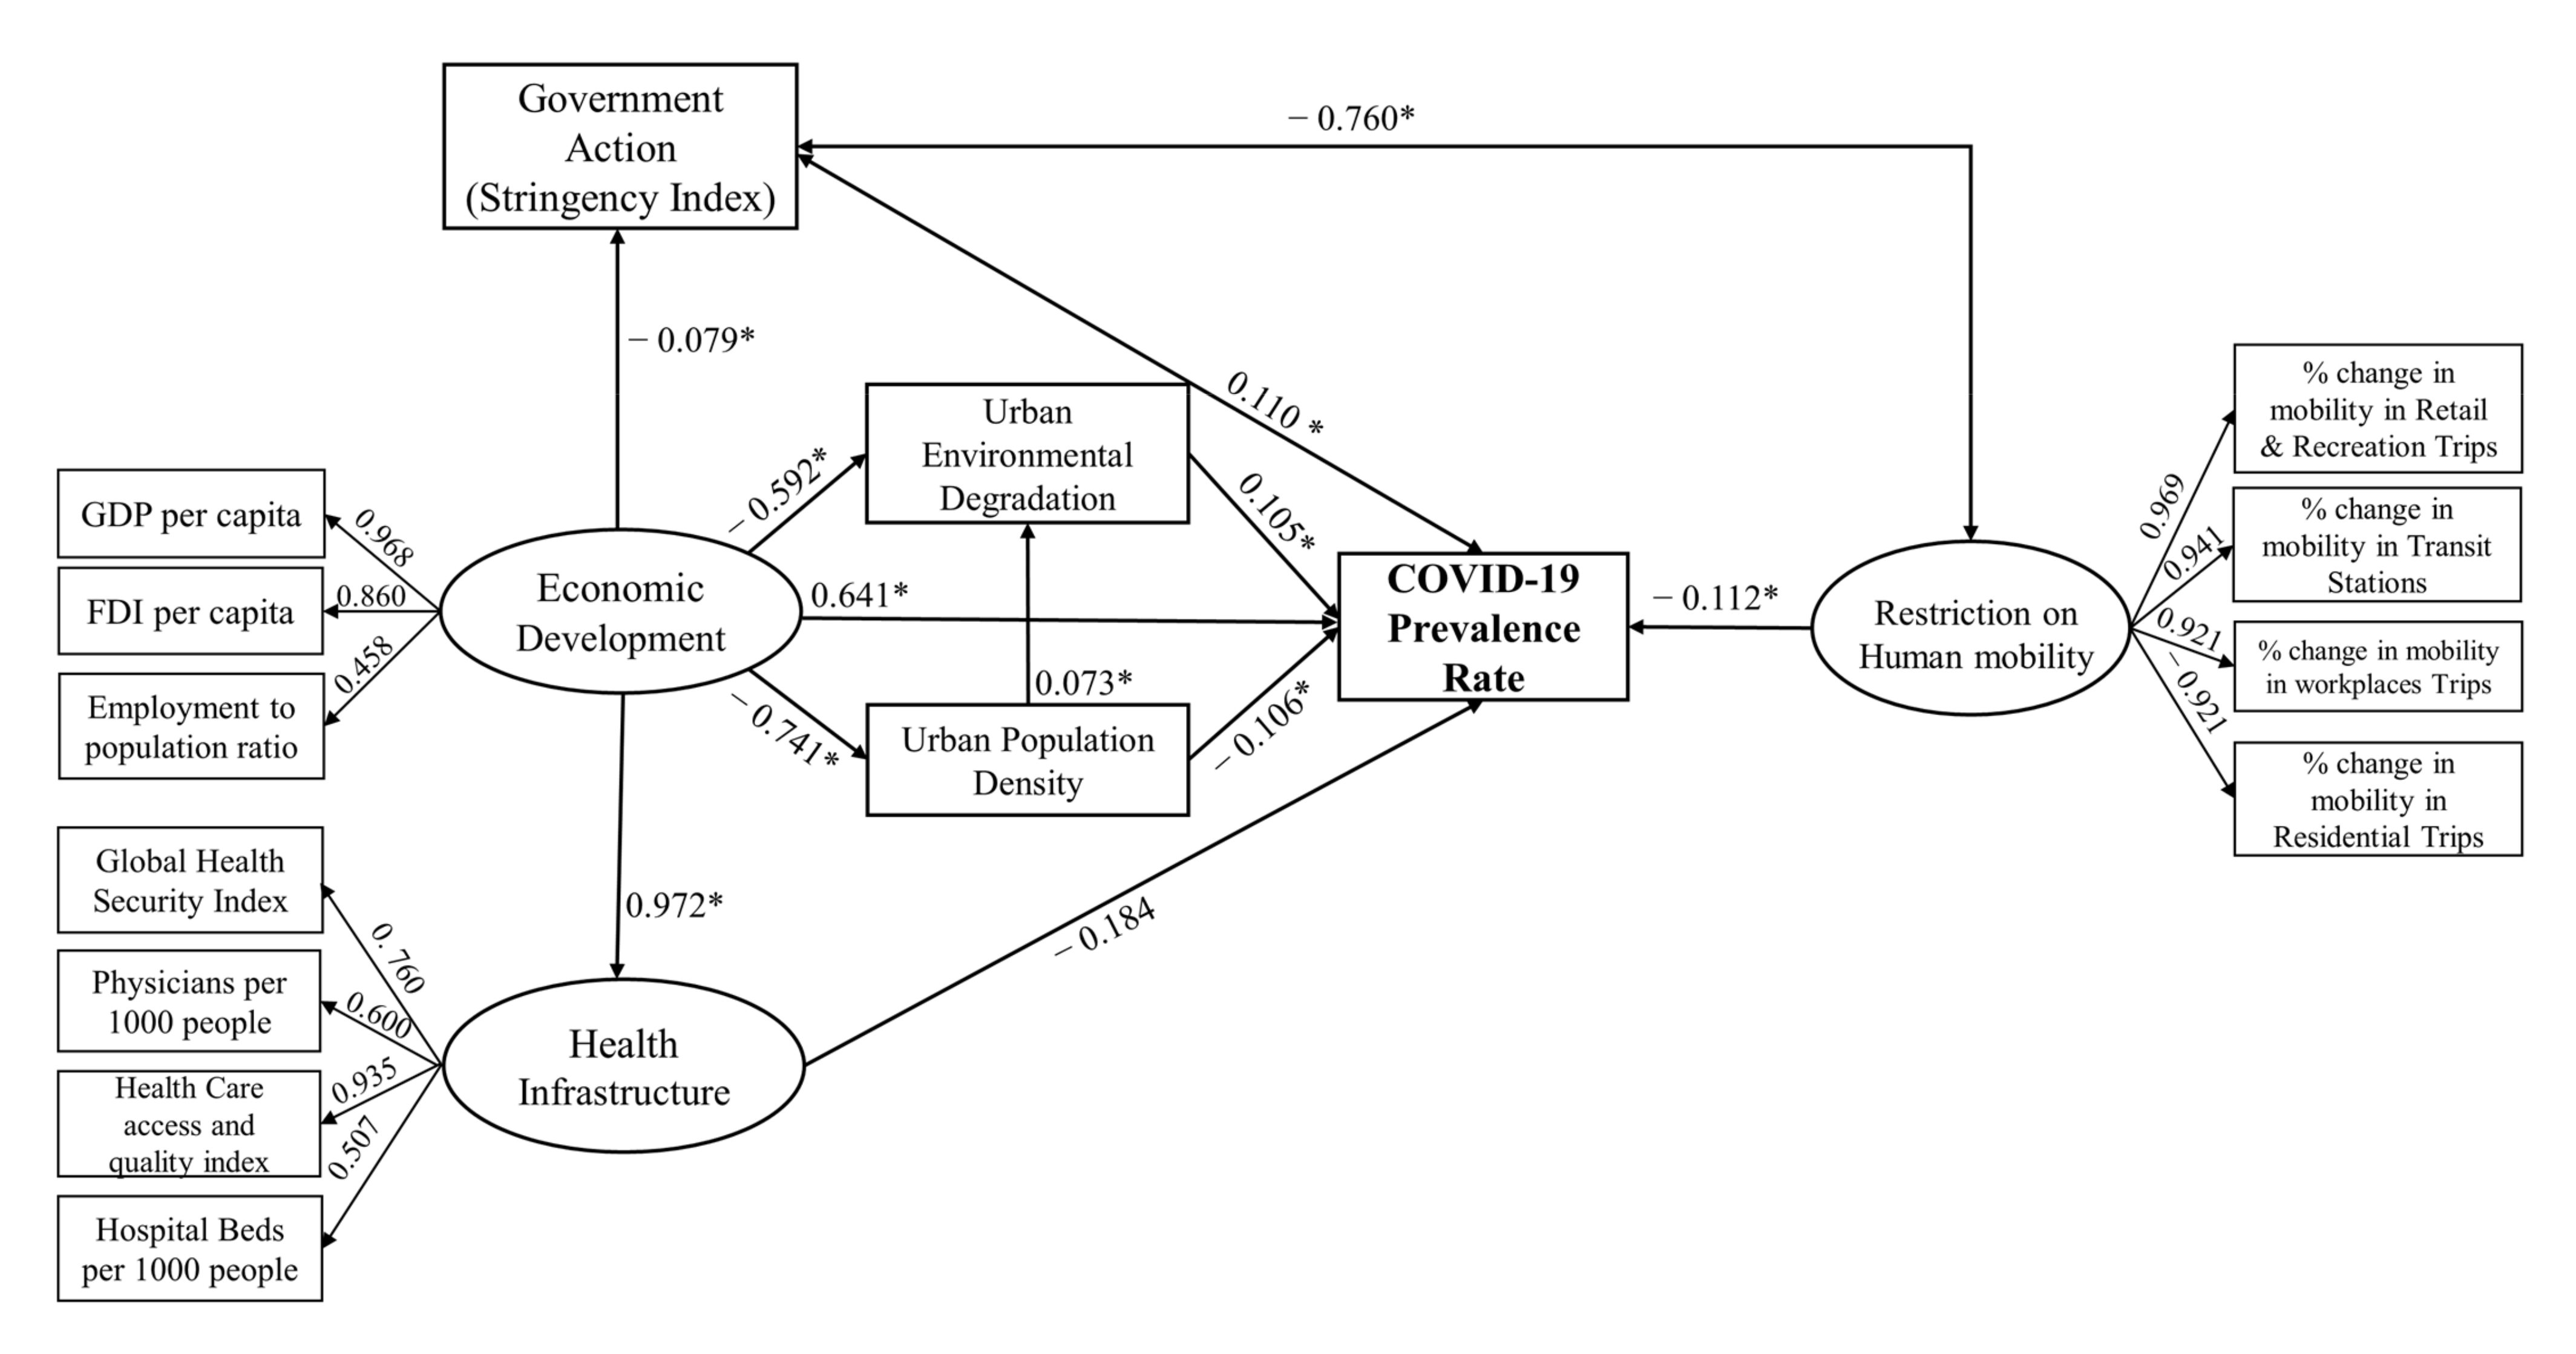
2.4. Key Human System Factors for COVID-19 Infections

Partial least squares structural equation modeling (PLS-SEM) can be used to understand the complex relationships between COVID-19 and key factors of human systems. Structural equation modeling (SEM) has been widely used to quantify the complicated relationships among multiple factors [14,15,16,17]. With small and non-normally distributed data, PLS-SEM can be used to conduct exploratory research [16]. We hypothesized that health infrastructure, economic development level, institutional mechanism, and urban built environment have all impacted the spread of COVID-19. Elements of the model are either directly observable or latent variables based on multiple selected variables. In addition to their interrelationships with the PR of COVID-19, inter-relationships between key factors of human systems are also modeled. For example, we hypothesize that economic development level may have a positive impact on built environment, institutional mechanism, and health infrastructure.
Health infrastructure, including health facilities measured by hospital beds per thousand people and health care professionals such as physicians per thousand people, as well as COVID-specific health care such as quarantine and testing facilities, personal protective equipment (PPE) kits, and ambulances, have been identified as significant factors affecting the spread of the virus [4,18,19]. In this study, we incorporated health infrastructure as one of the key human system elements to be examined. Health infrastructure is modeled by four variables that are widely acknowledged as indicators of the quality of the health care system, i.e., Global Health Care Security Index (GHSI), physicians per 1000 people, health care access and quality index, and hospital beds per 1000 people.
While economic development level has often been associated with health outcomes, it has been argued that few health benefits arise from further economic growth after a country achieves a certain threshold level of development [4]. A more egalitarian society with a developed economy often has better health outcomes than a country with a similar development level but with greater disparities in income distribution [20]. Furthermore, a higher development level is usually associated with a more globally integrated economy, which implies more interactions through trade, investment, and movement of people, which may facilitate the transmission of disease [21,22,23,24,25]. A previous study showed mixed results so far on economic development level and COVID at a global scale. There is negligible evidence that GDP per capita is a true determinant of COVID outcome [4]. However, it has been revealed that a country’s economic status, i.e., being in high-income, upper-middle-income, lower-middle-income, or low-income categories, can have a significant influence on case attack rate, case fatality rate, and case recovery rate [5]. In general, lower-income countries are more likely to have a higher risk in case of attack rate and recovery rate compared to that of higher-income countries [5]. Patel et al., in an open letter to the editor of Public Health, suggested that policy makers take socioeconomic factors into consideration and particularly understand that people with a low socioeconomic status tend to be more vulnerable due to increased exposure caused by limited financial resources and overcrowded accommodations [26]. We consider economic development an important element of the pandemic and treat it as an important latent variable. In our model, it is a latent variable based on three observable variables, i.e., GDP per capita, foreign direct investment (FDI) inflows per capita, and employment rate. The data are available through the World Development Indicator [27].
Institutional mechanisms and their consequent outcomes according to different levels of implementation are probably the most controversial piece in the human system, as government actions may arouse great public debate and ignite sentiments from different sectors of the society. As person-to-person contact, public transport use and exposure to public gatherings have been identified as primary sources of COVID-19 spread [28], social distance, isolation, quarantine, and lockdowns have been implemented as key measures by different countries/cities following the guidelines of the World Health Organization, e.g., 43 countries [29], China [30], and India [31,32]. The resulting population movement was found to be responsible for virus spread at different spatial levels, i.e., the international level (travelers from Arab countries visiting Iran [18]), within Asian countries [1], and citywide in China [33].
Here we used two variables to represent government actions and the consequences of the movement of people: one is the government stringency index to represent the institutional factor, which measures the degree of stringency of government policies; the other is the latent variable on restrictions of mobility as a result of government actions, reflected by four measurable variables (% change in mobility for retail and recreational trips, through transit stations, on workplace trips, and between residential areas, respectively). The Oxford COVID-19 Government Response Tracker [34] developed a common stringency index (with values ranging from 1 and 100, with 100 as the strictest) based on eleven sub-indicators that reflect the level of policy measures that governments from various countries have taken to tackle the spread of the pandemic on a daily basis. Change in human mobility is modeled as a latent variable based on four variables: % of change in mobility in (1) retail and recreation trips, (2) transit stations, (3) workplace trips, and (4) residential trips. The data were acquired from the COVID-19 Community Mobility report generated by Google based on comparing changes in the daily number of visitors to the baseline [35]. The baseline value is the median value from a 5-week period (3 January to 6 February 2020). This report is composed of different categories of visits and length of stay at different places (retail and recreation facilities, grocery and pharmacy shops, parks, transit stations, workplaces, and residential areas) and is calculated as change percentages compared to the baseline. Increases in movement in residential and park categories are associated with decreased mobility, as these categories indicate activities in residential areas. Because the definition of trips to the grocery store and pharmacy as well as parks varies with location, we excluded these two categories from our analysis to maintain consistency.
Finally, we incorporated urban built environment, mainly reflected by urban population density and urban environment degradation, as an important determinant for human systems. While population density has been identified as being influential for affecting virus spread [4,5,36], we consider the urban population density, rather than the overall population density, to be a better indicator, as urban areas provide the main challenges to the social distancing and isolation that are needed to prevent the spread of COVID-19, although so far there have been mixed findings on associations between urban population density and the spread of the virus in different countries [37,38]. In addition to urban population density, urban environmental quality has often been associated with the health of residents [39] and it serves as a deterrent to the spread of infectious disease, including COVID-19 [40,41]. We use urban air pollution to reflect the degree of urban environment degradation, particularly due to the evidence that poor air quality increases the death rate and confirmed cases of COVID-19 [41]. The data of urban population density and area of urban centers in each country were obtained from (https://ghsl.jrc.ec.europa.eu/CFS.php, accessed on 15 June 2021). Based on GHS-Built, an urban center is comprised of 1 km2 continuous grid cells and has at least 50% of built-up with a minimum population density of 5000 inhabitants per km2 [42]. Additionally, we used the estimated annual average population weighted concentration of PM2.5 (in µgm−3) for urban areas as an indicator of urban environmental degradation [43].

3. Results

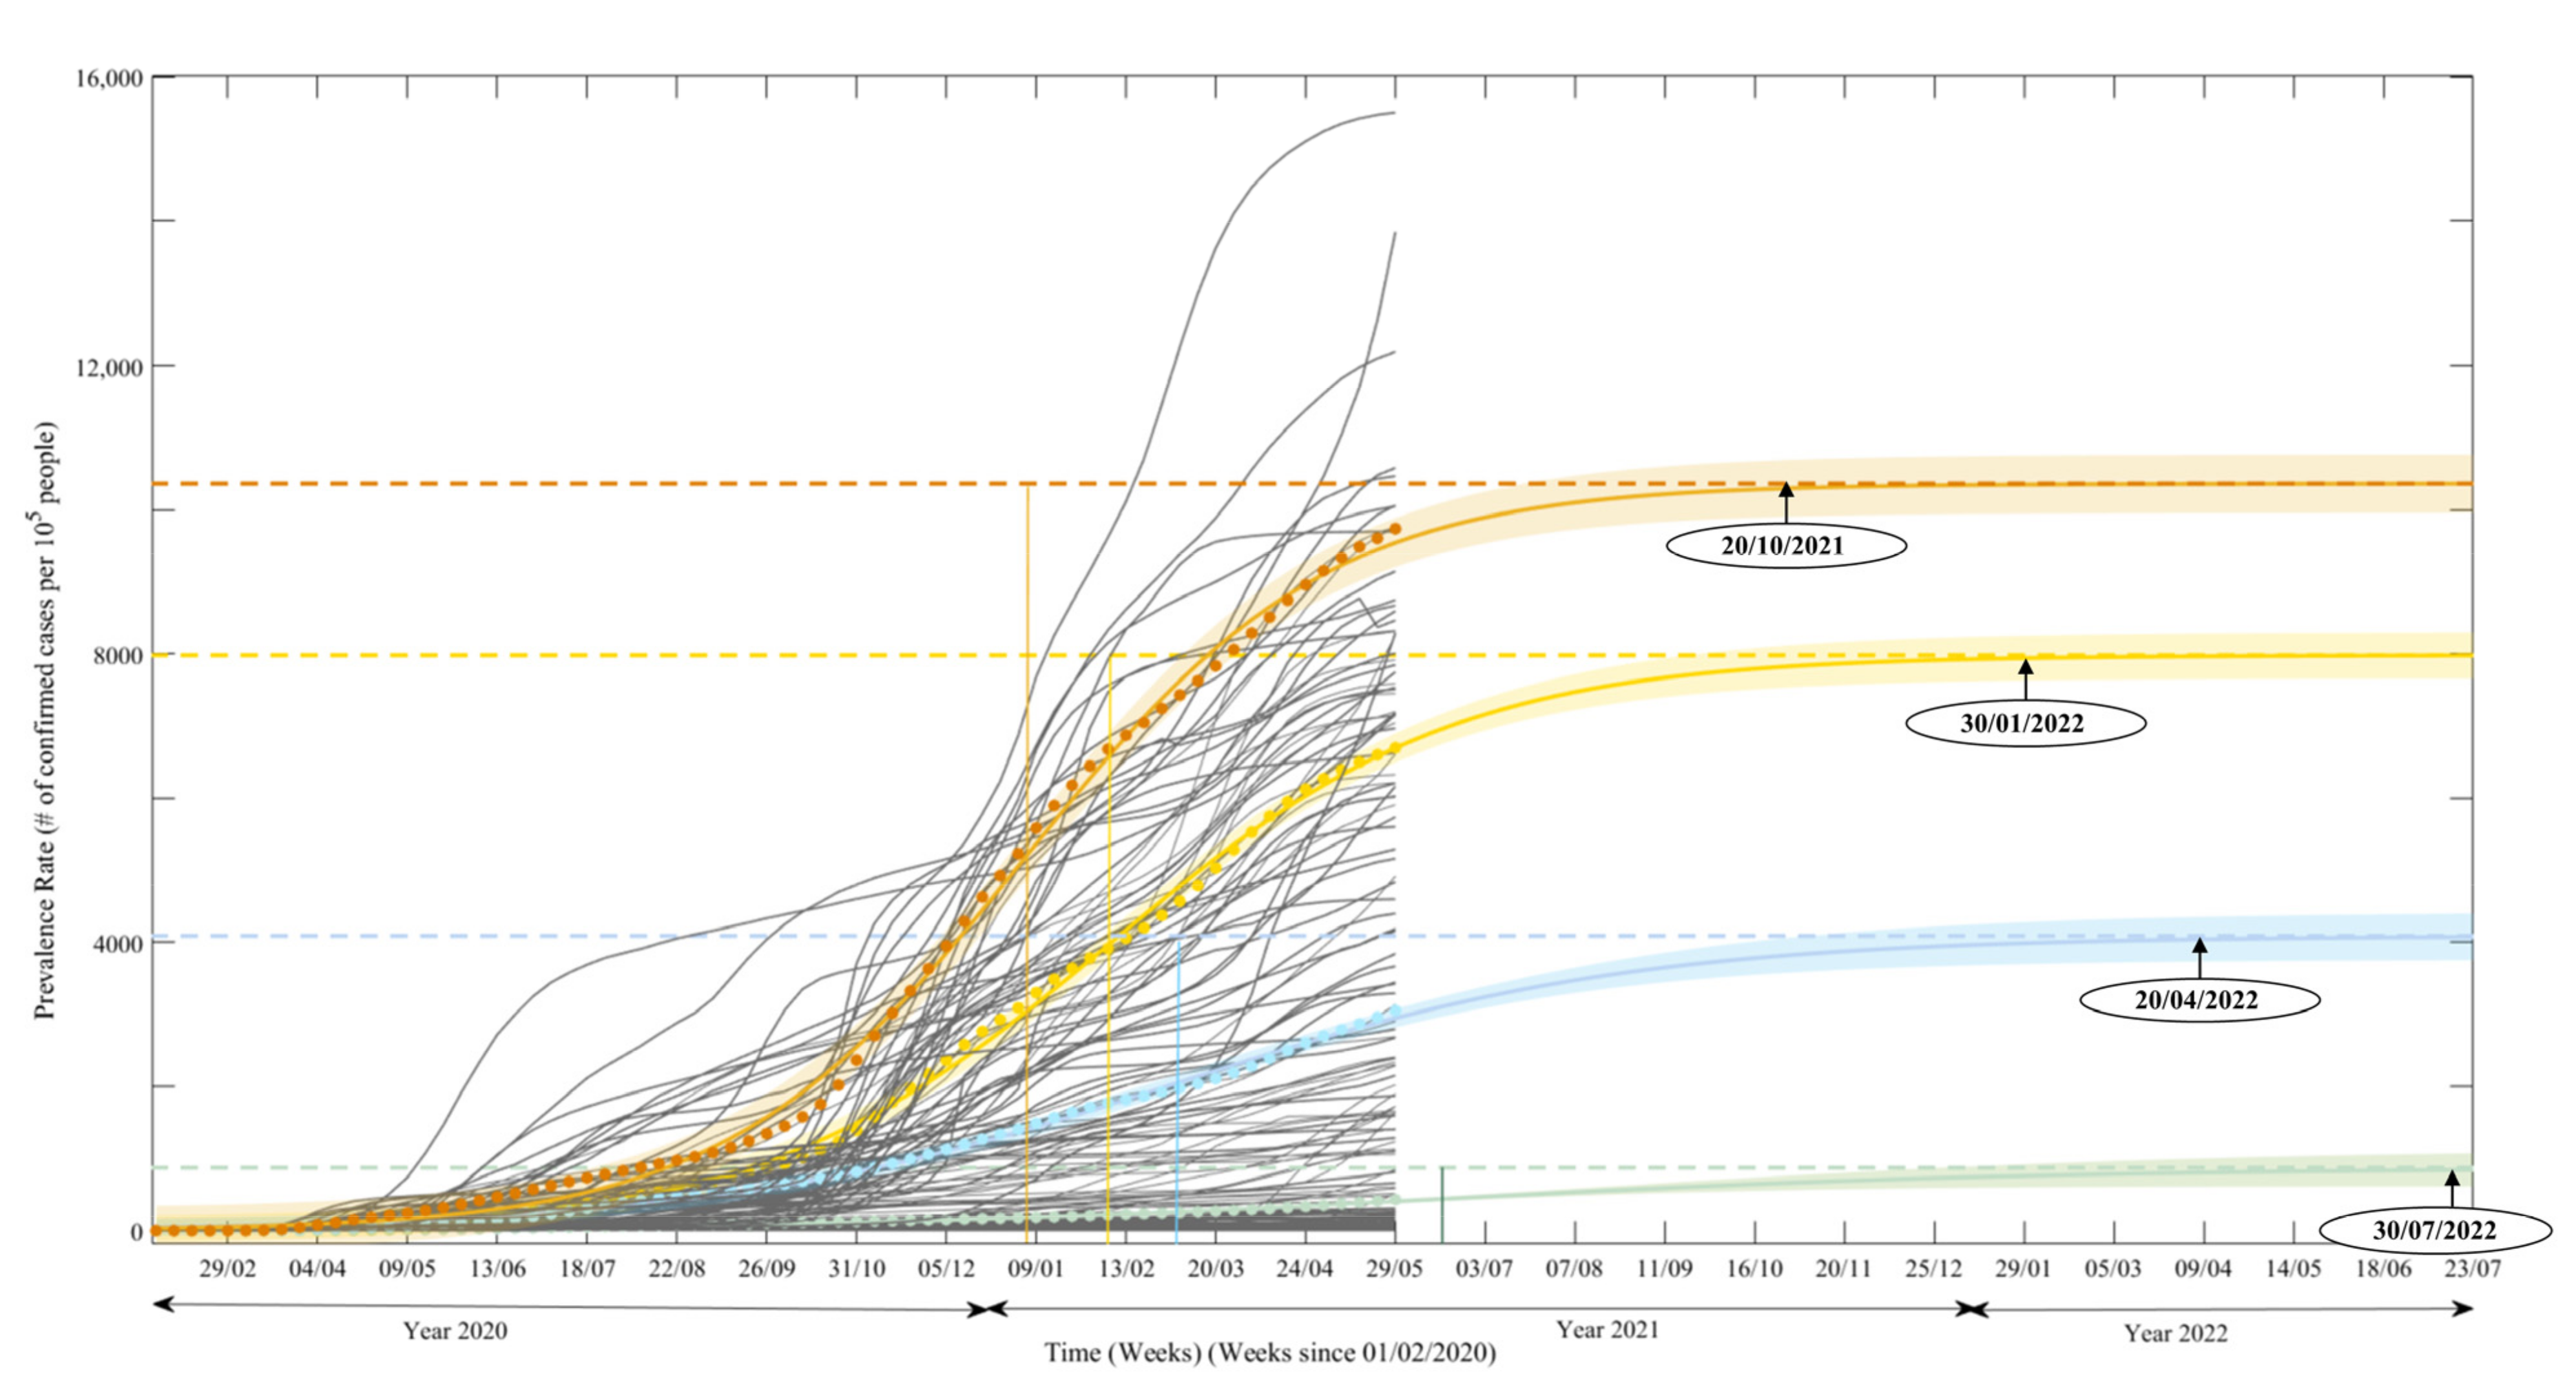
3.1. Clustered Countries by COVID-19 Infections

Four distinct clusters of countries were identified based on the PR (number of confirmed cases per 105 people) of COVID-19 during 1 February 2020–29 May 2021 (Figure 1, Table 1 and Table 2). Cluster I (green color) had the slowest spread speed of the virus, as reflected by the flattest slope of the fitted line and the lowest PR among the four clusters. It reached a low level (<434 people per 105 people on average) by the end of the study period. This cluster includes 76 countries: 39 from Africa, 25 from Asia, 1 from Europe, 7 from Central America, 3 from Oceania, and 1 from South America (Figure 2, Table 2). It is worth noting that India ranked low and experienced a slow increase in PR, in contrast to the common perception that the country had a very severe spread of COVID-19 (ranked second in total confirmed cases and deaths during the study period, only after the USA). Cluster IV (orange color) is the opposite of Cluster I in terms of the level of PR and its development trend; it had the fastest spreading speed and the highest PR among the four clusters. In particular, at the inflection (turning point) of the 49th week, its PR increased dramatically, reflected by the extremely steep slope of the fitted line. Nineteen countries fell in this category: 5 in the Middle East of Asia, 12 in Europe, 1 in North America (USA), and 1 Central America (Panama). Clusters II and III are the intermediate groups between the extreme clusters of I and IV, with Cluster II having a flatter slope in the trend line than Cluster III. Cluster II had moderate (the second slowest) spread speed and moderate PR (the second lowest) among the four clusters. With a total of 27 countries, Cluster II (blue color) includes 7 in Africa, 7 in Asia, 5 in Europe, 1 (Canada) in North America, 3 in Central America, and 4 in South America. Cluster III had substantial spread speed of the virus and a considerable PR within the four clusters. With a total of 29 countries, Cluster III (yellow color) includes 6 in Asia, 17 in Europe, 1 in Central America, and 5 in South America.

3.2. The Near Future of Prevalence Rate

Predicting COVID-19 PR is challenging due to the unclear origins and transmission mechanisms of this novel pathogen, as well as the wide range of adaptive human interventions via policies and regulations. To address this uncertainty, a 3-parameter logistic model was used to depict both the transmission dynamics process and the trajectory of the pandemic. The purpose is to explore when the pandemic might have been under control based on initial development, and it is contingent upon the continuation of intervention efforts. In addition to the mutation and evolution of the virus, many human system factors may influence the progress of a pandemic, such as new policies and human mobility and connectivity. In addition, the availability of testing kits, particularly during the early stages of a pandemic when unreported and undocumented infected patients are prevalent, may influence the model robustness.
Predicted future prevalence rates for different clusters, based on the data from the first 70 weeks, are illustrated for a period after 29 May 2021 (Figure 1, Table 1). A high correlation between observed and predicted PR was found for each cluster (Normalized RMSE < 0.03, p < 0.05). While there are many uncertain factors that could affect prediction, future development trends of four different clusters and their relative speed to the peak are anticipated. Based on this model, PR values by 30 July 2022 for Clusters I, II, III, and IV are 872, 4090, 7989, and 10,360, respectively. More importantly, the maximum PR of Clusters I, II, III, and IV will occur on 20 October 2021, 30 January 2022, 20 April 2022, and 30 July 2022, respectively. Estimated model coefficients are provided in Table 1. The predicted peak times of the outbreak are indicative when the growth rate of prevalence changes from an increasing to a decreasing trend. The prevalence growth rates for Clusters I, II, III, and IV are estimated as 0.058, 0.077, 0.104, and 0.119, respectively. It is worth noting that these clusters reached their peaks in different time periods. For example, Cluster IV reached its peak after 49.4 (48.81, 49.99) weeks (2 January 2021), whereas Clusters I, II, and III will reach their peaks after 72.15 (63.12, 81.19) (19 June 2021), 57.82 (55.67, 59.96) (27 February 2021), and 54.13 (53.34, 54.93) weeks (6 February 2021), respectively.

3.3. Human System Influences in the Spread of COVID-19

From our PLS-SEM model, we found that COVID-19 severity was significantly influenced by major elements of human systems, including economic development level, restriction of human mobility, and built environment (urban environmental degradation and urban population density) (Figure 3). Better health infrastructure, more restrictions of human mobility, higher urban population density, and less urban environmental degradation are associated with lower severity of COVID-19, as indicated by the coefficients of −0.184, −0.112 *, −0.106 *, and 0.105 *. However, the association between health infrastructure and severity of COVID-19 is not statistically significant (at p-value: 0.221). It should be noted that economic development level has a positive and significant coefficient of 0.641 * with COVID-19 severity. While this may contradict some research [5], this result has been reported in several countries with high economic development levels, such as Switzerland, the USA, and the Netherlands, which were ranked 2nd, 5th, and 10th by GDPpc in 2020 (https://knoema.com/atlas/ranks/GDP-per-capita, accessed on 15 November 2021). We echo Stojkoski [4] that GDPpc is not a direct determinant of COVID-19 outcome, but it appears to be an indirect indication of COVID-19 spread. Not surprisingly, government actions, measured by stringency, appear to be associated with the prevalence rate of COVID-19 (0.110 *). We reason that a high prevalence rate may have stimulated government actions for more stringent controls.

4. Discussion

Among the possible influencing factors, economic development shows the most significant impacts on health infrastructure and urban environmental degradation, urban population density, and government action. Better economic development levels unsurprisingly led to the better health infrastructure (coefficient of 0.972 *), less urban environment degradation (−0.592 *), lower urban population density (−0.741 *), and less stringent government measures (−0.079 *). More stringent government action was closely related with restrictions on human mobility (coefficient −0.760 *). This may be because less restriction of human mobility at the early stage had led to higher prevalence rates of COVID, which in turn triggered more stringent government action. This may also be because people and policy makers in more developed countries tend to have a higher resistance to restrictive policies/actions that may reduce living standards. Intensified restriction of human mobility can limit mobility for retail and recreational trips, through transit stations and on workplaces trips, but increase mobility between residential areas.
The most conspicuous discovery of this study is that in the early stage of the pandemic, economic development level appeared to hinder the control of COVID-19 spread among global countries, as evidenced by its positive and significant coefficient of 0.641 * with the PR of COVID-19. While higher economic development level is likely coupled with more advanced health infrastructure and less urban environmental degradation, with both factors possibly reducing the PR of COVID-19 severity, we find an opposite relationship. This finding resonates well with those who argue that few health benefits arise from further economic growth after a country achieves a certain threshold level of development [5]. It also confirms the view that countries with high economic development levels may have more globally integrated economies that feature trade, investment, and movement of people related to business travel, thus contributing to the transmission of disease at the global scale [21,22,23,24,25] We also argue that people in developed countries may have a high resistance to any actions that can potentially reduce their quality of life. Conversely, we should not ignore the impact of COVID-19 on economic development, particularly on small business and entrepreneurship [44,45,46].
We also confirm that restrictions on human mobility, low urban environmental degradation, and high urban population density helped slow the spread of COVID-19, as is evidenced by their significant coefficients of −0.112 *, 0.105 *, and −0.106 * with the PR of COVID-19, respectively. Our findings on the effectiveness of restrictions on human mobility align well with recent studies at the regional or country level [28,29,30,31,32]. More importantly, we confirm that poor urban environmental features such as air pollution are associated with higher PRs of COVID-19 [40,41]. Interestingly, high urban population density appears to be associated with lower levels of PR of COVID-19, which is contradictory to the general belief that the disease spreads faster in more densely populated areas [4,5,36], albeit this contributes to the debate on the mixed result of urban population density and the spread of COVID-19 in different countries [37,38]. Tighter control and management of, better information about the virus in, and intentional avoidance of traveling to populated areas may be other possible reasons that could be further investigated. The effective control of highly populated urban centers in East Asian countries may be a case-in-point to show that, as long as other factors such as human mobility are well controlled and urban environmental quality is decent, urban population density may not be a detrimental factor contributing to COVID-19 spread.
In our predictions through logistical modeling, we did not consider the influence of the emergence of other variants and vaccines that could change the trajectory of the spread of COVID-19. The data used in this paper go up to 29 May 2021, when more severe variants, such as the delta variant, had just started to affect Europe, and when most of the countries had not started mass vaccination. Furthermore, we have also adapted to the new normal, such as working from home, practicing social distancing, and implementing various degrees of mobility restriction [47,48,49,50]. We expect that new variants, vaccines, and new medicines, as well as the new normal lifestyle, will play critical roles in changing the speed and nature of virus spread and thus the prevalence rate. Nevertheless, our method can be applied to early stages of pandemics and can be used for better management and policy development for containing the spread of viruses.
Our global investigations on COVID-19 spread also indicate the limitation of the stringency index in determinant identification due to the way it is defined. Currently, the national stringency index may be overestimated because it uses the value of the sub-national unit that has the strictest policies [32]. We found a positive association between government stringency index and severity of COVID-19 (0.110 *), and a negative association between government stringency index and restrictions on human mobility (−0.760 *). While government actions may be interpreted as reactions to a high level of PR of COVID-19, we suspect that the fact that the stringency index was measured by the index of the sub-national unit with the strictest policies may have also contributed to the result.
Cautiously, our study is based on country-level data, suggesting that additional weighted modeling might be needed to factor country size. Large countries, such as the USA, China, and India, should not be treated in the same way as small countries because large countries have considerable variations due to subnational units influencing factors from human systems. A better approach may be to use sub-national units for large countries in our models if sufficient data is available. Moreover, we would also like to underline that from an inter-country collaboration perspective, current responses from the Association of South East Asian Nation (ASEAN) have been particularly interesting as the regional cooperation on health security has been functioning based on lessons from SARS 2003 and H1N1 200 [51]. Nevertheless, our methods in this paper can be applied to different levels of spatial units.

5. Conclusions

In this paper, we examined the confirmed COVID-19 cases of 151 countries from the beginning of the pandemic, 1 February 2020, when the data became available daily, to 29 May 2021. We identified four distinct clusters of 151 countries based on COVID-19 prevalence trajectories that had distinct dynamics in prevalence rate (PR). We found that the turning point as well as the maximum PR rate of the pandemic were the latest for Cluster I and the earliest for Cluster IV. Based on partial least squares structural equation modeling (PLS-SEM), we further found that the PR of COVID-19 was significantly influenced (p < 0.05) by major elements of human systems, with coefficients of 0.641, −0.112, 0.105, and −0.106 for economic development, restriction of human mobility, urban environmental degradation, and urban population density, respectively, in the early stage of the pandemic. Better health infrastructure, more restrictions on human mobility, higher urban population density, and less urban environmental degradation were associated with lower PRs of COVID-19, whereas economic development level had a positive and significant coefficient of PR of COVID-19. Furthermore, high urban population density appeared to be associated with lower PRs of COVID-19, indicating that it may not be a detrimental factor contributing to COVID-19 spread.
This research advances our understanding of COVID-19 from a social science perspective, even though our findings are empirically based. The outcomes of the research will enrich public knowledge and help the decision making of policy makers at different levels. The research findings can be distributed in global policy forums and communicated to the general public, through mechanisms such as K-12 public schools, for public awareness and educational purposes.

Author Contributions

Conceptualization, P.F. and J.C.; methodology, P.F., J.C. and T.S.; validation, P.F., J.C. and T.S.; formal analysis, P.F., J.C. and T.S.; investigation, P.F., J.C. and T.S.; data curation, T.S.; writing—original draft preparation, P.F. and T.S.; writing—review and editing, P.F., J.C. and T.S.; visualization, T.S.; supervision, P.F. and J.C.; project administration, P.F.; funding acquisition, P.F. and J.C. All authors have read and agreed to the published version of the manuscript.

Funding

This research was funded by COVID-19 Small Grants of College of Social Science, Michigan State University (Peilei Fan and Jiquan Chen) and National Aeronautics and Space Administration grant number [80NSSC20K0740].

Institutional Review Board Statement

Not applicable.

Informed Consent Statement

Not applicable.

Data Availability Statement

This research was conducted using published or publicly available data. Data on COVID-19 confirmed cases and policy measures are publicly available online from the JHI CSSE COVID-19 Dataset at https://github.com/CSSEGISandData and the Oxford COVID-19 (accessed on 7 June 2021) Government Response Tracker at https://github.com/OxCGRT (accessed on 7 June 2021). Urban air pollution data are available at https://doi.org/10.1038/s41612-020-0124-2 and urban area and urban population data are available at https://ghsl.jrc.ec.europa.eu/CFS.php (accessed on 15 June 2021). GDP per capita, total population, FDI (net inflows), hospital bed per 1000 people, physicians per 1000 people, and employment-to-population ratio at the country level are available at https://data.worldbank.org/ (accessed on 15 June 2021). Global Health Security Index (GHSI) data are available at https://www.ghsindex.org/ (accessed on 20 June 2021). Healthcare Access and Quality Index (HAQI) data are available at http://ghdx.healthdata.org/record/global-burden-disease-study-2015-gbd-2015-healthcare-access-and-quality-index-based-amenable (accessed on 20 June 2021). Please see details in Appendix A Table A1.

Acknowledgments

The authors would like to thank Kristine Blakeslee for editorial assistance for improving the manuscript.

Conflicts of Interest

The authors declare no conflict of interest.

Code Availability

The codes used for analyzing the data and plotting the analyzed data are available from the corresponding author upon reasonable request.

Guideline Statement

All experimental protocols were conducted in accordance with the relevant guidelines and regulations.

Appendix A

Table A1. Variables used in COVID-19 prevalence trajectories analysis and PLS-SEM analysis.
DataUnitAvailabilityData Source
COVID-19 Prevalence rate per 105Weekly cases (1 February 2020–29 May 2021)Dong et al. [52];
JHU CSSE [6]
Change in mobility in retail and recreation trips %Weekly data compared to baseline Google [35]
Change in mobility in transit stations%Weekly data compared to baselineGoogle [35]
Change in mobility in workplaces trips%Weekly data compared to baselineGoogle [35]
Change in mobility in residential trips%Weekly data compared to baselineGoogle [35]
Government response stringency indexNAWeekly data of stringency indexOxCGRT [34]
GDP per capitaUSDMost recent year of each countryWB [27]
Foreign direct investment, net inflowsUSDMost recent year of each countryWB [27]
Total population#Most recent year of each countryWB [27]
Employment-to-population ratio%Most recent year of each countryWB [27]
Global Health Security IndexNAGlobal Health Security Index (2019)JHU CHS [53]
Physicians per 1000 people#Most recent year of each countryWB [27]
Hospital beds per 1000 people#Most recent year of each countryWB [27]
Healthcare Access and Quality Index NAHealthcare Access and Quality Index (2015)Barber et al. [54]
Urban population density (per km2)#Population distribution layer (2015)CIESIN [55]
Urban centerskm2Global human settlement layer (2015)EC [56]
Urban air pollution µgm−3annual average, weighted PM2.5 (2015)Shaddick et al. [43]
Note: COVID-19 prevalence rate represents the virus development dynamics; all other data represent various aspects of human systems. “GDP” stands for “Gross Domestic Product”. “NA” stands for “not applicable”. The symbol “ugm3” stands for “micrograms (one-millionth of a gram) per cubic meter air”. The Symbol “#” stands for the number of people.

References

  1. Varkey, R.S.; Joy, J.; Sarmah, G.; Panda, P.K. Socioeconomic determinants of COVID-19 in Asian countries: An empirical analysis. J. Public Aff. 2020, 21, e2532. [Google Scholar] [CrossRef] [PubMed]
  2. Sá, F. Socioeconomic Determinants of Covid-19 Infections and Mortality: Evidence from England and Wales; SSRN: Rochester, NY, USA, 2020; Available online: https://ssrn.com/abstract=3612850 (accessed on 1 June 2021).
  3. Ehlert, A. The socio-economic determinants of COVID-19: A spatial analysis of German county level data. Soc. Econ. Plan. Sci. 2021, 78, 101083. [Google Scholar] [CrossRef] [PubMed]
  4. Stojkoski, V.; Utkovski, Z.; Jolakoski, P.; Tevdovski, D.; Kocarev, L. The Socio-Economic Determinants of the Coronavirus Disease (COVID-19) Pandemic; SSRN: Rochester, NY, USA, 2020; Available online: https://ssrn.com/abstract=3576037 (accessed on 1 June 2021).
  5. Hassan, M.M.; Kalam, M.; Shano, S.; Nayem, M.; Khan, R.; Rahman, M.; Islam, A. Assessment of epidemiological determinants of COVID-19 pandemic related to social and economic factors globally. J. Risk Financ. Manag. 2020, 13, 194. [Google Scholar] [CrossRef]
  6. Johns Hopkins University Center for Systems Science and Engineering (JHU CSSE). COVID-19 Data Repository by the Center for Systems Science and Engineering (CSSE) at Johns Hopkins University. 2021. Available online: https://github.com/CSSEGISandData/COVID-19 (accessed on 7 June 2021).
  7. Hunter, P.R.; Resebro, H.; Cameron, J.; Hunter, P.; Jagals, P.; Pond, K. Defining the Current Situation-Epidemiology. In Valuing Water, Valuing Livelihoods: Guidance on Social Cost-Benefit Analysis of Drinking-Water Interventions, with Special Reference to Small Water Supplies; World Health Organization/IWA Publishing: London, UK, 2011; pp. 75–100. [Google Scholar]
  8. Jain, A.K.; Dubes, R.C. Algorithms for Clustering Data; Prentice-Hall, Inc.: Hoboken, NJ, USA, 1988. [Google Scholar]
  9. Genolini, C.; Alacoque, X.; Sentenac, M.; Arnaud, C. Kml and kml3d: R packages to cluster longitudinal data. J. Stat. Softw. 2015, 65, 1–34. [Google Scholar] [CrossRef] [Green Version]
  10. Genolini, C.; Falissard, B. KmL: A package to cluster longitudinal data. Comput. Methods Programs Biomed. 2011, 104, e112–e121. [Google Scholar] [CrossRef] [PubMed]
  11. Shim, Y.; Chung, J.; Choi, I.C. A comparison study of cluster validity indices using a nonhierarchical clustering algorithm. In Proceedings of the International Conference on Computational Intelligence for Modelling, Control and Automation and International Conference on Intelligent Agents, Web Technologies and Internet Commerce (CIMCA-IAWTIC’06), Vienna, Austria, 28–30 November 2005; pp. 199–204. [Google Scholar]
  12. Cramer, J.S. The early origins of the logit model. Stud. Hist. Philos. Biol. Biomed. Sci. 2004, 35, 613–626. [Google Scholar] [CrossRef]
  13. Ausloos, M. The Logistic Map and the Route to Chaos: From the Beginnings to Modern Applications; Springer Science & Business Media: Berlin/Heidelberg, Germany, 2006. [Google Scholar]
  14. Fan, Y.; Chen, J.; Shirkey, G.; John, R.; Wu, S.R.; Park, H.; Shao, C. Applications of structural equation modeling (SEM) in ecological studies: An updated review. Ecol. Process. 2016, 5, 1–12. [Google Scholar] [CrossRef] [Green Version]
  15. Fan, P.; Ouyang, Z.; Nguyen, D.D.; Nguyen, T.T.H.; Park, H.; Chen, J. Urbanization, economic development, environmental and social changes in transitional economies: Vietnam after Doimoi. Landsc. Urban Plan. 2019, 187, 145–155. [Google Scholar] [CrossRef]
  16. Hair, J.F., Jr.; Matthews, L.M.; Matthews, R.L.; Sarstedt, M. PLS-SEM or CB-SEM: Updated guidelines on which method to use. J. Multivar. Anal. 2017, 1, 107–123. [Google Scholar] [CrossRef]
  17. Hair, J.F., Jr.; Hult, G.T.M.; Ringle, C.M.; Sarstedt, M. A Primer on Partial Least Squares Structural Equation Modeling (PLS-SEM); Sage Publications: New York, NY, USA, 2021. [Google Scholar]
  18. Mikhael, E.M.; Al-Jumaili, A.A. Can developing countries face novel coronavirus outbreak alone? The Iraqi situation. Public Health Pract. 2020, 1, 100004. [Google Scholar] [CrossRef]
  19. Szulczuk, K.; Cheema, M.A. COVID-19: The Impact of Socio-Economic Characteristics on the Fatality Rate; SSRN: Rochester, NY, USA, 2020; Available online: https://ssrn.com/abstract=3591551 (accessed on 1 June 2021).
  20. Caan, W. The spirit level. Why equality is better for everyone? J. Public Ment. Health 2011, 10, 250. [Google Scholar] [CrossRef]
  21. Adda, J. Economic activity and the spread of viral diseases: Evidence from high frequency data. Q. J. Econ. 2016, 131, 891–941. [Google Scholar] [CrossRef] [Green Version]
  22. Klepac, P.; Kucharski, A.J.; Conlan, A.J.; Kissler, S.; Tang, M.L.; Fry, H.; Gog, J.R. Contacts in context: Large-scale setting specific social mixing matrices from the BBC Pandemic project. MedRxiv 2020. [Google Scholar] [CrossRef] [Green Version]
  23. Markowitz, S.; Nesson, E.; Robinson, J.J. The effects of employment on influenza rates. Econ. Hum. Biol. 2019, 34, 286–295. [Google Scholar] [CrossRef] [PubMed]
  24. Prem, K.; Cook, A.R.; Jit, M. Projecting social contact matrices in 152 countries using contact surveys and demographic data. PLoS Comput. Biol. 2017, 13, e1005697. [Google Scholar] [CrossRef]
  25. Zanakis, S.H.; Alvarez, C.; Li, V. Socio-economic determinants of HIV/AIDS pandemic and nations efficiencies. Eur. J. Oper. Res. 2007, 176, 1811–1838. [Google Scholar] [CrossRef]
  26. Patel, J.A.; Nielsen, F.B.H.; Badiani, A.A.; Assi, S.; Unadkat, V.A.; Patel, B.; Wardle, H. Poverty, inequality and COVID-19: The forgotten vulnerable. Public Health 2020, 183, 110–111. [Google Scholar] [CrossRef]
  27. World Bank (WB). World Development Indicator. 2021. Available online: https://databank.worldbank.org/home (accessed on 15 June 2021).
  28. Zhang, Y.; Zhang, A.; Wang, J. Exploring the roles of high-speed train, air and coach services in the spread of COVID-19 in China. Transp. Policy 2020, 94, 34–42. [Google Scholar] [CrossRef]
  29. Atalan, A. Is the lockdown important to prevent the COVID-19 pandemic? Effects on psychology, environment and economy-perspective. Ann. Med. Surg. 2020, 56, 38–42. [Google Scholar] [CrossRef]
  30. Lau, H.; Khosrawipour, V.; Kocbach, P.; Mikolajczyk, A.; Schubert, J.; Bania, J.; Khosrawipour, T. The positive impact of lockdown in Wuhan on containing the COVID-19 outbreak in China. J. Travel Med. 2020, 27, 037. [Google Scholar] [CrossRef] [Green Version]
  31. Bahinipati, C.S.; Sirohi, R.A.; Biswal, D.; Singh, M. COVID-19: Policy Interventions and Socio-Economic Impact in Andhra Pradesh; MPRA Paper No. 10050; Indian Institute of Technology Tirupati: Tirupati, India, 2020. [Google Scholar]
  32. Ray, D.; Subramanian, S. India’s lockdown: An interim report. Indian Econ. Rev. 2020, 55, 31–79. [Google Scholar] [CrossRef] [PubMed]
  33. Qiu, Y.; Chen, X.; Shi, W. Impacts of social and economic factors on the transmission of coronavirus disease 2019 (COVID-19) in China. J. Popul. Econ. 2020, 33, 1127–1172. [Google Scholar] [CrossRef] [PubMed]
  34. University of Oxford, Covid-19 Government Response Tracker (OXCGRT). Covid-19 Government Response Tracker 2021. Available online: https://www.bsg.ox.ac.uk/research/research-projects/covid-19-government-response-tracker (accessed on 7 June 2021).
  35. Google. COVID-19 Community Mobility Reports 2020. Available online: https://www.google.com/covid19/mobility/ (accessed on 7 June 2021).
  36. Wong, D.W.; Li, Y. Spreading of COVID-19: Density matters. PLoS ONE 2020, 15, e0242398. [Google Scholar] [CrossRef] [PubMed]
  37. Hamidi, S.; Sabouri, S.; Ewing, R. Does density aggravate the COVID-19 pandemic? Early findings and lessons for planners. J. Am. Plann. Assoc. 2020, 86, 495–509. [Google Scholar] [CrossRef]
  38. Bhadra, A.; Mukherjee, A.; Sarkar, K. Impact of population density on Covid-19 infected and mortality rate in India. Model. Earth Syst. Environ. 2021, 7, 623–629. [Google Scholar] [CrossRef]
  39. Krefis, A.C.; Augustin, M.; Schlünzen, K.H.; Oßenbrügge, J.; Augustin, J. How does the urban environment affect health and well-being? A systematic review. Urban Sci. 2018, 2, 21. [Google Scholar] [CrossRef] [Green Version]
  40. Spencer, J.H.; Finucane, M.L.; Fox, J.M.; Saksena, S.; Sultana, N. Emerging infectious disease, the household built environment characteristics, and urban planning: Evidence on avian influenza in Vietnam. Landsc. Urban Plan. 2020, 193, 103681. [Google Scholar] [CrossRef]
  41. Isphording, I.E.; Pestel, N. Pandemic meets pollution: Poor air quality increases deaths by COVID-19. J. Environ. Econ. Manag. 2021, 108, 102448. [Google Scholar] [CrossRef]
  42. Dijkstra, L.; Florczyk, A.J.; Freire, S.; Kemper, T.; Melchiorri, M.; Pesaresi, M.; Schiavina, M. Applying the degree of urbanisation to the globe: A new harmonised definition reveals a different picture of global urbanisation. J. Urban Econ. 2021, 125, 103312. [Google Scholar] [CrossRef]
  43. Shaddick, G.; Thomas, M.L.; Mudu, P.; Ruggeri, G.; Gumy, S. Half the world’s population are exposed to increasing air pollution. NPJ Clim. Atmos. Sci. 2020, 3, 1–5. [Google Scholar] [CrossRef]
  44. Hailu, G. Economic thoughts on COVID-19 for Canadian food processors. Can. J. Agric. Econ. Can. D'agroeconomie 2020, 68, 163–169. [Google Scholar] [CrossRef]
  45. Belitski, M.; Guenther, C.; Kritikos, A.S.; Thurik, R. Economic effects of the COVID-19 pandemic on entrepreneurship and small businesses. Small Bus. Econ. 2021, 58, 1–17. [Google Scholar]
  46. Caraka, R.E.; Kurniawan, R.; Nasution, B.I.; Jamilatuzzahro, J.; Gio, P.U.; Basyuni, M.; Pardamean, B. Micro, small, and medium enterprises’ business vulnerability cluster in Indonesia: An analysis using optimized fuzzy geodemographic clustering. Sustainability 2021, 13, 7807. [Google Scholar] [CrossRef]
  47. Bonacini, L.; Gallo, G.; Scicchitano, S. Working from home and income inequality: Risks of a ‘new normal’ with COVID-19. J. Popul. Econ. 2021, 34, 303–360. [Google Scholar] [CrossRef]
  48. Tomé, E.; Gromova, E. Development of emergent knowledge strategies and new dynamic capabilities for business education in a time of crisis. Sustainability 2021, 13, 4518. [Google Scholar] [CrossRef]
  49. Susanto, A.P.; Findyartini, A.; Taher, A.; Susilaradeya, D.P.; Ariawan, I.; Dartanto, T.; Wiweko, B. COVID-19 in Indonesia: Challenges and Multidisciplinary Perspectives for a Safe and Productive New Normal. Acta Med. Indones. 2020, 52, 423–430. [Google Scholar]
  50. Sparrow, R.; Dartanto, T.; Hartwig, R. Indonesia under the new normal: Challenges and the way ahead. Bull. Indones. Econ. Stud. 2020, 56, 269–299. [Google Scholar] [CrossRef]
  51. Djalante, R.; Nurhidayah, L.; Van Minh, H.; Phuong NT, N.; Mahendradhata, Y.; Trias, A.; Lassa, J.; Miller, M.A. COVID-19 and ASEAN responses: Comparative policy analysis. Prog. Disaster Sci. 2020, 8, 100129. [Google Scholar] [CrossRef]
  52. Dong, E.; Du, H.; Gardner, L. An interactive web-based dashboard to track COVID-19 in real time. Lancet Inf. Dis. 2020, 20, 533–534. [Google Scholar] [CrossRef]
  53. Johns Hopkins University, Center for Health Security (JHU CHS). Global Health Security Index 2019. Available online: www.ghsindex.org (accessed on 7 June 2021).
  54. Barber, R.M.; Fullman, N.; Sorensen, R.J.; Bollyky, T.; McKee, M.; Nolte, E.; Davey, G. Healthcare access and quality index based on mortality from causes amenable to personal health care in 195 countries and territories, 1990–2015: A novel analysis from the Global Burden of Disease Study 2015. Lancet 2017, 390, 231–266. [Google Scholar] [CrossRef] [Green Version]
  55. Center for International Earth Science Information Network (CIESIN). Center for International Earth Science Information Network 2021. Available online: http://www.ciesin.org/ (accessed on 15 June 2021).
  56. European Commission. Global Human Settlement Layer (GHSL) 2021. Available online: https://ghsl.jrc.ec.europa.eu/CFS.php (accessed on 15 June 2021).
Figure 1. Actual and predicted PR for COVID-19 for the four clusters of countries. The four clusters were identified by using cluster analysis. The changes over time were modeled with a 3-parameter logistic model. The dotted points indicate the actual PR for each cluster; the solid lines represent the fitted changes. The shaded areas around the solid lines represent a 95% confidence interval (IV) of the estimates. The horizontal dashed lines indicate the total size of PR per 105 people in the final phase of the pandemic on 30 July 2022. The vertical solid line intersects the PR curve and represents the inflection (turning) point of the pandemic. The predicted peak time, i.e., the maximum PR of Clusters I, II, III, and IV, will occur on 20 October 2021; 30 January 2022; 20 April 2022; 30 July 2022, respectively.
Sustainability 14 02342 g001
Figure 2. Spatial distribution of the four clusters based on the COVID-19 prevalence rate. Cluster I countries are primarily from Asia and Africa (83%), whereas Cluster IV countries are mostly from Europe, the Middle East, and North and Central America (USA and Panama).
Sustainability 14 02342 g002
Figure 3. Empirical influences of major human system factors (economic, social, policy, health infrastructure, and urban environment status) on the prevalence rate (PR) of COVID-19 for the 151 countries from the 20-week study period. Observed variables are presented by boxes, latent variables by ovals and the standardized path coefficients and factor loads are listed next to arrows in the PLS-SEM model. The significance level (p < 0.05) is indicated by *. The fitting indexes in the model are: CFI: 0.936, TLI: 0.915, SRMR: 0.058, RMSEA: 0.093. The PR of COVID-19 was particularly related to economic development level, health infrastructure, and policies regarding restrictions on human mobility, but less associated with urban environment and urban population density.
Sustainability 14 02342 g003
Table 1. Estimated coefficients of the 3-parameter logistic model for each cluster and goodness of fit.
ParameterCluster 1Cluster 2Cluster 3Cluster 4
Growth rate0.058
(0.052, 0.064)
0.077
(0.073,0.082)
0.104
(0.1,0.108)
0.119
(0.114, 0.124)
Inflection point72.15
(63.12, 81.19)
57.82
(55.67, 59.96)
54.13
(53.34, 54.93)
49.4
(48.81, 49.99)
Asymptote872
(612.1, 1132)
4090
(3782, 4398)
7980
(7716, 8243)
10,360.284
(10,110.73, 10,609.77)
Normalized RMSE0.0290.0130.0190.016
Note: The respective 95% confidence intervals are given in parenthesis.
Table 2. Cluster of countries by the dynamics of COVID-19 prevalence rate per 10,000 people.
Country Names
Cluster I (76)
Africa (39)Algeria, Angola, Benin, Burkina Faso, Burundi, Cameroon, Chad, Congo, Cote d’Ivoire, Democratic Rep. of Congo, Egypt, Equatorial Guinea, Eritrea, Ethiopia, Gabon, Gambia, Ghana, Guinea, Guinea-Bissau, Kenya, Liberia, Madagascar, Malawi, Mali, Mauritania, Mauritius, Mozambique, Niger, Nigeria, Rwanda, Senegal, Sierra Leone, South Sudan, Sudan, Tanzania, Togo, Uganda, Zambia, Zimbabwe
Asia (25)Afghanistan, Bangladesh, Cambodia, China, Hong Kong, India, Indonesia, Japan, Laos, Malaysia, Mongolia, Myanmar, Nepal, Pakistan, Philippines, Singapore, South Korea, Sri Lanka, Syria, Tajikistan, Thailand, Timor Este, Uzbekistan, Vietnam, Yemen
Central America (7)Cuba, El Salvador, Guatemala, Haiti, Jamaica, Nicaragua, Trinidad and Tobago
Oceania (3)Australia, New Zealand, Papua New Guinea
Europe (1)Finland
South America (1)Venezuela
Cluster II (27)
Africa (7)Tunisia, South Africa, Libya, Botswana, Namibia, Eswatini, Morocco
Asia (7)Oman, Iran, Azerbaijan, Iraq, Kazakhstan, Kyrgyzstan, Saudi Arabia
Europe (5)Germany, Belarus, Greece, Russia, Norway
South America (4)Uruguay, Paraguay, Bolivia, Ecuador
Central America (3)Dominican Republic, Honduras, Mexico
North America (1)Canada
Cluster III (29)
Europe (17)Estonia, Hungary, Poland, North Macedonia, Austria, Slovakia, Latvia, Italy, United Kingdom, Moldova, Bosnia and Herzegovina, Bulgaria, Romania, Ireland, Ukraine, Denmark, Albania
Asia (6)Lebanon, Jordan, Kuwait, Turkey, Palestine, United Arab Emirates
South America (5)Argentina, Brazil, Chile, Colombia, Peru
Central America (1)Costa Rica
Cluster IV (19)
Europe (12)Czechia, Slovenia, Sweden, Serbia, Lithuania, Netherlands, Belgium, Croatia, France, Portugal, Switzerland, Spain
Middle East Asia (5)Bahrain, Israel, Georgia, Qatar, Armenia
North America (1)United States
South America (1)Panama
Publisher’s Note: MDPI stays neutral with regard to jurisdictional claims in published maps and institutional affiliations.

