Abstract
Advanced strategies for emergency logistics scheduling problems in urban transport networks have been a challenging topic for centuries. This study proposed a cluster-first route-second constructive heuristic method based on the continuous approximation (CA) for ‘one-to-many’ vehicle routing to dispatch commidities after an emergency. The objective of the study is to provide a replenish schedule and routing solution from the government/provider’s end in order to minimize the total motion cost, pipeline inventory cost, and holding cost with backorder for the disaster relief operation. The developed method can turn the complicated vehicle routing problem (VRP) into a relatively simple travel salesman problem (TSP) for pre-assigned customer sets. The CA is employed to determine the optimal replenish amount and inventory level for the route serving a given location. The Christofides method is then applied to solve the TSP for the selected cluster. Two clustering methods are investigated in this research: (1) a local-based approach where clustering and routing are determined; and (2) a K-mean clustering method where points are clustered upfront by the CA solution. A case study in Miami-Dade County in Florida to dispatch fuels from the depot to 72 gas stations is presented, demonstrating the proposed approach and comparing two clustering methods. The numerical results illustrate the effectiveness of the algorithms and conclude that the local-based clustering approach may yield a lower total cost with a higher motion cost.
1. Introduction
Natural disasters such as floods and hurricanes often lead to a great loss of life and property, especially in metropolitan areas. In order to minimize the suffering and loss during, and after, a disaster, rapidly delivering necessary relief commodities to the affected areas is one of the top priorities in disaster relief operations. The emergency logistics scheduling problem (ELSP) is different from normal situations, as the time window for planning and implementation is very limited under emergency circumstances. We can only focus on a short time period, usually a few days after the disaster has occurred. Another difference is that there are more uncertainties in the ELSP due to a probable communication outage. According to Alem et al., ELSP is commonly solved without reliable or accurate information about the affected areas and demands of victims [1]. Nevertheless, ELSP is more flexible than ordinary situations, since in emergencies, the transit vehicles may not have to return to their origin point. For instance, only health center A is able to offer ambulances to pick up victims, but can go to the nearest health center B for timely treatment instead of having to go back to A [2]. These differences make logistic planning after natural disasters a challenge, especially for urban areas. Vitetta (2021) specified different risk reduction problems in transport systems under emergency conditions, including supply, demand, planning, and Decision Support Systems [3]. In this study, we focus on the supply side for disaster relief, and an ELSP strategy which provides a gas station replenish schedule and routing solution from the government/provider’s end to minimize the total cost.
As Chang et al. mentioned, algorithms to solve the ELSP differ in terms of the disaster type, transportation modes, population distribution, rescue requirements, and many other situations [4]. Existing solutions to disaster relief can be classified into the preparation stage and dispatch stage. In this study, we only focus on the dispatch problem, which is more essential to the ELSP strategy. Logistic scheduling problems are proven to be NP-complete by Savelsbergh, and the research on ELSP has shifted to seeking satisfactory, not optimal, solutions for models [5]. Much effort has been made to deal with the difficulties of ELSP, with algorithms such as dynamic integer linear programming, greedy algorithms, genetic algorithms, game theory, metaheuristic algorithms, and some other state-of-the-art intelligent optimization algorithms being applied [6,7,8,9,10,11,12,13,14,15]. There are three classical approaches to model the last mile delivery in ELSP [16]. First is the interactive approach proposed by Barbarosoglu et al., where they model the vehicle routes as a set of binary variables, which is very computationally demanding when the routing network is large [17]. The second modeling method described in Mete and Zabinsky lists all the possible depots and customer nodes, and then uses a binary variable to assign the route to each vehicle to turn the VRP into a capacitated assignment problem. Since the number of routes increase exponentially with the network scale, this approach still cannot be used for large ELSP problems [18]. The last common model is a dynamic network flow model proposed by Yi and Özdamar, whose outputs are vehicle flow and commodity flow, which need to be analyzed to get the routes and loads. This modeling approach has proved less computationally demanding than the former approaches [19].
The existing methods are unfit for large urban network analysis due to the large amount of calculational demands. Thus, modeling approaches and solution algorithms that can be employed to practical ELSPs still urgently need consideration. To fill this gap, this study proposes a cluster-first route-second constructive heuristic method that can be applied to large-scale urban networks based on the continuous approximation (CA) for a disaster relief operation. This turns the relatively complicated VRP into TSP for preassigned customer sets. To prove the effectiveness and efficiency of the method, we did a case study in Miami-Dade County, Florida, USA, a typical urban network. After Hurricane Irma, the gas stations were short on supplies. Hurricane Irma made landfall in Florida on 10 September 2017, which caused massive damage to lives and properties [20]. The emergency resources, including water, food, medicine, and fuel, were extremely limited after the hurricane. According to Miller et al., at least sixty percent of the gas stations in Miami-Dade County were thirsty for fuel after many Floridians drove to escape from storm [21]. Therefore, fast and effective logistics planning is quite important to save both property and lives in Florida. It is essential for fuel companies and the government to find an optimal way to deliver the fuel to each gas station with minimum cost using oil tankers. A total of 72 gas stations are served, and the demand of fuel is estimated by the population within the several nearest blocks of each gas station. A cluster-first route-second constructive heuristic method is proposed in this paper to handle the large-scale ELSP. We collected real geometric data in the Miami area and locations of Marathon company gas stations in Miami. Based on these data, we used continuous approximation (CA) and two different cluster methods to generate feasible optimal solutions for the fuel truck routing problems. The CA was adopted to solve for the optimal replenishment of gas inventory levels for the route serving a given location. Governed by this solution, the number of facilities to visit is determined around a given facility. Two clustering methods, a local-based approach and a K-mean clustering method, are compared in the paper, and the Christofides method is then applied to solve the TSP for the selected cluster.
The remainder of this paper is structured as follows. A complex, mixed-integer model is introduced in Section 2. In the methodology section, a cluster-first route-second solution algorithm for the model is proposed. The illustration of data collection and data analysis is then presented in the Section 4. The results of the numerical study are given in the Section 5, and the last section concludes the study.
2. Problem Statement
In this section, we briefly introduce the mathematical formulation and discuss some necessary properties of the ELSP model. A mixed-integer model is established for analysis. The major symbols used in the model are listed at the end of this article.
The objective of the model is to provide a replenish schedule and routing solution from the government/provider’s end in order to minimize the total motion cost, pipeline inventory cost, and holding cost with a backorder. An infinite time horizon is considered, on which we design a steady-state replenish strategy. Under the assumption that every gas station is operating at its highest capacity (which is realistic in disasters), this problem can be formulated as a capacitated inventory-routing problem with a deterministic demand. We consider a set of customers (gas stations) S, scattered over the plane, and a depot aside from the customers where all trucks will depart. The Euclidian distances between each pair of customers,, are calculated, and are assumed to be symmetrical. Three components have been controlled: routing patterns, dispatch headways, and inventory level at customers for each route. The problem can be formulated as a mixed-integer model as follows:
The objective function consists of the total travel distance and the total holding cost with backorder, divided by the amount of commodity conveyed in each headway. The maximum function in the second term disallows residual inventory when replenishing happens. Because the demand is assumed deterministic, any residual inventory is unnecessary and introduces sheer inventory cost. Constraints (2) and (3) state the number of routes being designed. Constraints (4) and (5) form the flow condition for routing and eliminate subtour. Constraints (6) to (9) define capacity constraints as well as variable domains.
This formulation, involving binary variables, integer variables, and non-integer variables, is hard to solve analytically. Thus, we further propose a cluster-first route-second constructive heuristic method to handle the problem.
3. Methodology
In this section, we present the proposed cluster-first route-second constructive heuristic method of the ELSP model. The CA is first introduced for determining the optimal replenishment amount and inventory level for the route serving a given location. Next, a solution framework based on two cluster methods are described. The Christofides method is then applied to solve the TSP for the selected cluster.
3.1. Continuous Approximation
The common notations used in CA are summarized at the end of this article.
We propose a solution framework using continuous approximation, followed by routing with a cluster-first route-second philosophy. The first step is to approach the solution for the one-to-many distribution problem. By assuming that the facility density varies slowly across the space, the objective function can be approximated with a continuous function. For a certain location, which is served by a certain route, the objective function is given by:
where,
The decomposed objective function is then shown as:
The first four terms are the motion cost, including stopping, cruising, and dispatch cost. The fifth term in parenthesis is the pipeline inventory cost. The last two terms are the holding cost with backorder. The objective cost function is in the unit of dollar per gallon, and is dependent on location.
The objective function is to be minimized as a constrained nonlinear program, stated as follows:
where,
Constraint (18) defines the truck capacity. Constraint (19) states that an empty route (with 0 stops) is infeasible. Constraint (20) states that residual inventory is not allowed. Constraint (21) is the facility capacity and Constraint (22) is the non-negativity constraint for the inventory level. This nonlinear program with closed boundaries can be solved using KKT conditions.
Generally, since there are five constraints present, we need to investigate a total of 25 binding cases. However, through realistic consideration, only two of the constraints need to be investigated: Constraint (18), which states whether a full truckload is being used, and Constraint (20), which states whether backorder is allowed; the rest are assumed unbinding.
The solution to the CA, as a function of location vector x, is given by
where the “*” sign denotes the optimal solution.
A comprehensive review on continuous approximation models for logistics and transportation systems can be found in [22] for interested readers.
3.2. Clustering and Routing
The solution to the continuous approximation gives the guideline for clustering, and turns the VRP into TSP for preassigned customer sets. We first propose a local-observation-based process, where stops and inventory level are found exclusively when a route is to be made, conditional on the property of the location of the cluster. Optimal TSP is then determined for the selected cluster using the Christofides method. The process is described as follows:
- (a)
- Initialize at depot;
- (b)
- Go to the closest station, which is set as a reference point:
- -
- Calculate local facility density using the three closest facilities
- -
- Calculate from the CA solution
- (c)
- Select the closest stations, exclude remote stations by a threshold;
- (d)
- Solve TSP using the Christofides algorithm;
- (e)
- Delete the visited stations;
- (f)
- Go to the closest station to the reference point, repeat from step 2.
This algorithm solves clustering and routing simultaneously, and has a sweeping property which exhausts the customer points from the depot in one direction before turning to the other direction. To prevent false assignment, when a large is falsely obtained at a remote cluster, we assign a threshold through observation by which the algorithm will discard remote customers, even when many customers less than is selected.
To compare with the local-observation-based routing solution, we investigated another clustering method that oversees the average property of the entire customer set. We use a K-mean algorithm to cluster the facilities by pre-assigning K routes, which is determined using a weighted average line-haul distance and facility density. The process is described as follows:
- (a)
- Solve CA using weighted average r, to yield ;
- (b)
- Pre-assign K = |S|/ routes;
- (c)
- Cluster using the K-mean cluster method;
- (d)
- Solve TSP using the Christofides algorithm for each cluster;
- (e)
- This approach clusters customers based on distance, and avoids falsely assigned clusters.
Since, here, we emphasize on the proposed cluster-first route-second solution framework, for a detailed process of the Christofides algorithm, readers can refer to [23].
4. Numerical Experiment
In this section, we provide a numerical experiment based on the real emergency event in Miami-Dade County, Florida. The actual data are first collected and analyzed, and the two different proposed logistic scheduling strategies are then compared.
4.1. Data Collection and Analysis
To achieve the goal of generating the fuel truck routing strategy, a set of raw data that consists of the depot location, gas station locations, and demand for each gas station is needed. In the data collection process, ArcGIS was used to extract some information and visualize the dataset. The shapefile of our study area—Miami-Dade County and interstate highway attributes—can be found from Topologically Integrated Geographic Encoding and Referencing Product [24].
4.1.1. The Depot and Facilities
Some assumptions are made to simplify the problem. First, we assume that the I-75 Interstate Highway (highlighted by the red line in Figure 1) is the only available road to enter the study area due to the influence of the hurricane and the depot is at the exit off the I-75 Interstate Highway because the supplementary trucks would arrive to this area from many other cities or states. The location of the depot is (−80.324459, 25.900981), which is represented by the latitude and longitude where the unit is degrees. Second, we assume that not all of the gas stations are functional because some may be destroyed in the disaster. We selected one of the petroleum companies, Marathon Oil Company, as our target point. It has approximately one quarter of the total gas stations in Miami [25]. In this way, we could have a more realistic and reasonable distribution of gas stations.
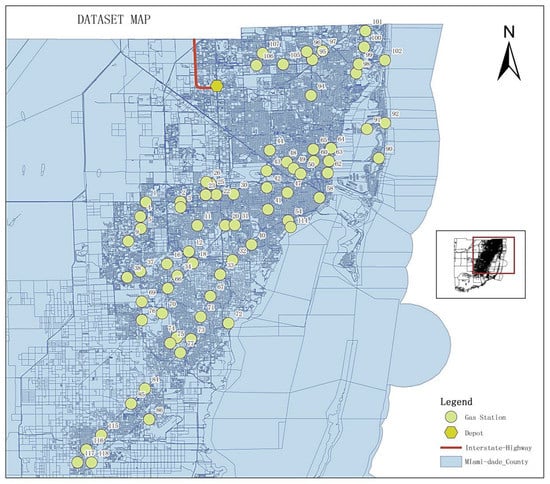
Figure 1.
Overall layout of the study area.
Based on the real situations and our assumptions, 72 gas stations were selected as our ‘customers’ in routing. The capacity of the gas stations is set as 20,000 gallons [26]. The overall layout of the depot and gas station locations in Miami-Dade County is shown in Figure 1.
4.1.2. Demands
We assume that the demand of fuel is a function of population within the several nearest blocks of each gas station. Thus, demands were generated based on the local population in blocks (U.S. Census Bureau, 2012, Suitland, MD, USA). These blocks were served by the nearest gas station (see Figure 2), one dot in the figure represents 200 people and one star represents one gas station. We also assumed that, on average, one household owns one car, and the average family size is three people. Meanwhile, since the gas stations we selected only account for a quarter of the total amount of gas stations, there were twenty five percent of the cars would go to the ones selected to refuel during our study period. The average size of a gas tank was assumed to be 15 gallons for passenger cars and 10,000 gallons for tankers [27].
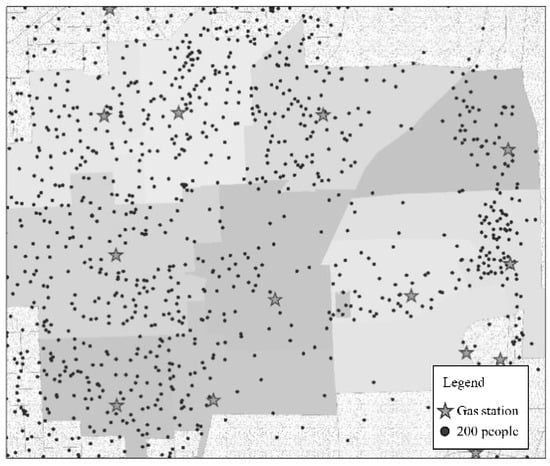
Figure 2.
Demand generation.
4.1.3. Average Facility Density
The length and width of the study area are 66.77 miles and 47.82 miles, respectively, and thus the aspect ratio is about 7:5. Further, considering there are 72 gas stations and the average number of gas stations per grid should preferably be at least one, we divided the entire area by a 7 × 5 grid, and the average area of each grid is 91.23 square miles. The resultant gas station matrix is given in Table 1. After summing up the number of facilities in each grid, we obtained the facility density matrix (Table 2) by dividing the amounts by the area of cells.

Table 1.
Gas station matrix.
Table 2.
Facility density matrix.
To find the average demand-distance, we rearranged facility density (Table 2) and modified the facility density matrix, which is shown in Table 3. We then used the same division of the map and summarized the amount of demand for each cell. After multiplying the two matrices, we applied weights to the modified facility density matrix (Table 3) and demand matrix (Table 4), and obtained the average demand-distance.
Table 3.
Modified facility density matrix.
Table 4.
Demand matrix.
5. Results and Discussion
We implemented the discussed approaches to the data sets of Florida gas stations. As mentioned in Section 3.1, Constraints (9) and (11) are considered and we need to investigate a total of four binding cases. All four cases are solved and evaluated using CA as follows:
- 1.
- 2.
- (non-feasible)
- 3.
- (non-feasible)
- 4.
As shown above, case 2, where all constraints are assumed unbinding, yields the best result, but it violates Constraint (1), and is therefore unfeasible. Similarly, case 3, where backorder is disallowed, is unfeasible as well. The best feasible solution is yielded by case 1, where each truck leaves the depot with full truck loads.
The two-routing methods, governed by the CA solution, yielded the following results where Figure 3 and Figure 4 present the routing trajectories of the local observation cluster and the K-mean cluster strategy, respectively:
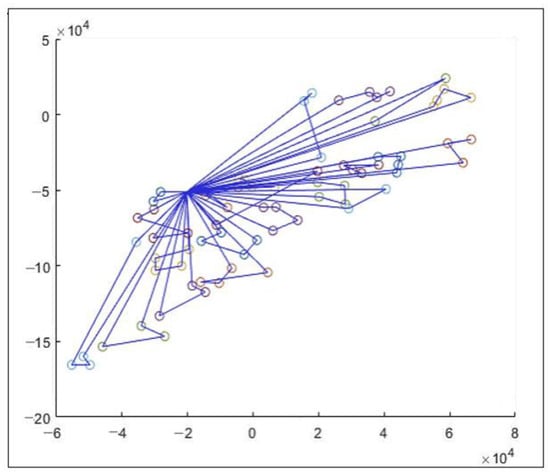
Figure 3.
Routing Trajectory of the Local Observation Cluster.
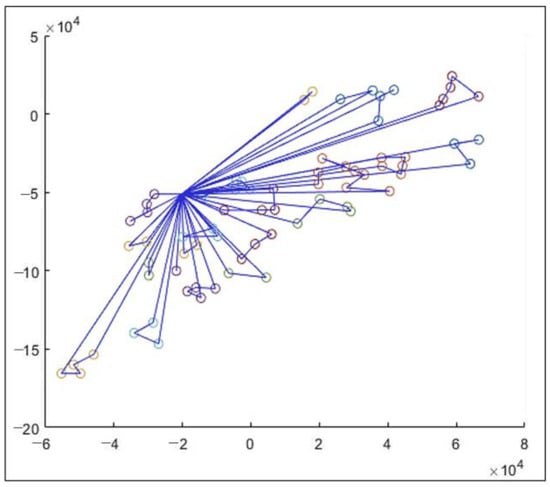
Figure 4.
Routing Trajectory of the K-mean Cluster Strategy.
It can be seen from Table 5 that the local-observation-based approach yields a higher motion cost than the K-mean-based approach. This is expected since the nodes are better clustered completely with respect to distance. However, the first approach yields a lower total cost than the second. This is a surprising result given that the replenishment amount is confined by the assumption of using a full truckload, and residual inventory is disallowed. Through closer investigation of the routing pattern, we made the following possible observations:
Table 5.
Results of the two cluster methods.
- (a)
- For a large (6 to 7) group of uniformly separated nodes, the local-observation-based algorithm adheres strictly to the CA solution, while the K-mean divides them into a big cluster (slightly close to each other) and a small cluster (slightly far apart).
- (b)
- The CA solution yielded an optimal number of stops of four per route, which increases with facility density. At several clusters, where the nodes are very close to each other, the K-mean algorithm selected them all into one route, which could potentially cause the optimal solution being yielded by the second case of the KKT condition (unbinding case).
6. Limitations of the Study
The limitation of this paper is that the model does not take dynamic information into consideration, which is actually quite significant in real world applications, especially for ELSPs, since the predetermined strategy is commonly hampered by destroyed roads after hurricanes or other emergency events. The method should further be extended to handle unforeseen events by monitoring the fleet during the working time and react to these events with an intelligent re-routing of vehicles.
Furthermore, this study did not consider the next stage—people coming to the gas station to fill up. Some realistic issues may occur, such as road congestion during this process; taking this into consideration and incorporating knowledge about network fundamental diagrams may generate the ELSP strategy with a more practical value [28,29].
Moreover, we only presented and compared two clustering methods in this study. We also encourage researchers to try other cluster algorithms such as mean-shift clustering, Expectation–Maximization (EM) clustering using Gaussian mixture models (GMM), and agglomerative hierarchical clustering [30] to further optimize the solution of the proposed ELSP in a more time-efficient manner.
7. Conclusions
In general, this paper aimed to contribute to the existing literature by developing a cluster-first route-second constructive heuristic algorithm to solve the logistics planning problem for disaster relief. We devised a solution procedure to provide good-quality solutions for a complex model involving binary variables, integer variables, and non-integer variables. We first applied continuous approximation to determine an optimal replenishment amount and inventory level for specific routes. Next, the local-observation-based cluster method and the K-mean algorithm were adopted to determine the cluster size and the number of routes. Optimal TSP is then determined for the selected cluster using the Christofides method. To demonstrate the feasibility and efficiency of our method, a case study of fuel delivery planning in the Miami-Dade County, where the gas stations were short of supplies and needed to be replenished after Hurricane Irma, was investigated. The results show that our initial goal to dispatch fuel to gas stations with minimum cost using oil tankers after an emergency can be achieved by the proposed method. A conclusion can be made that under the decision of assigning fully loaded trucks for each route, the local-based approach yields a higher motion cost, but a lower total cost. The proposed ELSP strategy is capable of providing a replenishment schedule and routing solution from the government/provider’s end to minimize the total cost, and it is a promising tool for emergency relief management.
Author Contributions
Conceptualization, R.Y.; methodology, R.Y. and P.L.; validation, R.Y.; formal analysis, P.L.; investigation, R.Y.; writing—original draft preparation, R.Y. and P.L. All authors have read and agreed to the published version of the manuscript.
Funding
This study is supported by the Yangzhou Science and Technology Projects (No. YZ2019125).
Institutional Review Board Statement
Not applicable.
Informed Consent Statement
Not applicable.
Data Availability Statement
Not applicable.
Conflicts of Interest
The authors declare no conflict of interest.
Nomenclature
| Variables | |
| Headway of route k, in the unit of hours | |
| Inventory level of route k, in the unit of gallons | |
| Binary variable indicating edge assignment. if edge i to j is selected and assigned to vehicle k | |
| Integer variable for routing indexing | |
| The set of customer nodes | |
| Stops per route | |
| Replenish quantity | |
| parameters | |
| Inventory level | |
| Motion cost of route k, in the unit of $ per mile | |
| Holding cost, in the unit of $ per gallon-hour | |
| Demand cost, in the unit of $ per gallon-hour | |
| Facility capacity | |
| Vehicle capacity | |
| Cost per mile | |
| Cost per dispatch | |
| Pipeline inventory cost | |
| Facility density at location x |
References
- Alem, D.; Clark, A.; Moreno, A. Stochastic network models for logistics planning in disaster relief. Eur. J. Oper. Res. 2016, 255, 187–206. [Google Scholar] [CrossRef]
- Gong, Q.; Batta, R. Allocation and reallocation of ambulances to casualty clusters in a disaster relief operation. IIE Trans. 2007, 39, 27–39. [Google Scholar] [CrossRef]
- Vitetta, A. Risk reduction in transport system in emergency conditions: A framework for network design problem. In WIT Transactions on the Built Environment; WIT Press: Southampton, UK; Boston, MA, USA, 2021; Volume 206. [Google Scholar]
- Chang, F.-S.; Wu, J.-S.; Lee, C.-N.; Shen, H.-C. Greedy-search-based multi-objective genetic algorithm for emergency logistics scheduling. Expert Syst. Appl. 2014, 41, 2947–2956. [Google Scholar] [CrossRef]
- Savelsbergh, M.W.P. Local search in routing problems with time windows. Ann. Oper. Res. 1985, 4, 285–305. [Google Scholar] [CrossRef] [Green Version]
- Zografos, K.G.; Androutsopoulos, K.N.; Vasilakis, G.M. A real-time decision support system for roadway network incident response logistics. Transp. Res. Part C: Emerg. Technol. 2002, 10, 1–18. [Google Scholar] [CrossRef]
- Özdamar, L.; Ekinci, E.; Küçükyazici, B. Emergency logistics planning in natural disasters. Ann. Oper. Res. 2004, 129, 217–245. [Google Scholar] [CrossRef]
- Yi, W.; Kumar, A. Ant colony optimization for disaster relief operation. Transp. Res. Part E: Logist. Transp. Rev. 2007, 43, 660–672. [Google Scholar] [CrossRef]
- Sheu, J. An emergency logistics distribution approach for quick response to urgent relief demand in disasters. Transp. Res. Part E Logist. Transp. Rev. 2007, 43, 687–709. [Google Scholar] [CrossRef]
- Chen, X.; Yan, R.; Wu, S.; Liu, Z.; Mo, H.; Wang, S. A fleet deployment model to minimise the covering time of maritime rescue missions. Marit. Policy Manag. 2021, 1–26. [Google Scholar]
- Chen, J.; Liu, Z.; Wang, S.; Chen, X. Continuum approximation modeling of transit network design considering local route service and short-turn strategy. Transp. Res. Part E Logist. Transp. Rev. 2018, 119, 165–188. [Google Scholar] [CrossRef]
- Cui, Z.; Chang, Y.; Zhang, J.; Cai, X.; Zhang, W. Improved NSGA-III with selection-and-elimination operator. Swarm Evol. Comput. 2019, 49, 23–33. [Google Scholar] [CrossRef]
- Li, J.; Li, Y.; Tian, S.; Zou, J. Dynamic cuckoo search algorithm based on Taguchi opposition-based search. Int. J. Bio-Inspired Comput. 2019, 13, 59–69. [Google Scholar] [CrossRef]
- Sun, Y.; Ren, Y.; Cai, X. Biobjective Emergency Logistics Scheduling Model Based on Uncertain Traffic Conditions. Math. Probl. Eng. 2020, 2020, 3045472. [Google Scholar] [CrossRef]
- Zhou, Y.; Liu, J.; Zhang, Y.; Gan, X. A multi-objective evolutionary algorithm for multi-period dynamic emergency resource scheduling problems. Transp. Research. Part E Logist. Transp. Rev. 2017, 99, 77–95. [Google Scholar] [CrossRef]
- Decker, M. Last Mile Logistics for Disaster Relief Supply Chain Management: Challenges and Opportunities for Humanitarian Aid and Emergency Relief; Bedey und Thoms Media GmbH: Hamburg, Germany, 2014. [Google Scholar]
- Barbarosoğlu, G.; Özdamar, L.; Cevik, A. An interactive approach for hierarchical analysis of helicopter logistics in disaster relief operations. Eur. J. Oper. Res. 2002, 140, 118–133. [Google Scholar] [CrossRef]
- Mete, H.O.; Zabinsky, Z.B. Stochastic optimization of medical supply location and distribution in disaster management. Int. J. Prod. Econ. 2010, 126, 76–84. [Google Scholar] [CrossRef]
- Özdamar, L.; Yi, W. Greedy neighborhood search for disaster relief and evacuation logistics. IEEE Intell. Syst. 2008, 23, 14–23. [Google Scholar] [CrossRef]
- Der Sarkissian, R.; Dabaj, A.; Diab, Y.; Vuillet, M. Evaluating the Implementation of the “Build-Back-Better” Concept for Critical Infrastructure Systems: Lessons from Saint-Martin’s Island Following Hurricane Irma. Sustainability 2021, 13, 3133. [Google Scholar] [CrossRef]
- Miller, A.; Arias, J.; Mauricio, E.; Alvarez, Sergio. Built environment and agricultural value at risk from Hurricane Irma flooding in Florida (USA). Nat. Hazards 2021, 109, 1327–1348. [Google Scholar] [CrossRef]
- Ansari, S.; Başdere, M.; Li, X.; Ouyang, Y.; Smilowitz, K. Advancements in continuous approximation models for logistics and transportation systems: 1996–2016. Transp. Res. Part B Methodol. 2018, 107, 229–252. [Google Scholar] [CrossRef]
- Goodrich, M.T.; Tamassia, R. The Christofides Approximation Algorithm. In Algorithm Design and Applications; Wiley: Hoboken, NJ, USA, 2015; pp. 513–514. [Google Scholar]
- U.S. Census Bureau. TIGER/Line Shapefiles Technical Documentation. 2012. Available online: http://www.census.gov/geo/mapsdata/data/pdfs/tiger/tgrshp2012/TGRSHP2012_TechDoc.pdf (accessed on 12 June 2018).
- U.S. Department of Energy. ConocoPhillips Alaska Natural Gas Corporation and Marathon Oil Company. In Application for Blanket Authorization to Export Liquefied Natural Gas: Federal Register Extract; Federal Information & News Dispatch, LLC.: Washington, DC, USA, 2010. [Google Scholar]
- Tan, X.; Zhang, P.; Wang, J.; Hong, J. Research on Urban Bearing Capacity of Gas Supply Stations. Sustainability 2019, 11, 6971. [Google Scholar] [CrossRef] [Green Version]
- Chan, F.; Shekhar, P.; Tiwari, M.K. Dynamic scheduling of oil tankers with splitting of cargo at pickup and delivery locations: A Multi-objective Ant Colony-based approach. Int. J. Prod. Res. 2014, 52, 7436–7453. [Google Scholar] [CrossRef]
- Alonso, B.; Portilla, A.I.; Musolino, G.; Rindone, C.; Vitetta, A. Network Fundamental Diagram (NFD) and traffic signal control: First empirical evidences from the city of Santander. Transp. Res. Procedia 2017, 27, 27–34. [Google Scholar] [CrossRef]
- Vitetta, A.; Musolino, G. Estimation of the Network Fundamental Diagram (NFD): An Urban Application in Emergency Conditions. Transp. Res. Procedia 2014, 3, 205–213. [Google Scholar]
- Erbacher, M.; Atkinson, P.; Delamont, S.; Cernat, A.; Sakshaug, J.W.; Williams, R.A. Cluster Analysis; SAGE Publications Ltd: London, UK, 2020. [Google Scholar]
Publisher’s Note: MDPI stays neutral with regard to jurisdictional claims in published maps and institutional affiliations. |
© 2022 by the authors. Licensee MDPI, Basel, Switzerland. This article is an open access article distributed under the terms and conditions of the Creative Commons Attribution (CC BY) license (https://creativecommons.org/licenses/by/4.0/).