Abstract
This study presents a real options-based framework for investment in land and water solar power projects in the idle areas of agricultural dams. The following four-step framework was verified through a case study conducted in South Korea: (1) select the location and size of the project; (2) define uncertainties in the project data (construction cost, O&M cost, sunshine hours, and mechanical efficiency) and market data (inflation, discount rate, risk-free interest rate, and electricity selling price); (3) estimate cash flow and project volatility to calculate the option value using a binomial tree model; and (4) make decisions regarding project investment. A case study was conducted for the Naju Agricultural Dam (NAD) project, which has a net present value of −6.67 million USD, but will have a profit of 38.17 million USD after an abandonment option is applied using the proposed framework. Our contributions provide a framework for evaluating the economic feasibility of installing solar projects in idle areas of agricultural dams and for improving the profitability of solar projects using the abandonment option. The proposed framework can assist investors in planning solar projects in idle areas of agricultural dams.
Keywords:
agricultural dam; idle space; land and water solar; real options; South Korea; uncertainty 1. Introduction
Renewable energy is a critical part of reducing carbon emissions. The investment of the renewable energy has greatly increased as the cost of technologies falls and efficiency continues to rise. The Korean government planned to raise the share of renewable energy in the total domestic energy generation to 20% by 2030. This plan is called the “Renewable Energy 3020 Plan”. The total of 48.7 GW of new renewable energy facilities is planned to be achieved by activating resident participation projects and promoting large-scale renewable energy projects [1]. In South Korea, the Renewable Portfolio Standards (RPS) mechanism is implemented to expand the supply of renewable energy. The RPS mechanism is a system that mandates designated power companies to supply a certain percentage or a certain amount of total power generation with renewable energy. The aim of Korea’s RPS mechanism is to reduce the use of fossil energy and to increase the use of renewable energy. The Korean government tries to achieve the target of the share of renewable energy in accordance with the UN Climate Change Convention.
In South Korea, renewable energy project owners have two revenue structures, as illustrated in Figure 1. System Marginal Price (SMP) is determined at the junction point of the electricity demand curve and the supply curve of South Korea’s electricity market on the Korea Power Exchange (KPX) [2]. If energy supply companies fail to produce their own mandatory quota, they must purchase renewable energy certificates (RECs) [2]. The REC unit price may fluctuate owing to the REC weight, which is set differently depending on the installation type and capacity [3,4].
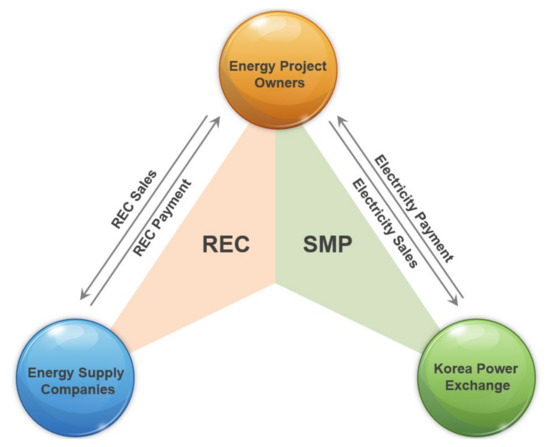
Figure 1.
Revenue structure of renewable energy project owners.
Among the 48.7 GW of target facilities in South Korea in 2030, the solar power generation capacity is 30.8 GW (63%), accounting for the largest share [1]. Solar power can be generated if sunlight and solar radiation are secured. In addition, the production of solar modules generates few harmful substances, solar power generation does not produce any by-products, and maintenance is easy without damaging the natural environment [5]. Solar modules have an average life span of 20–25 years, and if they only pay for their initial investment cost, they can earn profits for a long time while maintaining more than 90% of their performance [5]. However, as their energy density and power generation efficiency are low, many solar panels and installation areas are required. This could result in environmental problems such as the reduction of forest resources and damage to the ecosystem.
Solar power is divided into land and water solar power systems. In South Korea, the installation of land solar power systems using existing buildings and rooftops is increasing in order to avoid environmental problems. Since the water solar power system provides a greater REC weight than land solar power, the Korean government induces water solar projects to avoid environmental problems. Water solar has the following advantages. First, no natural damage occurs as a result of the installation of solar power plants. Second, the water surface, which is the idle space of the dam and reservoir, can be used. Third, because the installation is placed on the water surface, foundation work for land is unnecessary. Fourth, the power generation efficiency increases owing to the low temperature of water. Fifth, it is possible to secure water resources continuously by suppressing water evaporation [6]. However, water solar has two disadvantages compared to land solar. First, installing a water solar power system requires a structure floater to float the structure in the water, a mooring system to fix the position, and an underwater cable to transmit electricity generated from the system to land. Owing to these additional works, water solar requires a relatively high investment cost compared to land solar power. Second, because they are exposed to a more corrosive environment than that of structures installed on land, corrosion-resistant materials must be used in their construction. Water solar power projects in dams and reservoirs as well as land solar power projects using idle areas have recently been developed; however, it is difficult to select an appropriate location and secure project profitability.
Various uncertainties affect the profitability of solar power projects, such as electricity selling prices, weather conditions, electricity production volume, construction costs, and operation and maintenance (O&M) costs. Various methods, such as net present value (NPV), internal rate of return (IRR), and benefit/cost (B/C) ratio, are used to conduct economic feasibility analyses of solar power projects. However, when a project has many uncertainties and high volatility, traditional methods cannot explain project feasibility [7]. Real options analysis (ROA) considers the high volatility of cash flows under uncertainties over a project’s lifespan. Recently, research on the economic feasibility of renewable energy using ROA has been widely conducted. In this study, we propose a framework for economic analysis using ROA that considers many uncertainties caused by market and project risks.
The objective of this study is to suggest a ROA framework for land and water solar power projects in the idle areas of an agricultural dam. The four-step framework was verified as a result of a case study conducted in South Korea. Step 1 involves selecting the location and establishing the size and investment costs. In step 2, the project and the market data are analyzed. Step 3 focuses on calculating cash flow and volatility. Finally, Step 4 is used to make investment decisions. The remainder of this paper is structured as follows. After this introduction section, the “Literature review” section presents previous literature concerning solar projects and uncertainties using real options analysis. In the “Methods” section, we explain the ROA methodology applied in the research and present the framework used in this study. The “Results” section focuses on the application of the framework in a case study (an agricultural dam in South Korea). We present the results and findings in the “Discussion” section, and discuss the conclusions in the last section.
2. Literature Reviews
Much research has been conducted on the economic feasibility of solar power projects applying ROA. Many studies have applied ROA to highly volatile investment projects in the areas of natural resources and new technology development, such as oil, gas, telecommunications, pharmaceuticals, and semiconductors [8,9]. Mun [10] found that ROA assists investors in adopting the necessary managerial flexibility to invest in projects with highly volatile uncertainties. Lenos [11] defined the types of real options as the option to defer, the option to expand, the option to abandon, and the growth option. In particular, the option to abandon the project at any time under uncertainties with high volatility is often used and is an American-type option, meaning that it can be exercised at any time [11]. Abandonment options have recently been applied in large-scale solar power projects [12,13]. In this study, the abandonment option was applied to the case study of a solar power project under highly volatile uncertainties. The abandonment option is implemented when future profits are expected to be deficient owing to uncertainties, and is especially valuable when the NPV is marginal but there is great potential for losses, such as in large-scale infrastructure investment projects. If the payoff is not attractive, decision makers can abandon the project early without incurring significant losses [7].
Kim [14] analyzed the feasibility of the Saemangeum project in South Korea, a large-scale floating photovoltaic project. This study identified construction cost, electricity selling price, power generation production, and O&M costs as the main uncertainties affecting the profit of the project, and project profitability was found to improve using the abandonment option. Martina et al. [15] analyzed economic feasibility by using the defer option, considering the volatility of electricity prices according to policy changes for Irish utility scale solar power project investment. Felipe et al. [16] analyzed changes in electricity price according to the solar power law for Colombia’s power purchase agreement (PPA) and applied the defer option to analyze optimal investment timing. Mariia [17] reviewed the literature on the application of real options in renewable energy projects. In this study, electricity price, technology, production, fuel price, inflation, O&M costs, cost of capital, exchange rate, and project value were used as major uncertainties in solar, wind, and hydropower projects. Gonzalo et al. [18] analyzed the impact of changes in R&D financing on renewable energy projects from the company’s perspective and used the defer and abandonment options. Zhang et al. [19] proposed a real option model that applied a deferral option to evaluate the economic feasibility of a land solar power plant in China considering various uncertainties, such as the certified emission reduction (CER) price, oil price, investment cost, and electric panel price. Jeon et al. [20] suggested a real option model for calculating optimal government subsidies for land solar power project investment by reflecting uncertainties, such as electricity selling prices, electricity production volume, interest rates, risk premiums, risk-free interest rates, and exchange rates in South Korea. Kim et al. [21] conducted an economic feasibility analysis using climate scenarios to predict roof solar energy production and future electricity selling prices through the application of the abandonment option of ROA. Martinez et al. [13] proposed a method for analyzing the economic feasibility of grid-connected solar energy investment projects by considering the UK’s solar technology development using deferral options for ROA. Kim et al. [22] presented a ROA framework for economic analysis by considering the uncertainty in the selling price of electricity and applying this option to defer the expansion of building-integrated solar power facilities. Kim and Kim [23] studied the uncertainty factor of solar power and analyzed its economic feasibility by the management decision of an expansion investment under the RPS mechanism.
3. Methods
3.1. Real Options Analysis
3.1.1. Discounted Cash Flow
DCF (Discounted Cash Flow) is widely used as a traditional method for evaluating project value. The most representative DCF is NPV, which is calculated using Equation (1). and represent the cash inflows and outflows at time t, respectively, and r represents the discount rate, where T is the project period. If the NPV is greater than 0, profit from the investment is expected; if the NPV is less than 0, loss is expected [7].
DCF is a useful evaluation method for easily and reliably estimating future cash flows. However, it is not suitable when the volatility of key variables over a long period is high, as in most energy projects, including those involving renewable energy. This is because fluctuations in cash flow are caused by various uncertainties. Uncertainties in cash flows can be reflected by adding a risk premium to the discount rate. However, because it is difficult to accurately reflect the dynamic changes in the project environment and the impact of decision-making at each investment stage, there is a limit to its applicability to energy projects [24,25].
3.1.2. ROA Methodology
An option is the right to buy or sell assets—a financial option if the asset is a financial asset and a real option if the asset is a nonfinancial option. Options for the right to purchase an asset are call options and are the right to purchase an asset at an exercise price until a specified expiration date. As an option is a right, it is independent of the value of the asset, so its value cannot be less than zero. Investment opportunities for non-financial assets are similar to those for call options. A profit opportunity arises when a company spends strike price on a project. The investment is executed (exercising the option) if the return is expected to be sufficient; otherwise, the investment is abandoned. Renewable energy projects have the same decision-making structure. If sufficient profit is expected in each phase, the project will be conducted. Otherwise, it is abandoned.
In real option analysis, the value that a project owner obtains from investing in a project is calculated as the expanded NPV, which is obtained by adding the real option value to the existing static NPV calculated using Equation (2) [7,26]. The real value of an investment project refers to that of the real options included in the project; that is, the sum of the static NPV and option values. Certainly, since different real options have different option values, different value compositions are yielded. Particularly, for real options with null option values, the value of NPV is equal to that of the expanded NPV [11].
3.1.3. Binomial Tree Model
Several methods can be used to calculate real option values. In this study, we use the binomial tree model proposed by Cox et al. (1979) [27] because it has the advantage of being able to visualize the time of application of options and a simple calculation method [7].
The initial value of the underlying asset value is given as the present value of the project’s free cash flow (in the case of a renewable energy project, the power plant operating profit from electricity sales). Using the risk adjustment discount rate that reflects risks, the present value is calculated in the same manner as the NPV calculation. The time interval of the binomial tree at which the change in asset value is measured is the same, and the rate of the rise and fall of the price is assumed to be the same. The increase rate (u) and decrease rate (d) of the asset value according to the uncertainty of the underlying asset are calculated using Equation (3) [7,26]. The asset value increases with probability () at time t = 1 to become , or decreases with probability (1 − p) to become . At t = 2, it changes to , , , and at t = 3, it changes to , , , . In the binomial tree model, the asset value is developed following a step-by-step change.
where is the volatility of the underlying asset. For ROA, it is important to estimate the volatility of a project.
Volatility influences project profit. Through volatility, profits may increase or a deficit may occur. Thus, estimating volatility is the most important step in ROA. The logarithmic cash flow returns method provides volatility based on the variability of the same cash flow estimates used to calculate the underlying asset value [7]. This method has been used in several studies [7,20,28,29,30,31,32]. Thus, we adopted logarithmic cash flow returns in our study. The volatility () was estimated using Equation (4) [7,27], which is a logarithmic cash flow return method:
where n is the number of annual sales during the project period, is the ith sale, and is the average value of . This equation provides the volatility of a project based on cash flow estimates derived from the calculated future asset value [7]. This equation is a function of the forecast project cash flow during the production phase, the natural logarithm of each relative return, and the standard deviation of the natural logarithm of each relative return [7].
When a risk-neutral approach is applied to ROA using the binomial tree model, the expected return on the asset for each period is equal to the risk-free interest rate (r). This is expressed by Equation (5) [7,26].
where the asset value increase probability p is a risk-neutral probability and is calculated as in Equation (6) [7,26].
At option expiration (t = T), the asset value change terminates at the right end of the binomial tree. The option value of each node was calculated using the backward process. Exercise price refers to the present value of the investment cost, and is the asset value of node [7,26].
The real option value composed of sequential real options is calculated by repeating the above asset value development and option value calculations for each real option. It is calculated in a backward process from the last real option value, and the subsequent real option value becomes the initial value of the previous real option value. The exercise price for each real option reflects the investment cost for each phase of the project.
3.2. Framework
We establish a research framework to conduct the valuation of land and water solar power projects for the idle areas of agricultural dams, as shown in Figure 2. Step 1 involved selecting the location and determining the size and investment costs of the project. In step 2, the project data (construction cost, O&M costs, sunshine hours, and mechanical efficiency) and market data (inflation rate, discount rate, risk-free interest rate, and electricity selling price) are identified and the project revenue is calculated. When estimating the electricity production volume, the mechanical performance reduction rate is found to degrade production volume. Kim [14] proposed Equation (8), which calculates the electricity production volume of a solar power project. This equation considers the mechanical performance degradation rate of solar power panels to be 0.7 [33].
where E is the annual electricity production volume (E in kWh), is the mechanical efficiency, is the mechanical performance degradation rate, n is the period of operation (n in years), P is the capacity of the solar power installation (P in kW), and H is the generation time (H in h).
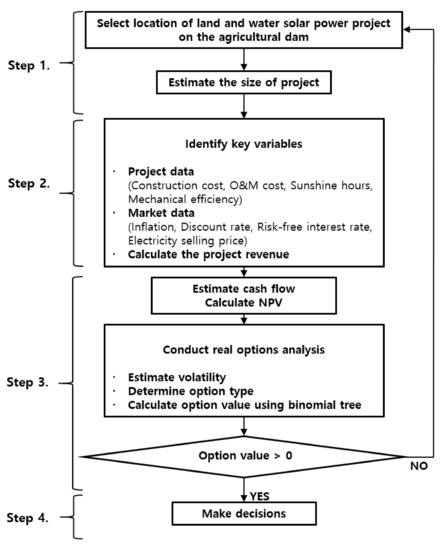
Figure 2.
The research framework for the valuation of land and water solar power projects.
In Step 3, we estimate cash flow and project volatility. We choose a suitable option type for the case study and calculate the option value by building a binomial tree. If the option value is negative, the process returns to Step 1 and the project location and size are redesigned. If the option value is positive, we proceed to Step 4, which involves making a decision regarding project investment. The following section presents a detailed description of the application of the framework to an NAD case study in South Korea.
4. Results
4.1. Case Study
In this case study, we examine the solar power project of the NAD, an agricultural dam with a height of 31 m, a length of 496 m, and a full water area of 780 ha located in southwest South Korea. Details about the project location are shown in Figure 3. Figure 4a shows the candidates for the installation of land and water solar power, and Figure 4b presents the conceptual plan of the land and water solar power project in the case study. The case study will be installed as a test bed to motivate investors to adopt new economically feasible approaches in idle areas of agricultural dams in South Korea. The panels of the land solar power system were installed in the idle area of the dam body slope. The panels of the water solar power system were located on the water surface of the agricultural reservoir of the dam. The locations of the systems must be checked in terms of legal and engineering bases.
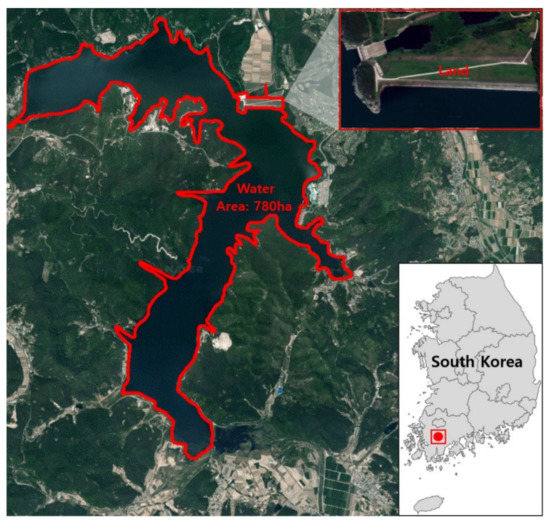
Figure 3.
Location of the case study project.
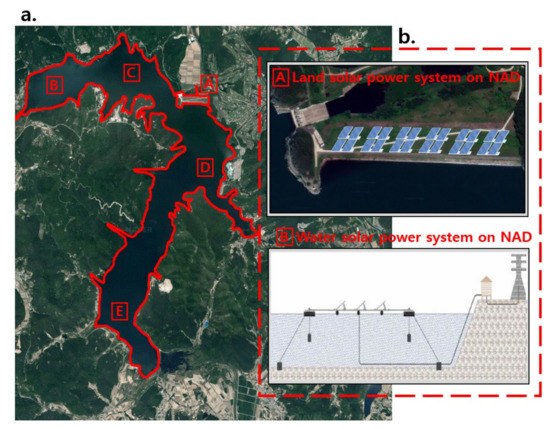
Figure 4.
(a) Candidates for installation of land and water solar power. (b) Conceptual plan of the land and water solar power project in the case study of the Naju Agricultural Dam (NAD).
South Korea has detailed regulations for installing solar power in water. First, the location in which the power system is installed must have running or stored water year-round. Second, the entire solar power system, including the solar cell module, support, and buoyancy materials, must be installed floating above the water surface. Third, the entire solar installation, including solar cell modules, supports, and buoyancy materials, should not damage the original purpose of the existing structure of the dam and reservoir, and the installation area should be limited to less than 10% of the total water surface area of the reservoir of the agricultural dam [34].
4.2. Step 1
In Step 1, we select a suitable project location based on solar power regulations and estimate the size and cost of the project. In the case of water solar power, the project investment cost varies depending on the water depth and construction environment. It is thus important to select an appropriate location for solar panel installation. Four points on the reservoir and one land point were reviewed (Figure 4a). Experts recommend a water solar power system at location B and a land solar power system at location A. The NAD had a full water level of 65.30 m, which is the highest level since construction, making it difficult to install the mooring system. Experts recommend that location B use the weight-fixing method to reduce the investment cost of the water solar power system. We attempted to minimize the environmental damage by installing a land solar power generation system at location A, which is the dam slope. The land and water solar installation locations (locations A and B) were prioritized as the most cost-effective among the candidates. A water solar power system of 35 MW will be installed in 4.5% of the full water area of NAD. A solar power of 1 MW will be installed in the idle space of the dam slope.
4.3. Step 2
In Step 2, we collect data about the project and market that influence a project’s cash flow. The project data are related to electricity production, e.g., construction costs, O&M costs, sunshine hours, and mechanical efficiency. Market data are driven by market risks such as inflation, discount rate, risk-free interest rate, and electricity selling price. The data for the case study are summarized in Table 1, which contains the methods, data sources, and references.

Table 1.
Details of the case study.
The construction costs for the project are 1.28 million USD for land solar and 65.62 million USD for water solar. The total construction cost is 66.89 million USD, or 13.38 million USD invested equally every year for five years. The O&M cost is assumed to be 1.5% of annual sales [35]. The performance of solar panels deteriorates every year. The reduction rate of solar power efficiency is generally 0.8% for land and 0.5% for water [33,41]. The project period is assumed to be five years for the design and construction period and 20 years for the operation period. The Korea Meteorological Administration (KMA) reported that the average sunshine hours at the project location (Naju) was 6.18 h during the 20 years between 2000 and 2019 [42]. However, shade, dust, clouds, snow, and rain shorten solar power generation time. This value was thus assumed to be 4.33 h by multiplying sunshine hours by an efficiency factor of 0.7 [36]. The mechanical efficiency is assumed to be 0.75 [36].
An inflation rate of 3.4% was applied from the average inflation data of South Korea over the past 30 years [37]. The IEA (2010) proposes a discount rate of 5% or 10% depending on the energy price and selling price of carbon dioxide emission rights by country when analyzing the economic feasibility of energy projects. Since the land and water solar power project in this study has a higher uncertainty than the fossil fuel energy project, a discount rate of 10% was used [38]. The risk-free interest rate applied an average value of 5% to the three-year treasury bonds in South Korea from 1997 to 2020 [39]. Electricity is purchased by the government-owned company KEPCO (Korea Electric Power Corporation) in the electricity market of KPX [40]. The selling price of electricity produced by renewable energy sources comprises two parts: the SMP and the REC. Table 2 shows the prices of the SMP and REC between 2012 and 2019. The supply of electricity increases, but demand does not change in South Korea [38]. The average price of SMP in 2019 was 0.08 USD/kwh, and in 2012 it was 0.14 USD/kwh. The SMP constantly decreases. This study applied the average SMP between 2012 and 2019 of 0.10 USD /kWh. The average REC price in 2019 was 0.05 USD/kwh, and the price in 2012 was 0.15 USD /kwh. The price of RECs fluctuates annually. An average REC price of 0.10 USD/kwh was applied; the REC weight is divided according to the installation type and the capacity of the solar power system in South Korea (Table 3). The project of the case study consists of 1 MW on land and 35 MW on water with REC weights of 0.7 and 1.5, respectively [43,44]. The REC can be changed at any time according to government policy. Therefore, we assume that RECs are revenue-only for 10 years from the date of operation commencement.
Table 2.
SMP and REC between 2012 and 2019 in South Korea.
Table 3.
REC weight of a solar power in South Korea.
4.4. Step 3
In Step 3, we evaluate project economics. First, we generate cash flow based on the estimation of annual sales and expenses during a project period of 25 years (5 years for construction and 20 years for operation). The electricity production volume of solar power was estimated according to the generation time and solar power capacity. Figure 4 shows cash flow over the project period of 25 years.
The NAD solar power project was conducted under the conditions listed in Table 1. NPV is −6.67 million USD using Equation (1). Based on NPV analysis, there was no economic feasibility. As this project has many uncertainties affecting profitability, we analyze the project value by applying ROA. Through Table 4 and Equation (1), we can estimate that the future profit of the project is expected to be deficient (−6.67 million USD) due to uncertainties such as the electricity selling price, investment cost, and electricity production. Therefore, in this study, we adopted the abandonment option during the construction stage to improve project profitability. Using Equation (4), 22.08% of annual volatility () of revenue is calculated. The underlying asset and option values are calculated using Equations (6) and (7) and the binomial tree, as shown in Figure 5.
Table 4.
Details of project cash flow.
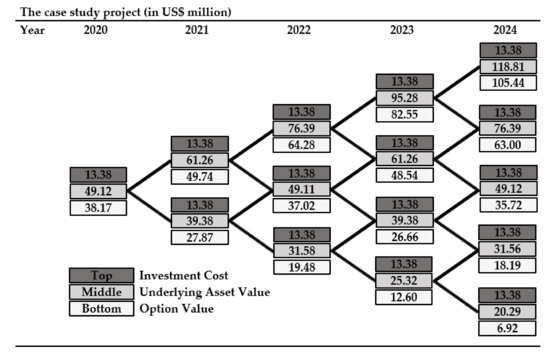
Figure 5.
Binomial tree model of real options analysis for the case study.
Figure 5 shows the investment costs (top numbers), underlying asset values (middle numbers), and option values (bottom numbers) at each node of the binomial tree by backward induction. Each node represents the value maximization of abandonment versus continuation. At every node, investors have the option to either abandon the project or keep the option open until it expires. Equations (a), (b), and (c) explain how the option value is calculated.
- (a)
- Start with terminal nodes that represent the last time step. At the last node, the expected value is 105.44 million USD (underlaying asset value—investment cost) compared to the abandonment value of 0. As investors want to maximize their returns, they would invest rather than abandon the project. Thus, the option value at this node is 105.44 million USD.
- (b)
- Next, the intermediate nodes were moved one step away from the last node. Starting at the top, we calculated the expected value to keep the option open. This is simply the discounted weighted average of the potential future option values using risk-neutral probability (Equation (6)), 82.55 million USD. As this value is larger than the abandonment value of 0, investors keep the option and continue. If the calculated value is less than zero, investors abandon the project.
- (c)
- We continue to calculate the option valuation using a binomial tree. Finally, we obtain 82.55 million USD of the option value at time = 0.
This result means that when the project owner (or investors) holds the abandonment option, it is possible to secure an additional profit of 44.83 million USD compared with the existing NPV of −6.67 million USD. Management flexibility using the abandonment option improved the economic feasibility of the project. This project is not feasible based only on the result of a negative NPV. However, additional profits can be secured by applying the real options. The land and water solar power project in the idle areas of agricultural dams of NAD is an appropriate project to secure economic feasibility.
4.5. Step 4
The uncertainty factors for the NAD project include electricity selling prices, weather conditions, electricity production volume, construction costs, and O&M costs. If the market becomes favorable, investors can hold and not exercise the abandonment option during the five years from 0 to 4. If the market is unfavorable, investors can exercise the abandonment option and avoid investing more money to prevent further financial losses.
However, we could not determine the residual value (salvage value) of land and water solar deployment in idle areas of agricultural dams in our case study for the following reasons. First, the idle areas of agricultural dams in South Korea belong to agricultural dam bodies. Thus, government-owned companies that own and operate agricultural dams should not sell the property of government-owned infrastructure. Second, differing water depths make it difficult to measure the value of the underwater infrastructure of the water solar power system and sell the constructed underwater facilities. Thus, we did not consider the residual values. If we conduct ROA, including the residual value, the option value will be larger than the 38.17 million USD calculated in this study. This result indicates that if the residual value is included, the project has greater economic feasibility.
5. Discussion
Solar power generation has low efficiency; therefore, a large location must be secured to ensure economic feasibility. However, there are many mountainous areas and a high population density in South Korea, so it is inevitable to damage forests and pay high land usage fees to secure a large location. This problem has made it difficult to ensure the economic feasibility of solar power projects in South Korea, causing serious environmental damage, and new locations are needed to expand the supply of renewable energy. The solar power project using the dam proposed in this study is expected to solve such problems.
Our findings have implications for the study of renewable energy from agricultural and environmental perspectives. First, the power generation efficiency of water solar power is approximately 10% higher than that of land solar power because water has a cooling effect on panels and shade can be avoided. Moreover, there is no rapid increase in panel temperature; therefore, the power generation efficiency of water solar does not decrease, even in midsummer. In addition, large-scale solar energy development is possible without damaging mountainous areas or farmland. Second, the development of existing solar power projects has been expanded for mountainous areas and farmland with relatively low land usage fees to secure a large area. However, environmental problems have emerged due to forest damage. In the case of solar power projects using dams, additional forest destruction can be prevented by utilizing the idle area of existing dams, thereby enabling environmental preservation. Third, in South Korea, the cost of securing land is very high because of the high population density. However, the idle areas of agricultural dams in rural areas can be utilized, so additional land usage fees are not required, and economic feasibility can be greatly improved. Solar power projects located in dams can be proposed as a customized Korean solar power project model that can overcome the difficulties caused by South Korea’s geographical and environmental characteristics.
In this study, we found the following findings and insights. First, we proposed a framework for the economic evaluation of land and water solar power projects using agricultural dams and conducted a case study using the NAD project. Through this framework, project data (construction cost, O&M cost, sunshine hours, and mechanical efficiency) and market data (inflation, discount rate, risk-free interest rate, and electricity selling price) were identified as uncertainty factors to be considered in solar power projects. In our case study, the NAD project was found to have no business feasibility with an NPV of −6.67 million USD, but, as a result of analysis using real options, it was confirmed that a profit of 38.17 million USD was generated. This framework means that a project can secure sufficient business feasibility through strategic decision making in land and water solar power projects, using the existing idle areas of dams. Second, we evaluate the economic feasibility of land and water solar power projects using the idle locations of dams using the abandonment option, which can be applied when the NPV is insufficient and the possibility of loss is predicted to be large. If the project situation is unfavorable, the investor may abandon the project to prevent further investment (loss). We conducted a case study in South Korea, where various solar power projects are currently in progress, but it is difficult to secure profitability. The NAD project was determined to be unprofitable because the NPV was calculated as a negative number, but it was confirmed that the project profitability improved significantly if the option to abandon the project was applied at any time during the construction period. As such, abandonment options are particularly advantageous when applied to projects with insufficient profitability but high loss potential.
In our study, a solar power project on land and water of the agricultural was studied using ROA (Real Options Analysis). However, there are some strengths and weaknesses of the case study. The strengths of the case study are twofold. First, ROA for a solar power project has been widely used for studies of economic feasibility. However, the difference between ours and the previous relevant studies is that we conducted the study about a multi-location for a solar project on land and water of an agriculture dam. This case study shows that solar power can be installed efficiently in multiple locations by using the idle space of the already operated dam, without structural deformation of the dam body. Second, we identified various uncertainties for ROA on land and water solar project of an agricultural dam. Through the case study, we classified uncertainty factors into project data (construction cost, O&M cost, sunshine hours, mechanical efficiency) and market data (inflation, discount rate, risk-free interest rate, electricity selling price). Each value was determined based on historical data and assumptions with reference to literature. These methods are commonly used in various research papers.
The weaknesses of the case study are twofold as well. First, the results of the case study may depend on initial assumptions of key uncertainties including construction costs, O&M costs, inflation rate, and electricity selling prices. To solve such problems, D. Campisi et al. [45] suggested that a sensitivity analysis based on the volatility of the project and key uncertainties is needed. Sensitivity analysis was performed to find out how the volatility of cash flow in the range of 20% to 70% affects the option value. Sensitivity analyses were also conducted for investment costs, O&M costs, electricity selling prices, and inflation rate, which are the main uncertainties in the −50% to +50% range. The simulation result shows that the value of the project changes when the value of uncertainty increases or decreases. Figure 6 presents the option values calculated by changing volatility and key uncertainties. The greater the volatility, the greater the value of the project obtained using ROA. The value of the project also increases with the higher selling price of electricity. If project conditions are unfavorable, such as an increase in investment or O&M costs or a fall in electricity sales prices, the value of the project considering ROA decreases. Electricity selling price had the largest impact on option value, followed by investment cost, maintenance cost, and inflation rate. This means that abandon option may be exercised in case of unfavorable situations. Second, this case study did not explain the change in the electricity selling price of the solar power generation business. In this case study, the government provides a guarantee that locks the REC weights and prices of solar power until the end of the project’s lifecycle. This allows investors to build solar power projects with confidence. If the government changes the REC weight or electricity selling price system for any reason, the impact of whether the government subsidizes or not should be quantified. In other words, it may be necessary to calculate the option value according to the change in the electricity selling price. The second problem is the weakness of this case study, which can be affected by changes in government policy at any time.
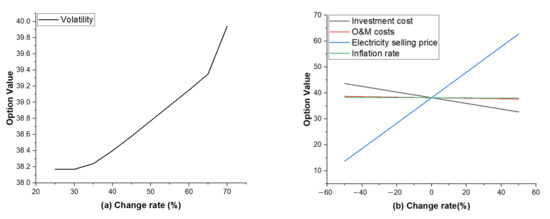
Figure 6.
(a) Sensitivity analysis under change rate of volatility (million USD). (b) Sensitivity analysis under change rate of key uncertainties (million USD).
6. Conclusions
This study presents an economic evaluation framework for investments in land and water solar power projects in idle areas of agricultural dams. The four-step framework was verified through a case study conducted in South Korea. Step 1 selects the location of the project and determines its size and investment cost. Step 2 identifies project and market data and estimates the project sales. Step 3 estimates cash flow and project volatility. We calculate the option value by building a binomial tree model. If the option value is negative, the process returns to Step 1 to relocate the project location and resize it. If the option value is positive, we perform Step 4 to make decisions regarding investment in the project. Through a number of research papers, key variables have been investigated, such as project data and market data. NPV was calculated using the cash flow of the project. ROA was conducted using project volatility and a binomial tree model.
The contribution of our study to the body of knowledge is two-fold. The first contribution consists of a framework for evaluating the economic feasibility of solar power projects in idle areas of agricultural dams. The framework using ROA assists decision making for investing in land and water solar power projects on agricultural dams. Second, we found that abandonment option improves the profitability of renewable energy projects under project uncertainty. We then conducted a case study on a Korean NAD project using this framework. The NAD project was analyzed to have no economic feasibility with an NPV of −6.67 million USD, but using the abandonment option in this framework, we found that a profit of 38.17 million USD was generated. This means that the NAD project can secure business feasibility through strategic decision making (abandonment option) during the construction period. The proposed framework will assist investors in planning an appropriate location and size for solar power projects in the idle areas of agricultural dams. The framework presented in this study can also be applied to agricultural dams in other countries.
However, this study had several limitations. First, uncertainties in solar power generation will increase as a result of changes in the amount of sunlight caused by climate change. The accuracy of future weather information is an important factor for estimating the economic feasibility of a solar power project. Detailed and accurate weather information will improve the accuracy of the project’s economic feasibility. Second, the real options analysis utilized management flexibility. In this study, the abandonment option is applied instead of other options, such as the defer and compound options. Various option types need to be applied to maximize profits by comparing option types in the field of renewable energy projects.
Author Contributions
S.N. and K.K. wrote and revised the manuscript and participated in the study design. C.L. designed the study, interpreted the data, and revised the manuscript. W.J., the corresponding author, directed the study and revised the final version of the manuscript. All authors have read and agreed to the published version of the manuscript.
Funding
This research received no external funding.
Institutional Review Board Statement
Not applicable.
Informed Consent Statement
Not applicable.
Data Availability Statement
Not applicable.
Acknowledgments
This study was supported by research fund from Chosun University, 2017.
Conflicts of Interest
The authors declare no conflict of interest.
References
- Ministry of Trade Industry and Energy Republic of Korea. The 9th Basic Plan for Long-Term Electricity Supply and Demand. Available online: http://www.motie.go.kr/motie/ne/presse/press2/bbs/bbsView.do?bbs_seq_n=163670&bbs_cd_n=81 (accessed on 25 January 2021).
- Oh, S.; Kong, J.; Lee, W.; Jung, J. Development of Optimal Energy Storage System Sizing Algorithm for Photovoltaic Supplier in South Korea. In Proceedings of the 2018 IEEE Power & Energy Society General Meeting (PESGM), Portland, OR, USA, 5–10 August 2018; pp. 1–5. [Google Scholar] [CrossRef]
- Choi, D.G.; Park, S.Y.; Hong, J.C. Quantitatively exploring the future of renewable portfolio standard in the Korean electricity sector via a bottom-up energy model. Renew. Sustain. Energy Rev. 2015, 50, 793–803. [Google Scholar] [CrossRef]
- Renewable Energy Certificate System International. Available online: http://www.recs.org/voluntary-market/market (accessed on 2 July 2021).
- Zerhouni, F.Z.; Zerhouni, M.H.; Zegrar, M.; Benmessaoud, M.T.; Stambouli, A.B.; Midoun, A. Proposed methods to increase the output efficiency of a photovoltaic (PV) system. Acta Polytech. Hung. 2010, 7, 55–70. [Google Scholar]
- Choi, Y.K. A study on power generation analysis of floating PV system considering environmental impact. Int. J. Softw. Eng. Appl. 2014, 8, 75–84. [Google Scholar] [CrossRef]
- Kodukula, P.; Papudesu, C. Project Valuation Using Real Options: A Practitioner’s Guide; J. Ross Publishing: Fort Lauderdale, FL, USA, 2006; ISBN 978-193-215-943-1. [Google Scholar]
- Amram, M.; Kulatilaka, N. Real Options: Managing Strategic Investment in an Uncertain World (Financial Management Association Survey and Synthesis), 1st ed.; Oxford University Press: Oxford, UK, 1998; ISBN 978-087-584-845-7. [Google Scholar]
- Copeland, T.; Antikarov, V. Real Options: A Practitioner’s Guide; Texere Publishing Limited: New York, NY, USA, 2001; ISBN 978-1587991868. [Google Scholar]
- Mun, J. Real Options Analysis: Tools and Techniques for Valuing Strategic Investments and Decisions, 2nd ed.; John Wiley & Sons: Hoboken, NJ, USA, 2012; ISBN 987-0-471-74748-2. [Google Scholar]
- Trigeorgis, L. Real Options: Managerial Flexibility and Strategy in Resource Allocation; MIT press: Cambridge, MA, USA, 1996; ISBN 978-0262201025. [Google Scholar]
- Agaton, C.B. Application of real options in carbon capture and storage literature: Valuation techniques and research hotspots. Sci. Total Environ. 2021, 795, 1–15. [Google Scholar] [CrossRef]
- Martinez, C.; Eduardo, A.; Brian, A.; Joseph, M. Assessment of domestic photovoltaic systems based on real options theory. Prog. Photovolt. Res. Appl. 2013, 21, 250–262. [Google Scholar] [CrossRef]
- Kim, K. Real Options Analysis for the Investment of Floating Photovoltaic Project in Saemangeum. KSCE J. Civ. Eng. 2021, 22, 90–97. [Google Scholar] [CrossRef]
- Assereto, M.; Byrne, J. No real option for solar in Ireland: A real option valuation of utility scale solar investment in Ireland. Renew. Sustain. Energy Rev. 2021, 143, 1–9. [Google Scholar] [CrossRef]
- Cuervo, F.I.; Arredondo-Orozco, C.A.; Marenco-Maldonado, G.C. Photovoltaic power purchase agreement valuation under real options approach. Renew. Energy Focus 2021, 36, 96–107. [Google Scholar] [CrossRef]
- Kozlova, M. Real option valuation in renewable energy literature: Research focus, trends and design. Renew. Sustain. Energy Rev. 2017, 80, 180–196. [Google Scholar] [CrossRef]
- Martín-Barrera, G.; Zamora-Ramírez, C.; González-González, J.M. Application of real options valuation for analysing the impact of public R&D financing on renewable energy projects: A company’s perspective. Renew. Sustain. Energy Rev. 2016, 63, 292–301. [Google Scholar] [CrossRef]
- Zhang, M.M.; Zhou, P.; Zhou, D.Q. A real options model for renewable energy investment with application to solar photovoltaic power generation in China. Energy Econ. 2016, 59, 213–226. [Google Scholar] [CrossRef]
- Jeon, C.; Lee, J.; Shin, J. Optimal subsidy estimation method using system dynamics and the real option model: Photovoltaic technology case. Appl. Energy 2015, 142, 33–43. [Google Scholar] [CrossRef]
- Kim, K.; Kim, S.; Kim, H. Real options analysis for photovoltaic project under climate uncertainty. In Proceedings of the 2016 International Conference on New Energy and Future Energy System (NEFES 2016), Beijing, China, 19–22 August 2016; pp. 1–8. [Google Scholar]
- Kim, B.; Kim, K.; Kim, C. Determining the optimal installation timing of building integrated photovoltaic systems. J. Clean. Prod. 2017, 140, 1322–1329. [Google Scholar] [CrossRef]
- Kim, E.M.; Kim, M.S. Evaluating Economic Feasibility of Solar Power Generation Under the RPS System Using the Real Option Pricing Method: Comparison between Regulated and Non-regulated Power Providers. J. Korean Inst. Electr. Electron. Mater. Eng. 2013, 26, 690–700. [Google Scholar] [CrossRef][Green Version]
- Dixit, A.K.; Pindyck, R.S. Investment under Uncertainty; Princeton University Press: Princeton, NJ, USA, 1994; ISBN 9781400830176. [Google Scholar]
- Awerbuch, S.; Dillard, J.; Mouck, T.; Preston, A. Capital Budgeting, Technological Innovation and the Emerging Competitive Environment of the Electric Power Industry. Energy Policy 1996, 24, 195–202. [Google Scholar] [CrossRef]
- Santos, L.; Soares, I.; Mendes, C.; Ferreira, P. Real Options versus Traditional Methods to assess Renewable Energy Projects. Renew. Energy 2014, 68, 588–594. [Google Scholar] [CrossRef]
- Cox, J.C.; Ross, S.A.; Rubinstein, M. Option pricing: A simplified Approach. J. Financ. Econ. 1979, 7, 229–263. [Google Scholar] [CrossRef]
- Kim, K.; Kim, J.S. Economic Assessment of Flood Control Facilities under Climate Uncertainty: A Case of Nakdong River, South Korea. Sustainability 2018, 10, 308. [Google Scholar] [CrossRef]
- Kim, K.; Ha, S.; Kim, H. Using real options for urban infrastructure adaptation under climate change. J. Clean. Prod. 2017, 143, 40–50. [Google Scholar] [CrossRef]
- Kim, K.; Jeong, H.; Ha, S.; Bang, S.; Bae, D.H.; Kim, H. Investment timing decisions in hydropower adaptation projects using climate scenarios: A case study of South Korea. J. Clean. Prod. 2017, 142, 1827–1836. [Google Scholar] [CrossRef]
- Oh, S.; Kim, K.; Kim, H. Investment decision for coastal urban development projects considering the impact of climate change: Case study of the Great Garuda Project in Indonesia. J. Clean. Prod. 2018, 178, 507–514. [Google Scholar] [CrossRef]
- Kim, K.; Park, T.; Bang, S.; Kim, H. Real Options-Based Framework for Hydropower Plant Adaptation to Climate Change. Eng. Manag. J. 2017, 33, 4016049. [Google Scholar] [CrossRef]
- Cho, S.; Lee, S. Calculation of Photovoltaic Market Potential and Analysis of Implementation Cost Considering Regional Economics; Korea Energy Economics Institute (KEEI): Ulsan, Korea, 2018; Available online: http://www.keei.re.kr/web_keei/en_publish.nsf/by_report_types/A6B912B73F56B429492584E7002E9DDD/$file/BAS1810e.pdf (accessed on 2 July 2021).
- Korea Environment Institute (KEI). Available online: https://www.kei.re.kr/eng/ (accessed on 5 July 2021).
- International Energy Agency (IEA). Electricity Information 2015; International Energy Agency (IEA): Paris, France, 2015; ISSN 20783442. [Google Scholar]
- Jordan, D.C.; Kurtz, S.R. Photovoltaic Degradation Rates—An Analytical Review. Prog. Photovolt. Res. Appl. 2013, 21, 12–29. [Google Scholar] [CrossRef]
- The World Bank. Available online: https://data.worldbank.org/indicator/FP.CPI.TOTL.ZG (accessed on 10 July 2021).
- Organization for Economic Cooperation and Development. Projected Costs of Generating Electricity; Renouf Publishing Co Ltd.: Ogdensburg, NY, USA, 2010; ISBN 978-92-64-08430-8. [Google Scholar]
- Bank of Korea Economic Statics System. Available online: https://ecos.bok.or.kr/mobile/100KeyStatCtl.jsp?actionType=statSub&pGubunCode=K02000 (accessed on 12 July 2021).
- Electric Power Statistics Information System. Available online: http://epsis.kpx.or.kr/epsisnew/selectMain.do (accessed on 12 July 2021).
- Park, J.H.; Lee, H.D.; Tae, D.H.; Marito, F.; Rho, D.S. A Study on Disposal Diagnosis Algorithm of PV Modules Considering Performance Degradation Rate. J. Korea Acad.-Ind. Coop. Soc. 2019, 20, 493–502. [Google Scholar] [CrossRef]
- Korea Meteorological Administration. Climate Scenarios of Korea; Korea Meteorological Administration: Seoul, Korea, 2020; ISBN 978-89-93652-60-4.
- Ko, D.H.; Chung, J.; Lee, K.S.; Park, J.S.; Yi, J.H. Current policy and technology for tidal current energy in Korea. Energies 2019, 12, 1807. [Google Scholar] [CrossRef]
- Renewable Energy Center in the Korea Energy Management Corporation. Available online: https://www.knrec.or.kr/main/main.aspx (accessed on 20 July 2021).
- Campisi, D.; Simone, G.; Donato, M. Economic feasibility of energy efficiency improvements in street lighting systems in Rome. J. Clean. Prod. 2018, 175, 190–198. [Google Scholar] [CrossRef]


Publisher’s Note: MDPI stays neutral with regard to jurisdictional claims in published maps and institutional affiliations. |
© 2022 by the authors. Licensee MDPI, Basel, Switzerland. This article is an open access article distributed under the terms and conditions of the Creative Commons Attribution (CC BY) license (https://creativecommons.org/licenses/by/4.0/).