1. Introduction
As cities grow, it would be easier to meet demand if transport modes other than automobiles, requiring less road space per traveler, were better accommodated. It is desirable for streets to be designed for everyone, whether young or old, on foot or on a bicycle, in a car or on a bus; streets embodying this ideal are called complete streets [
1,
2,
3]. Traditionally, based on old design policies, fewer considerations have been included for non-motorized transportation users (pedestrians, bicyclists, etc.) in street design until very recently [
4]. Consequently, many old streets and roadways should be upgraded based on recent policies, especially in downtown areas where there is potential for the higher demand of non-motorized travel.
Due to the current state of the COVID-19 pandemic, there is a need for downtown businesses to offer outdoor services (e.g., outdoor dining). As the COVID-19 pandemic continues to change living styles worldwide, it is becoming clear that adaptations including both physical and institutional infrastructure are needed [
1]. The crisis, along with reduced automobile travel demand, presents an opportunity for tactical urbanism, where communities can reclaim some of the street space and use it more innovatively. Despite the considerable need for these changes and improvements, budget challenges facing most agencies provide limited capacity for experimenting with different interventions. Therefore, it is essential to evaluate various street designs to identify choices in a cost-effective manner.
This paper details the process of modeling the transportation system of downtown San Jose. The application of the model as part of a decision support system is then demonstrated. The author first analyzed the network-level effects of one-way to two-way street conversions in terms of travel time and other quantitative measures at varying demand levels. Next, we modelled the network conditions under three different automobile travel demand reduction scenarios to identify corridors within downtown where a traffic lane may be taken away for tactical urbanism (e.g., open dining during the COVID-19 crisis) with minimal disruption. Given the advances and increased ease of use of microscopic traffic simulation software, there are several jurisdictions that maintain a current model for their traffic network (similar to the one developed by [
5,
6]). The evaluations conducted in this paper demonstrate an important use-case for these models.
The paper is organized as follows: the next section provides a literature review of relevant past studies followed by a description of the network modeling procedure for the base conditions. Then, an analysis of different scenarios is provided, followed by a summary of results and guidance on how the simulation models may be used by the cities.
2. Background
Simulation is a way of numerically modeling the behavior of systems over time through the use of computer software. It is an increasingly popular and useful tool for analyzing the behavior and interactions of transportation systems. Large-scale traffic simulation models require detailed data from many sources, as well as proper calibration and validation.
Jha et al. [
6] developed and calibrated a microscopic traffic simulation model, using MITSIMLab, for the entire metropolitan area of Des Moines, Iowa. Origin–destination (O–D) cone aggregations were used to generate 19,000 to 21,000 O–D pairs (i.e., number of trips from a zone (origin) to another zone (destination)). Parameters and inputs to be calibrated for this model included parameters of driving behavior and route choice models, O–D flows, and travel times. Although ideally these should all be calibrated jointly, the scale of the model required them to calibrate driving behavior parameters separately from the others. An iterative process was used to calibrate the remaining parameter and inputs. The paper concluded that its calibration and validation results were promising.
More recently, Bartin et al. [
7] calibrated and validated a large-scale traffic simulation network with a case study in New Jersey. Their model was developed using the simulation package PARAMICS and calibrated and validated using throughput, queue lengths, and travel times at selected locations on the network. Bartin et al. [
7] described the calibration and validation process as an iterative process that involved error-checking, demand estimation, capacity calibration, route choice calibration, and system performance calibration.
Their paper details the modeling effort required to build a large-scale traffic simulation model, including the available data requirements, the generation of the O–D matrix in which the number of trips going from each origin to each destination are displayed, and the results of the calibration and validation process.
Edara et al. [
8] developed a large-scale traffic simulation model for hurricane evacuation, for a case study of Virginia’s Hampton roads region, using PTV VISSIM. Their approach to the O–D demand matrix utilized the abbreviated transportation model (ATM) based on tract and population data from the 2000 US Census.
Regarding the scenarios demonstrated in this study, i.e., the one-way to two-way street conversions, Sisiopiku and Chemmannur [
9] studied the conversion of one-way street pairs to two-way streets in downtown Birmingham using Synchro and CORSIM. A comparison of the pre- and post-conversion conditions indicated no significant negative impacts on traffic circulation, such as unfavorable delays or spillbacks. For a similar evaluation, Chiu, Zhou, and Hernandez [
10] used a multiple resolution simulation and assignment approach, entailing the integration of two traffic simulation assignment methods—a dynamic traffic assignment and a microscopic traffic simulation model. Their study included a case study in El Paso, TX, concluding that two-way configurations do not always improve traffic performance. They also showed that if carefully analyzed and designed, a two-way configuration may be a desirable option.
In a post hoc evaluation of complete street treatments, Nixon et al. [
11] emphasized that complete street conversions can have network-wide impacts. The large-scale simulation model approach adopted for this study allows for studying the network-wide impacts of complete street strategies. Studying network-wide impacts is critical to assess the potential migration of traffic onto neighboring streets. This study aims to demonstrate the downtown microsimulation model as an evaluation and decision support tool that can provide network-level output evaluation metrics and help agencies select optimal strategies for their downtown traffic planning prior to implementation.
3. Network Modeling
Simulation models can aid transportation planners and designers in assessing the impact of various alternatives to existing systems. The use of simulation can help researchers and engineers visualize and evaluate the collective behaviors and patterns of travelers, as well as the implications these behaviors have for the whole transportation network. Therefore, a microsimulation approach with PTV VISSIM was considered in this research. VISSIM is a microscopic simulation model, introduced in Germany in the 1970s. VISSIM can model multimodal traffic patterns with detailed geometric features and drivers’ behavioral characteristics encountered in the transportation system [
12].
Located in the heart of Silicon Valley, San Jose is the third largest city in the State of California and the tenth largest city in the USA. Downtown San Jose continuously attracts new residents, visitors, and businesses, while experiencing tremendous growth and providing opportunities to technology professionals and others. As a result, downtown San Jose becomes more crowded by the day. Downtown San Jose also houses several key destinations such as the Diridon station, a crucial central transit hub for Silicon Valley, and the SAP Center, a major event venue. For a city the size of San Jose to be efficient and livable, urban transport systems should be able to more effectively accommodate resource-efficient modes of travel such as walking, cycling, and transit. Similarly, tactical urbanism—the use of low-cost, low-commitment modifications to the built environment (such as seating, automobile barriers, and food carts), to improve social interaction and public life—can help in creating demand for these more efficient transportation modes, and utilize the urban street space more effectively.
The network modeling procedure, including the details of network modeling, and validation are described in this section. All evaluations demonstrated in this study relate to the PM peak hour (5:00 PM to 6:00 PM) on a weekday. This timeframe was selected because it represented the worst-case scenario based on automobile travel demand patterns.
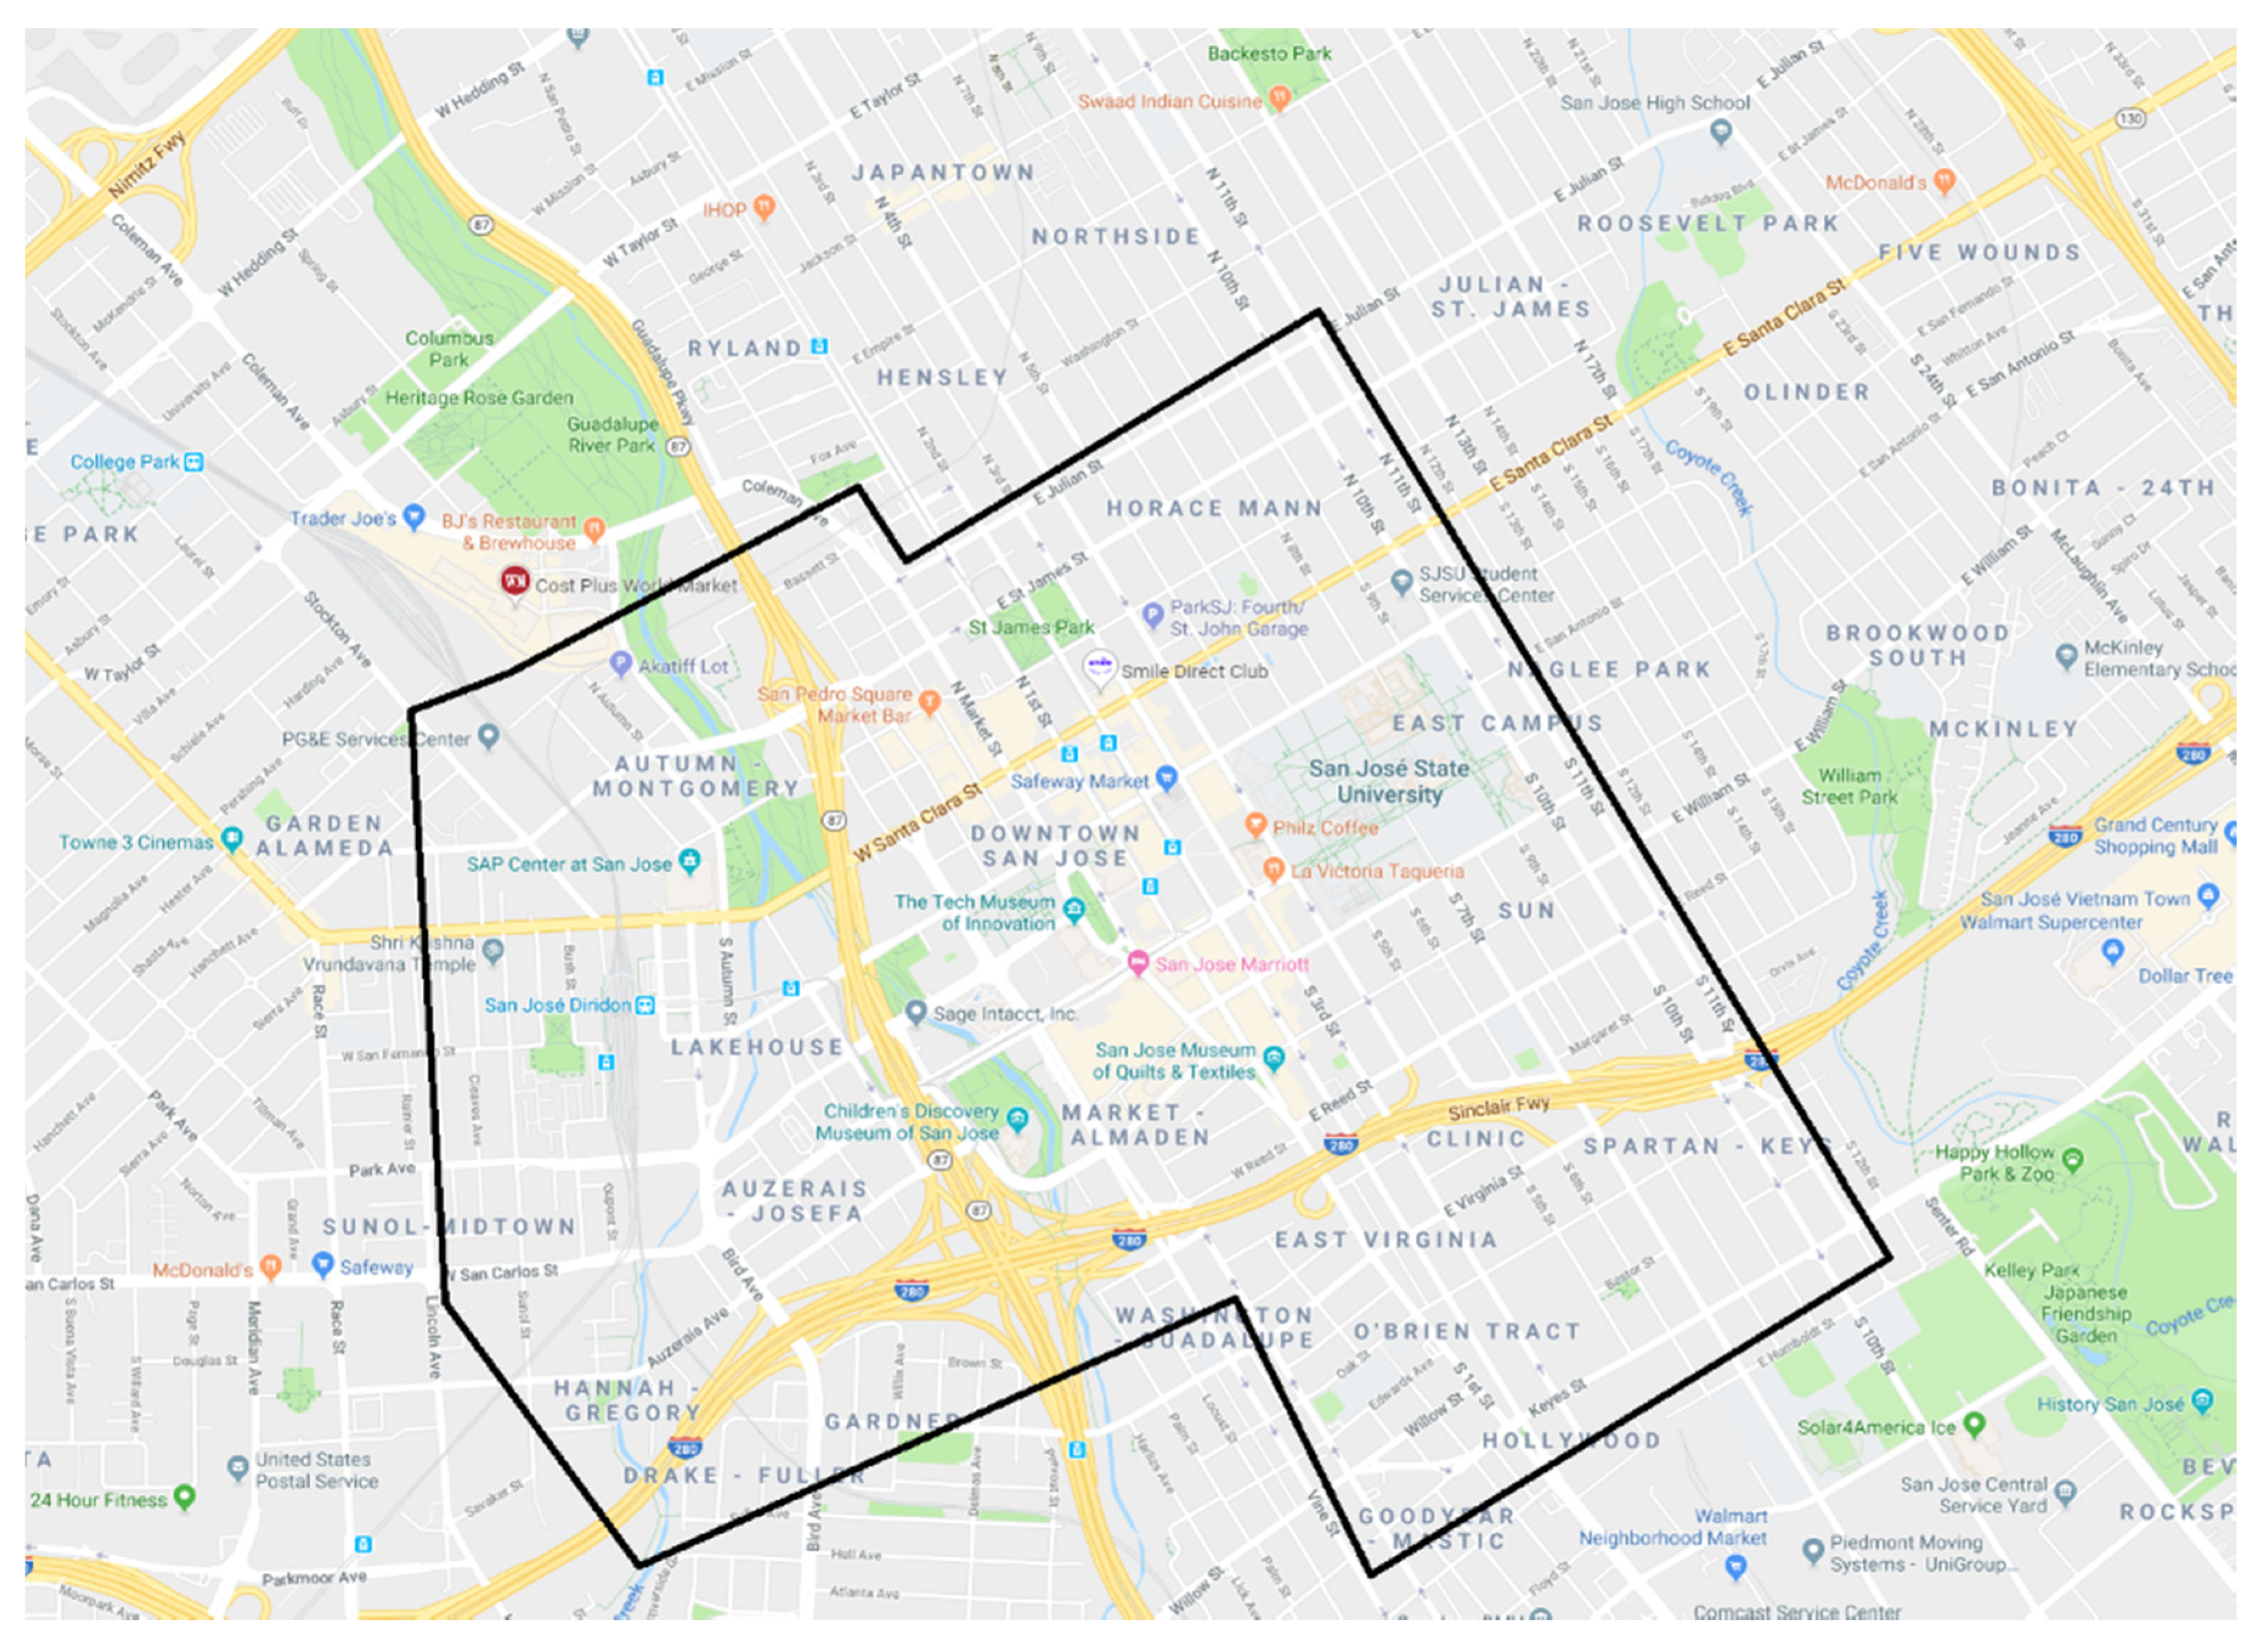
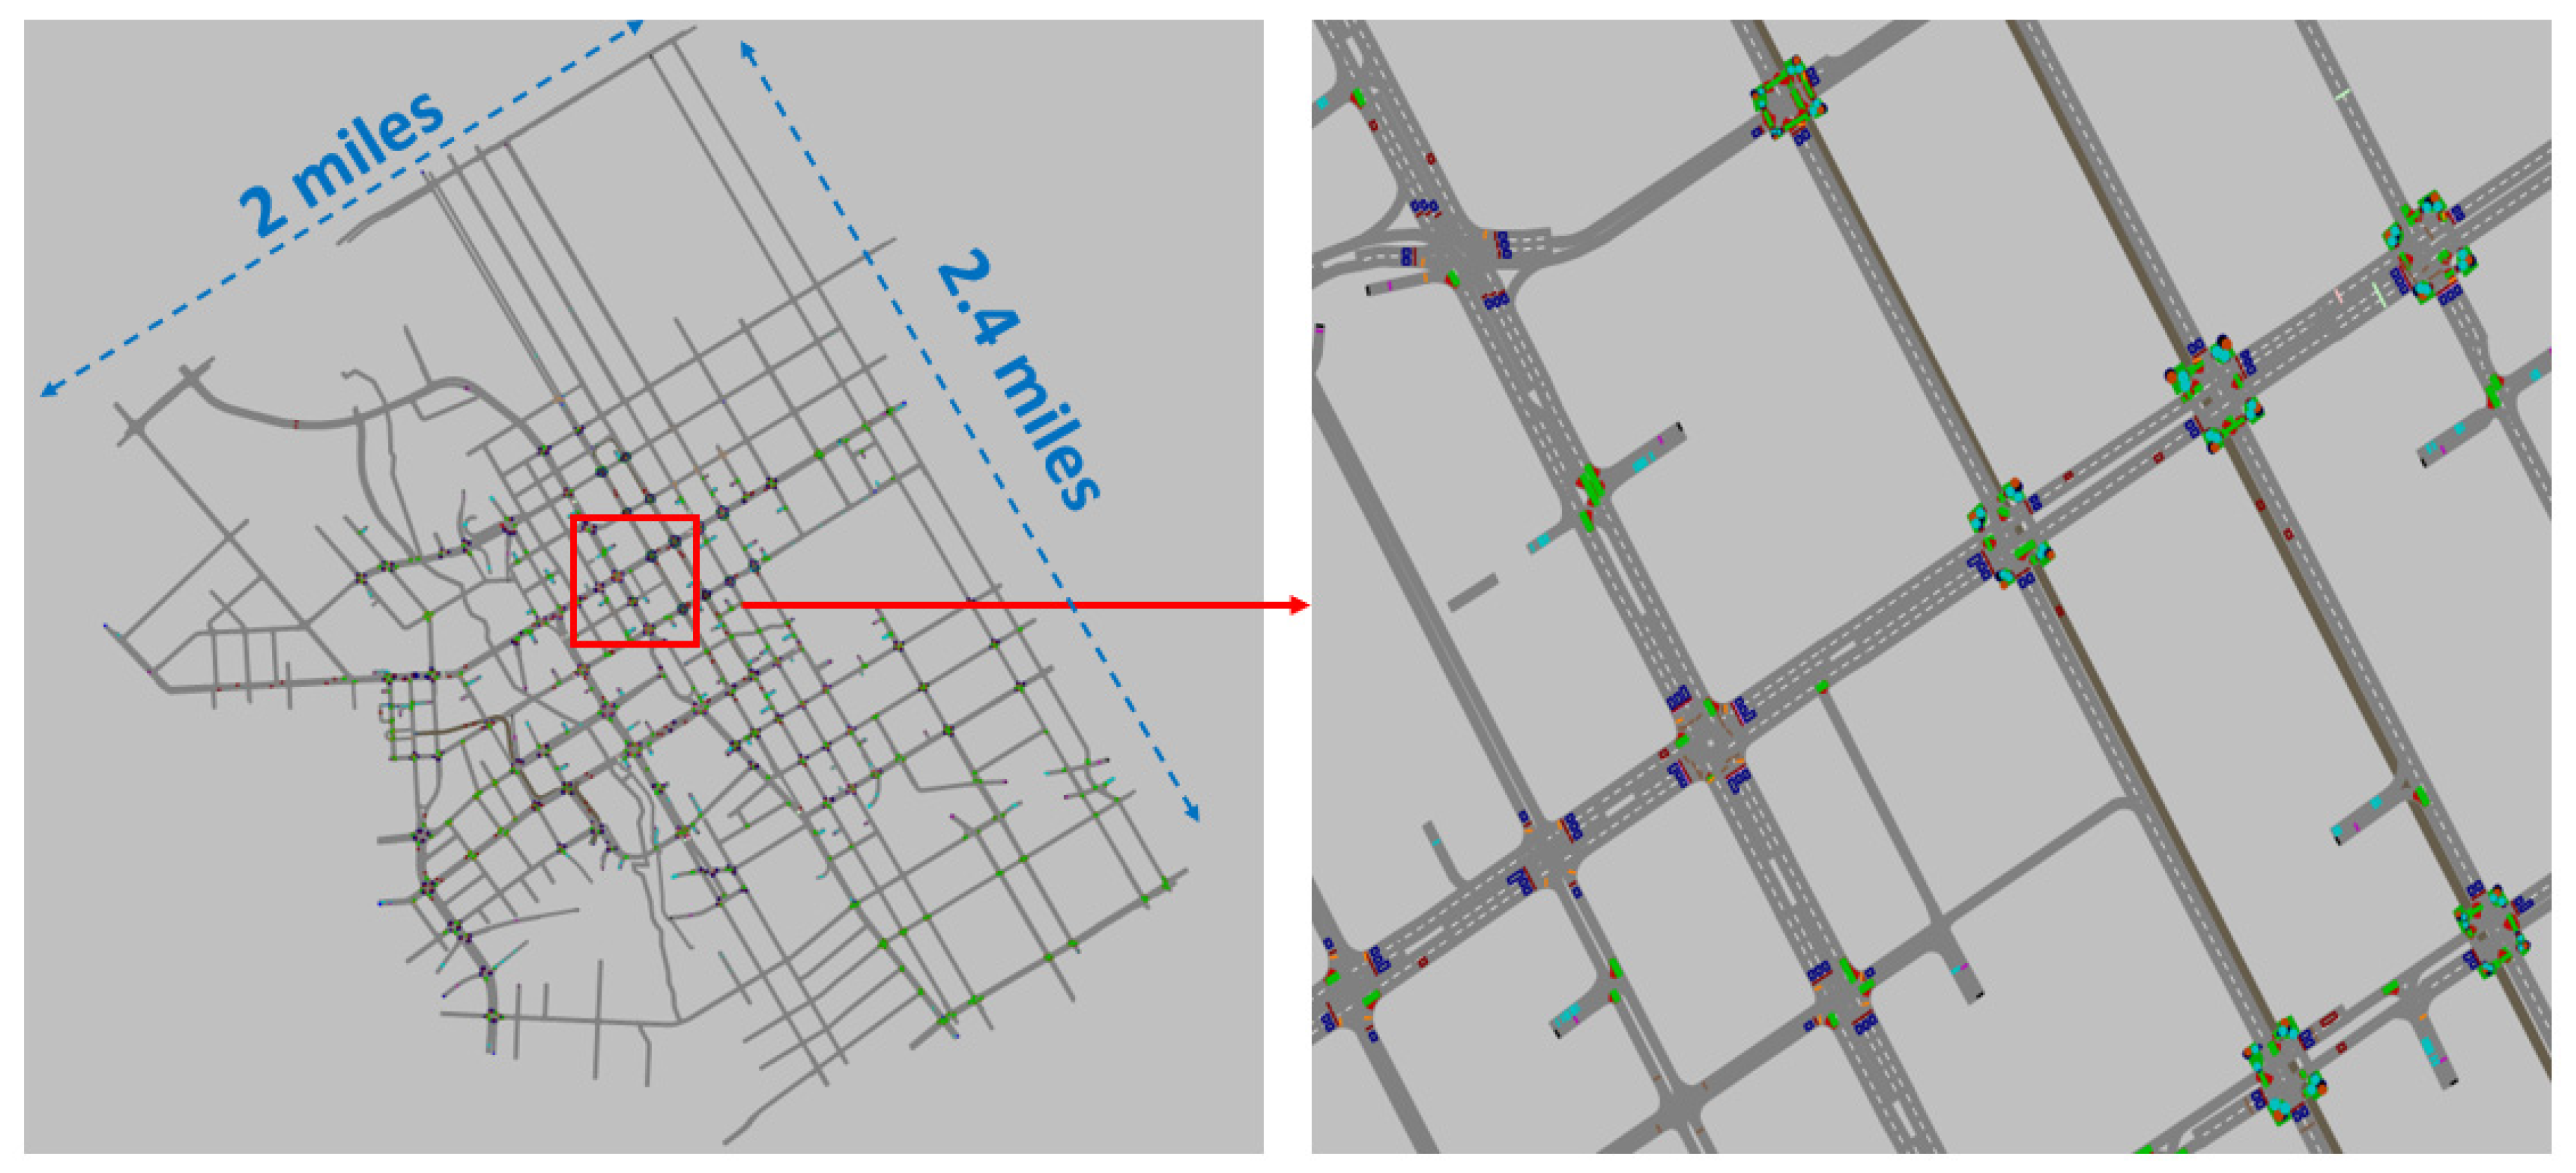
Figure 1 shows the study area (the enclosed area within the inner boundary) in the context of a larger area of downtown San Jose (shown within the outer boundary). The modeled network occupied approximately five square miles. Overall, the complete base conditions (based on 2015 traffic data) of the network consisted of 1051 links and 2242 connectors (between links), as shown in
Figure 2. The figure also shows two views with different scales of the network modeled in the PTV VISSIM.
As a summary of network modeling, links and connectors were added to build all existing streets in the network. Google Maps was used to identify the number and width of traffic lanes. Then, data collected including traffic signal timings, traffic volumes, vehicle routes, traffic signs, and vehicle speed were added to complete the base model. The next section (4. Input Data Collection) describes further the data included in modeling the base network.
Priorities of movement on the network were defined through the use of conflict areas, i.e., areas of the PTV VISSIM network in which there is overlap between two links/connectors, are assigned such that it replicates the real-world behavior of traffic. For example, in case of a permitted left-turn (i.e., where left-turn movement needs to yield to a simultaneously allowed opposing through movement) at a signalized intersection, the priority was assigned to the opposing through movement. It ensures that the left-turning vehicles in the simulation environment will yield to the opposing through vehicles. Conflict area priorities were also assigned at locations where the tramline intersected the road, giving priority to the tram transit vehicles.
4. Input Data Collection
Input data were collected from various sources. Network geometry, including for lanes for automobiles and bikes, was verified through satellite images and street views in Bing Maps. Since the evaluation of the street design strategies in downtown was the purpose of the model, no freeways mainline segments were included in the model (see the study area highlighted in
Figure 1). Off-ramps and on-ramps to the regional freeways (shown in
Figure 1) that connect with the study area served were included as origins and destinations in the simulation model.
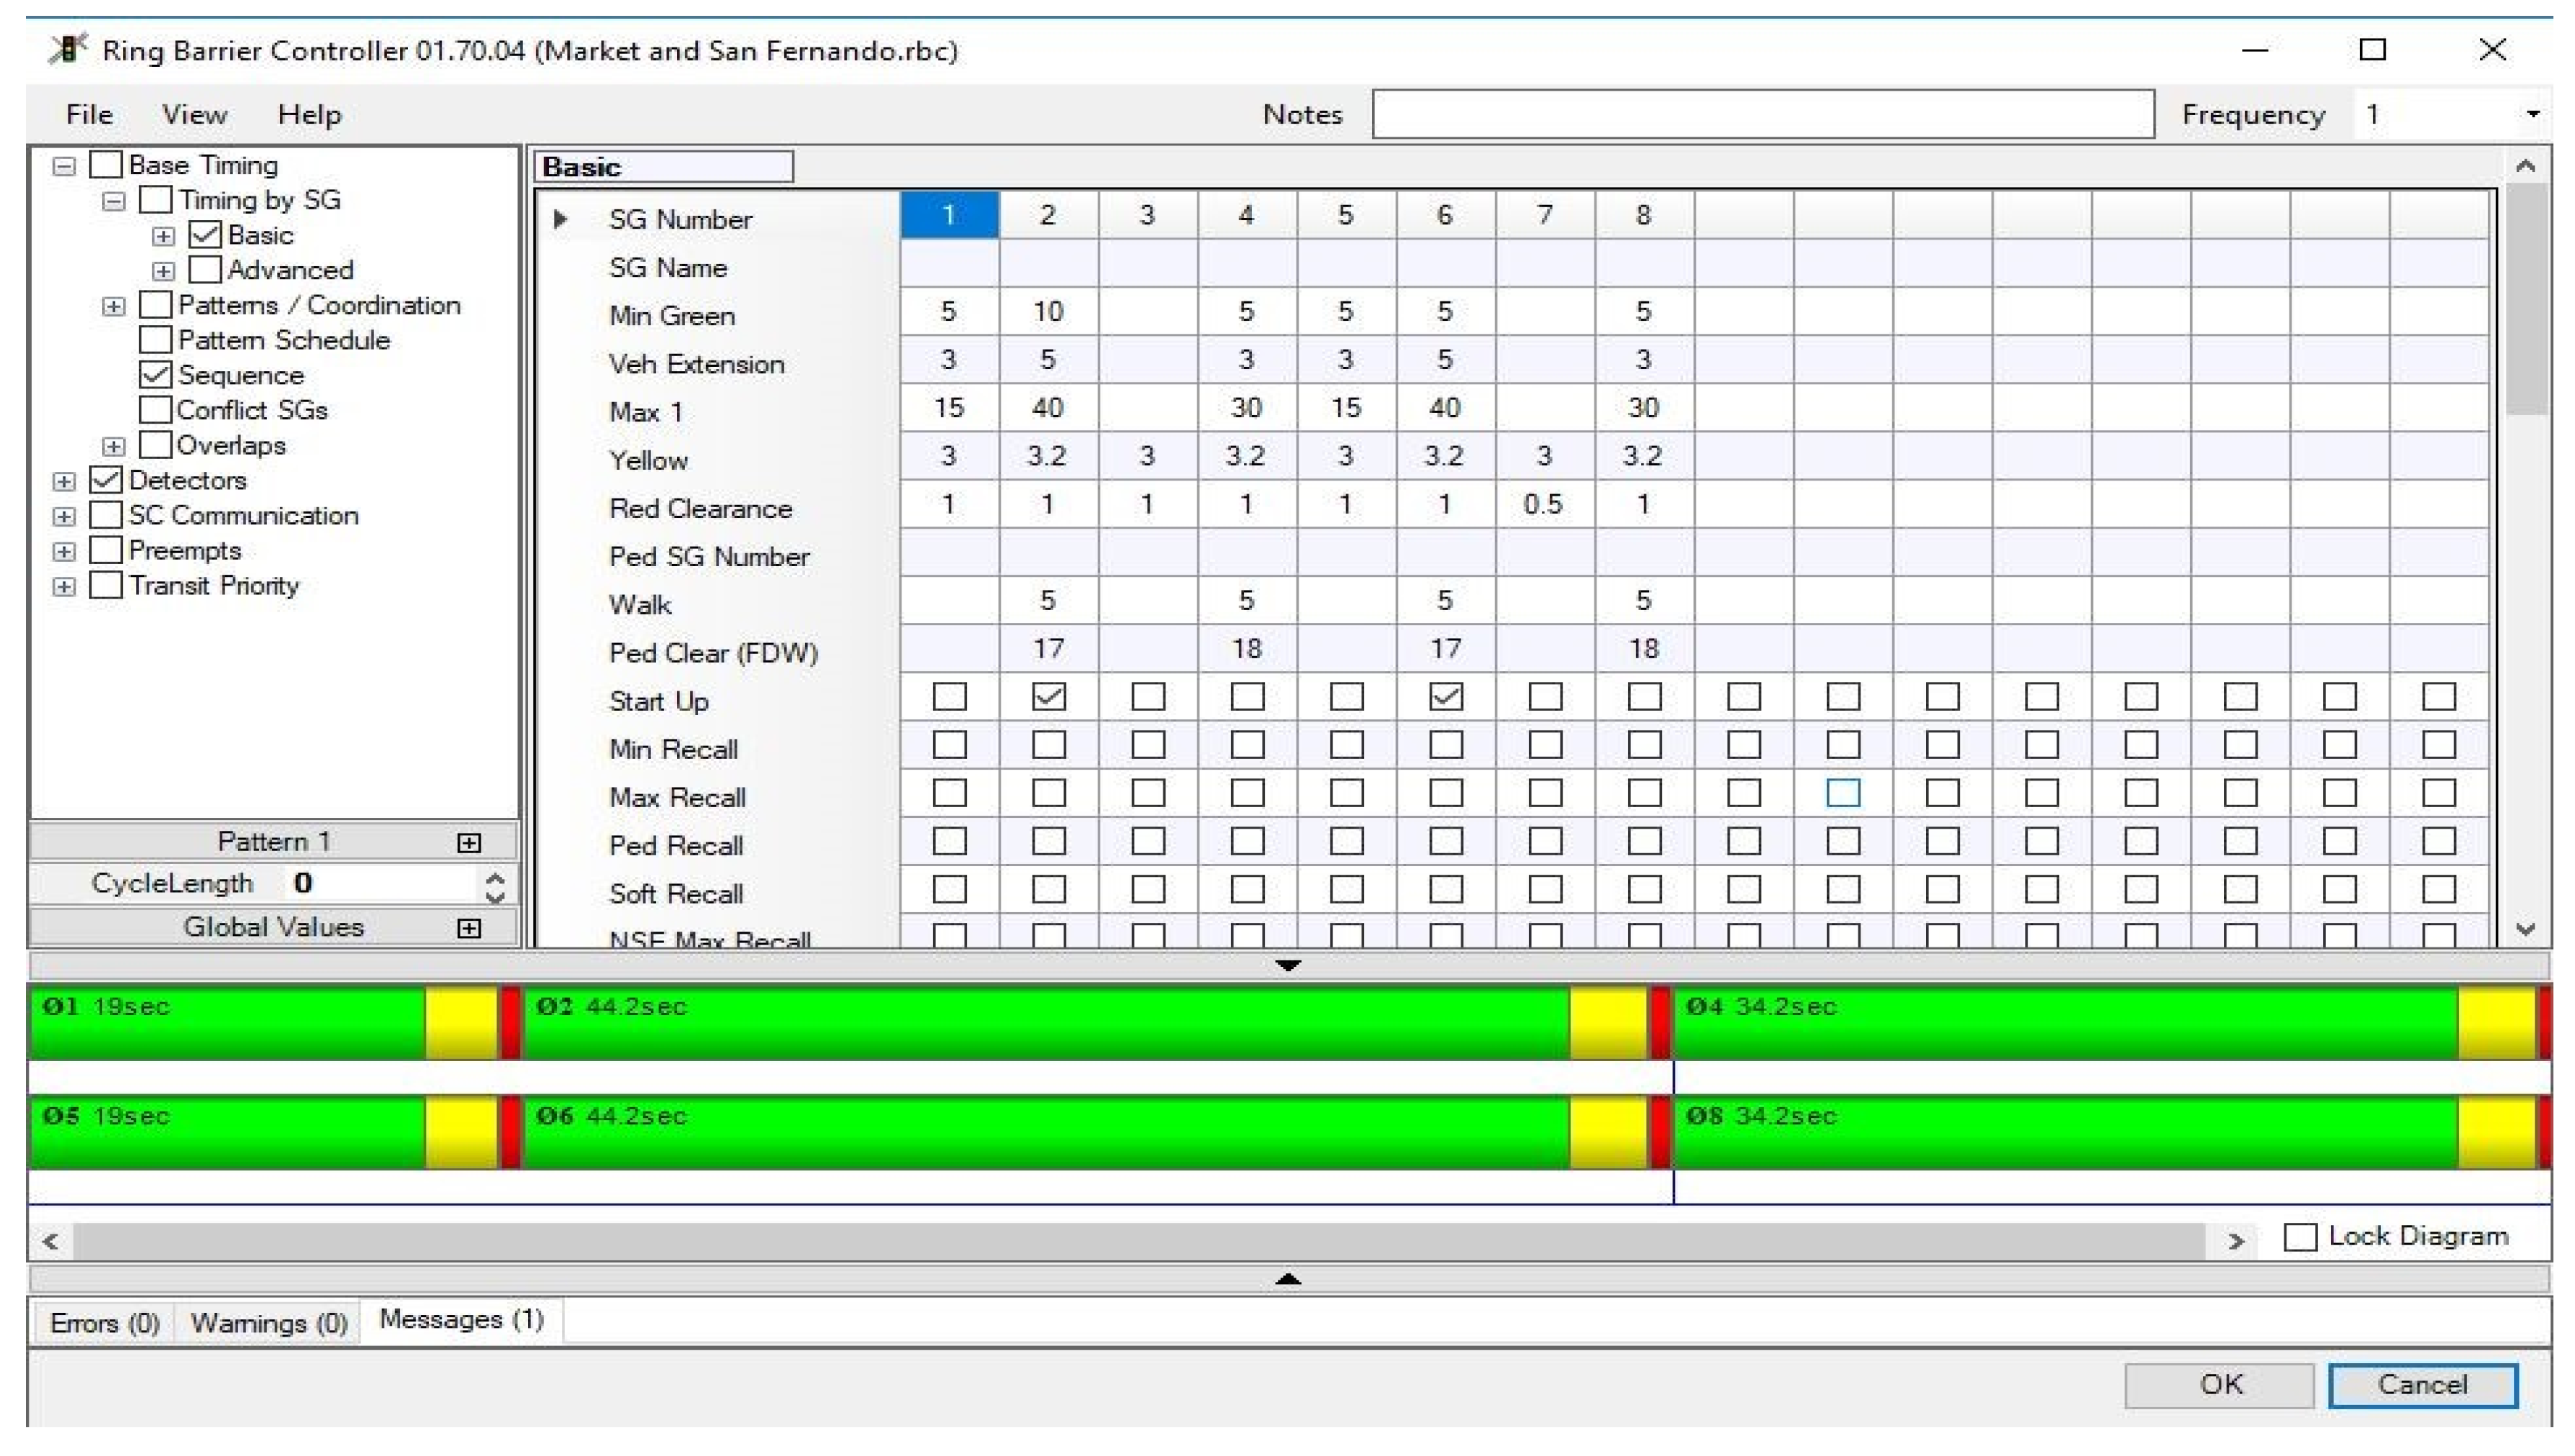
The City of San Jose provided speed survey data for key corridors in downtown San Jose, which were used to set the speed distribution for the network. Signal timing sheets were also provided by the City of San Jose. The ring barrier controller (RBC) interface in PTV VISSIM was used to model the traffic signals. The interface can model actuated signal timing patterns as well as coordinated signal systems on the corridors that operate on a coordinated signal timing plan during the afternoon peak-hour period.
Figure 3 shows a signal timing template used for this study as an example.
The City of San Jose provided intersection turning movement data for downtown surface streets and a list of parking lots within the downtown area. The number of parking spaces in a lot was used to estimate the volume inputs at the parking lot’s exit. In addition, off-ramp volumes from Caltrans, in terms of average annual daily traffic (AADT), were converted to the peak-hour volumes using Equation (1) for preliminary volume inputs [
13].
where,
The methodology for estimating input volumes for PTV VISSIM involved these steps:
Convert off-ramp ADT to peak-hour volumes using Equation (1), assuming a K-factor of 10%;
For parking lots, use 50% of available parking spaces as the PM peak-hour volume input.
Note that these input volumes served as the starting point for the iterative model calibration process. Based on discussions with City of San Jose staff, vehicle composition was kept at 98% passenger cars and 2% heavy vehicles.
Pedestrians were coded into the model using pedestrian count data from the City of San Jose. Pedestrian O–D matrices for each intersection were created based on these counts. Pedestrian signal heads and detectors were placed at each end of the footpath link crosswalk. Pedestrian input was assumed to comprise 50% males and 50% females, with speeds ranging from 2.17–3.62 mph and 1.59–2.66 mph, respectively, based on default values. Public transport lines were incorporated into the model similarly to vehicle routes, where buses followed their fixed route every day. Based on PTV VISSIM user manual [
14], a PT (public transport) line consisted of buses or trams serving a fixed sequence of PT stops according to a timetable. Cyclists were coded into the model as their own vehicle class and routed through corridors with Class 2 bike lanes. Based on the data provided by the city, 30 cyclists per hour for each corridor were coded into the network. Cyclists’ speeds ranged from 9.32–12.43 mph.
The O–D matrix for the model included flows between parking lots and on-ramps as origins and the same parking lots and off-ramps as destinations. Routes were chosen to minimize travel time from origin to destination. Routing decisions were generated using a travel-time estimate from Google Maps for a Wednesday between 5:00–6:00 PM, the PM peak period.
5. VISSIM Network Calibration and Validation
To calibrate and validate the model, the PTV VISSIM model was compared with real-world traffic data using features named data collection points, queue counters, and travel-time measurements. These were placed at study area intersections and key corridor segments and collected data for the analysis period of one hour (3600 s). The analysis period did not involve the first 1500 s of warm-up time at the initiative of the simulation run and 900 s of clearing time towards the conclusion of the simulation run.
The validation process compared average output data from ten runs of the well-calibrated simulated network with the volume and travel-time data from the corresponding locations in the real world. A validated network justifies the simulation’s usage in future scenarios. This process required the estimation of the Geoffrey E. Havers (GEH) statistic for strategically selected network locations. The GEH statistic is a formula commonly used in transportation analysis to compare two sets of traffic volumes. The empirically measured GEH statistic was used to compare field counts provided by the City of San Jose to simulation turning volumes. The formula is defined by Equation (2) [
15].
where,
For traffic modeling work in the existing base scenario, a GEH of less than 5.0 is considered a good match between the model and observed volumes. Measurements with GEHs in the 5.0–10.0 range have a medium chance of error and those with GEHs greater than 10.0 have a high probability of error [
15]. The data collected from model runs using ten different seed numbers were averaged and used to calculate the GEH statistic for each output measurement.
The estimated GEH statistics for the base model indicated that the network was representing real-world conditions reasonably well. With 74.71% of GEH statistics lower than 5.0 and only 5.75% of GEH statistics higher than 10.0 for the turning movement counts at critical intersections, these values meet the following validation criteria, defined in guidelines the Washington State Department of Transportation (WSDOT) guidelines [
16]:
The speed data on key corridors from the City of San Jose was compared and with spot speed (the speed measured at a point in the network) data from PTV VISSIM to ensure the replication of drivers’ behavior. As a calibration target, the average speeds of straight-through movements at intersections in the corridor was required to fall in the range of speeds provided by the city.
In addition to the GEH statistic for traffic counts and speed validation, travel times were recorded for the critical corridors. Estimates for actual travel times were obtained from Google Maps during a Wednesday PM peak. Overall, more than 80% of travel times along the key corridors were within Google Maps’ estimated travel-time range.
Based on the validation data, the base model, overall, was well-calibrated since it met the validation criteria specified by the WSDOT [
16]. In certain locations, however, there were some specific movements that did not calibrate quite as well, including:
EB movements at 4th Street/San Fernando Street. The modeled travel times were longer than observed travel times, possibly due to queues on San Fernando Street resulting from modeled vehicles waiting to change lanes to turn right.
SB movements on 4th Street. Modeled travel times were longer than observed travel times, possibly due to queues on 4th Street resulting from vehicle slowdown in conflict areas despite having priority.
These corridors for which the travel times did not calibrate well also had lower than real-world, yet, acceptable throughput. There were only two corridors out of the ten for which the travel time was found to be outside the range reported by Google Maps. As such, these discrepancies are not anticipated to have a significant impact on the analysis of future scenarios.
The validation described above was also considered in past studies with similar VISSIM modeling process [
17]. For more information on the data and modeling details, the readers are referred to Liu et al. [
18].
6. Measures of Effectiveness
Table 1 shows the network measures of effectiveness (MOEs), including vehicles, travel time, speed, delay, and stops, derived from the existing condition baseline PTV VISSIM model.
The numbers in
Table 1 estimated for each scenario are discussed in the next section to assess the network-wide impacts of the strategies evaluated in this paper. The validated existing condition baseline model is referred to as Scenario 0 in the remainder of this paper. A validated model similar to this would be a pre-requisite for the jurisdictions using microsimulation to make effective decisions for scenarios similar to the ones described in the following.
7. Simulation Scenarios
Depending on the desired level of detail to be studied, simulation models can be classified as microscopic, mesoscopic, or macroscopic.
Microscopic models provide a detailed representation of the traffic process, considering the characteristics of individual vehicles and simulating vehicle interactions in the traffic stream based on car-following and lane-changing theories. Microsimulation offers benefits in clarity, accuracy, and flexibility. It can provide a comprehensive, real-time visual display to illustrate traffic operations in a readily understandable manner. Individual vehicles make their own decisions on speed, lane changing, and route choice. The dynamic evolution of traffic congestion and the effectiveness of traffic management strategies can be evaluated with microsimulation. These models are typically used for short-term and congestion-related issues. Compared to macroscopic models, a microscopic model is only practical for smaller networks and shorter modeling periods, due to the high number of data inputs, calibration and validation efforts, and computing power required for modeling and analysis.
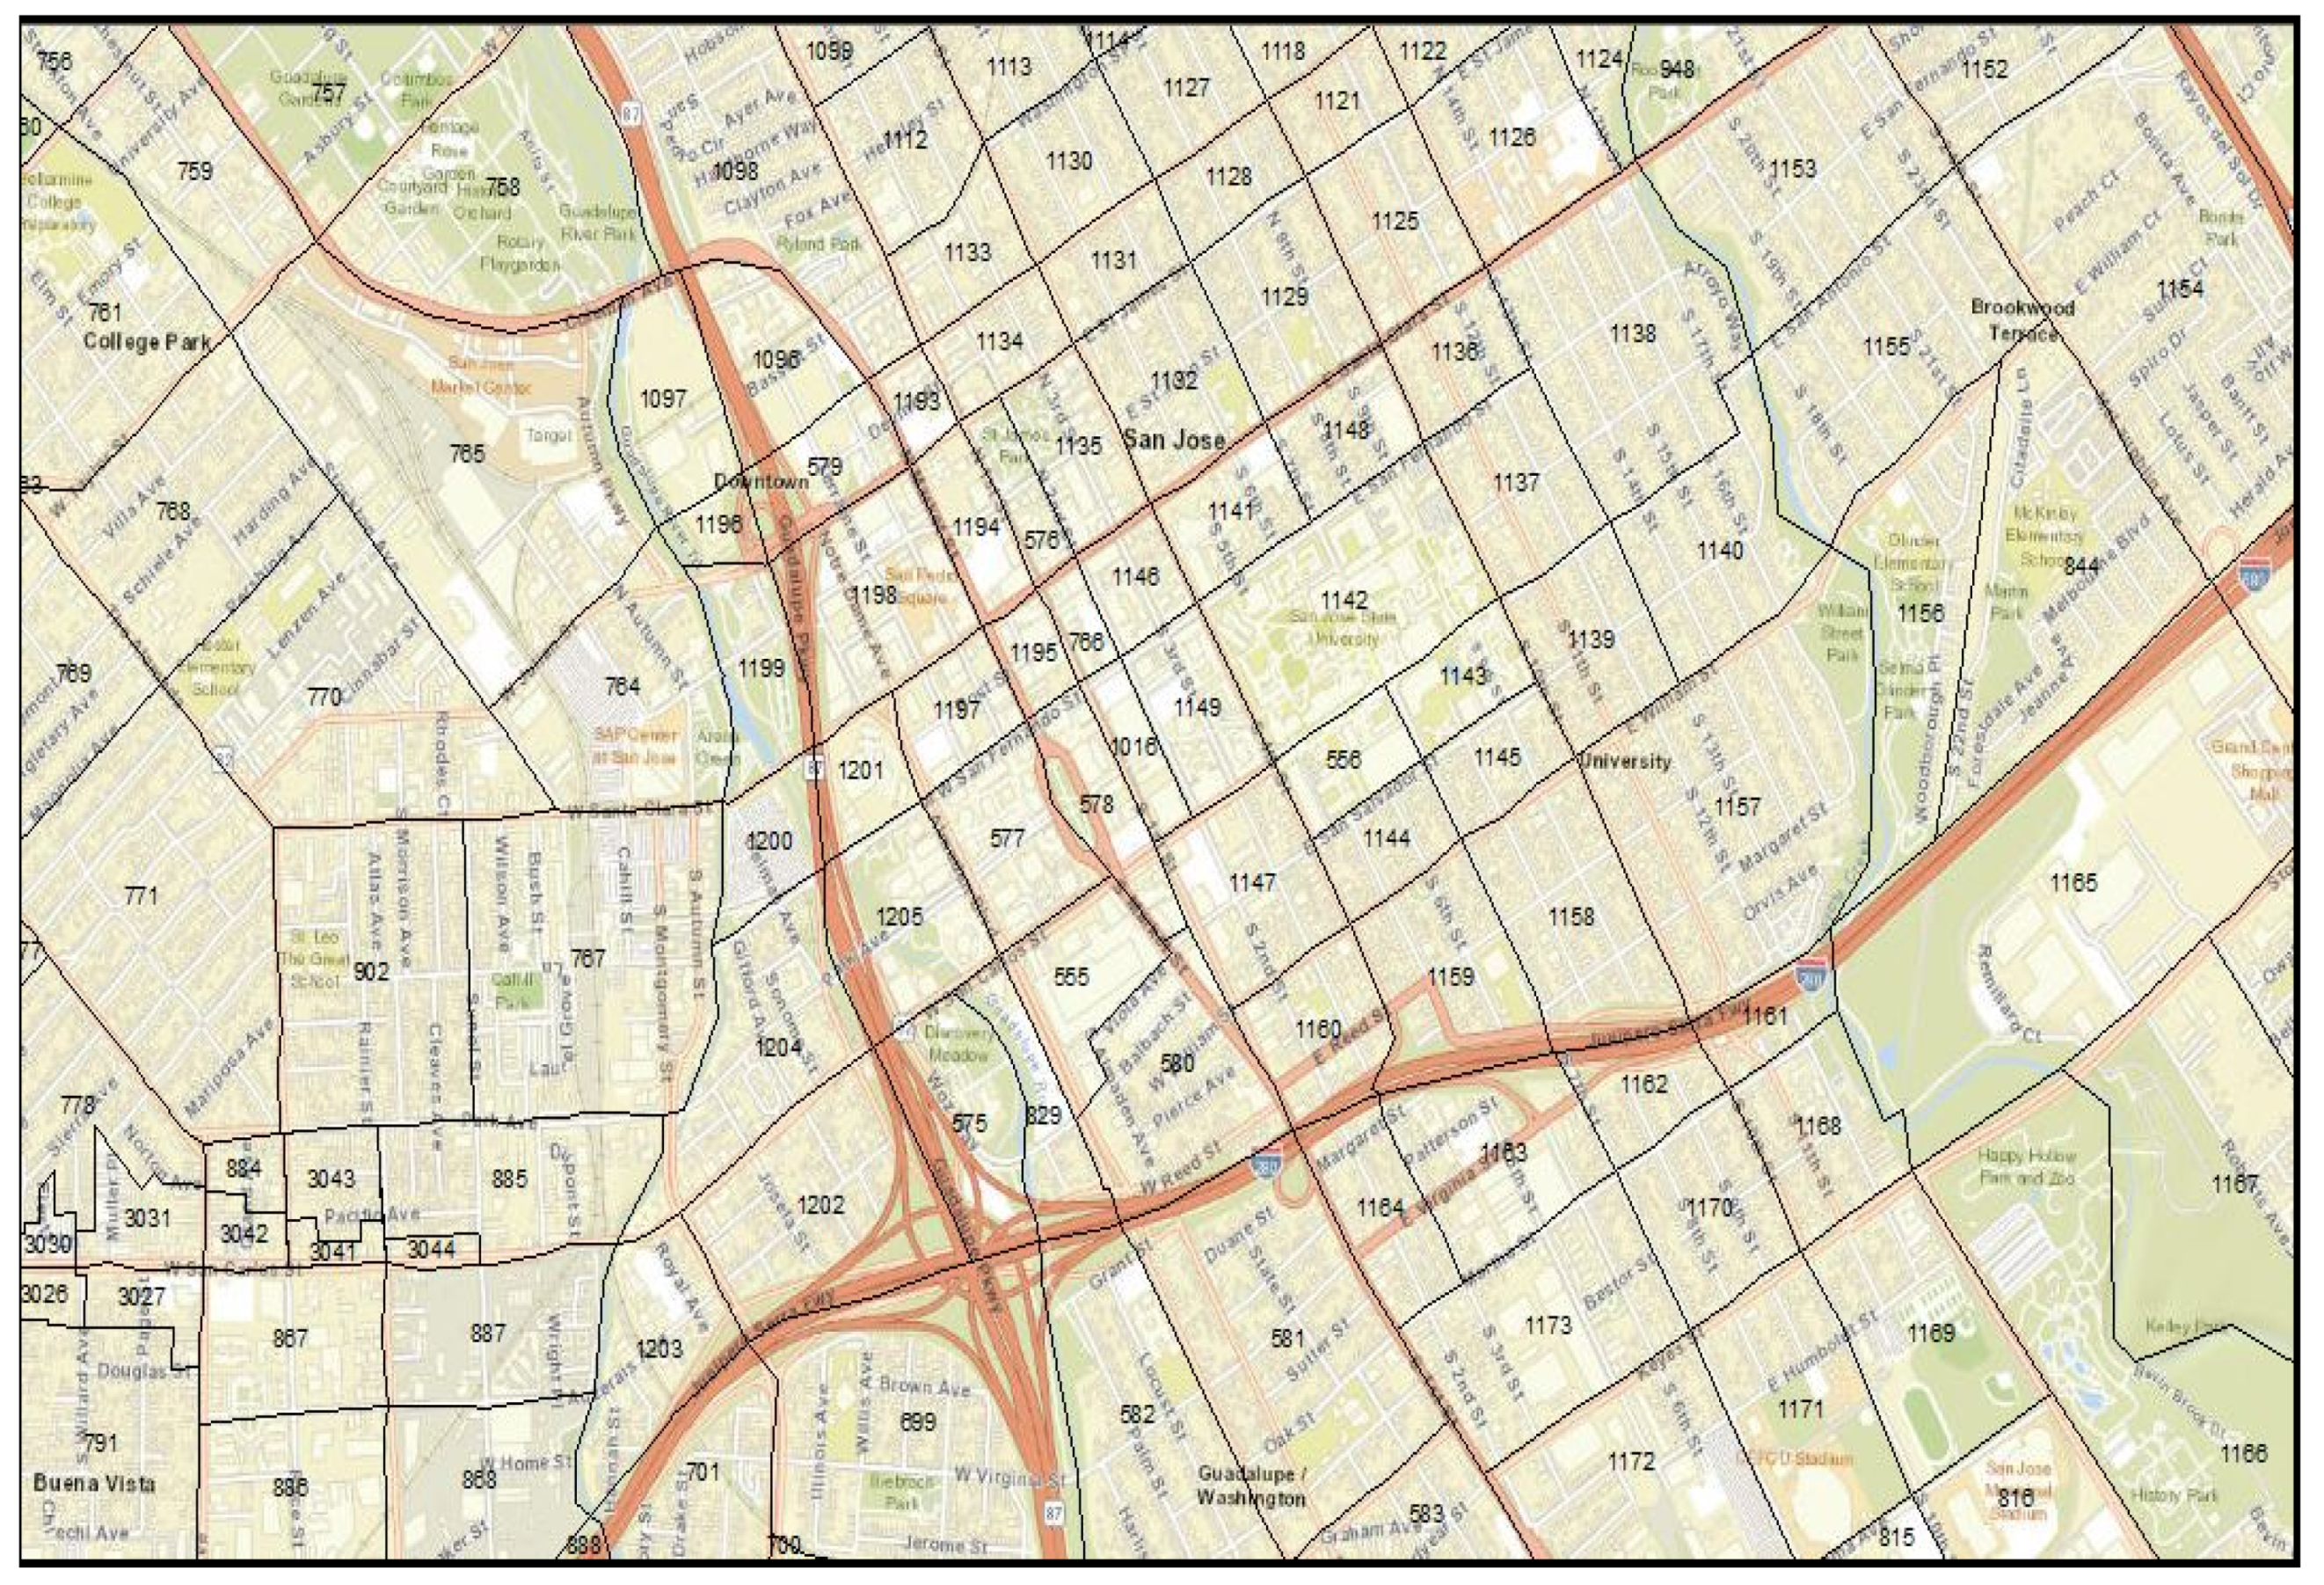
Scenarios were defined to test the street redesign based on detailed output simulation metrics for both 2015 and 2040 volumes. The city provided the 2040 volumes from the macro-level travel demand forecasting models. These traffic volumes were in the form of zonal O–D matrices. The zones for the City of San Jose are shown in
Figure 4 below.
The macro-level 2040 O–D matrix was converted into an O–D matrix compatible with the microsimulation model. However, in comparing the O–D matrices for the year 2015 (Scenario 0) and for 2040, it was apparent that the city’s travel demand model is projecting a substantial increase in automobile traffic. Several O–D pairs in the microsimulation models were expected to have the automobile demand increase by a factor of 20. According to the model, the projected increase in automobile travel demand is not sustainable for the current network; inputting anywhere close to that traffic volume in the PTV VISSIM, expectedly, led to complete gridlock in the network. Hence, in the scenarios documented in the paper, the 2040 projected volumes are not considered.
8. Scenarios, Results, and Discussions
Two groups of simulation scenarios were considered in this study. In the first group, one of the main streets, Almaden Boulevard, was converted to a two-way street. Then two different travel demand cases were defined to provide the decisionmakers with an estimate on how the network might perform with:
Scenario 1A: Almaden Boulevard two-way conversion with no change in the base-level automobile travel demand;
Scenario 1B: Almaden Boulevard two-way conversion with a 5% increase in base-level automobile travel demand.
For the second set of scenarios, the base case, with the existing one-way Almaden Boulevard, was tested at three different travel demand scenarios:
2A: automobile travel demand reduction of 30%;
2B: automobile travel demand reduction of 20%,;
2C: automobile travel demand reduction of 10%.
The second set of (automobile travel demand reduction) scenarios is based on the rapid spread of COVID-19 across the US followed by the “shelter-in-place” and “stay-at-home” orders by governments and the possibility of similar events in the future. Note that a UC Davis study by Shilling [
19] found that several states experienced as high as 60% reduction in local travel. However, this reduction was not sustainable, and demand bounced back to some degree, according to the INRIX US National Traffic Volume Synopsis [
20].
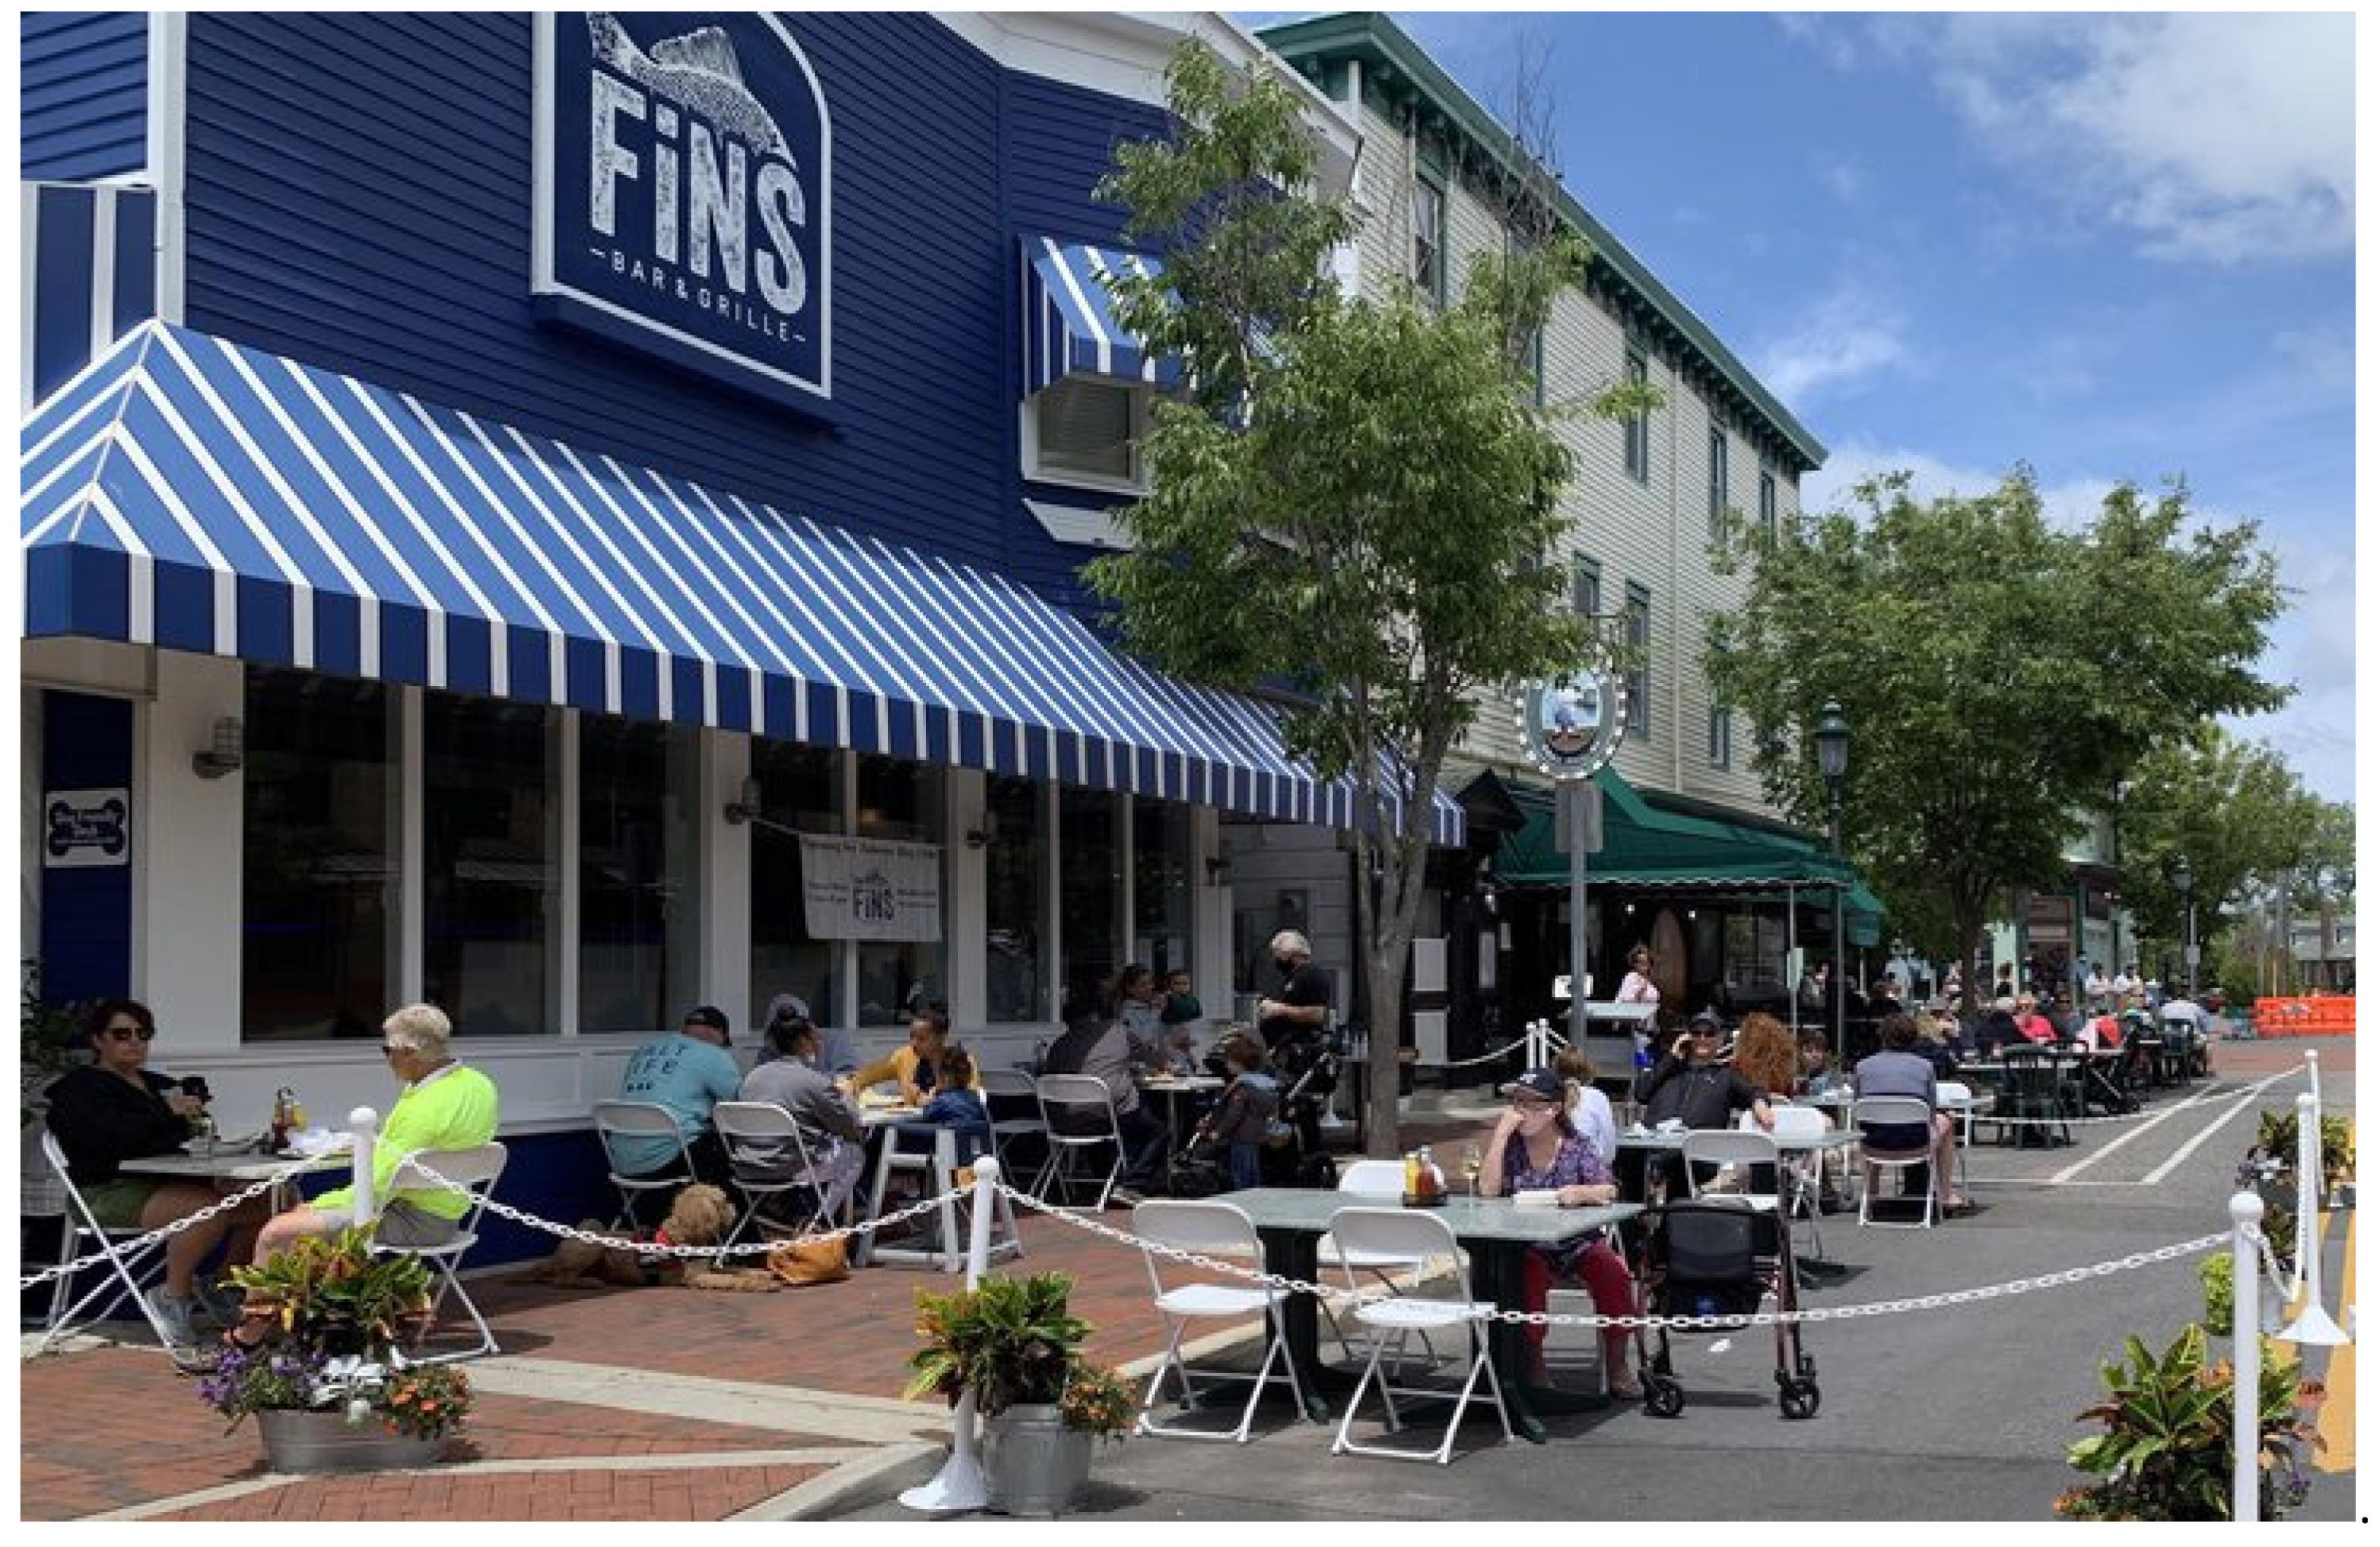
Of course, for this set of scenarios, the concern is not to examine automobile delays/travel time. Instead, for this set, we want to examine the corridor locations within the city network where the automobile demand is reduced by a critical amount, which will allow lane closures on those corridors with minimal disruption. The closed-lane space can then be put to other uses such as a parklet or temporary outdoor dining areas. This is one of the possible strategies that cities could consider in helping downtown businesses with limited outdoor space. With lane closures, pedestrians would also experience safer travel and better service due to wider pedestrian paths. It should be noted that path width plays a key role in estimating the level of service of pedestrians based on the Highway Capacity Manual [
21].
Figure 5 shows an example of such a lane closure and the use of street space for dining [
22].
In the subsequent sections, each scenario is described in detail. The network metrics collected for each scenario are also shown along with the same metrics for the base-case scenario (See
Table 2,
Table 3 and
Table 4).
8.1. Scenario 1A: Almaden Boulevard Conversion with 2015 Demand Level
In the existing condition baseline model (Scenario 0), Almaden Boulevard between St. John Street and Santa Clara Street is a one-way southbound street. This scenario converted this section of Almaden Boulevard to a two-way street, allowing left and right turns from the adjacent street (Santa Clara Street) onto Almaden Boulevard. Additional turns added were right and left turns onto the other adjacent streets (Carlysle and St. John Street).
Converting Almaden Boulevard to a two-way operation meant that, for some of the O–D pairs, there were additional ways for vehicles to more effectively traverse to their destinations. A total of 56 vehicle routes were adjusted to utilize a newly added northbound Almaden Boulevard segment between St. John Street and Santa Clara Street.
Table 2 above shows the network measures of effectiveness for Scenario 1A and compares it to the base case (Scenario 0). It may be observed that the conversion of Almaden Boulevard to the two-way operation did not result in a noticeable reduction in the average speeds at key data collection locations. Some of the travel speeds increased marginally (e.g., at St. James Street), potentially due to smoother flow of traffic.
Table 3 shows the travel-time comparisons, while
Table 4 illustrates the average delays for automobile traffic. It may be observed that for Scenario 1A and Scenario 0, travel times on all major corridors of the downtown were essentially unchanged. Similar results were found in
Table 4, and the average delays for the automobile traffic were not adversely affected by the conversion.
8.2. Scenario 1B: Almaden Boulevard Conversion and Increase Automobile Demand 5%
Scenario 1B considered the same Almaden Boulevard conversion as Scenario 1A, but with input volume increased by 5% throughout the network.
Table 2,
Table 3 and
Table 4 also show the output metrics for this scenario, 1B. It is apparent that while the speed at some of the locations was reduced by a small amount, the overall delays of the network did not noticeably worsen by the 5% increase in automobile demand. The travel times on the corridors also increased only slightly. The highest percentage increase in travel time, compared to Scenario 1A, is on EB Santa Clara and NB 3rd Street, with 12% and 13%, respectively. The network-level indicators worsened due to increased automobile demand, with average delay per vehicle increasing from 285 s to 310 s, an almost 9% increase.
8.3. Scenarios 2A, 2B, and 2C: Existing Base Model with 30%, 20%, and 10% Demand Reduction
In these scenarios, it is assumed that the entire existing baseline network (Scenario 0) experiences a lower vehicular traffic demand due to a situation similar to COVID-19. Note that these demand reductions are not as aggressive as those reported in March and April 2020 [
19]. The objective is to identify the multi-lane corridors (the streets with at least two lanes) with a potential for closing one lane for use as an outdoor dining area.
Table 5,
Table 6 and
Table 7 show the street approaches that had the highest traffic volume reduction in the scenarios with 30%, 20%, and 10% demand reductions in the network, respectively. These results are based on the counts averaged over ten runs of the simulated network. Based on the Federal Highway Administration (FHWA) informational guideline [
23], one through traffic lane is sufficient to accommodate the demand of about 600 vehicles per hour on urban streets. In
Table 5,
Table 6 and
Table 7, we have highlighted the street approaches where vehicular volume in the base case was higher than 600 vph but is reduced to be under 600 vph. For a given overall travel demand reduction, those streets should be prioritized for lane closures and tactical urbanism strategies.
It should be noted that in the 10% demand reduction scenario (
Table 7), no street segment with traffic volume above 600 vph moves significantly below that threshold. The two highlighted locations have volumes of 593 and 581 vph. However, the results did show that there are several approaches (including, e.g., Market/Santa Clara) where the base-case (i.e., pre-COVID) peak-hour demand is lower than 600 vph. These approaches should be considered for tactical urbanism strategies.
9. Conclusions
Due to their considerable advantages, several cities around the world have used microsimulation models for improving their transportation networks. This paper provides a framework for developing and applying validated microsimulation models to:
Evaluate the network-level impacts of street traffic design changes (e.g., road diets, two-way conversion). Most previous research examining new street traffic designs has focused only on the impact on the streets being redesigned. The large-scale microsimulation modeling approach adopted here allows decision-makers to look at the network-wide metrics;
Simulate the city transportation network at varying levels of reduced demand (e.g., due to pandemic currently raging through the US) to identify the corridors/approaches that would have their traffic volumes reduce below critical the 600 vph threshold. Corridors/approaches experiencing this level of automobile demand should be considered for alternate uses, known as tactical urbanism.
Since several modern traffic simulation packages also have great visualization capabilities, scenarios such as the ones modeled here can be shared with stakeholders using 3-D animated videos. These videos can be part of outreach campaigns on social media and in real life to engage the public and get their buy-in on street/tactical urbanism strategies prior to their implementation.
By focusing on network-wide impacts rather than just the streets being redesigned, the study encourages traffic engineers and planners to think in terms of “complete networks” as opposed to complete streets. This change in perspective towards network-level impacts on the part of practitioners can have long-term benefits. For example, the abrupt ending of sidewalks and lack of integration of pedestrian routes is often cited [
23] as a reason for low pedestrian travel mode share. A network-level perspective can help address this issue in the long run. A recent Brookings Institution Report [
24] argued that the COVID-19 pandemic has highlighted the importance of sustainable transportation systems, and created a compelling justification for redesigning those currently in place. A simulation-based framework presented in this paper may be a powerful decision support tool toward that goal.
Author Contributions
Conceptualization, B.L., A.M.M., A.P., J.H. and S.A.; methodology: B.L., A.M.M., A.P., J.H. and S.A.; software, B.L., A.M.M., J.H. and Z.L.; validation, B.L., A.P. and J.H.; formal analysis, B.L., A.M.M. and A.P.; investigation,B.L., A.M.M., A.P., J.H. and S.A.; resources, B.L., A.M.M., A.P., J.H. and S.A.; data curation, B.L., A.M.M., A.P., J.H. and S.A.; writing—original draft preparation, B.L., A.M.M. and A.P.; writing—review and editing, B.L., A.M.M., A.P. and S.A.; visualization, B.L.; supervision, A.P.; project administration, A.P. and S.A.; funding acquisition, A.P. and S.A. All authors have read and agreed to the published version of the manuscript.
Funding
This research was funded by Mineta Transportation Institute (MTI) at San Jose State University.
Informed Consent Statement
Informed consent was obtained from all subjects involved in the study.
Data Availability Statement
Some or all data, models, or code that support the findings of this study are available from the corresponding author upon reasonable request (specifically the VISSIM models).
Acknowledgments
The authors wish to thank Mineta Transportation Institute (MTI) at San Jose State University for providing funding for part of this research. The staff at the City of San Jose Department of Transportation provided the required data and feedback on the simulation model. Their comments on the simulation model helped immensely in validating the model. Alex Chambers at Ricondo Associates, Inc. also provided helpful guidance on modeling the large-scale transportation systems.
Conflicts of Interest
The authors declare no conflict of interest.
References
- Bereitschaft, B.; Scheller, D. How Might the COVID-19 Pandemic Affect 21st Century Urban Design, Planning, and Development? Urban Sci. 2020, 4, 56. [Google Scholar] [CrossRef]
- LaPlante, J.N.; McCann, B. Complete Streets in the United States. In Proceedings of the 90th Annual Meeting of the Transportation Research Board, Washington, DC, USA, 23–27 January 2011. [Google Scholar]
- Aman, J.; Smith-Colin, J. Transit Deserts: Equity Analysis of Public Transit Accessibility. J. Transp. Geogr. 2020, 89, 102869. [Google Scholar] [CrossRef]
- Wolshon, B.; Pande, A. Traffic Engineering Handbook; John Wiley Sons: Hoboken, NJ, USA, 2016. [Google Scholar]
- Mehrara Molan, A. Evaluation of Milwaukee B and Synchronized as New Service Interchange Designs; Wayne State University: Detroit, MI, USA, 2017. [Google Scholar]
- Jha, M.; Gopalan, G.; Garms, A.; Mahanti, B.P.; Toledo, T.; Ben-Akiva, M.E. Development and Calibration of a Large-Scale Microscopic Traffic Simulation Model. Transp. Res. Rec. 2004, 1876, 121–131. [Google Scholar] [CrossRef]
- Bartin, B.; Ozbay, K.; Gao, J.; Kurkcu, A. Calibration and validation of large-scale traffic simulation networks: A case study. Procedia Comput. Sci. 2018, 130, 844–849. [Google Scholar] [CrossRef]
- Edara, P.; Sharma, S.; McGhee, C. Development of a Large-Scale Traffic Simulation Model for Hurricane Evacuation—Methodology and Lessons Learned. Nat. Hazards Rev. 2010, 11, 127–139. [Google Scholar] [CrossRef]
- Sisiopiku, V.P.; Chemmannur, J. Conversion of One-Way Street Pairs to Two-Way Operations in Downtown Birmingham. In Proceedings of the Metropolitan Conference on Public Transportation Research, Chicago, IL, USA, 2008. [Google Scholar]
- Chiu, Y.-C.; Zhou, X.; Hernandez, J. Evaluating Urban Downtown One-Way to Two-Way Street Conversion Using Multiple Resolution Simulation and Assignment Approach. J. Urban Plan. Dev. 2007, 133, 222–232. [Google Scholar] [CrossRef] [Green Version]
- Nixon, H.; Agrawal, A.W.; Simons, C. Designing Road Diet Evaluations: Lessons Learned from San Jose’s Lincoln Avenue Road Diet; Mineta Transportation Institute Publications: San Jose, CA, USA, 2017. [Google Scholar]
- Mehrara Molan, A.; Hummer, J.E. Simulation Modeling of Pedestrian Performance in the New Synchronized and Milwaukee B Interchanges versus Existing Designs. Transp. Res. Rec. J. Transp. Res. Board 2018, 2672, 151–160. [Google Scholar] [CrossRef]
- Roess, R.P.; McShane, W.E. Traffic Engineering, 4th ed.; Editorial Pearson: London, UK, 2011. [Google Scholar]
- PTV. PTV VISSIM 10 User Manual; PTV AG: Karlsruhe, Germany, 2018. [Google Scholar]
- Dalaff, C.; Ebendt, R.; Erdmann, J.; Gurczik, G.; Touko, L.C. Benchmarking SUMO Generated Traffic Simulation Results Based on GEH Statistic. In Proceedings of the 1st SUMO User Conference SUMO2013, Berlin, Germany, 15–17 May 2013. [Google Scholar]
- Washington State Department of Transportation. Protocol for Vissim Simulation; Washington State Department of Transportation: Olympia, WA, USA, 2014. [Google Scholar]
- Haq, M.T.; Mehrara Molan, A.; Ksaibati, K. Evaluating the Operational Efficiency of Two Versions of Super DDI Design: A Case Study in Denver, Colorado. Transp. Res. Rec. 2021, in press. [Google Scholar]
- Liu, B.; Shams, A.; Howard, J.; Alexander, S.; Hughes, A.; Pande, A. Assessing Complete Street Strategies Using Microscopic Traffic Simulation Models; Mineta Transportation Institute: San Jose, CA, USA, 2020. [Google Scholar]
- Shilling, F. Special Report 3: Impact of COVID19 Mitigation on Traffic, Fuel Use and Climate Change; The National Academies of Sciences, Engineering, and Medicine: Washington, DC, USA, 2020. [Google Scholar]
- Schuman, R. INRIX US National Traffic Volume Synopsis Issue# 11 (May 23–May 29, 2020); INRIX: Kirkland, WA, USA, 2020. [Google Scholar]
- Highway Capacity Manual, Transportation Research Board of the National Academies: Washington, DC, USA, 2010; 2010.
- How to Lower Your COVID-19 Risk While Eating at Restaurants. PhillyVoice. Available online: https://www.phillyvoice.com/covid-19-risk-restaurants-eating-out-coronavirus-safety-indoor-outdoor-dining-dangers/ (accessed on 31 July 2020).
- Rodegerdts, L.A.; Nevers, B.L.; Robinson, B.; Ringert, J.; Koonce, P.; Bansen, J.; Nguyen, T.; McGill, J.; Stewart, D.; Suggett, J. Signalized Intersections: Informational Guide; Federal Highway Administration: Washington, DC, USA, 2004. [Google Scholar]
- Tomer, A.; Fishbane, L. Coronavirus Has Shown Us a World without Traffic. Can We Sustain It? Brookings Institutions: Washington, DC, USA, 2020. [Google Scholar]
| Publisher’s Note: MDPI stays neutral with regard to jurisdictional claims in published maps and institutional affiliations. |
© 2021 by the authors. Licensee MDPI, Basel, Switzerland. This article is an open access article distributed under the terms and conditions of the Creative Commons Attribution (CC BY) license (https://creativecommons.org/licenses/by/4.0/).


