
An Eye-Tracking Study on the Effect of Different Signalized Intersection Typologies on Pedestrian Performance


Abstract
:1. Introduction
Related Works
- −
- does pedestrian attention change as a function of the type of crosswalk signalized?
- −
- does pedestrian reaction time change as a function of signalized crosswalk type?
- −
- does intersection typology affect pedestrian behavior in terms of waiting time, crossing time, and crossing speed?
- −
- do smart traffic signals affect the reaction time of “zombie pedestrians”?
2. Methodology
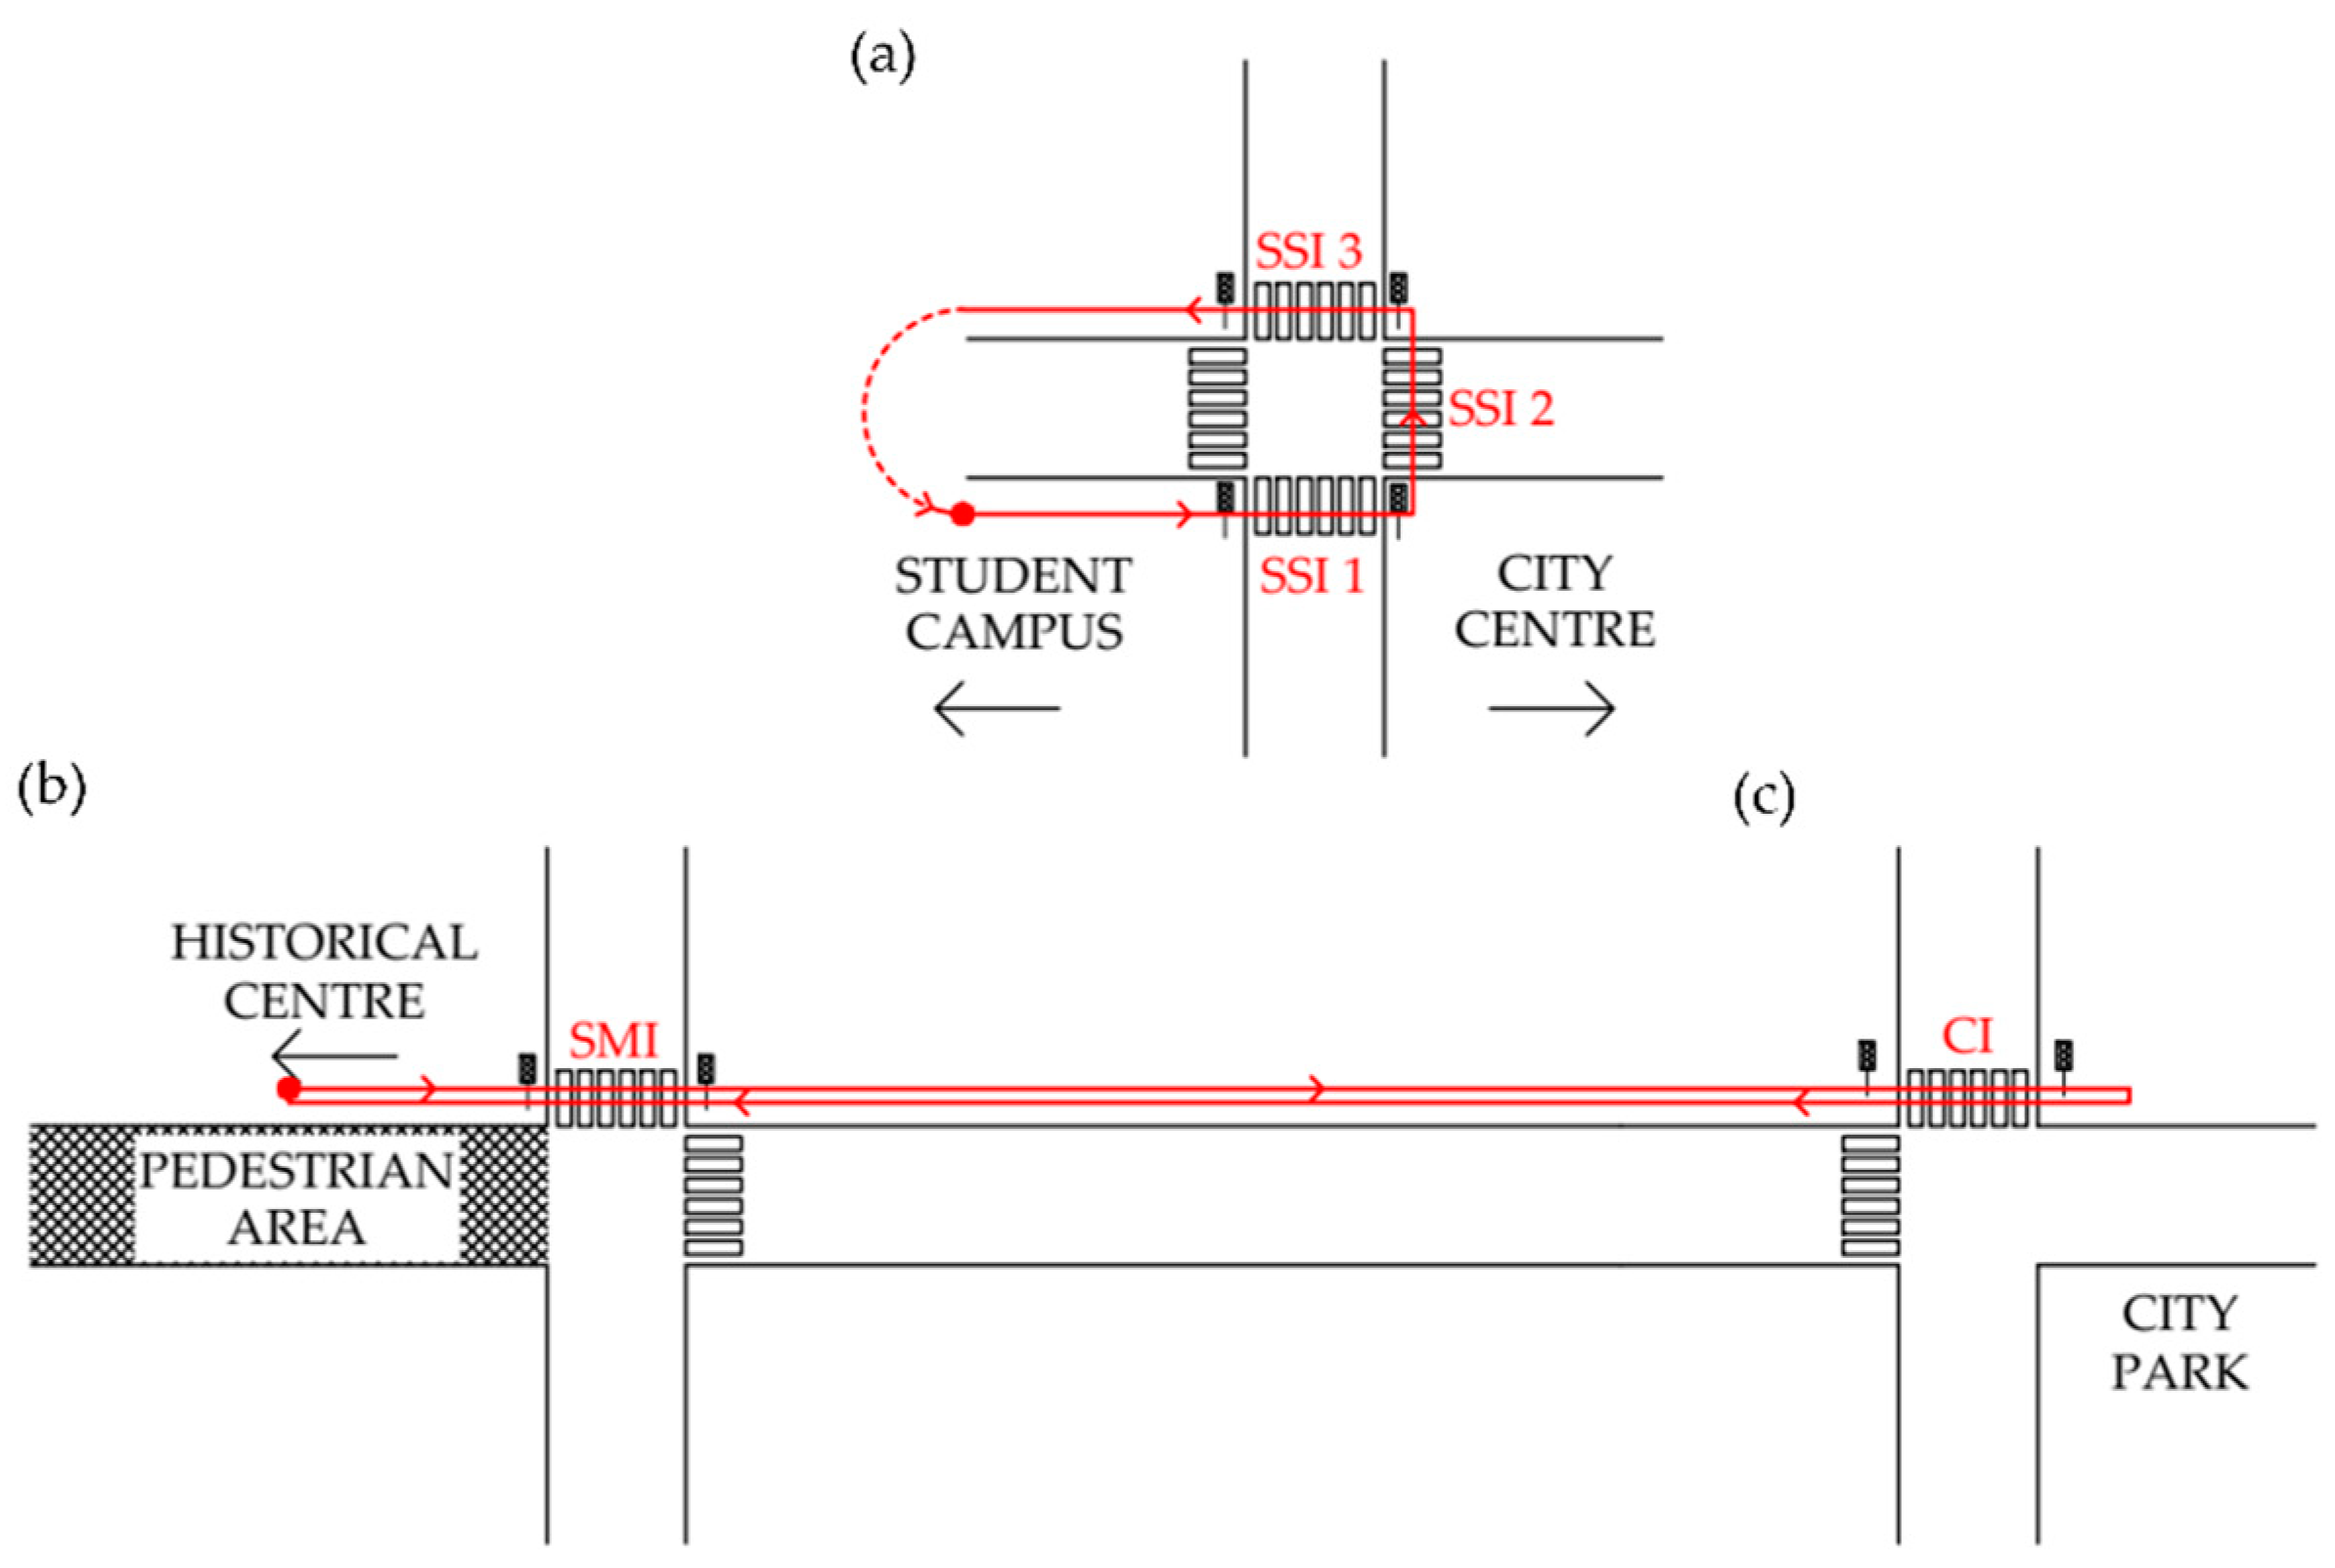
2.1. Location Selection
2.2. Participant Selection
2.3. Equipment
2.4. Development of the Experiment
3. Limitations
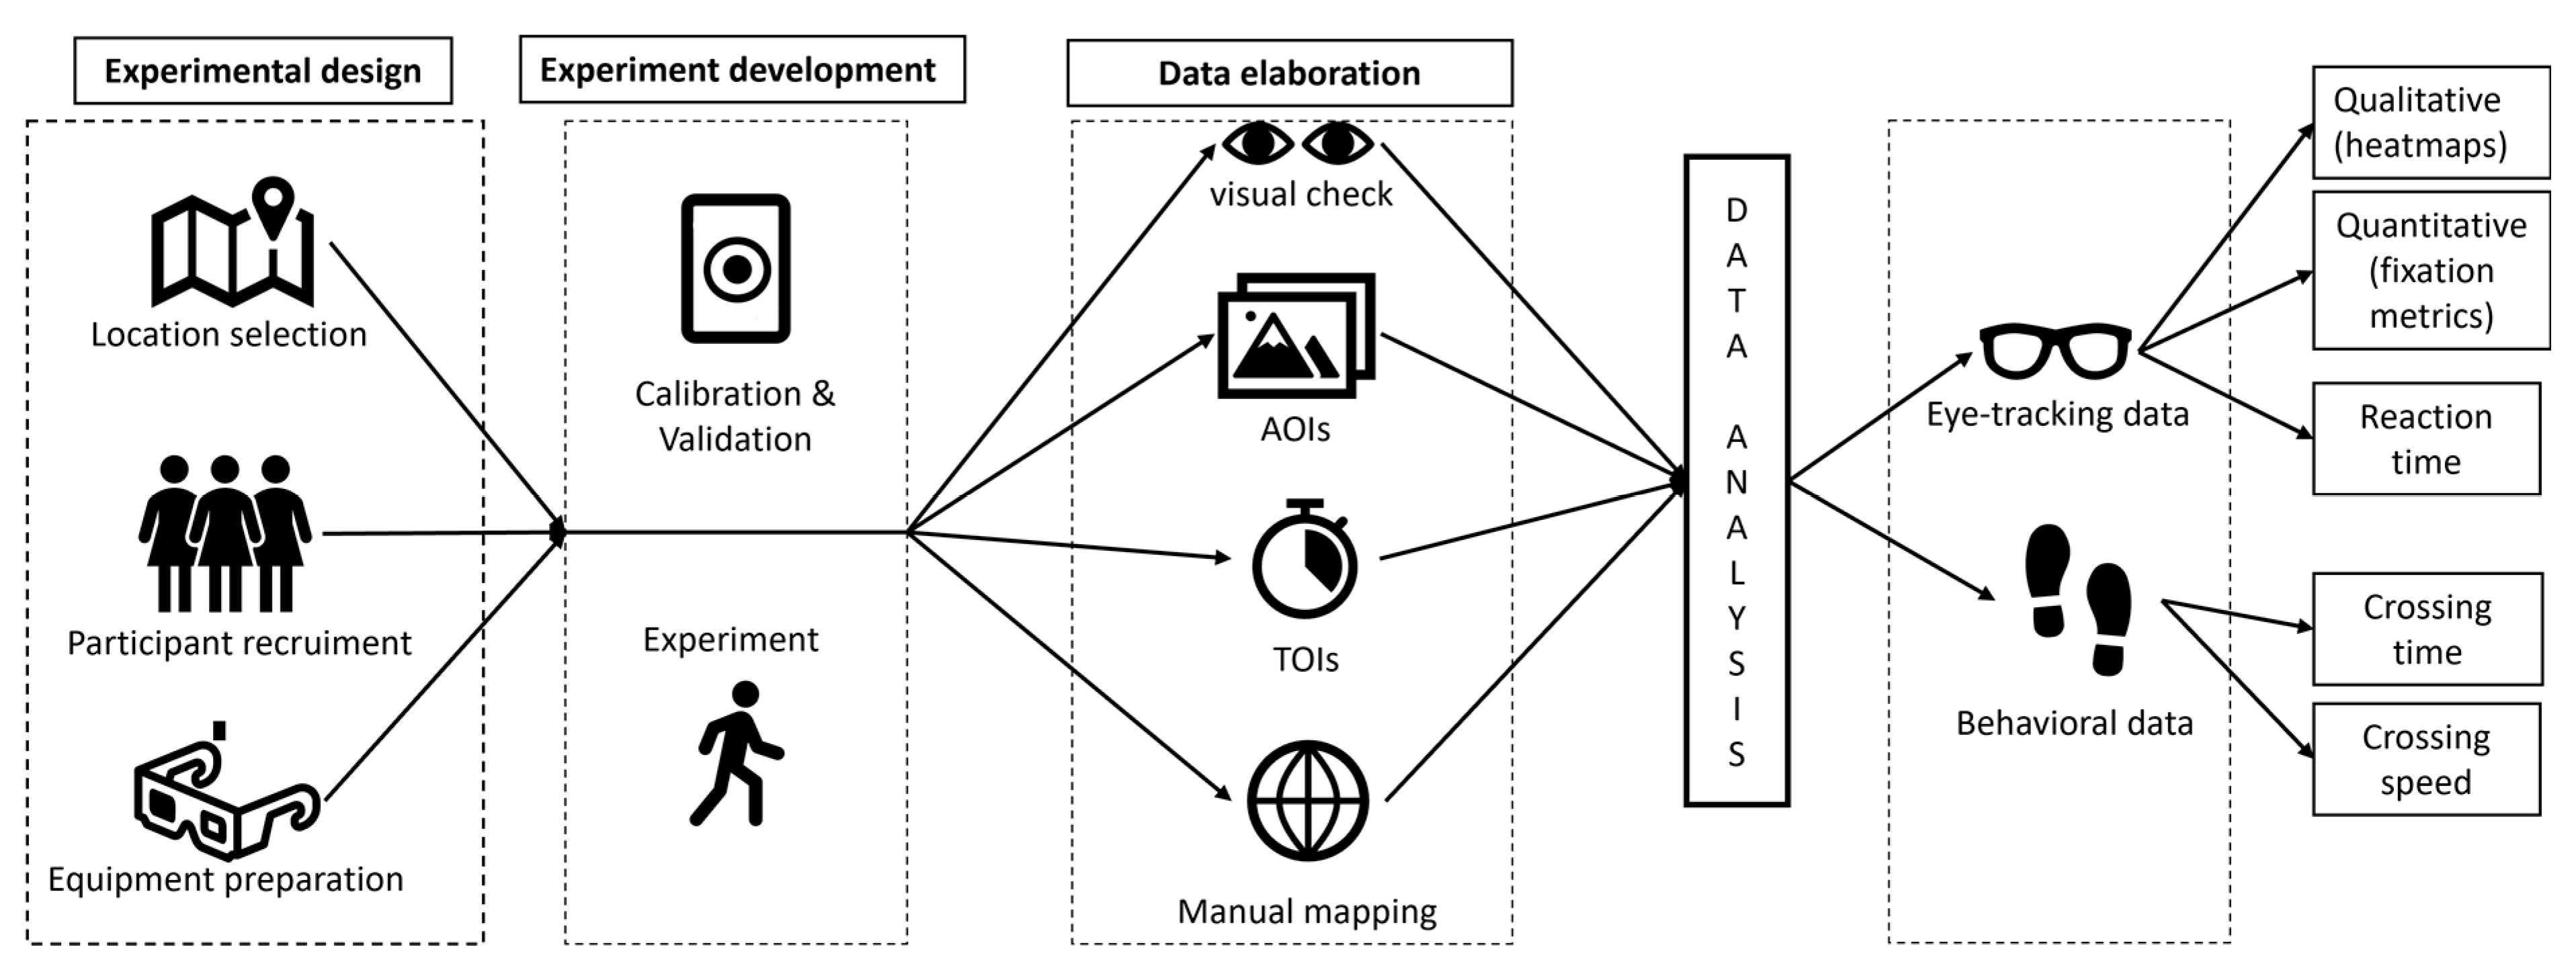
4. Data Elaboration
- An initial visual analysis of the collected video footage was conducted for several purposes. First, it helped to understand which elements were of interest to the participants and which were related to the aim of the present research. Second, the visual analysis allowed for the identification of common and divergent patterns of participant behavior, which facilitated the interpretation of the results during the analysis process. Finally, it was possible to define the starting and ending points (both temporal and spatial) as well as the duration of the crossing experience. The term “crossing experience” refers to the time period during which participants arrive at the intersection, stay there, wait for the green light, and cross the street to eventually reach the opposite safe side. It is clear that the crossing experience, during which data are continuously recorded, is not the same as the crossing action. This can be defined as the action that participants develop from the moment they leave the first safe side (when they first set foot on the roadway) to the moment they reach the opposite side (when they are fully on the opposite sidewalk). The crossing experience is composed of a waiting time, a reaction time, and a crossing time, so the crossing action is only part of it. This specification is important to understand the following results.
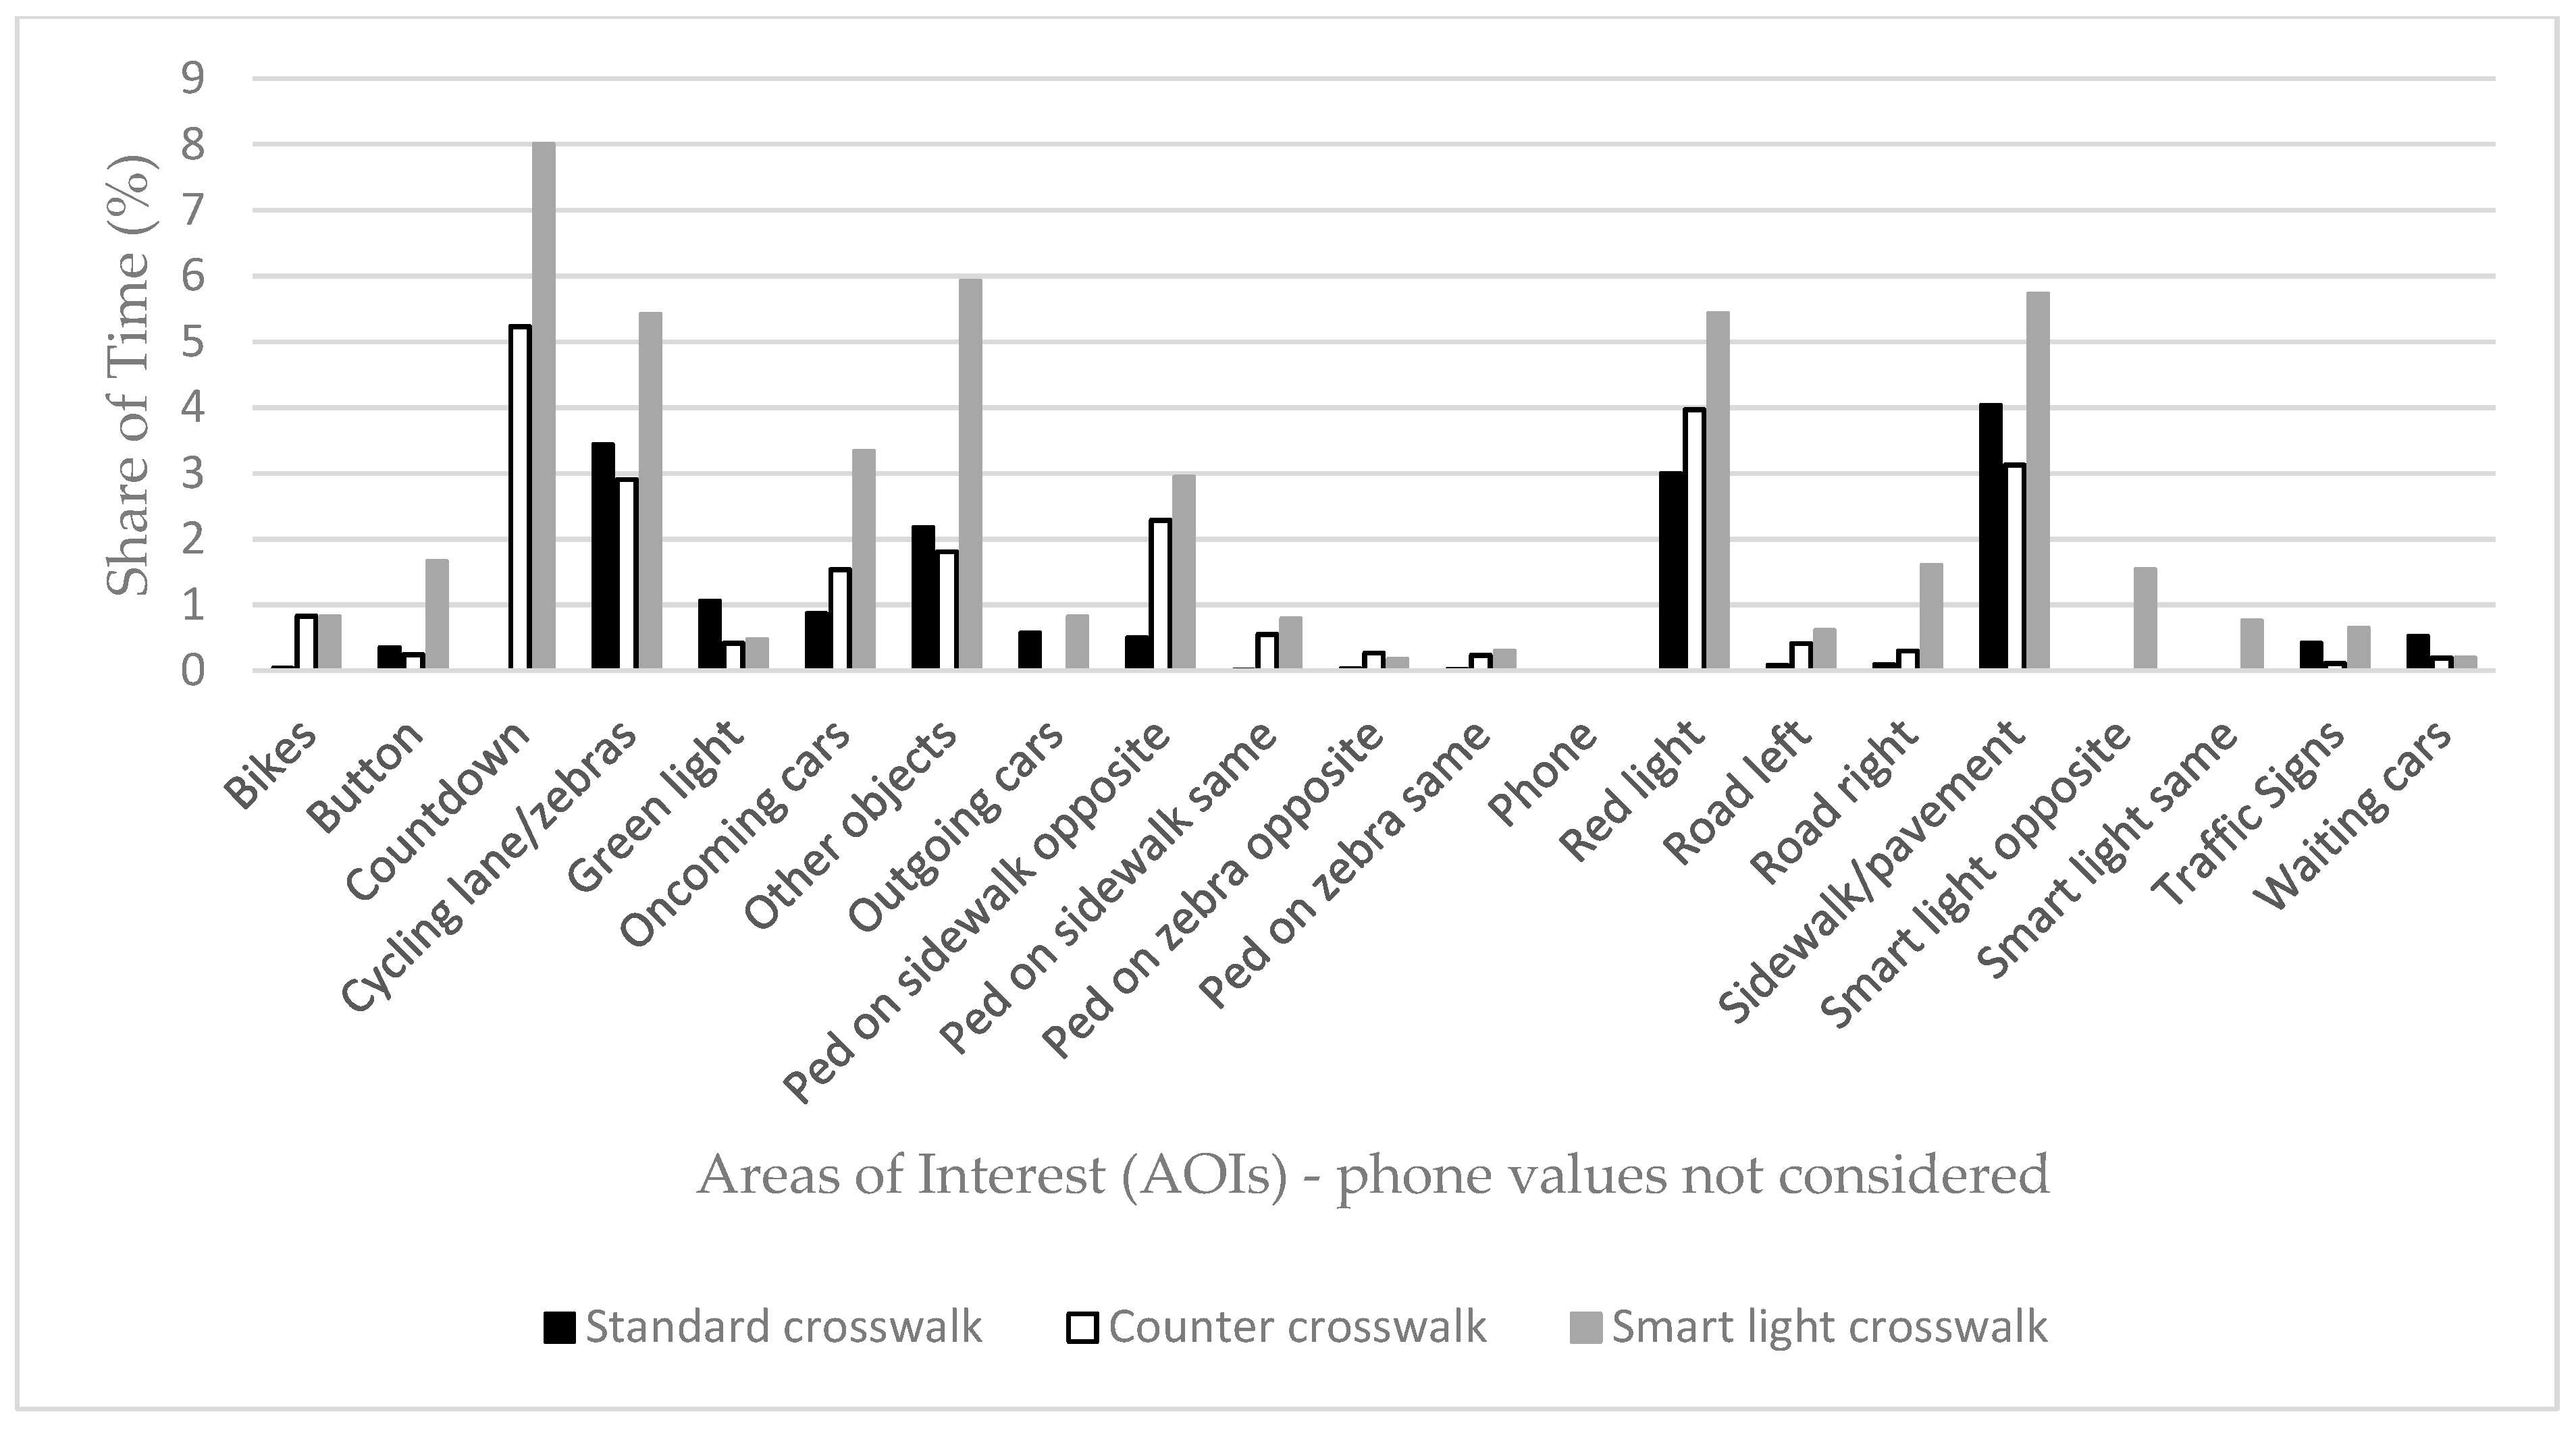
- After visually examining the video footage, areas of interest should be defined. These areas are very important tools in the Tobii processing software, as they allow gaze data to be aggregated based on elements that fit the goals of the individual investigation. They are created directly on the snapshot used to assign gaze items and basically function like “virtual masks” that collect all gaze items that fall within their scope. In this research, seven groups of AOIs were defined and are summarized below:
- ○
- Traffic light components: Specific AOIs were defined for the red and green traffic lights, the continuous red counter, the intelligent traffic light, and the pedestrian call button.
- ○
- Pedestrian flows: Pedestrians walking on the same or opposite sidewalk and pedestrians crossing the crosswalks in the same or opposite direction were also defined by specific AOIs.
- ○
- Bicycle traffic: bicyclists traveling in the same or opposite direction were also considered and defined as AOIs.
- ○
- Motor vehicle traffic: AOIs were defined for oncoming cars, cars waiting at the stop line, and cars exiting the intersection.
- ○
- Roadway elements: sidewalks and pavement, crosswalks, bike lanes, and traffic signs are among the elements considered that may affect pedestrian viewing patterns.
- ○
- Other elements not directly related to street design: parked cars, obstacles on the sidewalk, other lights and objects, and passing bicyclists and pedestrians (not involved in the crossing action) were considered.
- ○
- Phone: a specific AOI was defined for smartphone use.
- After the spatial aggregation of the data by the AOIs, it is useful to perform a temporal aggregation of the same, which can be performed by the so-called times of interest (TOIs). Times of interest are selected periods of the video recording in which eye movement data is mapped and clearly referred to in the quantitative results, the metrics. In the present study, each crossing experience coincides with a TOI. In this way, the final results indicate which elements (AOIs) were observed during each specific crossing experience (TOI).
- Finally, after identifying the AOIs and TOIs, you can proceed with the manual assignment. This process consists in manually defining, on the selected snapshot, to which AOI a specific viewpoint belongs. This process leads to the final outputs of the software, which can then be exported as qualitative plots and quantitative variables. Both types of outputs are considered and applied in the following analyzes.
5. Data Analysis
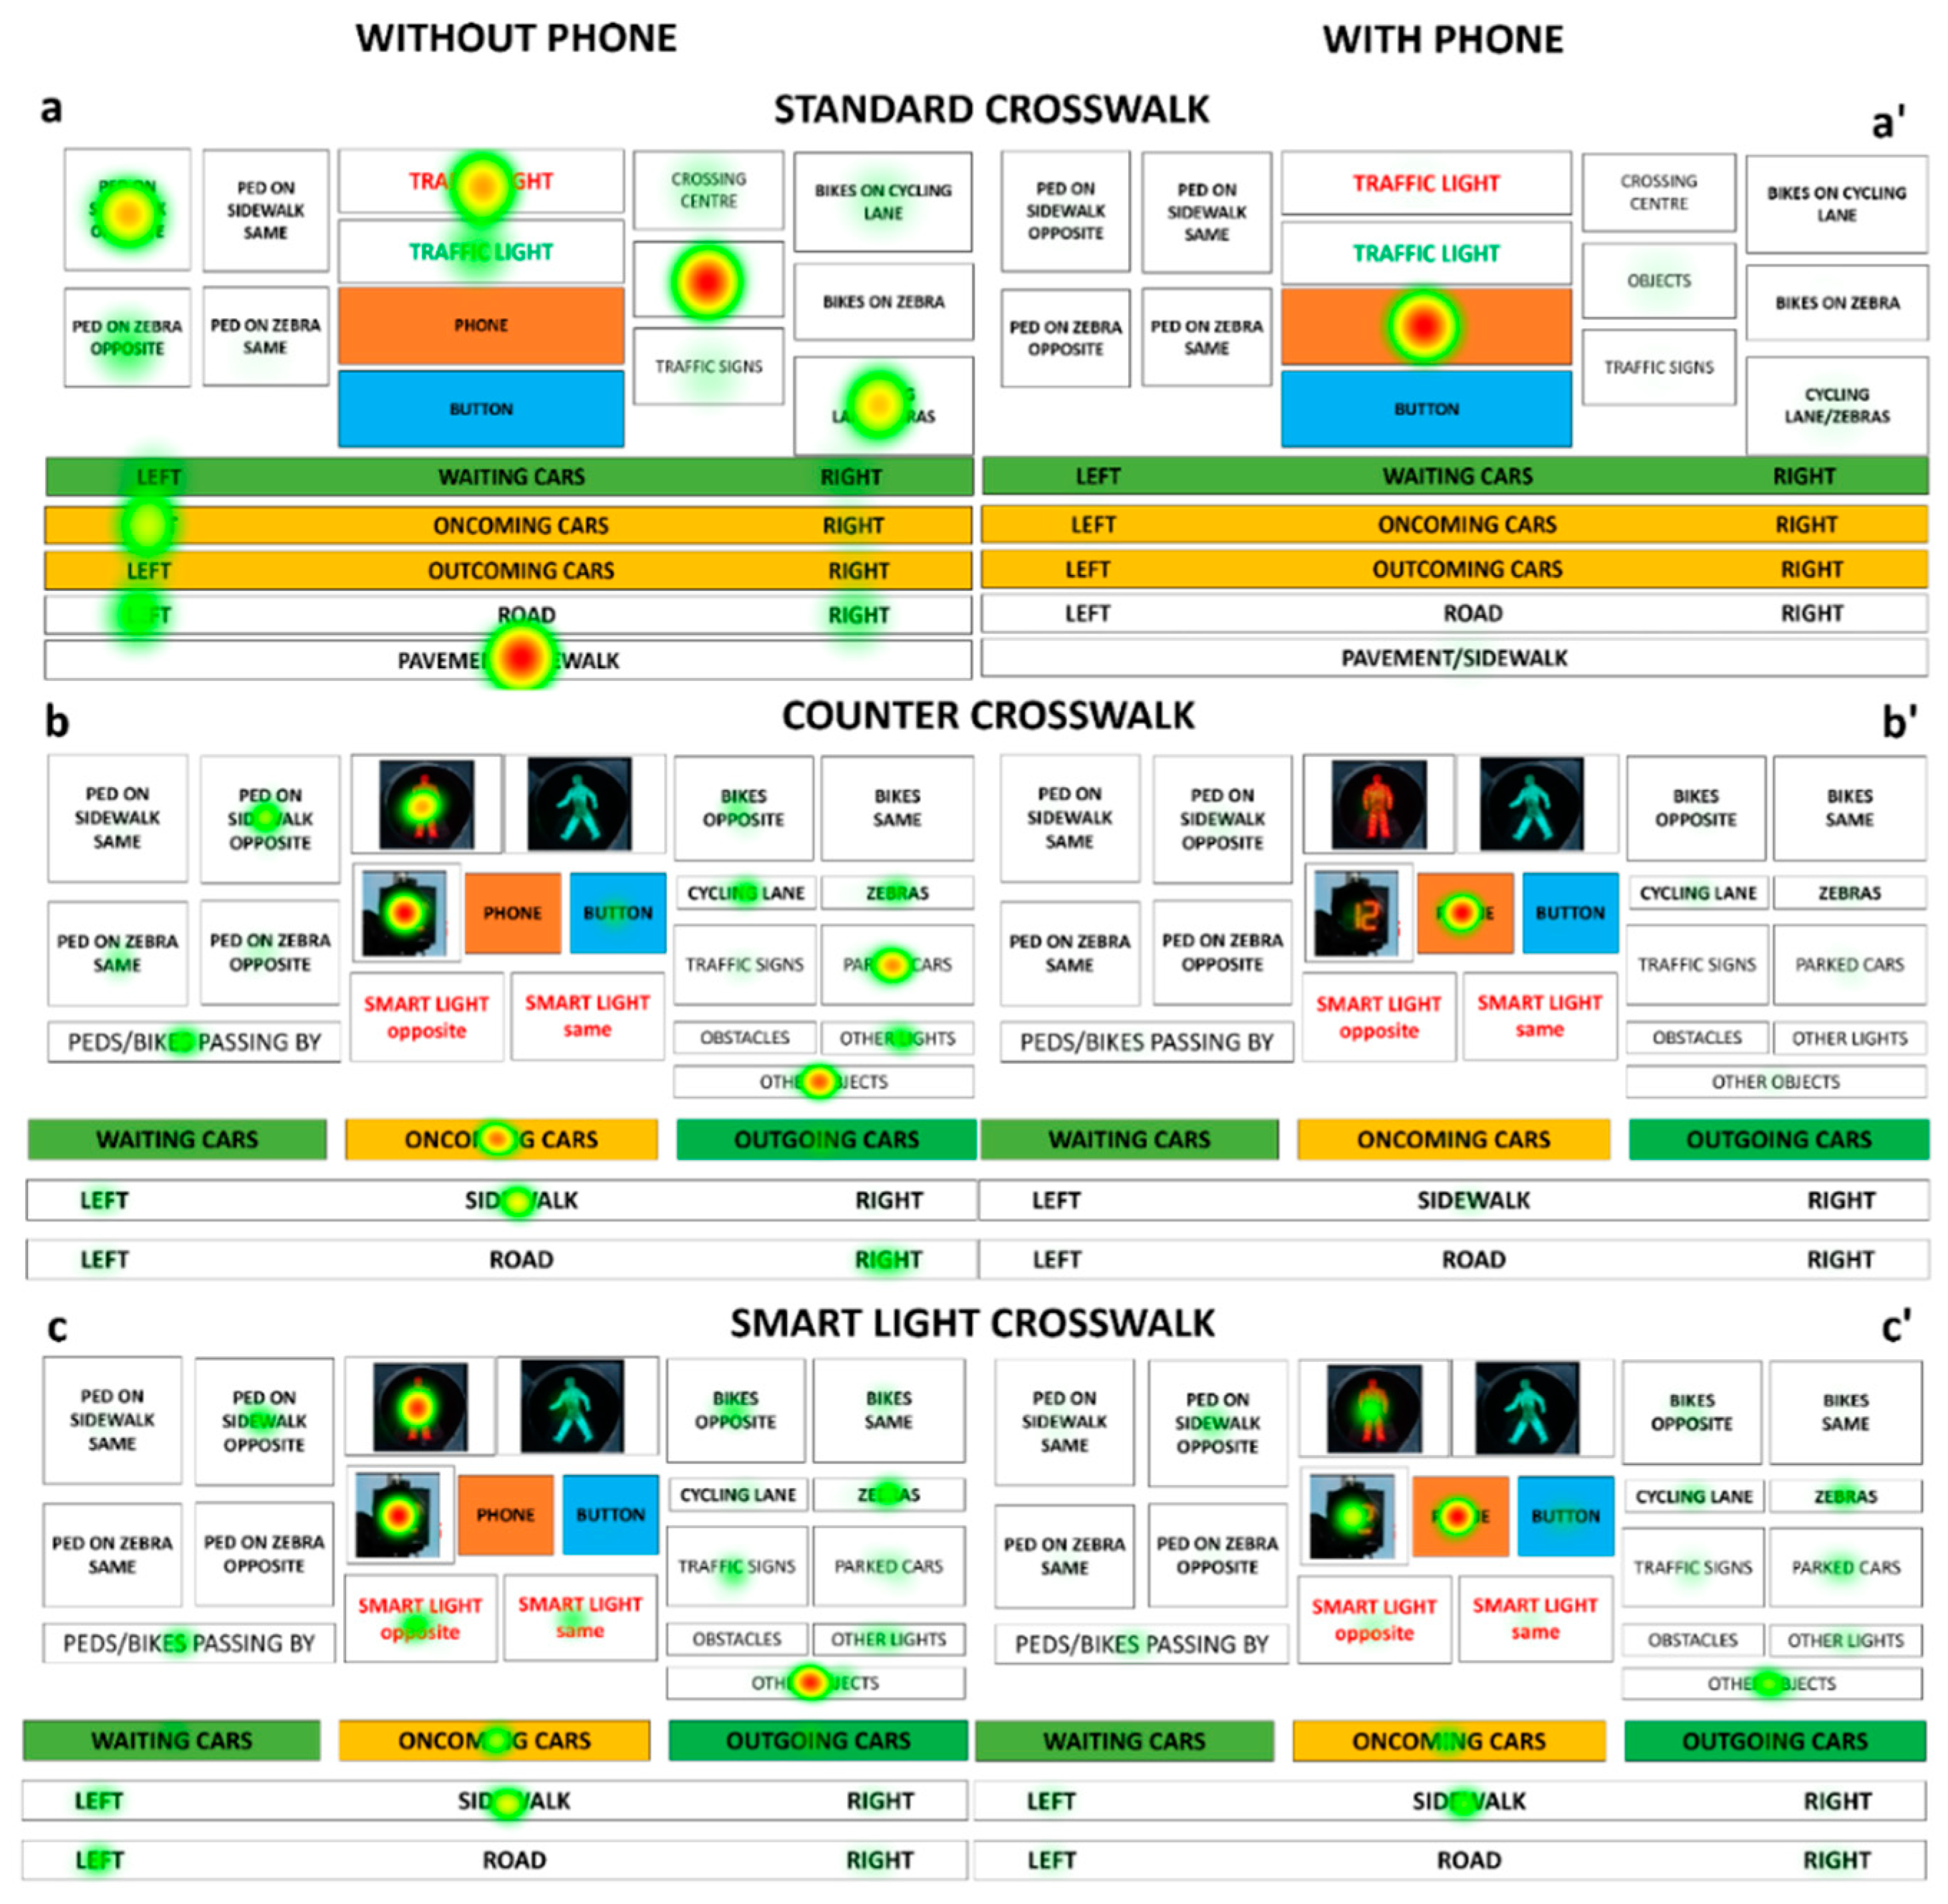
- Qualitative representations of participants’ gaze behavior: there are two graphical representations of fixations-heat maps and gaze plots. The first shows the duration and/or the number of fixations on the defined areas of interest. The second represents the sequence followed by each participant’s eyes. While heat maps are based on color-coding, where red areas are the most fixated and green areas are the least observed, gaze plots consist of a series of points, whose dimensions are related to the duration/number of fixations and represent the path followed by the gaze.
- Quantitative data on participant gaze behavior: these data include events, visits, and fixation data that have already been aggregated based on the defined AOIs and TOIs. In this study, the number of fixations, fixation duration, time to the first fixation, and duration of the first fixation are the data considered in the analysis.
- Quantitative data on participants’ crossing behavior: in this data, waiting time, crossing time, and crossing speed are considered. These variables are not directly output by the eye-tracking software but were measured from eye-tracking records. Waiting time is the time the participant waits to cross the road. It is defined as the time difference between the moment the participant arrives and stops at the intersection and the moment he/she starts crossing. The minimum value of the waiting time is 0 s if the participant meets a green light or disregards a red light. The crossing time is defined as the time from the moment the participant leaves the sidewalk with the first foot to the moment he/she is completely on the opposite safe side. It is also measured in seconds [s]. Finally, the crossing speed is calculated as the ratio between the length of the crossing in meters [m] and the crossing time [s].
6. Results
6.1. Qualitative Results
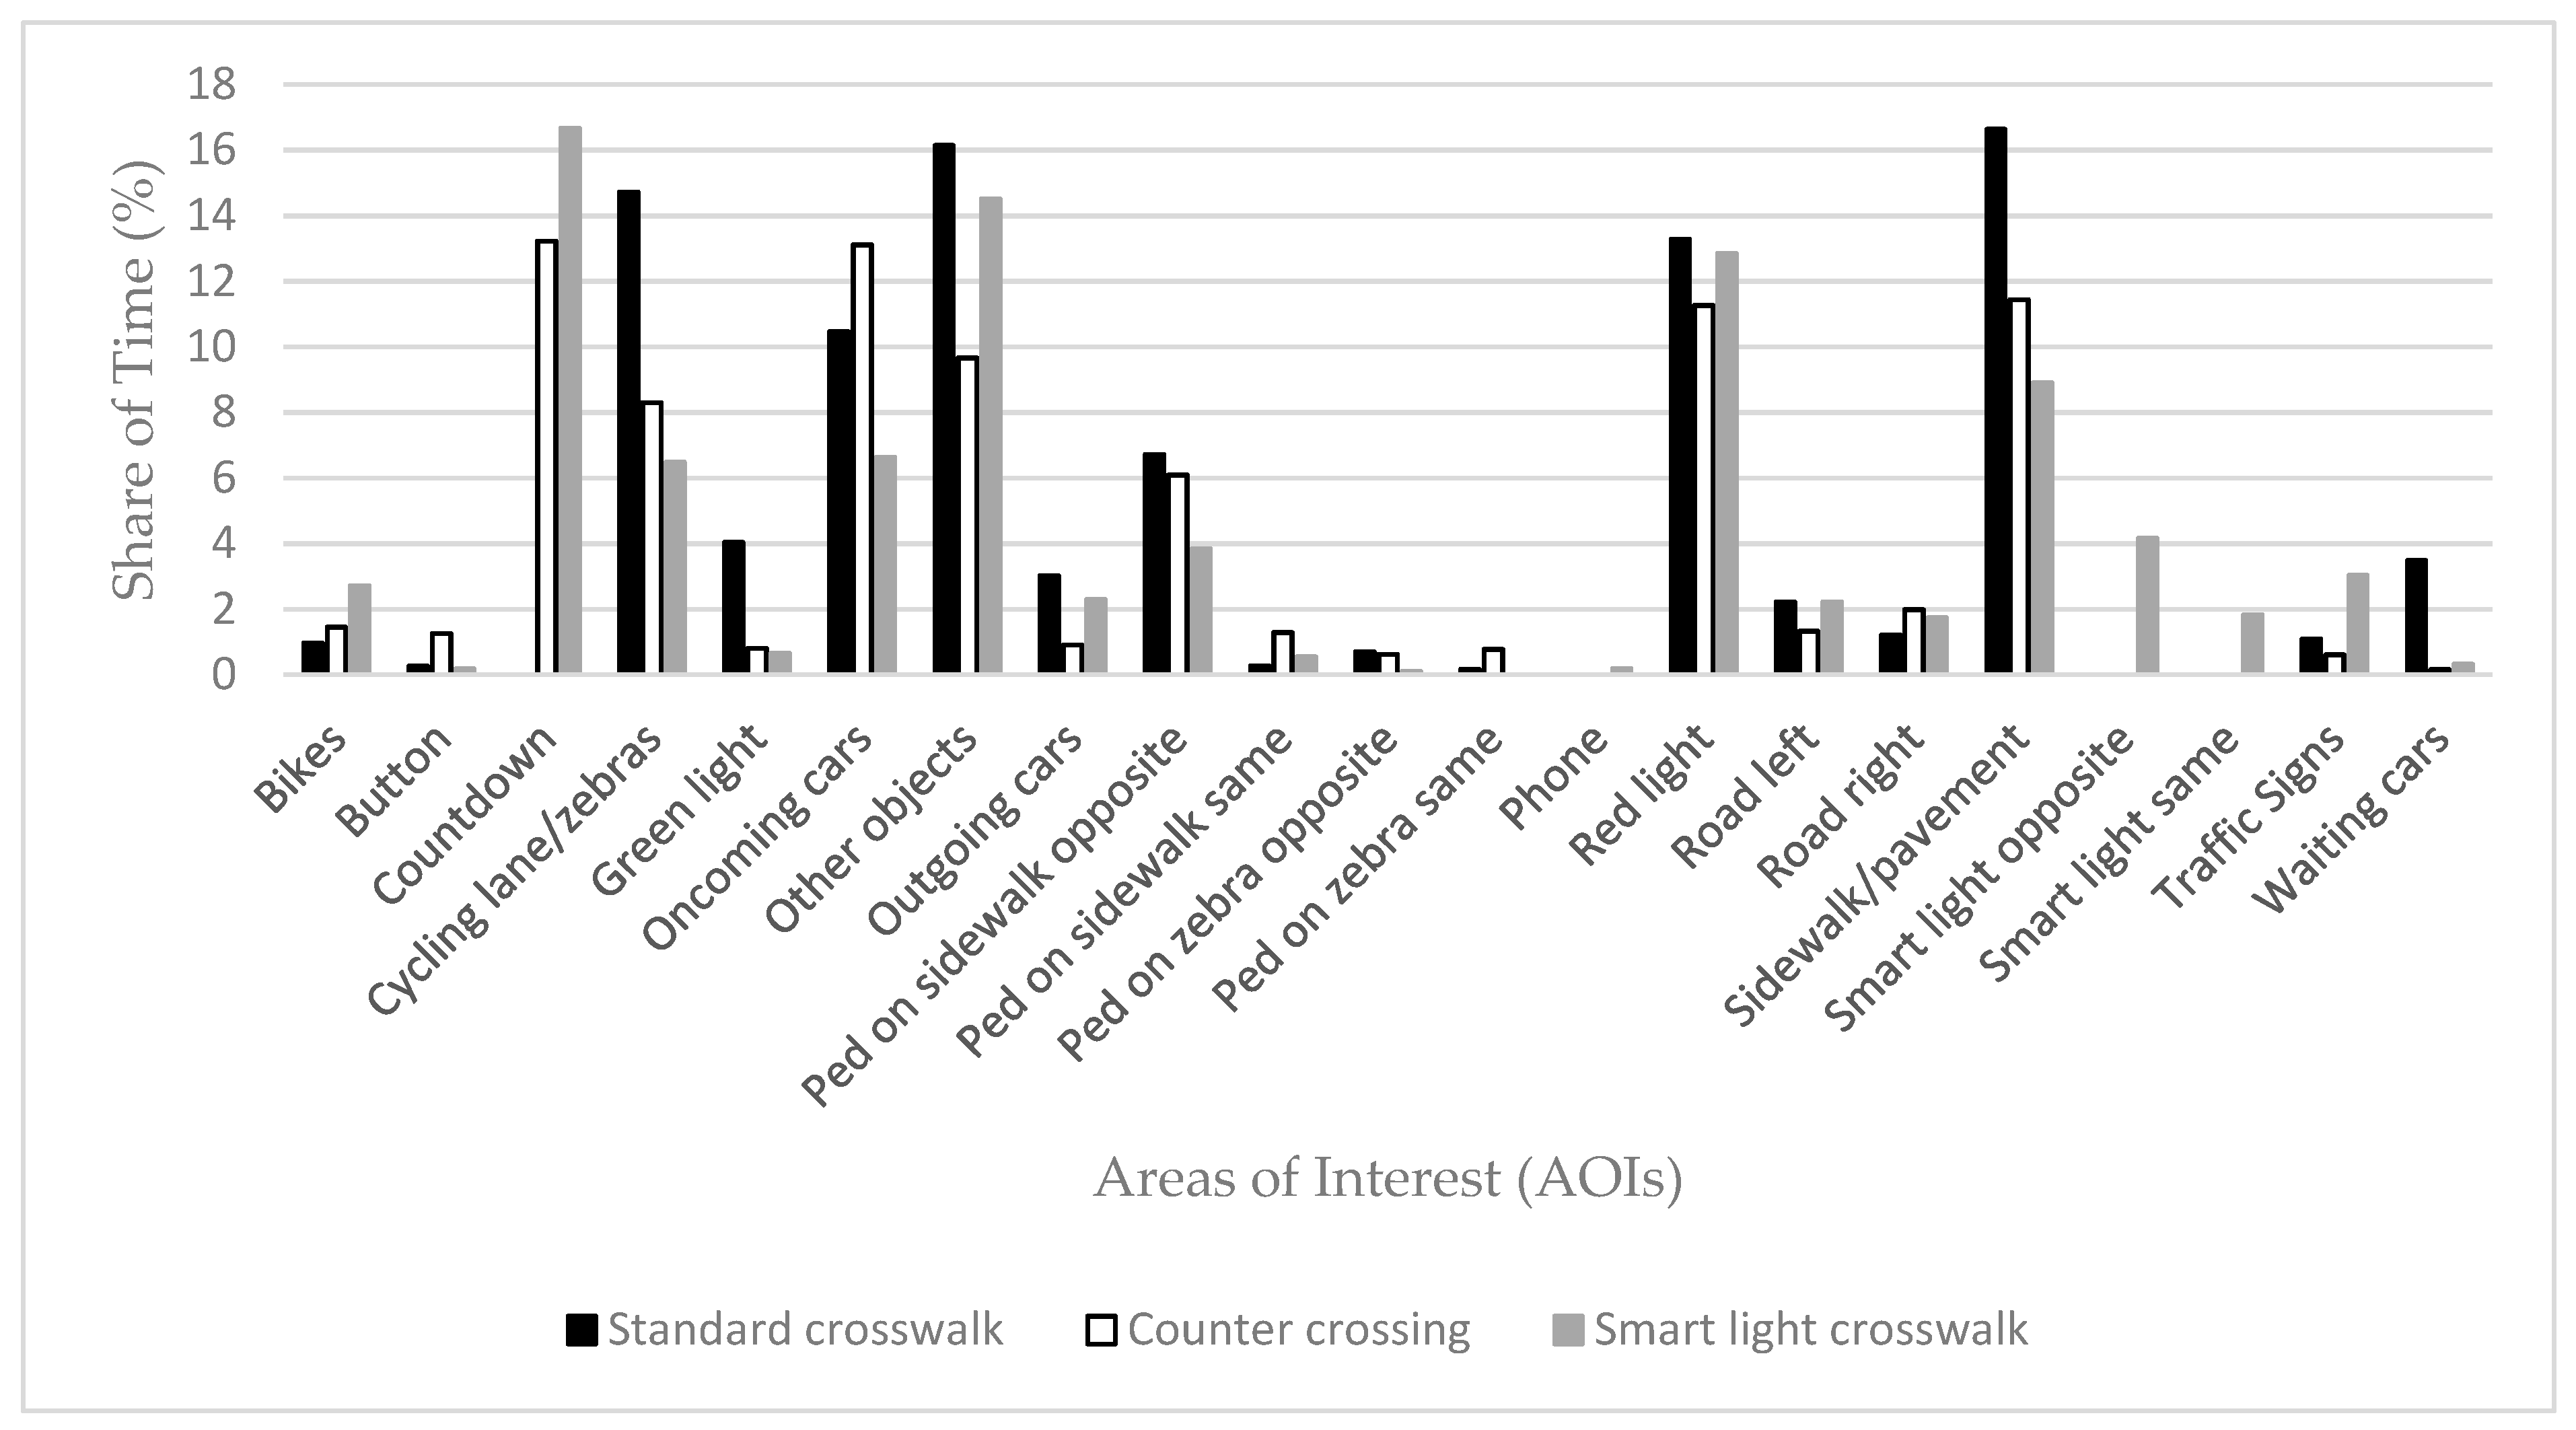
6.2. Quantitative Results
6.2.1. Reaction Time
6.2.2. Crossing Behavior
Waiting Time
Crossing Time
Crossing Speed
7. Discussion and Conclusions
Author Contributions
Funding
Institutional Review Board Statement
Informed Consent Statement
Data Availability Statement
Acknowledgments
Conflicts of Interest
References
- European Transport Safety Council (ETSC). How Safe Is Walking and Cycling in Europe? PIN Flash Report 38; ETSC: Brussels, Belgium, 30 January 2020. [Google Scholar]
- Alejalil, N.; Davoodi, S. Mobile phone use and its effects on pedestrian distraction. Int. J. High Risk Behav. Addict. 2016, 6, e35431. [Google Scholar] [CrossRef] [Green Version]
- Hatfield, J.; Murphy, S. The effects of Mobile phone use on pedestrian crossing behavior at signalized and unsignalized intersections. Accid. Anal. Prev. 2007, 39, 197–205. [Google Scholar] [CrossRef]
- Naser, J.L.; Troyer, D. Pedestrian injuries due to mobile phone use in public spaces. Accid. Anal. Prev. 2013, 57, 91–95. [Google Scholar] [CrossRef]
- Jiang, K.; Ling, F.; Feng, Z.; Ma, C.; Kumfer, W.; Shao, C.; Wang, K. Effects of mobile phone distraction on pedestrians’ crossing behavior and visual attention allocation at a signalized intersection: An outdoor experimental study. Accid. Anal. Prev. 2018, 115, 170–177. [Google Scholar] [CrossRef] [PubMed]
- Gruden, C.; Ištoka Otković, I.; Šraml, M. Safety Analysis of young pedestrian behavior at signalized intersections: An eye-tracking study. Sustainability 2021, 13, 4419. [Google Scholar] [CrossRef]
- Gilland, J. Driving, Eye-Tracking and Visual Entropy: Exploration of Age and Task Effects. Ph.D. Thesis, University of South Dakota, Vermillion, SD, USA, 2008. [Google Scholar]
- Ponds, R.W.H.M.; Brouwer, W.H.; van Wolffellaar, P.C. Age differences in divided attention in a simulated driving task. J. Gerentology 1988, 43, 151–156. [Google Scholar] [CrossRef]
- Gao, X.-Y.; Zhang, Y.-F.; Zheng, W.-L.; Lu, B.-L. Evaluating Driving Fatigue detection Algorithms using Eye Tracking Glasses. In Proceedings of the 2015 7th International IEEE/EMBS Conference on Neural Engineering (NER), Montpellier, France, 22–24 April 2015. [Google Scholar]
- Hopstaken, J.F.; van der Linden, D.; Bakker, A.B.; Kompier, M.A.J.; Leung, Y.K. Shifts in Attention During Mental Fatigue: Evidence From Subjective, Behavioral, Physiological, and Eye-tracking Data. J. Exp. Psychol. Hum. Percept. Perform. 2016, 42, 878–889. [Google Scholar] [CrossRef]
- Le, A.S.; Suzuki, T.; Aoki, H. Evaluating driver cognitive distraction by eye tracking: From simulator to driving. Transp. Res. Interdiscip. Perspect. 2020, 4, 100087. [Google Scholar] [CrossRef]
- Hurtado, S.; Chiasson, S. An Eye-tracking Evaluation of Driver Distraction and Unfamiliar Road signs. In Proceedings of the Automotive ‘UI 16: 8th International Conference on Automotive User Interfaces and Interactive Vehicular Applications 2016, Ann Arbor, MI, USA, 24–26 October 2016. [Google Scholar] [CrossRef]
- Mantuano, A.; Bernardi, S.; Rupi, F. Cyclist gaze behavior in urban space: AN eye-tracking experiment on the bicycle network of Bologna. Case Stud. Transp. Policy 2017, 5, 408–416. [Google Scholar] [CrossRef]
- Kovácsová, N.; Cabrall, C.D.D.; Antonisse, S.J.; de Haan, T.; van Namen, R.; Nooren, J.L.; Schreurs, R.; Hagenzieker, M.P.; de Winter, J.C.F. Cyclists’ eye movements and crossing judgments at uncontrolled intersections: An eye-tracking study using animated video clips. Accid. Anal. Prev. 2018, 120, 270–280. [Google Scholar] [CrossRef] [Green Version]
- Lévêque, L.; Ranchet, M.; Daniel, J.; Bornard, J.-C.; Bellet, T. Where do pedestrians look when crossing? A state of the art of the eye-tracking studies. IEEE Access 2020, 8, 164833–164842. [Google Scholar] [CrossRef]
- Tapiro, H.; Meir, A.; Parmet, Y.; Oron-Gilad, T. Visual search strategies of child-pedestrians in road crossing tasks. In Proceedings of the Human Factors and Ergonomics Society Europe Chapter 2013 Annual Conference; HFES: Washington, DC, USA, 2013. [Google Scholar]
- Tapiro, H.; Borowsky, A.; Oron-Gilad, T.; Parmet, Y. Where do older pedestrians glance before deciding to cross a simulated two-lane road? A pedestrian simulator paradigm. In Proceedings of the Human Factors and Ergonomics Society Europe Chapter 2013 Annual Conference; SAGE Publishing: Washington, DC, USA, 2016. [Google Scholar]
- Dey, D.; Walker, F.; Martens, M.; Terken, J. Gaze patterns in pedestrian interaction with vehicles: Towards effective design of external human-machine interfaces for automated vehicles. In Proceedings of the AutomotiveUI’19: Proceedings of the 11th International Conference on Automotive User Interfaces and Interactive Vehicular Applications, Utrecht, The Netherlands, 21–25 September 2019. [Google Scholar]
- Eisma, Y.B.; van Bergen, S.; ter Brake, S.M.; Hensen, M.T.T.; Tempelaar, W.J.; de Winter, J.C.F. External human-machine interfaces: The effect of display location on crossing intentions and eye movements. Information 2019, 11, 13. [Google Scholar] [CrossRef] [Green Version]
- Geruschat, D.R.; Hassan, S.E.; Turano, K.A. Gaze behavior while crossing complex intersections. Optom. Vis. Sci. 2003, 80, 515–528. [Google Scholar] [CrossRef]
- Gruden, C.; Ištoka Otković, I.; Šraml, M. Pedestrian Safety at roundabouts: Their crossing and glance behavior in the interaction with vehicular traffic. Accid. Anal. Prev. 2021, 159, 106290. [Google Scholar] [CrossRef] [PubMed]
- Fotios, S.; Uttley, J.; Hara, N. Critical pedestrian tasks: Using eye-tracking within a dual task paradigm. In Proceedings of the CIE Centenary Conference “Towards a New Century of Light”. CIE Centenary Conference, Paris, France, 15–16 April 2013; pp. 234–240. [Google Scholar]
- Fotios, S.; Uttley, J.; Cheal, C.; Hara, N. Using eye-tracking to identify pedestrians’ critical visual tasks, Part 1. Dual task approach. Lighting Res. Technol. 2015, 47, 133–148. [Google Scholar] [CrossRef] [Green Version]
- Fotios, S.; Uttley, J.; Yang, B. Using eye-tracking to identify pedestrians’ critical visual tasks, Part 2. Fixation on pedestrians. Lighting Res. Technol. 2015, 47, 149–160. [Google Scholar] [CrossRef] [Green Version]
- Foulsham, T.; Walker, E.; Kingstone, A. The where, what and when of gaze allocation in the lab and the natural environment. Vis. Res. 2011, 51, 1920–1931. [Google Scholar] [CrossRef]
- Davoudian, N.; Raynham, P. What do pedestrians look at night? Lighting Res. Technol. 2012, 44, 438–448. [Google Scholar] [CrossRef]
- Werneke, J.; Vollrath, M. What does the driver look at? The influence of intersection characteristics on attention allocation and driving behavior. Accid. Anal. Prev. 2012, 45, 610–619. [Google Scholar] [CrossRef]
- Li, G.; Wang, Y.; Yhu, F.; Sui, X.; Wang, N.; Qu, X.; Green, P. Drivers’ visual scanning behavior at signalized and unsignalized intersections: A naturalistic driving study in China. J. Saf. Res. 2019, 71, 219–229. [Google Scholar] [CrossRef]
- Lantieri, C.; Costa, M.; Vignali, V.; Acerra, E.M.; Marchetti, P.; Simone, A. Flashing in-curb LEDs and beacons at unsignalized crosswalks and driver’s visual attention to pedestrians during nighttime. Ergonomics 2021, 64, 330–341. [Google Scholar] [CrossRef] [PubMed]
- Vignali, V.; Pazzini, M.; Ghasemi, N.; Lantieri, C.; Simone, A.; Dondi, G. The safety and conspicuity of pedestrian crossing at roundabouts: The effect of median refuge island and zebra markings. Transp. Res. Part F 2020, 68, 94–104. [Google Scholar] [CrossRef]
- Rosenbloom, T.; Pereg, A. A within-subject design of comparison of waiting time of pedestrians before crossing three successive road crossings. Transp. Res. Part F 2012, 15, 625–634. [Google Scholar] [CrossRef]
- Zhu, D.; Sze, N.N.; Feng, Z. The trade-off between safety and time in the red light running behaviours of pedestrians: A random regret minimization approach. Accid. Anal. Prev. 2021, 158, 106214. [Google Scholar] [CrossRef] [PubMed]
- Minitab Inc. Minitab Statistical Software, Release 15 for Windows; Minitab Inc.: State College, PA, USA, 2007. [Google Scholar]


| Signalized Crossing Typology | Width (m) | Length (m) | One/Bi-Directional | Number of Lanes | Flow (veh/hr) |
|---|---|---|---|---|---|
| Standard signalized crossing 1 (SSI 1) | 5.85 | 16.00 | Bi-directional | 3 | 540 |
| Standard signalized crossing 2 (SSI 2) | 6.00 | 8.30 | Bi-directional | 3 | 600 |
| Standard signalized crossing 3 (SSI 3) | 5.70 | 12.00 | Bi-directional | 3 | 480 |
| Signalized crossing with counter (CI) | 3.35 | 6.00 | One-directional | 2 | 486 |
| Signalized crossing with smart traffic light (SMI) | 4.00 | 7.00 | One-directional | 2 | 665 |
| Without Phone | With Phone | |||||
|---|---|---|---|---|---|---|
| AOIs | Standard Crosswalk | Counter Crosswalk | Smart Light Crosswalk | Standard Crosswalk | Counter Crosswalk | Smart Light Crosswalk |
| Bikes | 2.3 | 3.8 | 8.9 | 0.3 | 3.5 | 3.8 |
| Button | 1.0 | 2.2 | 1.0 | 1.5 | 1.7 | 5.9 |
| Countdown | 0.0 | 5.9 | 7.4 | 0.0 | 3.2 | 16.9 |
| Cycling lane/zebras | 9.4 | 8.7 | 9.2 | 3.9 | 6.1 | 21.8 |
| Green light | 2.2 | 1.3 | 1.3 | 1.4 | 1.4 | 2.4 |
| Oncoming cars | 12.8 | 8.9 | 5.5 | 3.6 | 3.3 | 12.7 |
| Other objects | 10.4 | 6.3 | 8.9 | 2.8 | 0.0 | 0.5 |
| Outgoing cars | 5.1 | 2.5 | 2.7 | 2.6 | 3.3 | 12.7 |
| Ped on sidewalk opposite | 4.4 | 4.4 | 5.1 | 2.5 | 2.9 | 10.0 |
| Ped on sidewalk same | 2.5 | 2.0 | 3.3 | 0.3 | 2.4 | 3.0 |
| Ped on zebra opposite | 1.7 | 1.5 | 0.5 | 0.3 | 1.7 | 1.5 |
| Ped on zebra same | 1.7 | 2.8 | 0.0 | 0.3 | 3.3 | 2.6 |
| Phone | 0.0 | 0.0 | 2.0 | 32.9 | 34.2 | 45.5 |
| Red-light | 5.6 | 6.2 | 7.1 | 4.0 | 3.1 | 14.2 |
| Road left | 2.6 | 1.9 | 3.3 | 1.0 | 1,2 | 3.7 |
| Road right | 2.0 | 2.8 | 3.3 | 1.0 | 2,7 | 6.5 |
| Sidewalk/pavement | 8.5 | 6.6 | 7.5 | 4.6 | 3.8 | 21.7 |
| Smart light opposite | 0.0 | 0.0 | 2.8 | 0.0 | 0.0 | 4.1 |
| Smart light same | 0.0 | 0.0 | 3.1 | 0.0 | 0.0 | 4.6 |
| Traffic Signs | 1.4 | 1.3 | 2.9 | 0.9 | 1.5 | 2.1 |
| Waiting cars | 5.3 | 1.2 | 1.5 | 1.8 | 2.3 | 1.6 |
| Descriptive Statistics | Standard Crosswalk | Counter Crosswalk | Smart Light Crosswalk |
|---|---|---|---|
| Mean | 1.288 | 0.786 | 1.270 |
| Standard error | 0.288 | 0.116 | 0.202 |
| Asymmetry | 3.67 | 1.58 | 3.15 |
| Minimum | 0.016 | 0 | 0 |
| Maximum | 11.905 | 2.546 | 9.037 |
| Standard Crosswalk | Counter Crosswalk | Smart Light Crosswalk | |
|---|---|---|---|
| mean | 1.288 | 0.7856 | 1.270 |
| standard deviation | 1.977 | 0.8498 | 1.473 |
| test statistics | 14.694 | 3.045 | 3.360 |
| p-value | <0.005 | <0.005 | <0.005 |
| α-level | 0.05 | 0.05 | 0.05 |
| Test | Kruskal–Wallis | Mood’s Median | |||
|---|---|---|---|---|---|
| Crossing Typology | Median | Average Rank | Z | Median | Q3-Q1 |
| Standard crosswalk | 0.4824 | 77.4 | 1.00 | 0.4824 | 1.764 |
| Counter crosswalk | 0.4505 | 68.5 | −1.48 | 0.4505 | 1.059 |
| Smart light crosswalk | 0.8540 | 86.8 | 0.40 | 0.8540 | 1.348 |
| Overall | 77.5 | 0.625 | |||
| H | 4.53 | H (adjusted for ties) | 4.53 | Chi-square | 5.23 |
| P | 0.10 | P (adjusted for ties) | 0.104 | P | 0.07 |
| Standard Crosswalk | Counter Crosswalk | Smart Crosswalk | |
|---|---|---|---|
| Mean value | 18.38 | 27.30 | 24.58 |
| Standard error | 1.98 | 1.91 | 1.80 |
| Standard Crosswalk | Counter Crosswalk | Smart Crosswalk | |
|---|---|---|---|
| Mean value | 18.38 | 27.30 | 24.58 |
| 95% confidence interval | (14.86; 21.90) | (23.34; 31.25) | (20.59; 28.58) |
| p-value | 0.003 | 0.003 | 0.003 |
| Standard Crosswalk | Counter Crosswalk | Smart Light Crosswalk | ||||
|---|---|---|---|---|---|---|
| Without Phone | With Phone | Without Phone | With Phone | Without Phone | With Phone | |
| Mean | 8.86 | 9.16 | 4.14 | 3.96 | 5.44 | 5.23 |
| Standard error | 0.28 | 0.33 | 0.13 | 0.12 | 0.15 | 0.19 |
| Asymmetry | 0.83 | 0.69 | 0.47 | 0.01 | 1.41 | 2.16 |
| Minimum | 6.78 | 6.22 | 3.00 | 3.00 | 4.00 | 4.00 |
| Maximum | 12.69 | 13.08 | 6.00 | 5.00 | 8.00 | 9.00 |
| Level of confidence | 0.58 | 0.67 | 0.27 | 0.24 | 0.32 | 0.40 |
| Descriptive Statistics | Standard Crosswalk | Counter Crosswalk | Smart Light Crosswalk |
|---|---|---|---|
| Mean | 1.61 | 1.49 | 1.31 |
| Standard error | 0.03 | 0.05 | 0.03 |
| Asymmetry | −0.14 | 0.63 | −0.31 |
| Minimum | 1.26 | 1.00 | 0.88 |
| Maximum | 1.94 | 2.00 | 1.75 |
| Level of confidence | 0.06 | 0.10 | 0.07 |
| Descriptive Statistics | Standard Crosswalk | Counter Crosswalk | Smart Light Crosswalk |
|---|---|---|---|
| Mean | 1.57 | 1.55 | 1.38 |
| Standard error | 0.04 | 0.05 | 0.04 |
| Asymmetry | 0.69 | 0.80 | −0.25 |
| Minimum | 1.22 | 1.20 | 0.78 |
| Maximum | 2.07 | 2.00 | 1.75 |
| Level of confidence | 0.08 | 0.10 | 0.09 |
| Descriptive Statistics | Standard Crosswalk | Counter Crosswalk | Smart Light Crosswalk | |||
|---|---|---|---|---|---|---|
| AD | KS | AD | KS | AD | KS | |
| mean | 1.608 | 1.608 | 1.489 | 1.489 | 1.31 | 1.31 |
| standard deviation | 0.1674 | 0.1674 | 0.2572 | 0.2572 | 0.1724 | 0.1724 |
| test statistics | 0.363 | 0.096 | 2.897 | 0.341 | 2.788 | 0.33 |
| p-value | 0.419 | >0.150 | <0.005 | <0.010 | <0.005 | <0.010 |
| α-level | 0.05 | 0.05 | 0.05 | 0.05 | 0.05 | 0.05 |
| Descriptive Statistics | Standard Crosswalk | Counter Crosswalk | Smart Light Crosswalk | |||
|---|---|---|---|---|---|---|
| AD | KS | AD | KS | AD | KS | |
| mean | 1.57 | 1.57 | 1.55 | 1.55 | 1.376 | 1.376 |
| standard deviation | 0.2292 | 0.2292 | 0.2486 | 0.2486 | 0.2181 | 0.2181 |
| test statistics | 0.627 | 0.14 | 3.507 | 0.387 | 2.256 | 0.302 |
| p-value | 0.093 | 0.122 | <0.005 | <0010 | <0.005 | <0.010 |
| α-level | 0.05 | 0.05 | 0.05 | 0.05 | 0.05 | 0.05 |
| Test | Kruskal–Wallis | Mood’s Median | |||
|---|---|---|---|---|---|
| Crossing Typology | Median | Average Rank | Z | Median | Q3-Q1 |
| Standard crosswalk | 1.615 | 59.8 | 4.54 | 1.615 | 0.264 |
| Counter crosswalk | 1.5 | 46.2 | 0.71 | 1.5 | 0.225 |
| Smart light crosswalk | 1.4 | 22 | −5.41 | 1.4 | 0.233 |
| Overall | 1.5 | 43.5 | 1.5 | ||
| H | 33.56 | H (adjusted for ties) | 34.08 | Chi-square | 35.57 |
| P | 0 | P (adjusted for ties) | 0 | P | 0 |
| Test | Kruskal–Wallis | Mood’s Median | |||
|---|---|---|---|---|---|
| Crossing Typology | Median | Average Rank | Z | Median | Q3-Q1 |
| Standard crosswalk | 1.518 | 483 | 1.83 | 1.518 | 0.319 |
| Counter crosswalk | 1.5 | 49 | 1.79 | 1.5 | 0 |
| Smart light crosswalk | 1.4 | 27.5 | −3.7 | 1.4 | 0.233 |
| Overall | 1.5 | 42 | 1.5 | ||
| H | 13.71 | H (adjusted for ties) | 13.95 | Chi-square | 25.14 |
| P | 0.001 | P (adjusted for ties) | 0.001 | P | 0 |
Publisher’s Note: MDPI stays neutral with regard to jurisdictional claims in published maps and institutional affiliations. |
© 2022 by the authors. Licensee MDPI, Basel, Switzerland. This article is an open access article distributed under the terms and conditions of the Creative Commons Attribution (CC BY) license (https://creativecommons.org/licenses/by/4.0/).
Share and Cite
Gruden, C.; Ištoka Otković, I.; Šraml, M. An Eye-Tracking Study on the Effect of Different Signalized Intersection Typologies on Pedestrian Performance. Sustainability 2022, 14, 2112. https://doi.org/10.3390/su14042112
Gruden C, Ištoka Otković I, Šraml M. An Eye-Tracking Study on the Effect of Different Signalized Intersection Typologies on Pedestrian Performance. Sustainability. 2022; 14(4):2112. https://doi.org/10.3390/su14042112
Chicago/Turabian StyleGruden, Chiara, Irena Ištoka Otković, and Matjaž Šraml. 2022. "An Eye-Tracking Study on the Effect of Different Signalized Intersection Typologies on Pedestrian Performance" Sustainability 14, no. 4: 2112. https://doi.org/10.3390/su14042112
APA StyleGruden, C., Ištoka Otković, I., & Šraml, M. (2022). An Eye-Tracking Study on the Effect of Different Signalized Intersection Typologies on Pedestrian Performance. Sustainability, 14(4), 2112. https://doi.org/10.3390/su14042112