1. Introduction
Walking is an easy, convenient, and no-cost physical activity and an environmentally friendly alternative to motorized transportation for every generation as well as an important component of both the active transportation and leisure domains [
1,
2,
3]. Many studies have shown that walking is the most common physical activity to prevent adult diseases and maintain health and psychological stability, as well as to enjoy leisure-time [
4,
5,
6,
7,
8]. Thus, a convenient environment for walking in streets or parks, residential areas in a city is required. Therefore, planning and designing walking-friendly neighborhoods have become important urban design goals in recent times. However, there are few studies on improving the walking conditions or built environment in a port area such as a ferry terminal.
A port city functions as both a port and a city. A seaport may help to improve the economy of the host port city. After all, the cargo flows passing through the seaport bring to the port city trade, information flow, passenger flow, financial flow, and many other value-added services [
9]. Especially, a ferry terminal located in the port area serves as a crucial intersection node between different modes of transport. Ports including ferry terminals add great value and have a significant influence on the regional and national economies. With changes in the existing ports, the spaces used to handle cargo are also changing into office, commercial, or eco-friendly spaces where people can work, rest, and enjoy. As the appearance of a port has evolved, people have gathered more, and walking activity has increased in the port area, including the ferry terminal.
Generally, a ferry terminal is located close to the city area for easiness of use to passengers and connects islands to the city in Korea. Islanders use ferries for hospital visits, shopping, or family visits [
7]. In Korea, the number of ferry passengers exceeded 14.5 million in 2019 [
8]. Additionally, cargoes and daily necessities are transported by ferry in vehicles for revitalizing island tourism and improving infrastructure to create convenient living conditions for the residents of islands. Accordingly, a ferry terminal is considered as a space that handles passengers and cargoes (vehicles) together. Furthermore, as the number of passengers increased, the passengers’ walkability became complex and diversified in the limited space of the ferry terminal.
The passengers of the ferry terminal include islanders, travelers, and visitors. Notably, among islanders, the percentage of older adults over 60 years is high. In the case of Sinan-gun, as an administrative district, the target area of this study was located near Mokpo city. As of September 2020, 39,582 people lived on the island, of which 14,203 people aged 65 or older accounted for 35.8% of the population [
9]. However, studies on the impact of built environment involving walking paths at ferry terminals on passengers’ physical behavior are insufficient.
Thus, in this study, we aim to measure the passengers’ walkability at ferry terminals. The first objective is to analyze the built environment of ferry terminals in terms of passengers’ walking. To measure the built environment, an audit survey tool was developed in this research. The second objective is to find the poor walkable section at ferry terminals, measuring passengers’ satisfaction by using importance–performance analysis of the audit survey results. This study was carried out in two ferry terminals located in the Mokpo city in Korea.
Section 2 studies the walking environment and characteristics, and the evaluation tools are examined.
Section 3 presents the methods applied, namely, the audit survey, importance–performance analysis, and statistical analysis, for measuring the satisfaction of the ferry terminal’s built environment. Finally,
Section 4 discusses the findings and the conclusions.
2. Literature Review
2.1. Built Environment and Related Characteristics
To measure the built environment of the transportation facilities in terms of walking, a field experiment was conducted using motion-sensing cameras capable of observing walking characteristics to verify the walking speed and behavior, in addition to the level of service (LOS) and graded density. The experiment was conducted at the Daerim metro station in Seoul. The transfer passage in the most crowded section was selected, and the density in an hour, walking speed, time, and behavior patterns were measured for one weekday [
10].
Additionally, research on pedestrian movement in commercial complexes regarding human–environment interaction was conducted. Particularly, the agent-based model was used for analyzing and predicting pedestrian movement considering spatial characteristics. Furthermore, to guide the tenant placement, the arrival time, and the amount of visual exposure of pedestrians were calculated [
11]. In the case of a public area such as urban parks, to analyze the relationship between pedestrian behavior and the physical environment, pedestrian behavior patterns were mapped for visualization using geospatial analytics. The behavior pattern of pedestrians at urban parks was classified into resting and moving behaviors [
12]. This study demonstrates the feasibility of using pedestrian behavior patterns in designing the layout and spatial arrangement of urban parks. However, this research was conducted not on the pedestrians’ walking behavior but participants’ activities, such as playing and other events, in the urban park.
At intersections, a study was also conducted to analyze the preference of pedestrians according to the structural environment of the street in order to investigate the relationship between the structure of the street and the pedestrians’ choice of the walking path. According to the analysis results, when it comes to road layout preferences, pedestrians preferred low-rise roads over high-rise roads. Additionally, pedestrians preferred the diagonal paths to the straight paths in a street layout [
13]. The analysis results of these studies show that pedestrians’ walking convenience and satisfaction are influenced by the layout of the streets.
2.2. Tools for Measuring Walking Environment
Kelly et al. [
14] developed an audit method, the Pedestrian Environment Data Scan (PEDS), to measure the consistency, reliability, and efficiency of the walking environments for pedestrians. They conducted the inter- and intra-rater reliability test of the proposed instrument with individual audit measures and various approaches to administering the audit. The PEDS provided a comprehensive method to evaluate pedestrian environments for transportation and physical activities and for practitioners to identify the investment priority. Items that can quantitatively measure pedestrians’ gait in residential areas were selected, and the indicators were constructed. The items to measure pedestrians’ walkability consisted of the street condition and the local environment for walking. This was used to analyze the physical environments that affected the pedestrian environment in residential areas.
The Active Neighborhood Checklist (ANC) was developed in order to measure the environmental elements affecting walkability in residential neighborhoods [
15]. In this assessment tool, the evaluation elements consisted of twenty environmental items, including the street environment (five elements), the network environment (six elements), and the regional environment (nine elements). This tool can be used to plan and design walkable residential neighborhoods.
Professional investigators measured the convenience of pedestrians to verify the effectiveness of the developed tool [
1]. However, as professional investigators, not pedestrians, conducted these surveys, there might be a gap between the evaluation and the actual perception of pedestrians. The online survey was designed to analyze the relationship between street conditions and pedestrian safety perception in Auburn, Alabama, USA. This online survey contributed to obtaining information about respondents’ brief personal characteristics, walking times of pedestrians, and the level of anxiety regarding certain street settings based on daytime and nighttime photographs (close-ended questions on a Likert scale from 1 to 5), and their reasoning behind these ratings (open-ended) [
16].
2.3. Ferry Service Environment
Waiting time has been a key component of travel time estimates for projects involving ferry services, such as frequency changes or ferry replacement projects. Andersen and Tørset [
17] analyzed the relationship between observed waiting time and service frequency, and the influence of the characteristics of ferry services on waiting time in Norway. Additionally, while using public transport, a woman’s safety perception was surveyed during waiting time at the ferry terminal in Auckland, New Zealand. The offshore islanders used public transport systems, including bus, train, and ferry services. Chowdhury and van Wee [
18] measured the safety perception of women transferring from public transport using a questionnaire tool and analyzed the descriptive statistics. Regarding the walkability and safety of the built environment in ferry terminals, there has been few studies despite the importance of ferry services to the local communities and the regional economy.
In general, a ferry terminal where passengers move to islands and cities for various purposes is surrounded by a complex pedestrian environment connecting to other transportation modes. The built environment of the ferry terminal may be more complicated because the ferry is used for general passenger cars and trucks with cargoes as well as passengers in Korea. In fact, accidents in which passengers collide with vehicles are occurring in some ferry terminals in Korea. However, based on this literature survey, few studies are researching the built environment of the ferry terminal in terms of passengers’ walkability, walking satisfaction, use of easiness, and safeness. Therefore, this study differs from previous studies. We investigate and evaluate the built environments and passengers’ walkability encountered in ferry terminals by surveying actual passengers in two ferry terminals located in Mokpo city.
3. Methods
3.1. Study Area
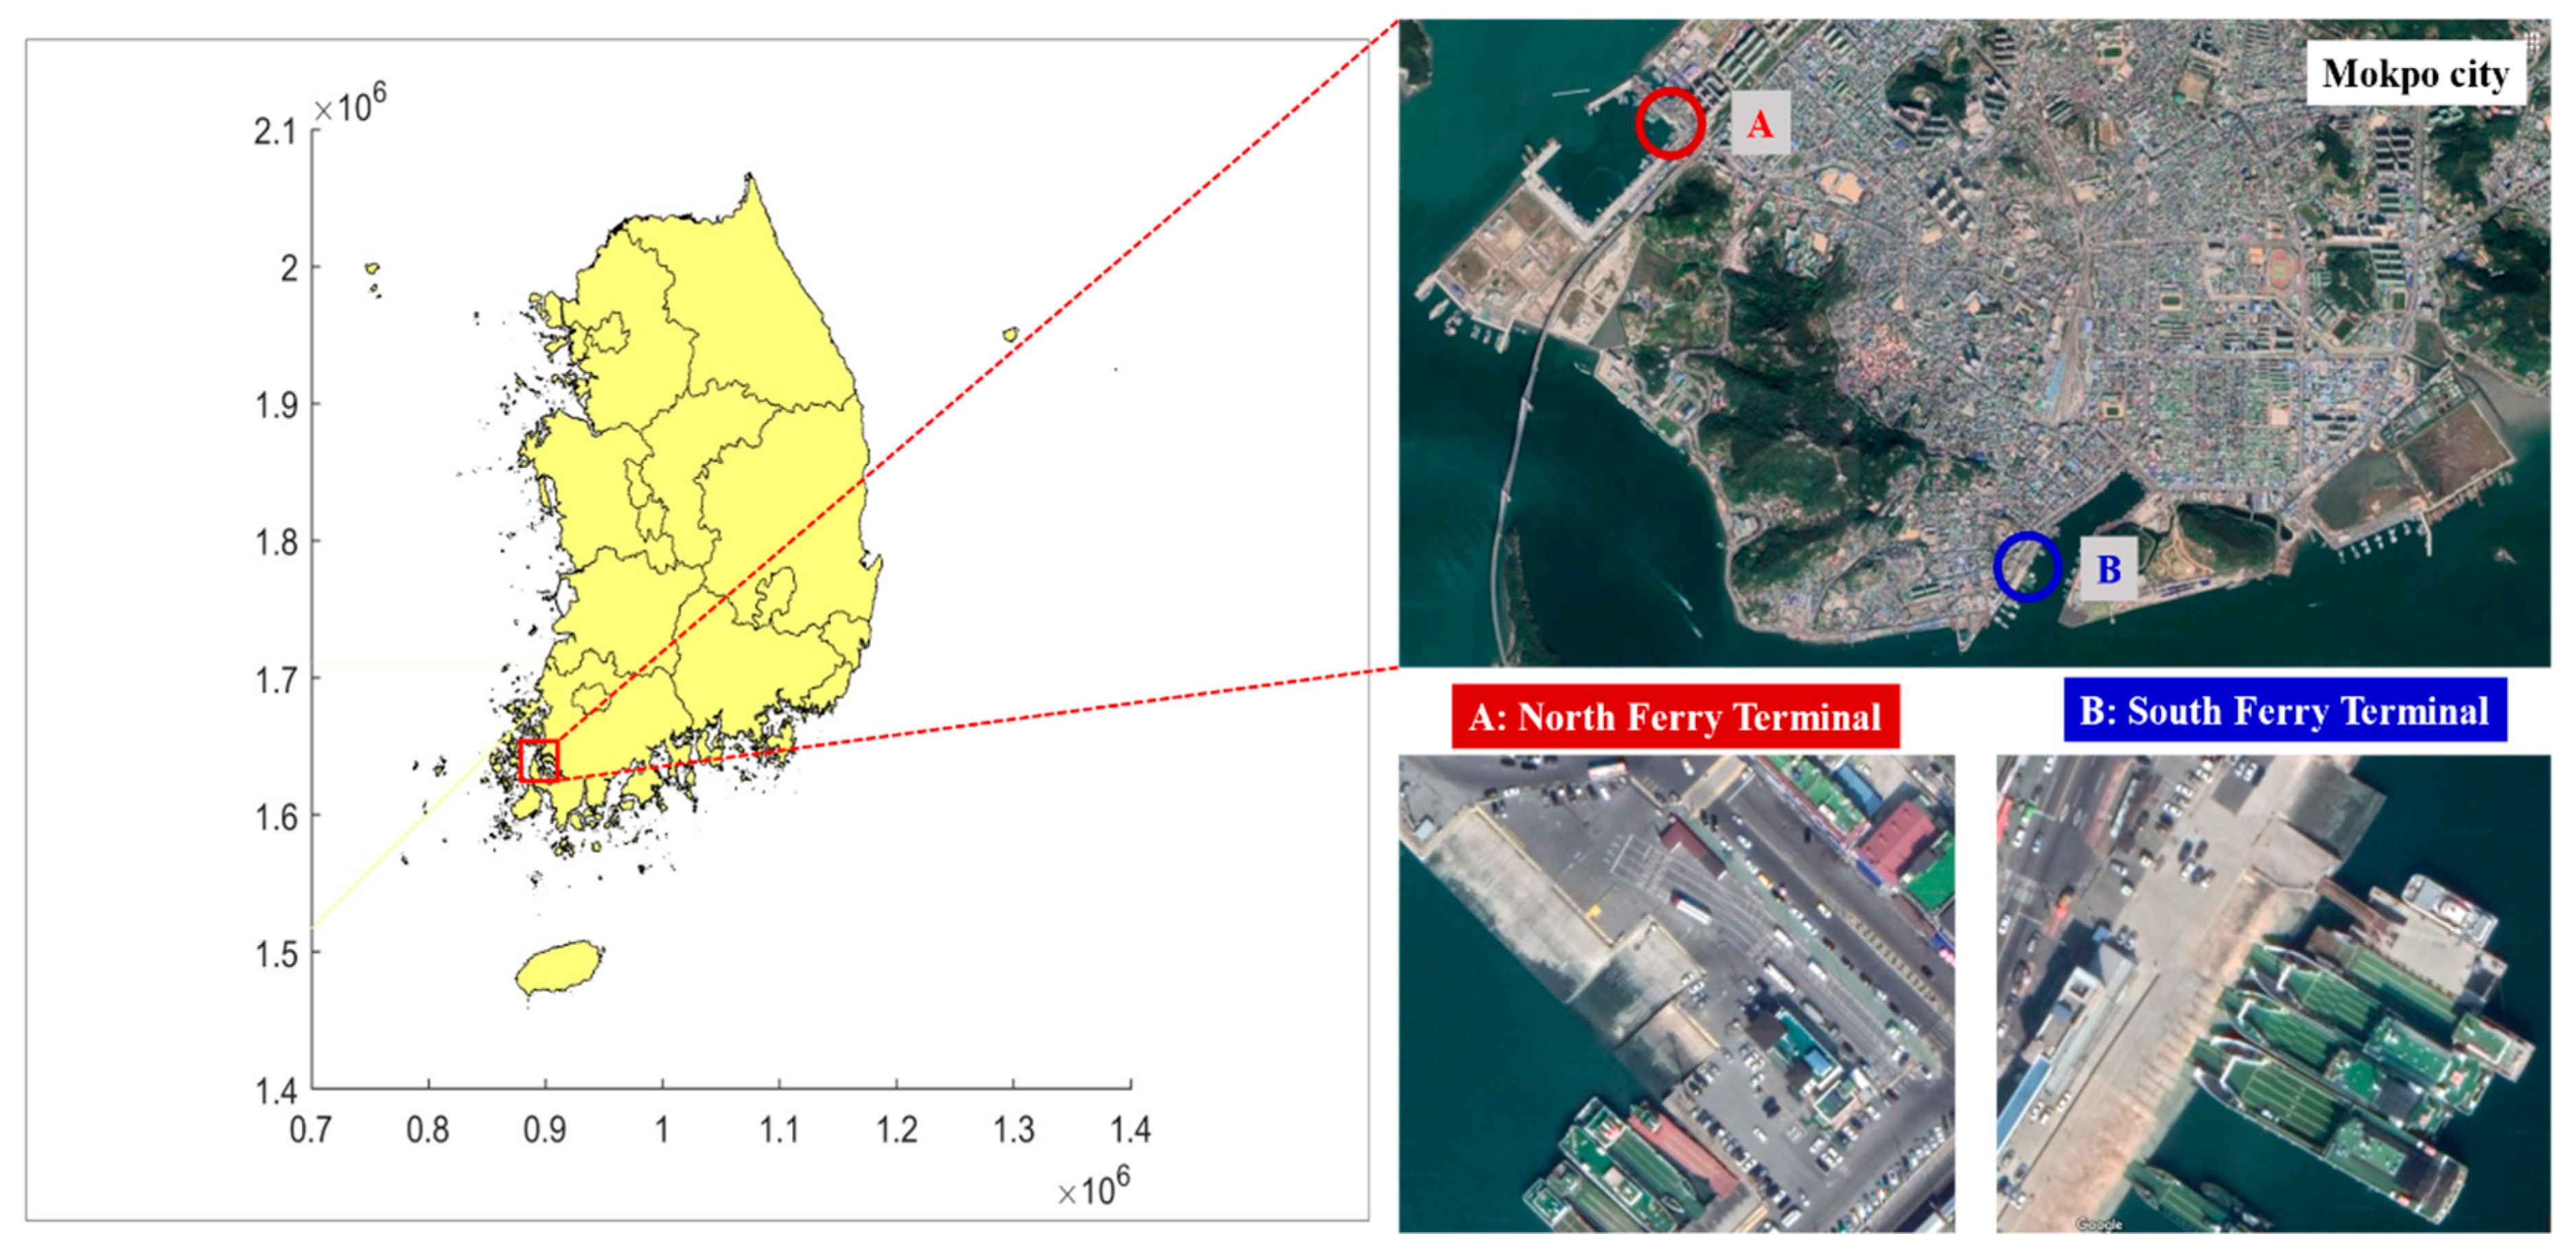
This study’s target location was Mokpo city, Korea, where a lot of ferry routes between the mainland and islands were operating. As of 2019, the number of passengers in Korea was 14.59 million, and the Mokpo region accounted for 38.3% of the total number of passengers—the largest number of passengers in the country [
8]. There are 25 ferry routes in the region with 22 ferry companies and 68 ferry ships to transport passengers, cars, and cargoes [
7,
19]. Therefore, in this study, two ferry terminals located in Mokpo city, south-west of Korea, the South and North Ferry Terminals, were targeted, as shown in
Figure 1.
3.2. Analysis of the Built Environment of the Ferry Terminals
We conducted a passengers’ walkability and walking satisfaction survey to evaluate the built environment, including walk path, in the ferry terminals located in Mokpo city, including its distance, width, surface condition, slope, signage, and signals for comfortable walking. Regarding walking, the importance and satisfaction of the built environment were investigated at two ferry terminals: North Ferry Terminal and South Ferry Terminal. As shown in
Table 1, an audit survey tool was developed to investigate the built environment from a passenger’s point of view.
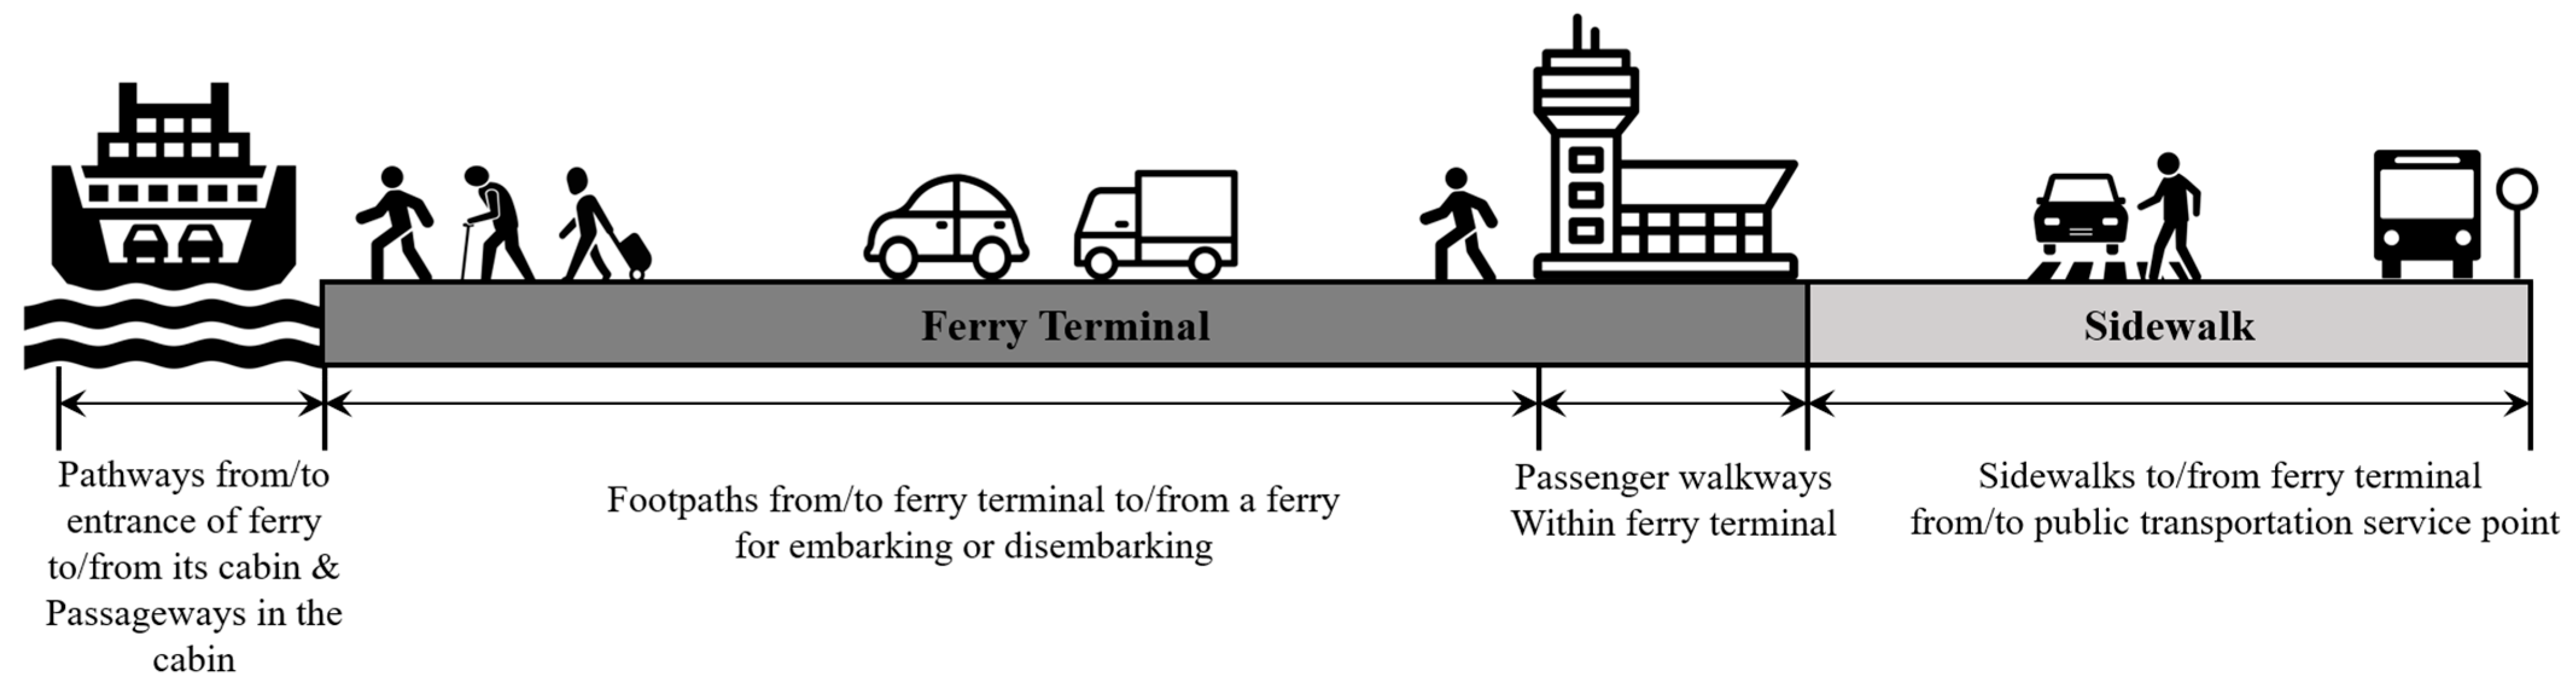
A passenger may take public transport to the ferry terminal and reach a ticket office via the sidewalk and the footpath inside the terminal for boarding tickets. After that, the passenger moves to the cabin through the designated passage on the ferry. When disembarking from the ferry, the passenger moves in the reverse order. The walking sections of the ferry terminal and ferry were identified to investigate the passengers’ walkability and walking satisfaction, as shown in
Figure 2. The walking path was divided into five walking segments: (1) sidewalks to the ferry terminal from a public transport service point; (2) passenger walkways within the ferry terminal; (3) footpaths from the ferry terminal to a ferry for embarking; (4) pathways from the entrance of the ferry to its cabin; and (5) passageways in the cabin. However, this research is focused on the first three segments mentioned above, from 1 to 3.
An audit survey tool, which was composed of twenty-three detailed items, was designed with a Likert scale of 1 to 5, as shown in
Table 1. This survey tool was developed by referring to the existing research literature on pedestrian walking environments and a brainstorming process by the research team [
15,
16,
20,
21,
22,
23,
24,
25]. It consisted of fifteen questions about walkways in the ferry terminal and eight questions about pathways inside the ferry. The survey tool was verified for reliability, and the measured values of Cronbach’s alpha were 0.7 or higher.
The survey was conducted at the South and North Ferry Terminals located in Mokpo city for three days on June 24th–26th in 2020, complying with the quarantine guidelines during COVID-19. Out of the 140 surveys, 138 responses were included in the study. We excluded two answer sheets as they had missing values.
3.3. Difference in Perception for the Built Environment
The purpose of this study is to analyze passenger satisfaction with the built environment of the ferry terminals. The passengers’ walkability and satisfaction were analyzed using the importance–performance (IP) maps approach which involves plotting the mean ratings for importance and performance on a two-dimensional grid to produce a four-quadrant matrix. This matrix identifies areas needing improvement as well as areas of effective performance [
26,
27]. In a counterclockwise direction, Quadrant I (High importance/High performance) is labeled “Keep up the good work”, and contains elements that are strengths to the organization, and calls for a maintenance posture [
26]. Quadrant II (Low importance/High performance), labeled as “Possible overkill”, contains elements that are insignificant strengths to the organization. If elements positioned in Quadrant III (Low importance/Low performance) do not represent a threat to the organization [
28], they may be candidates for discontinuation of resources and effort [
29]. Quadrant IV (High importance/Low performance) is labeled “Concentrate here”. Elements located in this quadrant represent key challenges that require immediate corrective action and should be given top priority [
26]. In this study, the analysis results were plotted by changing performance to satisfaction. Satisfaction with walking varied depending on the passenger’s age (younger or older) and the place of residence (Mokpo citizen, offshore islander, or nonresident). In this study, statistical analysis was conducted to find out the difference in passenger satisfaction by age and place of residence in walkways of the ferry terminals. We used analysis of variance (ANOVA) and
t-tests to determine if there were significant differences in passenger satisfaction.
4. Results
4.1. Passenger Satisfaction in the Built Environment
The result of the analysis of descriptive statistics reflecting the characteristics of survey respondents is shown in
Table 2. Questionnaire responses were received from 93 passengers from the South Ferry Terminal and 45 passengers from the North Ferry Terminal. The ratio of male respondents was 54.3% (75 persons) and that of the female was 45.7% (63 persons). Among the survey participants, 38.4% (53 persons) were Mokpo citizens, 29.7% (41 persons) offshore islanders, and 31.8% (44 persons) were visitors from other regions. Regarding the usage of the ferry, travel was the highest at 48.6% (67 persons), followed by visits to family and relatives at 32.6% (45 persons), hospital visits at 11.6%, and business trips at 7.2%. The percentage of ferry tickets purchased directly on-site was significantly high, at 81.9% (113 persons). Public transportation, such as buses or taxis, accounted for more than half (58.7%) of the transportation used to access the ferry terminal, and the number of passengers who used their car accounted for 39.1%. About the frequency of using the ferry services in Mokpo city, 50.7% of respondents used it less than three times, and 31.9% of respondents used it more than six times.
In this study, an importance–performance analysis (IPA) was applied to analyze the built environment using passengers’ walking satisfaction of two ferry terminals in Mokpo city. We conducted a satisfaction survey focused on the passengers’ walkways installed inside and outside of the terminals. IPA is a quantitative approach for measuring people’s feelings about certain characteristics of an issue or a thing [
30,
31]. IPA is beneficial because it generates a clear picture of how important certain elements are compared to the satisfaction they give to clients, customers, or services [
32,
33,
34]. The IPA results of the built environment of the ferry terminals are shown in
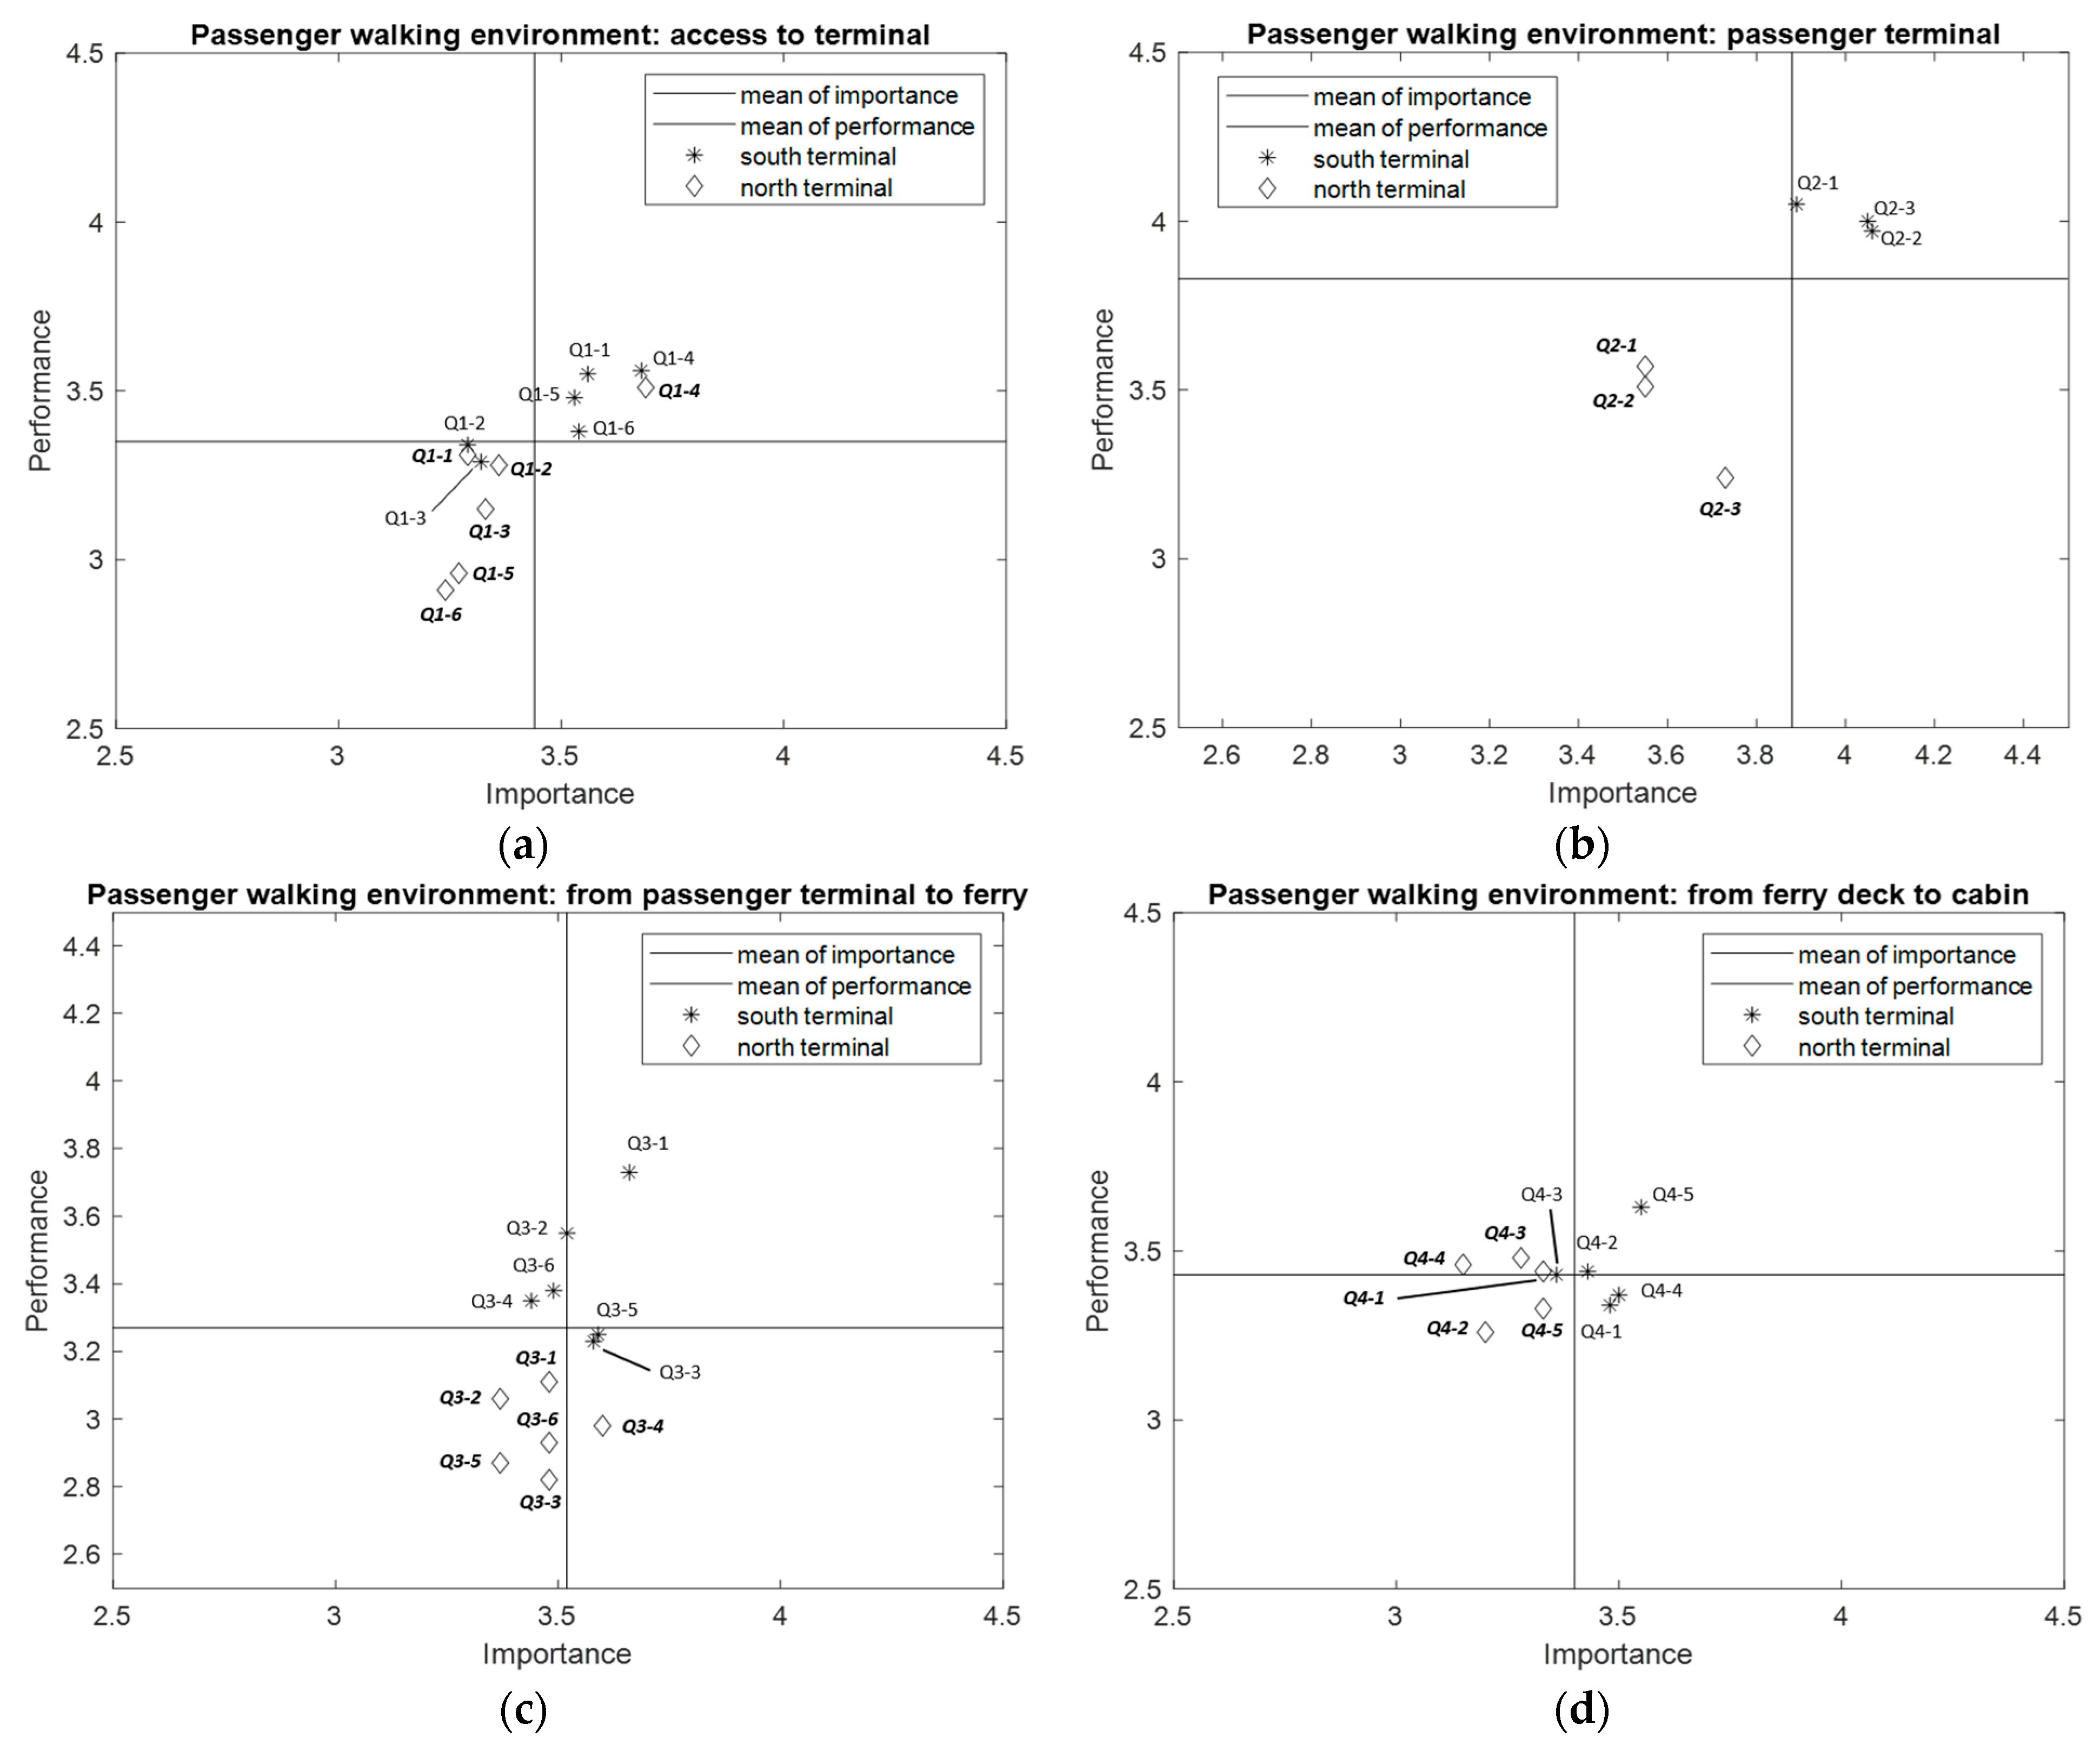
Figure 3.
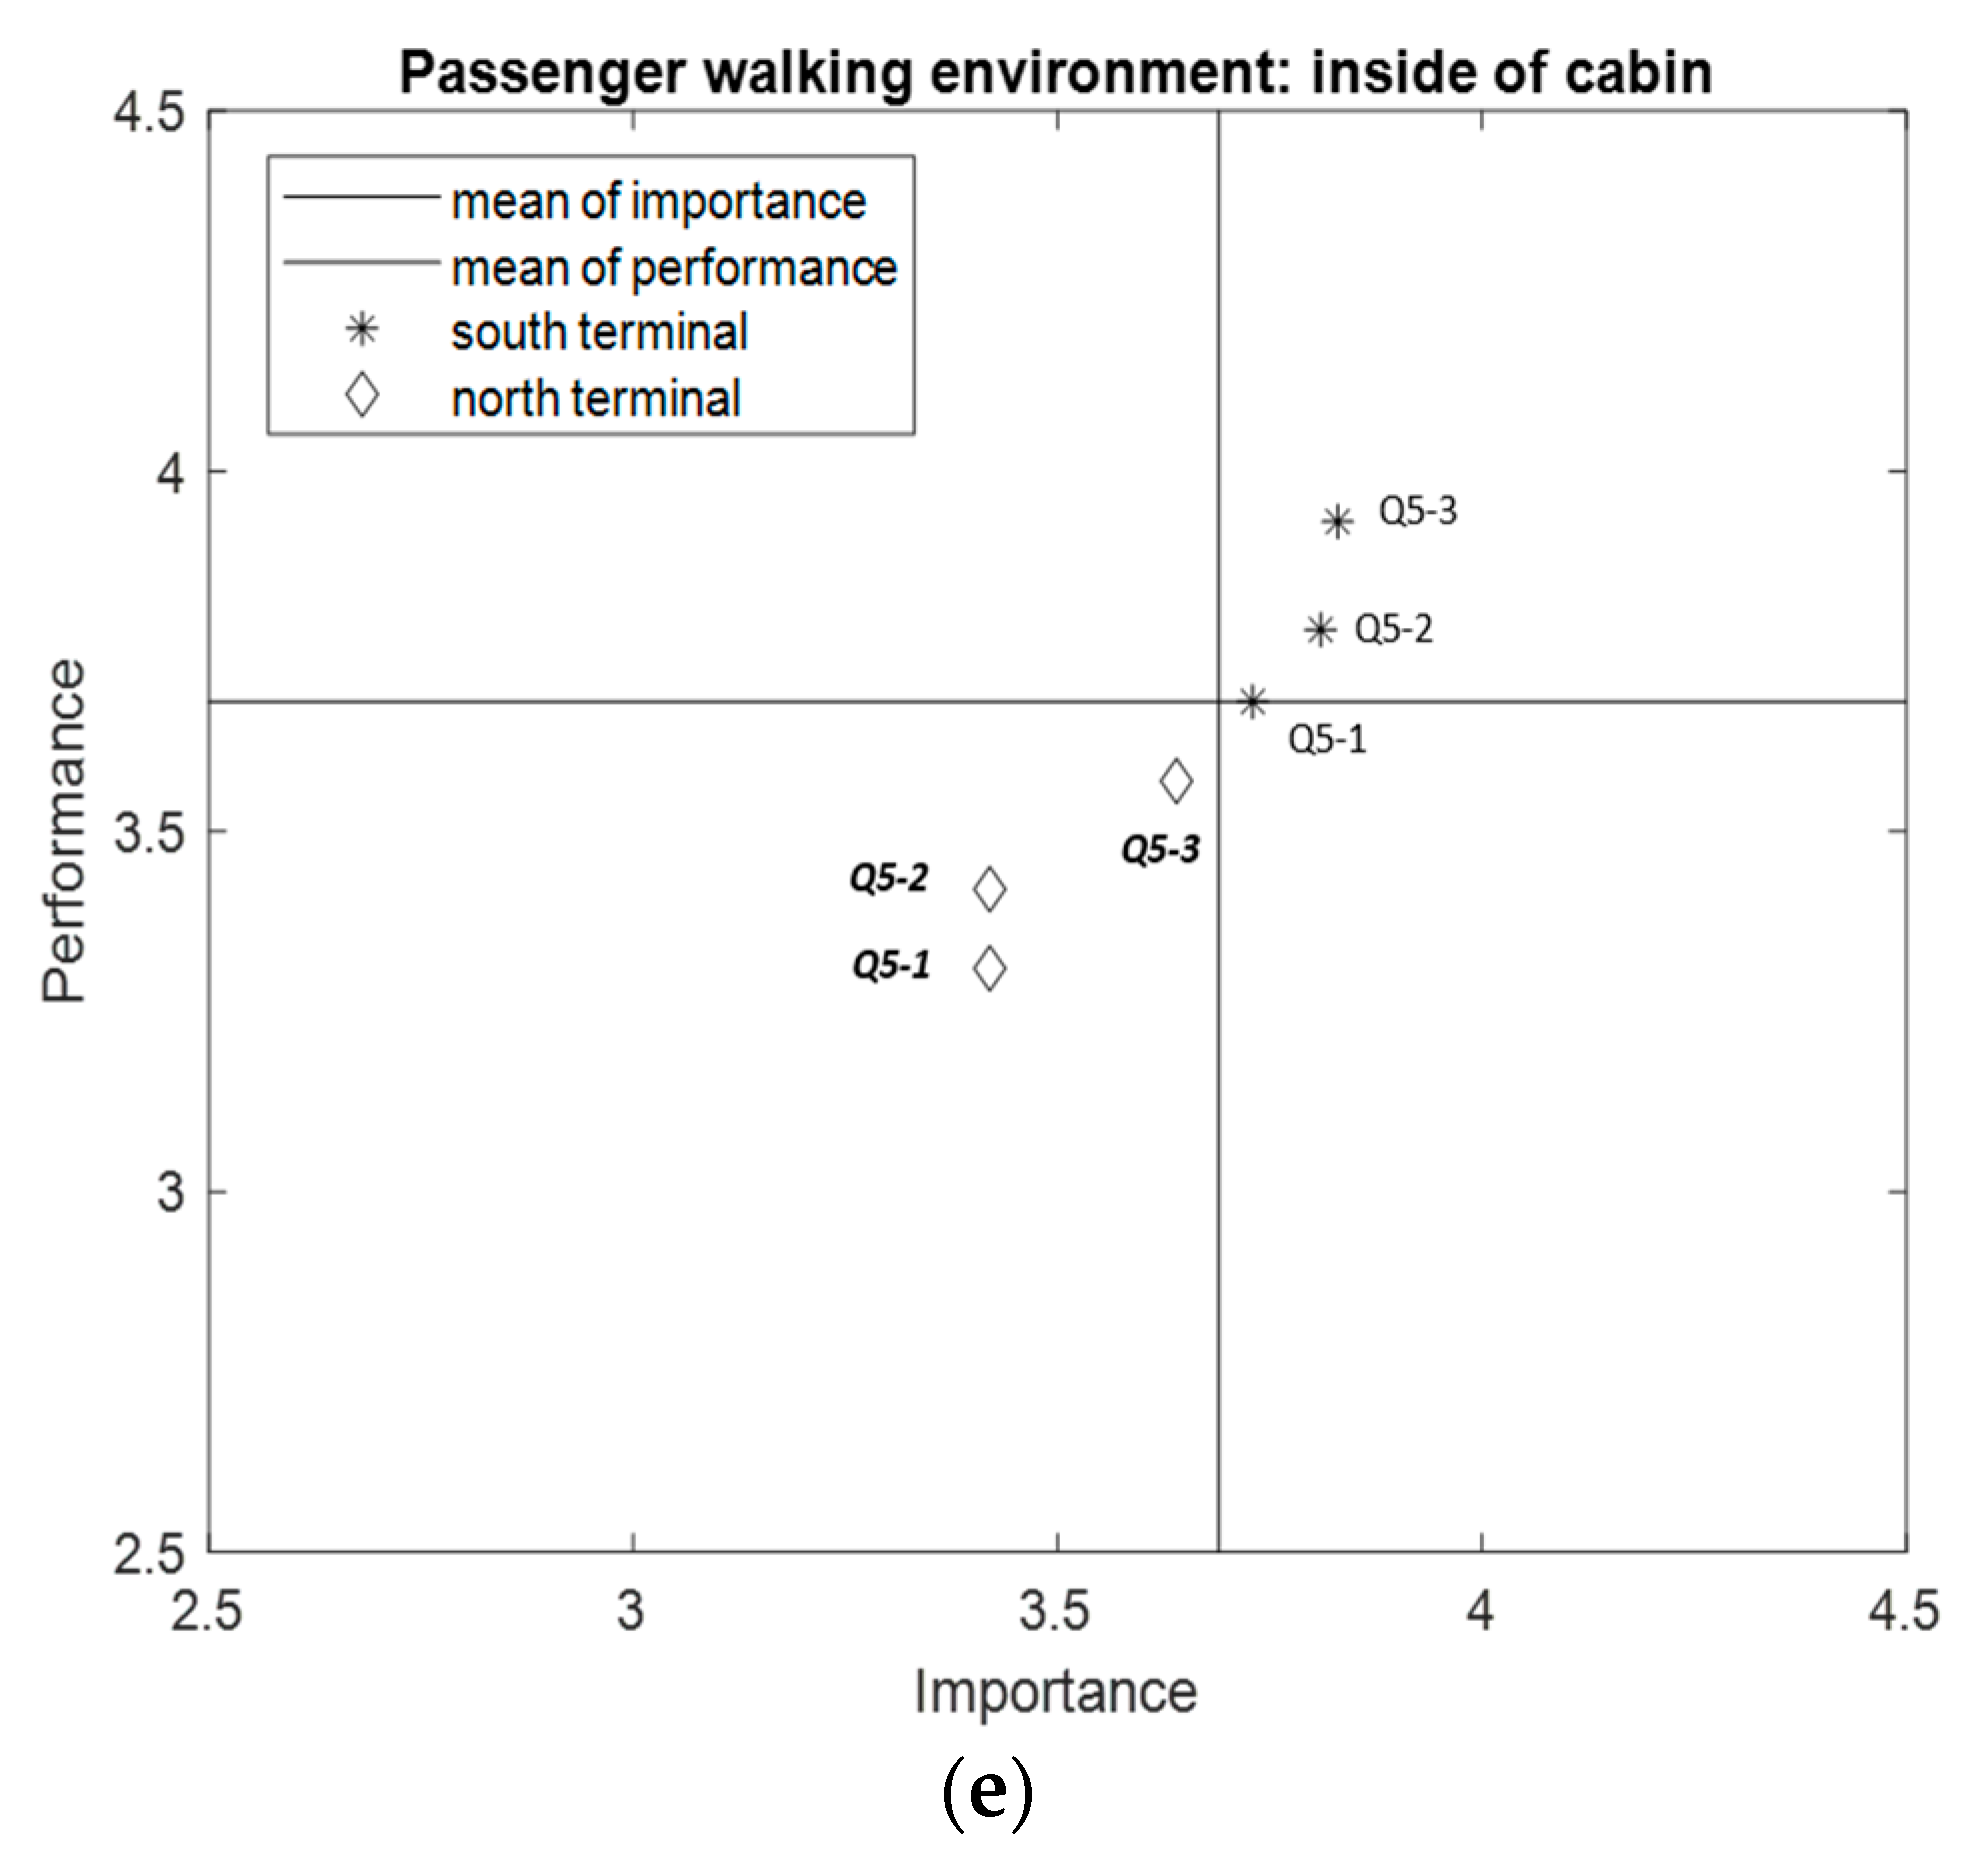
First, regarding the accessibility, the North Ferry Terminal’s importance and performance were lower than that of the South Ferry Terminal. In particular, the performance of the South Ferry Terminal was high concerning the connected sidewalks, maintenance of the sidewalks, the convenience of using public transportation, the convenience of crosswalks and signaling systems, and the convenience of walking with luggage. The South Ferry Terminal is located along the main boulevard, and there are many public transport services, such as buses and taxis, whereas the North Ferry Terminal requires a certain amount of time to walk to use a public transport service, reflected in the survey results. Second, the passengers’ walkability for purchasing tickets and using the ferry terminal facilities was investigated. The satisfaction rates of the South Ferry Terminal on the walkway to the ticket office and the terminal facilities were also highly scored (4.05 and 3.97, respectively). Those of the North Ferry Terminal were 3.50 and 3.24, respectively. The South Ferry Terminal is a concrete building, and it was comfortable for passengers to walk around inside the building. However, the North Ferry Terminal is a prefabricated building, and the internal space is narrow, making the satisfaction rate low. Third, the satisfaction with the footpaths from the ticket office to a ferry ramp for embarking was also high in the South Ferry Terminal. As shown in
Figure 3c, the satisfaction of the North Ferry Terminal for the passengers’ walking satisfaction was lower than the South Ferry Terminal in terms of the convenience of walking with luggage (Q3.3), the convenience of walking on the slope section of the ferry wharf (Q3.4), and the convenience of the distinction between passenger walking paths and vehicle access paths at the terminal (Q3.5). Fourth, when moving from the deck to the cabin after boarding the ferry in the South Ferry Terminal, the passenger satisfaction was low in the convenience of walking on the stair slope (Q4.1) and using the handrail (Q4.4). One of the reasons for this result is that the sea at the South Ferry Terminal is shallower than the North Ferry Terminal. Thus, small-sized ferries operate on various routes in the South Ferry Terminal. However, at the North Ferry Terminal, the sea is deeper. Thus, relatively large ferries with comfortable passenger walking paths in terms of width, surface condition, and slope operate on specific routes. Fifth, regarding passageways inside the ferry, those operating from the South Ferry Terminal showed higher satisfaction. The IPA results indicate a difference in satisfaction between the South and the North Ferry Terminals in some passenger walking segments. Additionally, a
t-test was conducted to examine the quantitative differences between the passenger walking satisfaction against the built environment of the two ferry terminals, as shown in
Table 3.
4.2. Difference of Perception
It was found that there were statistical differences concerning the accessibility between the South and North terminals in terms of satisfaction with the crosswalk, signal maintenance around the ferry terminal for comfortable walking (Q1.5), and the environment where people can walk conveniently with luggage (Q1.6). The South Ferry Terminal was found to be more convenient to walk. The analysis results also showed statistical differences between the passenger walkways within the South and North Ferry Terminals and the footpaths from the ticket office to the ferry’s adjustable ramp for boarding. At the North Ferry Terminal, passengers felt uncomfortable as the waiting area for boarding was located outside. Additionally, the footpaths from the ticket office to the adjustable ferry ramp were much longer than that of the South Ferry Terminal, and the low satisfaction level at the North Ferry Terminal also reflected the need to bypass or cross the vehicle waiting area. However, there was no statistical difference in the satisfaction of ferry pathways between the deck and the cabin. There were statistical differences in the built environment of ferries, such as the passageways to and from the restroom and convenience store inside of ferries.
To compare the difference in walking satisfaction by age and residential location, firstly, the passengers were divided into two groups based on their age: Group 1 (aged less than 60 years) and Group 2 (aged 60 years or over). Then, the differences in the satisfaction levels between the two groups were analyzed. The results indicated that the collected sample data followed the normality, and the variance was the same as the result of Levene’s test. The
t-test results in
Table 4 indicate no statistical difference between the age groups in the level of accessibility to the ferry terminal (Q1) and the satisfaction of walking within the ferry terminal (Q2). However, there was a meaningful difference between Group 1 and Group 2 in the walking satisfaction (Q3) from the ticket office to the ferry’s adjustable ramp. The significant statistical difference was judged that the conditions of the walking path such as surface condition, slope as well as the inconvenience of walking with luggage affect passengers’ walking satisfaction.
Offshore islanders use the ferry service to come to the city for reasons such as hospital treatment, shopping, or family visits. They frequently use the ferry as transportation. However, since Mokpo citizens and nonresidents of Mokpo city occasionally use the ferry terminal for travel or business trips, their satisfaction with the built environment may vary. Secondly, the residential areas of the passengers were divided into three groups—Group 1 (Mokpo citizen), Group 2 (offshore islander), and Group 3 (nonresident)—and we analyzed the statistical differences among the groups. The ANOVA test results confirmed that there was no meaningful difference in the passengers’ walking satisfaction levels about the built environment of the ferry terminal among the groups, as shown in
Table 5. However, there were statistically significant differences in the surface of the footpath from the ticket office to the ferry, the slope of the ferry wharf, and the adjustable ramp of the ferry. The satisfaction of nonresidents was higher than offshore islanders and Mokpo citizens for the walkways from the ticket office to the ferry.
Regarding the purpose of the ferry service, 75.5% (40 persons) of nonresidents used it for travel to islands. The in-depth interviews indicated that the joyful feeling of going on a trip offset the decline in the footpath satisfaction of Group 3. For the offshore islanders, 48.8% (20 persons) of Group 2 used the ferry service to visit families and relatives living in Mokpo city, and 39.0% (16 persons) took the ferry for hospital appointments. The percentages of Group 2 passengers taking the ferry for travel and business were low at 7.3% and 4.9%, respectively. It was observed that the offshore islanders were known to be relatively familiar with the uncomfortable built environment of the ferry terminal due to their frequent use of ferry services for visiting hospitals or family, or for shopping.
In this study, multiple comparisons were performed to determine the differences between groups, and a post-hoc test was conducted using Scheffe, Tukey, and Duncan methods, as in
Table 6. The results indicated that in the walking segment from the ferry terminal gate to the ferry (Q3.2), there was no significant difference in satisfaction between Group 1 and Group 2 as well as Group 2 and Group 3. However, there was a significant difference between Group 1 and Group 3. Regarding the pathway on the slope of the ferry wharf (Q3.4), there was no difference in satisfaction between Group 1 and Group 3. However, there was a noteworthy difference in satisfaction between Group 1 and Group 3 as well as Group 2 and Group 3. Considering the purpose of using the ferry terminal by Group 1, 24 passengers (45.3% of survey participants) were travelers, 23 persons (43.4%) were visiting family, and only 6 passengers (11.3%) were on business travel. It was found that 54.7% of passengers of Group 1 (29 persons) were not travelers. This group had prior experience of using ferries several times. Through this result, it was confirmed that the experience of using the ferry affects the passengers’ walking satisfaction. In other words, frequent ferry users showed high walking satisfaction with the built environment of the ferry terminal, while first-time ferry users showed low walking satisfaction. Hence, it was found that passengers who frequently use the ferry terminal do not perceive inconvenience even if it needs improvement.
There was no noticeable difference in satisfaction between Group 1 and Group 2 in the adjustable ferry ramp walking segment (Q3.6), although there was a difference in satisfaction between Group 1 and Group 3, and Group 2 and Group 3. It was confirmed that Group 1 and Group 2 showed the same walking satisfaction; however, Group 3 appeared to feel differently in terms of walking path satisfaction.
5. Discussion
The ferry terminal is a node that connects the city and the islands and is an important space used by islanders and travelers. Therefore, it is crucial to examine the comfortable use of, easiness, and safeness of passengers at the ferry terminal. This study targeted the Mokpo Ferry Terminal, which is visited by most passengers in Korea. The ferry terminal located in Mokpo city is divided into the South and North Ferry Terminals by ferry routes. There are markets and docks for fishing boats around the area, showing a typical complex walking environment for passengers. The friendliness of the built environment of the ferry terminal was evaluated by dividing the passengers’ walking path into five segments. An audit survey tool also was developed to measure the satisfaction of the passengers walking in the built environment of the ferry terminal. In order to prevent personal preferences, the purpose of the survey was fully explained to the respondents before the survey, and only those who wished for the survey were conducted.
Based on this evaluation tool, we analyzed the importance–performance of the built environment using the passenger’s walking path score. According to the analysis results, the overall satisfaction of the South Ferry Terminal was higher than that of the North Ferry Terminal. The t-test analysis showed meaningful differences in the satisfaction level between the built environment of two ferry terminals, such as crosswalks, sidewalks, passenger walking paths inside the ferry terminal, and the slope to board the ferry. The two terminals show fundamental differences in passenger waiting areas and accessibility. For example, in the North Ferry Terminal, it takes longer for passengers to access public transportation services, and the ticket office and the passenger waiting areas are in a prefabricated building. These points have influenced the satisfaction of the ferry terminal’s built environment. The satisfaction was also differentiated depending on the size of ferry, where the large ferries have wider indoor space and convenience than small ferries, but the walking satisfaction is lower than for small ferries because the walking distance is longer for passengers. Additionally, the difference in satisfaction of the built environment by age and residential location of the passengers was analyzed. The results indicated that satisfaction with the ferry embarking and disembarking process varied by age group.
Passengers younger than 60 showed low satisfaction with the built environment of the ferry terminal. In general, this age group has experienced the ferry as well as various transportation means, such as buses, trains, and airplanes, more frequently than other age groups. Thus, this group noticed that the built environment in terms of use of easiness, safeness, and pleasantness of the ferry terminal was relatively unsatisfactory compared to other transportations. Many of the offshore islanders are elderly, and they seem to have become accustomed to the inconvenience because they use ferry frequently. In the group from local residential locations, there were differences in the satisfaction level in the built environment, such as the path surface, slope section, and ferry’s adjustable ramp section. The island residents’ satisfaction with the built environment was considerably lower than that of other groups. Hence, the walking path with low satisfaction needs to improve for offshore islanders and older passengers.
6. Conclusions
A considerable amount of walkability research has been examining the pedestrian environment and characteristics of various spaces such as roads, residential areas, university districts, and city parks. However, no attention has been given to studying the complex of the passenger walking in a port area where people, vehicles, and cargo interact. Thus, this study focused on the built environment of a ferry terminal located in a port area. As the ferry terminal is a space used by both passengers and vehicles, it is necessary to understand passenger’s satisfaction with the built environment and allow them to use the facility safely and comfortably. From this point of view, it is meaningful to evaluate the built environment focusing on passengers’ perception using walkability while using the ferry terminal.
The main findings of this study are as follows: (1) it confirmed that the built environment of the ferry terminal, including the size and layout, and the operation method affected the passengers’ perception, such as the use of easiness, safeness, and pleasantness. The passengers’ walking satisfaction level was different depending on the length of the walking path, surface condition, and slope. (2) When embarking and disembarking the ferry, the built environment of the ferry terminal showed a difference in passengers’ satisfaction according to the age and residential location of the passenger. The passengers’ walking satisfaction was low among passengers younger than the 60s who frequently used other transportation, and most of the elders are living at the offshore island and familiarized the inconvenience of the built environment for walking. It was found that passengers’ walking satisfaction was low on long pedestrian paths, roads obscured by vehicles, sloped sections, and adjustable ramp sections of the ferry.
Despite the significant research results, the limitations of this research are as follows: the case study was conducted only in the Mokpo region due to the impact of COVID-19, and the sample survey was also conducted in a short period. In addition, further studies are needed on the generalization of passengers’ walkability in ferry terminals.
This study can be used as an evaluation standard and basic data for measuring as well as improving the built environment of the ferry terminal. In particular, the evaluation tool and analysis method proposed in this study can measure the walkability and satisfaction of various passengers, such as elderly islanders and young travelers. Hence, it will be possible to prepare a convenient built environment with high walkability for passengers by analyzing the regional and seasonal characteristics of the ferry terminal. Especially, it is helpful for ferry companies, local governments, and governments to build a ferry terminal with special emphasis on passenger safety and comfort. In addition, passenger convenience will increase through generalization and standardization of the built environment of the ferry terminal. From an economic point of view, the improvement of walkability at the ferry terminal and ferry will lead to an increase in ferry users, contributing to the economic revitalization of the island as well as the neighboring port area.
Author Contributions
Conceptualization, H.K.; methodology, H.K., Y.N., J.-H.Y. and J.C.; validation, H.K.; formal analysis, H.K., Y.N., J.C. and J.-H.Y.; investigation, H.K.; resources, H.K. and J.C.; software, H.K.; data curation, H.K.; writing—original draft preparation, H.K.; writing—review and editing, H.K., J.-H.Y., Y.N. and J.C.; visualization, H.K.; supervision, J.-H.Y.; project administration, H.K.; funding acquisition, H.K. All authors have read and agreed to the published version of the manuscript.
Funding
This work was supported by the National Research Foundation of Korea (NRF) grant funded by the Korean government (MSIT) (No.2019R1F1A1059037).
Institutional Review Board Statement
The study was conducted in accordance with the Declaration of Helsinki, and approved by the Institutional Review Board of Mokpo National Maritime University (protocol code 2022-01-001, approved 17 January 2022).
Informed Consent Statement
Informed consent was obtained from all subjects involved in the study.
Data Availability Statement
The data presented in this study are available on request from the corresponding author. The data are not publicly available due to involving personal information.
Acknowledgments
The authors are grateful to the editor and reviewers for their careful and valuable suggestions. This study was conducted during the overseas research year for the first author (Hwayoung Kim) in 2020 at the University of Nebraska Omaha in the United States of America, supported by Mokpo National Maritime University, and the National Research Foundation of Korea.
Conflicts of Interest
The authors declare no conflict of interest.
References
- Hoehner, C.M.; Ivy, A.; Brennan Ramirez, L.K.; Handy, S.; Brownson, R.C. Active neighborhood checklist: A user-friendly and reliable tool for assessing activity friendliness. Am. J. Health Promot. 2007, 21, 534–537. [Google Scholar] [CrossRef] [PubMed]
- Sallis, J.F.; Frank, L.D.; Saelens, B.E.; Kraft, M.K. Active transportation and physical activity: Opportunities for collaboration on transportation and public health research. Transp. Res. Part A 2004, 38, 249–268. [Google Scholar] [CrossRef]
- Millward, H.; Spinney, J.; Scott, D. Active-transport walking behavior: Destinations, durations, distances. J. Transp. Geogr. 2013, 28, 101–110. [Google Scholar] [CrossRef]
- Gilmour, H. Physically active Canadians. Health Rep./Stat. Can. Can. Cent. Health Inf. 2007, 18, 45–65. [Google Scholar]
- Pucher, J.; Dijkstra, L. Promoting Safe Walking and Cycling to Improve Public Health: Lessons From T...: EBSCOhost. Am. J. Public Health 2003, 93, 1509–1517. [Google Scholar] [CrossRef]
- Rafferty, A.P.; Reeves, M.J.; McGee, H.B.; Pivarnik, J.M. Physical activity patterns among walkers and compliance with public health recommendations. Med. Sci. Sports Exerc. 2002, 34, 1255–1261. [Google Scholar] [CrossRef]
- Risova, K. Questioning gender stereotypes: A case study of adolescents walking activity space in a small Central European city. J. Transp. Geogr. 2022, 91, 102970. [Google Scholar] [CrossRef]
- Tennøy, A.; Knapskog, M.; Wolday, F. Walking distances to public transport in smaller and larger Norwegian cities. Transp. Res. Part D 2022, 103, 103169. [Google Scholar] [CrossRef]
- Pham, T.Q.M.; Lee, G.; Kim, H. Toward sustainable ferry routes in korea: Analysis of operational efficiency considering passenger mobility burdens. Sustainability 2020, 12, 8819. [Google Scholar] [CrossRef]
- Korea Shipping Association (KSA). Statistics Year book of Coastal Shipping; Korea Shipping Association (KSA): Seoul, Korea, 2020. [Google Scholar]
- Korean Statistical Information Service (KOSIS). Korean Statistics Information Service; Korean Statistical Information Service (KOSIS); Available online: https://kosis.kr (accessed on 7 January 2022).
- Shin, M.; Hur, J.; Kim, H.; Moon, Y.; Kim, J.; Lee, N.; Korean, T.; For, S.; Information, C. The Characteristics of Pedestrians LOS by Motion Analysis Method of the Metro Transfer Passage. Proceeding Korean Soc. Railw. 2016, 1, 1617–1622. [Google Scholar]
- Park, J.; Lee, H. An Analysis of Pedestrian Visual Movement of Mixed-use Commercial Complexs Using an Agent-based Model. J. Korean Inst. Inter. Des. 2020, 29, 114–123. [Google Scholar] [CrossRef]
- Kim, H.; Jung, S. An Analysis of the Behavior Pattern of User for Open Space in the Urban Park -Focused on the Seoul Forest-. J. Archit. Inst. Korea Plan. Des. 2010, 26, 37–44. [Google Scholar]
- Song, J.Y.; Lee, S.Y.; Park, J.A. A Study on Structure Environment of Streets and Preference of Pedestrians. J. Urban Des. Inst. Korea Urban Des. 2014, 15, 151–161. [Google Scholar]
- Kelly, J.C.; Andrea, D.L.S.; Daniel, R. The development and testing of an audit for the pedestrian environment. Landsc. Urban Plan. 2007, 80, 95–110. [Google Scholar] [CrossRef]
- Park, S.; Choi, Y.; Seo, H. Measuring Walkability in Urban Residential Neighborhoods: Development of Walkability Indicators, Seoul, Korea. J. Archit. Inst. Korea Plan. Des. 2008, 24, 161–172. [Google Scholar]
- Park, Y.; Garcia, M. Pedestrian safety perception and urban street settings. Int. J. Sustain. Transp. 2020, 14, 860–871. [Google Scholar] [CrossRef]
- Andersen, S.N.; Tørset, T. Waiting time for ferry services: Empirical evidence from norway. Case Stud. Transp. Policy 2019, 7, 667–676. [Google Scholar] [CrossRef]
- Moon, Y.; Kim, D.; Han, J.; Kang, J. A study of improvement on pedestrian level of service by pedestrian satisfaction -Focused on lower floor building in Seoul. J. Korean Soc. Civ. Eng. 2018, 38, 979–990. [Google Scholar]
- Krambeck, H. The global walkability index: Talk the walk and walk the talk. Master’s Thesis, Massachusetts Institute of Technology, Cambridge, MA, USA, 2006. [Google Scholar]
- Seo, M.J.; Kang, S.J. An Analysis on Research Trends of Pedestrian Environment in the Street around the University Town. Proc. Archit. Inst. Korea 2020, 1, 67–70. [Google Scholar]
- Cauwenberg, J.V.; Holle, V.V.; Simons, D.; Deridder, R.; Clarys, P.; Goubert, L.; Nasar, J.; Salmon, J.; Bourdeaudhuij, I.D.; Deforche, B. Environmental factors influencing older adults’ walking for transportation: A study using walk-along interview. Int. J. Behav. Nutr. Phys. Act. 2012, 9, 2–11. [Google Scholar] [CrossRef] [Green Version]
- Handy, S.; Cao, X.; Mokhtarian, P.L. Self-selection in the relationship between the built environment and walking: Empirical evidence from Northen California. J. Am. Plan. Assoc. 2006, 71, 55–74. [Google Scholar] [CrossRef]
- Dyck, D.V.; Veitch, J.; Bourdeaudhuij, I.D.; Thornton, L.; Ball, K. Environmental perceptions as mediators of the relationship between the objective built environment and walking among socio-economically disadvantaged women. Int. J. Behav. Nutr. Phys. Act. 2013, 10, 1–9. [Google Scholar]
- Graf, L.A.; Hemmasi, M.; Nielsen, W. Importance-Satisfaction analysis: A diagnostic tool for organizational change. Leadersh. Organ. Dev. J. 1992, 13, 8–12. [Google Scholar] [CrossRef]
- Skok, W.; Kophamel, A.; Richardson, I. Diagnosing information system success: Importance-Performance maps in the health club industry. Inf. Manag. 2001, 38, 409–419. [Google Scholar] [CrossRef]
- Barsky, B.J.; Labagh, R. A strategy for customer satisfaction. Cornell Hotel. Restaur. Adm. Q. 1992, 33, 32–39. [Google Scholar] [CrossRef]
- Crompton, J.L.; Duray, N.A. An investigation of the relative efficacy of four alternative approaches to importance-performance analysis. J. Acad. Mark. Sci. 1985, 13, 69–80. [Google Scholar] [CrossRef]
- Chowdhury, S.; van Wee, B. Examining women’s perception of safety during waiting times at public transport terminals. Transp. Policy 2020, 94, 102–108. [Google Scholar] [CrossRef]
- Kim, J.; Lee, G.; Kim, H. Analysis of operational efficiency considering safety factors as an undesirable output for coastal ferry operators in Korea. J. Mar. Sci. Eng. 2020, 8, 1. [Google Scholar] [CrossRef]
- Oh, H. Revisiting Importance—Performance Analysis. Tour. Manag. 2001, 22, 617–627. [Google Scholar] [CrossRef]
- Warner, L.A.; Kumar, A.; Lamm, A.J. Using importance-performance analysis to guide extension needs assessment. J. Ext. 2016, 54, 21. [Google Scholar]
- Levenburg, N.M.; Magal, S.R. Applying Importance-Performance Analysis to Evaluate E-Business Strategies among Small Firms. E-Serv. J. 2004, 3, 29. [Google Scholar] [CrossRef]
| Publisher’s Note: MDPI stays neutral with regard to jurisdictional claims in published maps and institutional affiliations. |
© 2022 by the authors. Licensee MDPI, Basel, Switzerland. This article is an open access article distributed under the terms and conditions of the Creative Commons Attribution (CC BY) license (https://creativecommons.org/licenses/by/4.0/).


