Article

Spatio-Temporal Assessment of Biomass Self-Sufficiency in the European Union

by
Vlada Vitunskienė
1,*,
Akvilė Aleksandravičienė
1 and
Neringa Ramanauskė
2
1
Faculty of Bioeconomy Development, Vytautas Magnus University, LT-44248 Kaunas, Lithuania
2
Faculty of Economics and Business Administration, Vilnius University, LT-01513 Vilnius, Lithuania
*
Author to whom correspondence should be addressed.
Sustainability 2022, 14(3), 1897; https://doi.org/10.3390/su14031897
Submission received: 30 December 2021 / Revised: 31 January 2022 / Accepted: 2 February 2022 / Published: 7 February 2022
(This article belongs to the Special Issue Sustainable Circular Bioeconomy)

Abstract

:
Growing concerns over ecosystem degradation, climate change, loss in biodiversity, and rapid depletion of natural resources have urged societies of the developed countries all over the world to encounter the challenge of shifting from fossil-based to bio-based economies. With European Green Deal priorities on a transition to a climate-neutral economy with net-zero GHGs emissions by 2050, projected demand for biomass is 40–100% higher, relative to its supply. To provide an overview on the capacity of the European Union countries to satisfy its demand for biomass through the organic materials extracted directly from the domestic natural environment, the study aimed to assess the biomass self-sufficiency based on its domestic extraction-domestic consumption balance. Both the spatial and temporal variability of the self-sufficiency ratio are used to characterise the stability of capacity to satisfy our own needs for biomass in the EU economy as a whole, and at the level of individual member states. The findings indicate that the differences in biomass self-sufficiency ratios are quite high among the European Union member countries (i.e., in the range of 15% in Malta and 33% in Cyprus; up to 184% in Estonia and 224% in Latvia (on average in 2016–2018)). GMM analysis (EU-28, 2000–2018 period) is provided in this study to define the main statistically significant factors that have an impact on the biomass self-sufficiency ratio. This study contributes to the debate on the issues of biomass self-sufficiency in the context of ecological constraint and the EU’s Green Deal.

1. Introduction

Long-term projections by United Nations [1], OECD [2], and European Commission [3] suggest that the current trends of the increasing global population, as well as economic growth and development, will have serious impacts on natural resources and the ecosystem, unless policy changes deviate the current path of development. As McCormick and Kautto [4] state, current societal and environmental changes should be responded inter alia by redirecting the economy from the use of fossil fuels to biomass. The biotic value chain provides a means to tackle global challenges by replacing fossil-based raw materials with sustainable, renewable raw materials [5]. Thus, the bio-based economy has the potential to reduce dependence on non-renewable and unsustainable resources, whether sourced domestically or from abroad, mitigating and adapting to climate change, ensuring food security, strengthening European competitiveness, and creating jobs [6].
Tackling the issues as well as seeking balance between economic growth and environmental degradation has become a strategically important part of the political agenda of the EU and its member countries, since the beginning of this decade [7]. The European Commission has set a long-term target for creating a competitive, resource-efficient, and low-carbon economy by 2050, the bioeconomy being an important element of it [8]. The launched and adopted Europe’s Bioeconomy Strategy in 2012 [9], followed by the update of the Bioeconomy Strategy in 2018 [6], has set the strategic approach to deployment of a sustainable European bioeconomy, to maximise its contribution towards the 2030 Agenda and its Sustainable Development Goals (SDGs) as well as the Paris Agreement. The Bioeconomy Strategy update proposes an action plan, which, inter alia, prioritises strengthening and scaling up the bio-based sectors, and unlocking investments and markets. Furthermore, other European policy priorities, in particular the Vision of the European industry in 2030 [10], the Circular Economy Action Plan [11], and the Communication on Accelerating Clean Energy Innovation [12], emphasise the importance of sustainably sourced and advanced renewable biomass materials to achieve their objectives. The EU bioeconomy already constitutes an important part of the European Union economy [13]. With European Green Deal priorities on a transition to net-zero greenhouse gas emissions by 2050, and the rapidly changing EU economy, the future of biomass use across the EU economy “looks to differ profoundly from what was imagined even three or four years ago”, as stated in the latest study on the EU biomass use in a net-zero economy [14] (p. 3). The EU climate scenarios foresee a 70–80% increase in biomass use (ibid).
The transition of progressive European and world countries from fossil-based to bio-based economy fosters increasing demand for biomass within both domestic and global markets. According to OECD [15] projections, global demand for biomass in the baseline projection scenario will increase by 72% by 2060. Meanwhile, fossil fuel consumption will increase by 47% during the same period. This means that some of the fossil fuels will be replaced by biomass. Growth in biomass consumption is expected to be slower in OECD countries; it is expected to increase by 48% over the same period. The demand for biomass in emerging and developing countries will increase the most, by 136%. The biggest share of the extracted biomass globally is used as food for humans and feed for livestock, followed as raw materials for bio-based industries and bioenergy [16]. According to Carus and Dammer [17], feed predominates with a share of 60, food with 32, and energy use with 4% of the total biomass produced globally. Biomass for energy use, according to OECD [15], will increase by 1.5 times in OECD and by 2.4 times in the rest of the world by 2060. Globally, the use of biomass for energy will increase by 68%, whilst the use of fossil fuels will rise by 60%. Other uses of biomass are also becoming increasingly popular, though in many cases the growth of output is rather slow due to complex, inefficient, and costly manufacturing processes and decreasing economic viability of the products [18,19,20]. Ramos et al. [18] claim that there is a slight bias towards the development of bioproducts, such as bioplastics, a range of acids, surfactant resins, and biochemicals in Europe, whilst in North America, there is a clear tendency to produce biofuels. Moorkens et al. [21] observe that biopharmaceutical medicines represent a growing share of the global pharmaceutical market. Dos Santos et al. [22] find that biopharmaceuticals represent one-quarter of all pharmaceutical sales and provide suitable and efficient medical care for many previously untreatable diseases.
The aim of this study is to assess biomass self-sufficiency across the European Union member states. To achieve this, the self-sufficiency and import dependence ratios were applied using material flow data on the overall biomass, and separate types of biomass from economy-wide material flow accounts (EW-MFA). The analysis of spatial-temporal data was used to identify the long-lasting trend in terms of biomass self-sufficiency and import dependence across the target countries. We analyse previous trends of biomass self-sufficiency in the European Union, based on the domestic extraction-domestic consumption balance, both for the EU as a whole and for the individual member states (by the composition of the EU until 31 January 2020). Both spatial and temporal variability in the self-sufficiency is used to characterise the stability of capacity to satisfy our own requirements for biomass materials in the EU as a whole, and at the individual member state level. Moreover, a panel data analysis using GMM-SYS was performed to find the factors that have a statistically significant effect on the ratio of biomass self-sufficiency. The term biomass is used in correspondence to classification of biomass as a renewable material in the EW-MFA. In this regard, biomass is understood as the primary biological material derived from the natural environment and used in the economy.

2. Methodology

2.1. The Measure of Self-Sufficiency in Biomass

National self-sufficiency, according to Smith [23], is only a relative term, as in essence it refers to the balance between varieties of the constantly changing demand and adequacy of supply, which can never be in perfect equilibrium. A change in the actual equilibrium may lead to imports of a product, which has previously been exported. For a long time, self-sufficiency studies have been directed mainly at final products [24] and most research and discussion world-wide focused on food self-sufficiency [25].
However, the concept of self-sufficiency increasingly focuses on the issue of input self-sufficiency. For instance, Spero [26] examined the self-sufficiency in energy supply in the context of American national security policy as early as 1973. Recently, the concept of energy self-sufficiency is increasingly explored in scientific literature (e.g., country-level studies are performed by Welfle et al. [27], Saghir et al. [28], and Benti et al. [29]).
The paradigm of water self-sufficiency is increasingly being investigated by scientists; for example, Fragkou et al. [30] analysed the water self-sufficiency potential at the city-level in Mediterranean region, and Sarabi and Rahnama [31] performed a city level study of the potential for energy and self-sufficient water provision in Iran. Additionally, the paradigm of input self-sufficiency becomes increasingly used by researchers for conceptualising and analysing sustainable farming systems. Quite a few studies focus on relationships between input self-sufficiency (such as bioenergy, fodder, nutrients, and seed) and the sustainability or resilience of farms (e.g., Østergård, Markussen [32], Martin, Magne [33], Lebacq et al. [34], Soteriades et al. [35], Gaudino et al. [36], Jouan et al. [37], Masi et al. [38], and Kimming et al. [39]).
The analysis of a biomass-based, energy self-sufficient system for organic farms performed by Kimming et al. [39] focuses on energy balance, resource use, and greenhouse gas emissions. Vijay et al. [40] conducted a regional level study of biomass availability and the potential of energy self-sufficiency in rural areas. A similar study was conducted by Algieri et al. [41] in the southernmost region of the Italian peninsula in the Calabria region. Terrapon-Pfaff [42] assessed renewable energy self-sufficiency in the agricultural production and processing sector, using crop residues and wastes from processing. Harchaoui et al. [43] provided a framework for assessing net energy balances between food surplus, agricultural residues, and energy requirements to determine the potential for energy self-sufficiency in the agriculture sector.
Self-sufficiency can be defined in many ways [24,25]. In the present study, for a more pragmatic interpretation of national self-sufficiency in biomass materials, we used a similar understanding of self-sufficiency in food as suggested by the FAO [44] (p. 19): “the concept of food self-sufficiency is generally taken to mean the extent to which a country can satisfy its food needs from its own domestic production”. In other words, self-sufficiency means the domestic food production is equal to or exceeds 100% of a country’s food consumption [25]. As Clapp [25] stressed, trade is not ruled out within this definition of national self-sufficiency, as food self-sufficiency is defined by the ratio of food produced to food consumed at the domestic level, while both own-produced and imported products are used for domestic consumption. Food self-sufficiency usually indicates the extent to which a country relies on its own production resources. The higher the degree of self-sufficiency, the greater the ability of a country to satisfy domestic demand for food. Conversely, a lower self-sufficiency ratio indicates a higher dependence on food resources from outside the environment (Wang, 2009, cited in Luan et al. [45] (p. 395)).
Similarly, in this study, biomass self-sufficiency means the extent to which a country can satisfy its biomass material needs from its own domestic production. Biomass self-sufficiency is in this way understood as a country’s capacity to satisfy domestic needs for biomass materials, using biological resources originating from the domestic natural environment. According to a broader understanding, biomass self-sufficiency means the extent of biomass material available to support economic activity in a spatial economic system (e.g., national, regional, local, etc.) based on domestic sustainable biomass potential.
Self-sufficiency can be measured in many ways; however, a ratio of production and consumption of individual products are the most common way of measuring self-sufficiency [24]. A key indicator for self-sufficiency measuring is the self-sufficiency ratio (SSR), which is defined “as the share of domestic production in total domestic use, excluding stock changes” [44] (p. 19). Our calculation of the biomass self-sufficiency ratio follows the statistical data on biomass domestically extracted from the natural environment and domestically used in the economy, developed by economy-wide material flow accounts (EW-MFA) [46]. The most basic nomenclature of material flow at different stages of the natural resource cycle used in EW-MFA will be applied. The biomass self-sufficiency ratio (SSR) was estimated based on the following algorithm:
S S R = D E × 100 D C = D E × 100 D E + I M P E X P ,
where, DE denotes the domestic extraction that refers to the flows of biomass material extracted or harvested from the domestic natural environment, which physically enter the economic system for further processing or direct consumption. DC is the biomass domestic consumption that indicates the total amount of biomass consumed domestically in production and consumption activities. The biomass domestic consumption in Equation (1) is calculated as biomass domestic extraction plus biomass imports (IMP) minus biomass exports (EXP), i.e., DC = DE + IMPEXP.
The SSR can be calculated for an individual biomass material (e.g., wheat, vegetables, fibres, straw, etc.), groups of biomass materials of similar origin (e.g., cereals, crop residues, wood, etc.), and for the aggregation of all biomass materials (i.e., biomass). The SSR indicates the extent to which a country relies on its own extraction of biomass, originating from the domestic natural environment, to meet domestic demand for biomass material, (i.e., the higher the ratio, the greater the national economy’s self-sufficiency for biomass). An SSR over 100% indicates a national biomass material extraction surplus in relation to its domestic demand and therefore net exports. On the contrary, the lower the SSR (where the SSR is < 100%), the more the national economy’s dependence upon biomass imports. An SSR < 100% indicates that domestic extraction of biomass from its own natural environment is less than demand for biomass quantity in a domestic market, and there is a demand for biomass imports to satisfy domestic needs. To analyse the time-space variability of biomass self-sufficiency across the European Union countries, the coefficient of variation (CV) of SSR was calculated.
National economy’s dependence upon biomass imports could by mathematically expressed as follows:
I D R = I M P × 100 D I = I M P × 100 D E + I M P   ,
where, IDR denotes the import dependence ratio expressed as a percentage, and DI denotes the direct input of biomass into the national economy. DI includes all biomass materials that are of economic value, and which are available for use in production and consumption activities. DI in Equation (2) is calculated as the sum of the domestic extraction of biomass plus its physical imports (DI = DE + IMP). The IDR depicts the extent to which an economy relies upon imports to meet its biomass needs (i.e., the higher the ratio the greater the dependence on the import). IDR cannot be negative or higher than 100%. IDR = 100% indicates that there are no domestic extractions of biomass during the reference year. Based on the FAO [44] interpretation, the IDR measures the share of biomass imports in the domestic biomass consumption (both extracted locally and imported). Countries satisfying their domestic needs for biomass predominantly with domestic extractions will have IDRs lower than 50%, while the countries relying more on imports than on domestic extraction will have IDRs higher than 50%. However, it should be kept in mind that these ratios hold only if imports are mainly used for domestic consumption and are not re-exported. In the present study, the strength of correlation between SSR and IDS was analysed based on a whole sample of the EU countries.

2.2. Research Scope and Data Sources

The empirical analysis of biomass self-sufficiency is based on economy-wide material flow accounts (EW-MFA) data on the physical flows of biomass as a natural material at various stages of the flow chain, specifically domestic extraction, domestic material consumption, and imports. The data come from the Eurostat’s “Material Flow and Productivity” database.
In EW-MFA, the indicator of domestic extraction of biomass is its flows from the domestic natural environment to the economy. Biomass extraction is defined as its amount in physical weight derived from the natural environment for use in the economy [46]. It is equivalent to the concept of used primary biomass harvest (such as primary crops, used crop residues, biomass harvested from grassland and grazed biomass, and wood harvest (wood removals)), as it is used in the Human Appropriation of Net Primary Production (HANPP) framework. “Biomass, the sum of recent, non-fossil organic material of biological origin, is one of the fundamental resources of any socioeconomic system” [47] (p. 471).
According to EW-MFA conventions [16], domestic extraction covers biomass that acquires the status of a product and is used as a natural materials input in further economic processes (or socioeconomic processes [47]). Meanwhile, biomass harvested from the natural environment without the intention of using it for economic needs is not included in flow of domestic extraction (e.g., felling losses in forests or crop residues remaining on field). In the ecosystem services literature, biomass remaining in natural or cultivated ecosystems after harvest denoted as “back-flows to nature” [48]. However, a systematic review of the literature on ecosystem services demonstrated the multiple environmental benefits of unused biomass remaining in ecosystems after extraction or harvest, for example: the benefits of returning crop residues to soils for climate regulation due to the formation of soil organic carbon and improving the relation between organic carbon and nitrogen in soil, cover crops and crop residues which are left on fields is central to biodiversity conservation in the agrarian landscape, and both cover crops and crop residues also contribute to water retention and the slow passage of water into deeper soil layers [48].
The analysis of national self-sufficiency and import dependency is targeted at two levels of detail of biomass materials: first, whole biomass corresponds to a 1-digit level of materials category in the EW-MFA classification (codes FM1), and second, two biomass groups according to OECD [49] classification, such as food materials (i.e., food crops, fodder crops and used crop residues, wild animals, essentially marine catches), small amounts of non-edible biomass (e.g., fibres, rubber), and related products including livestock, and woody materials (i.e., harvested wood and traded products essentially made of wood).
Both biomass groups according to OECD classification correspond to a 2-digit level of material classes in the EW-MFA classification (i.e., food materials by such codes: MF11, crops (excluding fodder crops), MF12, used crop residues, fodder crops, and grazed biomass, MF14, wild fish catch, aquatic plants and animals, hunting and gathering, and woody materials (code MF13)). Two additional biomass classes for livestock and livestock products (correspond, respectively, to codes MF15 and MF16) are not accounted as domestic extraction of biomass originating from the domestic natural environment but are considered as flows within the economic system. According to the EW-MFA principles [46], cultivated livestock (e.g., cows, pigs, sheep, etc.), and livestock products (e.g., milk, meat, eggs, animal leather, etc.) as well as livestock waste are not natural inputs and hence excluded from domestic extraction of biomass. Cultivated animals convert primary plant biomass into edible biomass for human consumption [48].
The data are from the Eurostat’s “Material Flow and Productivity” database. The empirical study covers the period from 2000 to 2018 which is subdivided into two sub-periods: 2000–2009 and 2010–2018, respectively. The spatial unit of analysis consists of the country. The study covers all 28 member states of the European Union (by the composition of the EU until 31 January 2020).

2.3. Econometric Model of Determinants of Biomass Self-Sufficiency

To explore the effect of some determinants on a degree of self-sufficiency in biomass, the two-step system generalised method of moments (GMM-SYS) was used in a dynamic panel model. This method helps to solve the problems of endogeneity, heteroscedasticity, and serial correlation [50]. The GMM-SYS estimator combines the regression in differences with the regression in levels [51]. This estimator is consistent if two tests are successful: (1) a Sargan test over-identification, which proves that instruments are valid (p-value > 0.05), and (2) an AR(2) test about no second-order autocorrelation (p-value > 0.05). A general form of a dynamic panel data model is as follows:
y i t = γ y i , t 1 + C + β x i t + μ t   + α i * + ε i t ,
where, i = 1, 2, …, N represents cross-sectional unit; t = 1, 2, …, T represents the time period; α * reflects unobserved cross-sectional heterogeneity; μ refers to time-specific effect; ε means idiosyncratic error; y is the explained variable; y(t−1) is the lagged explained variable; C is constant; x stands for explanatory variables; γ and β are parameters that reflect the impact of right-hand side variables on regression [52,53].
The analysis of world region patterns [47] revealed that the level of biomass use, measured by its consumption per capita, is determined by patterns of land use evolved historically as well as by population density, rather than by affluence or economic development status. The regional peculiarities of the land use system can lead to significant differences in the quantitative and qualitative structure of biomass harvest, as noted in the UNEP document [16]. In light of the above information, the core explanatory variable of this research is agricultural and forest land share (%). To make the results of the econometric model more convincing, other control variables are included in the model. The variables used in this paper and the expected correlation with the explained variable are presented in Table 1. The data used for calculations have been collected from the Eurostat’s and FAOSTAT’s databases.
Based on Equation (3), our econometric model can be specified as follows:
  B _ S S R i t = γ B _ S S R i , t 1 + C + β 1 l a n d i t + β 2 b i o m a s _ e x t r i t + β 3 b i o e n _ r e n w i t + β 4 b i o e n _ p r i m i t + β 5 e n _ i m p i t + β 6 b i o m a s _ i n t i t + β 7 r e s _ p r o d i t + β 8 p o p _ d e n s i t + β 9 e m p l _ k i a i t + μ t   + α i * + ε i t ,
where, B_SSR refers to biomass self-sufficiency ratio; B_SSR(-1) means lagged biomass self-sufficiency ratio variable; land is agricultural and forest land share, %; biomas_extr is biomass domestic extraction per ha; %; bioen_renw refers to share of bioenergy in renewable energy; bioen_prim means share of bioenergy in total primary energy production; en_imp denotes energy imports dependency; biomas_int is biomass materials intensity, kg per GDP (PPS); res_prod is resource productivity, GDP PPS per tonne; pop_dens means population density, persons per km2; empl_kia refers to employment in total knowledge-intensive activities, %.
The descriptive statistics of the variables are presented in Table 2.

3. Results

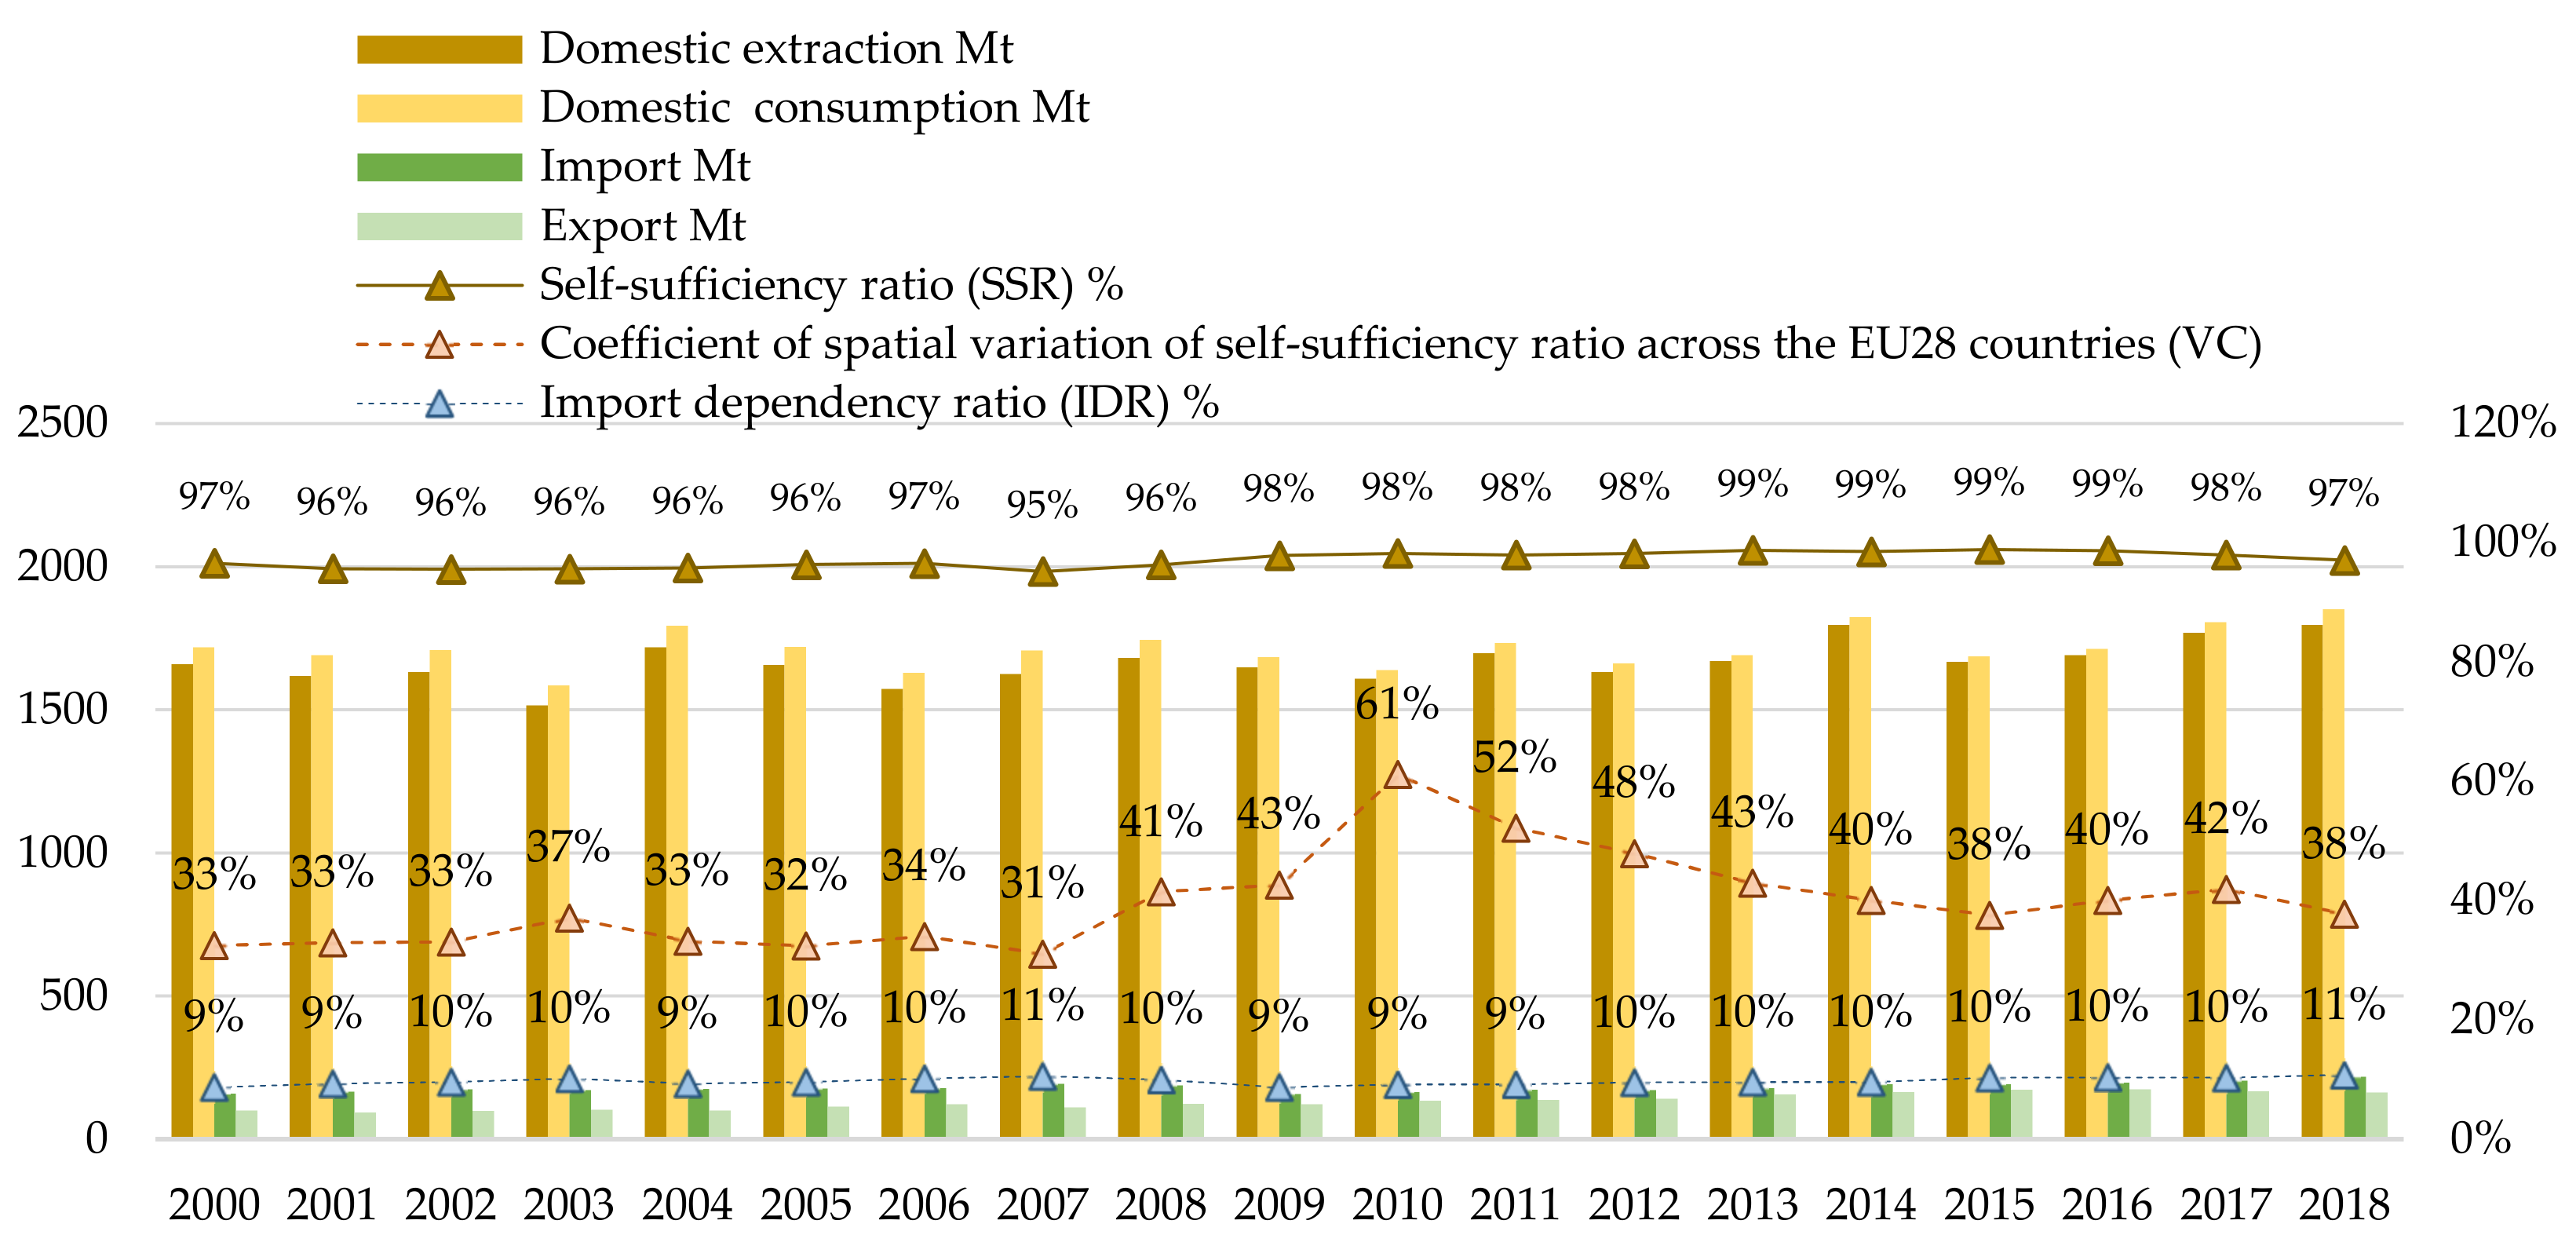
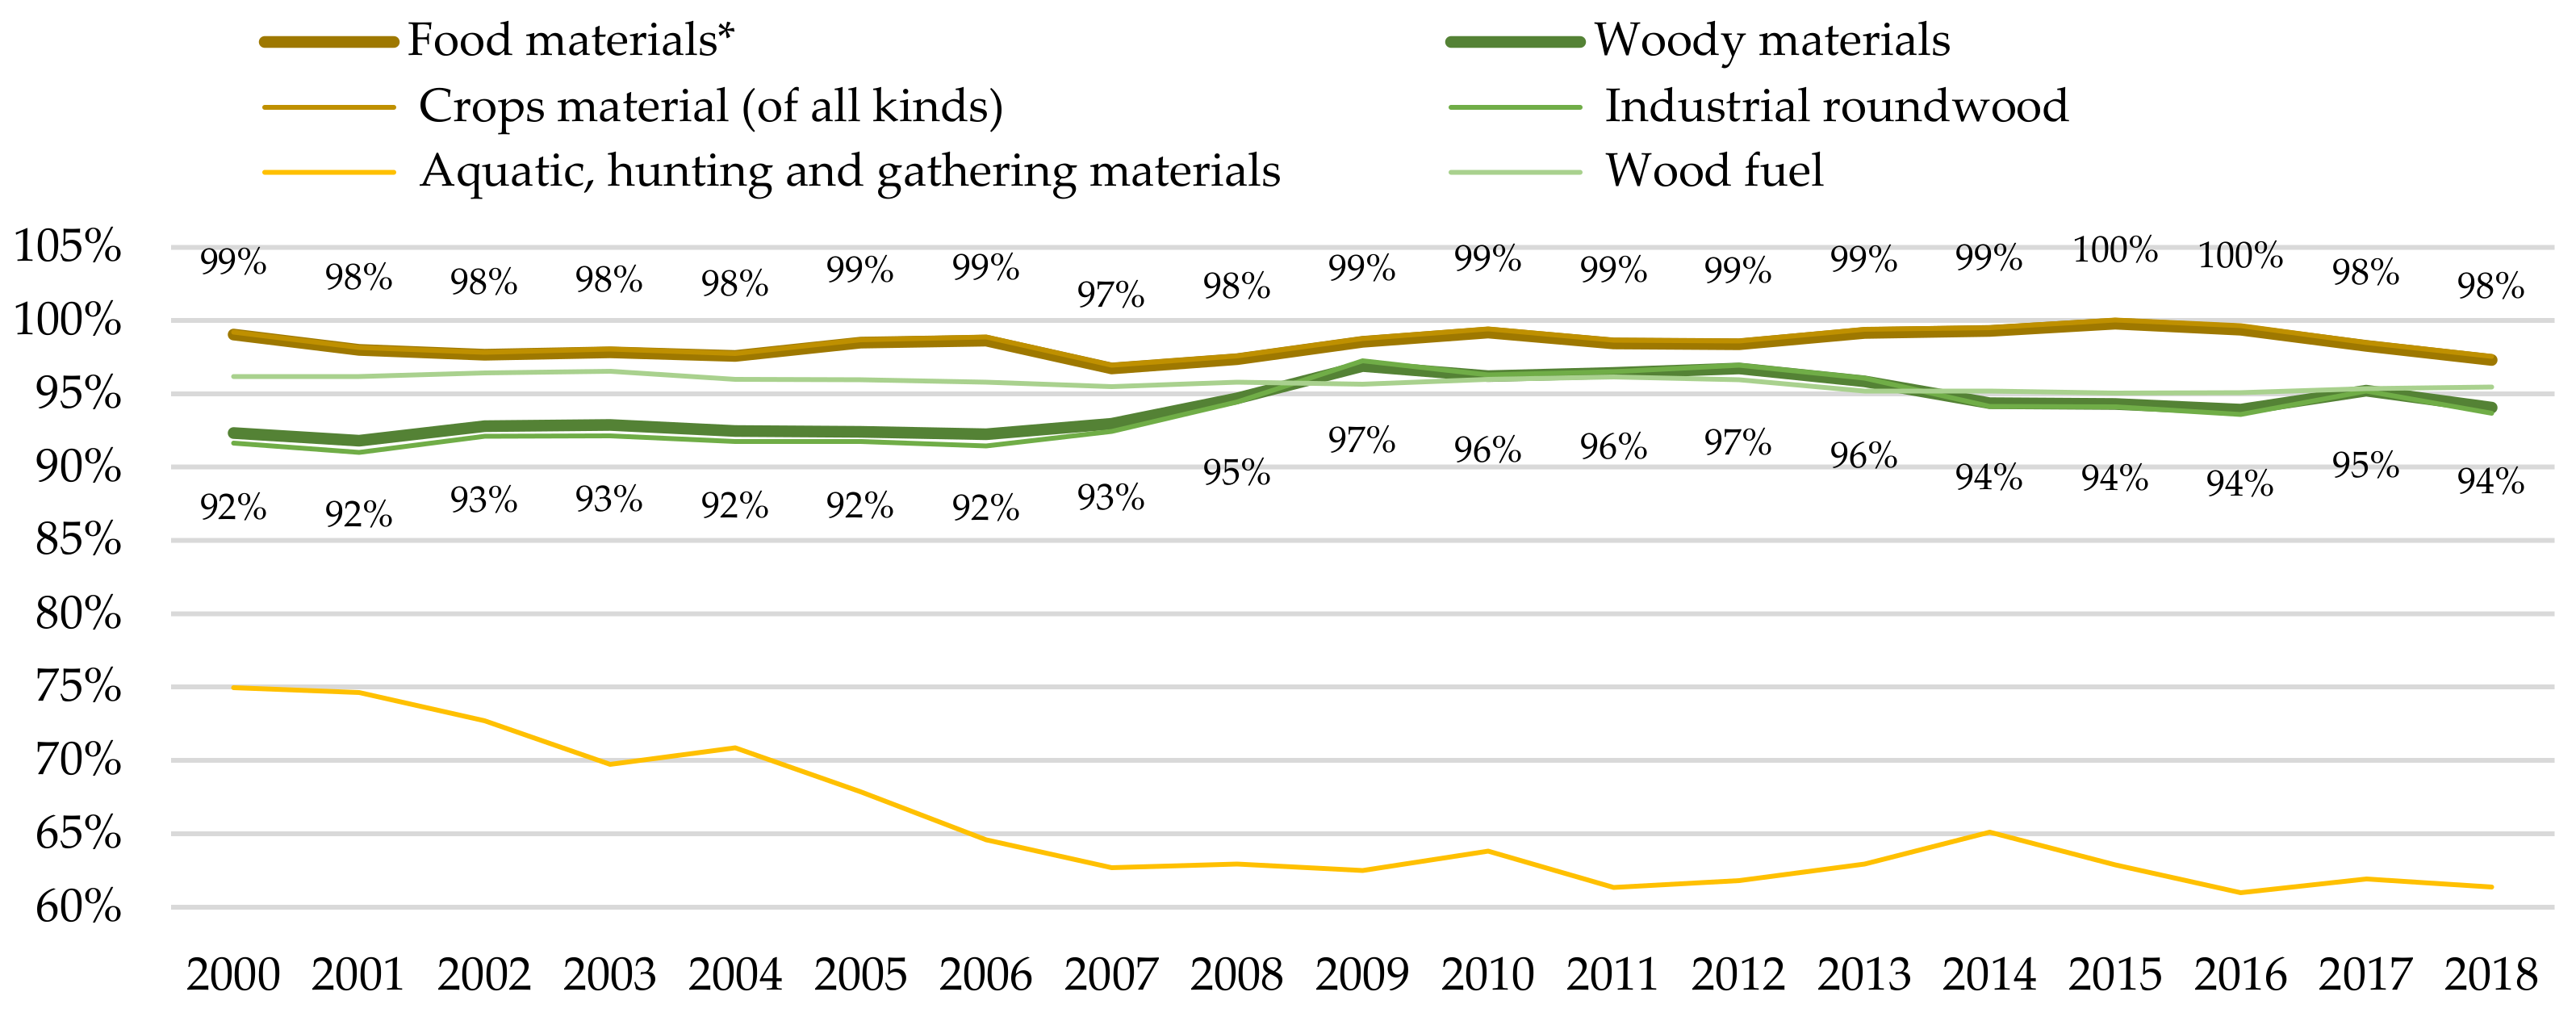
3.1. The Profile of the EU’s Biomass Extraction–Consumption Balance

As an aggregated biomass, the European Union is rather self-sufficient in biomass originating from the domestic natural environment and has the potential to meet all domestic needs for biomass, with sufficient domestic extraction, as illustrated by the SSR curve in Figure 1. The Figure also displays a slightly higher amount of biomass domestic consumption compared to its domestic extraction throughout the entire study period; domestic consumption increased by 7.7% (i.e., from 1718.4 million tonnes in 2000 to 1850.6 million tonnes in 2018), while domestic extraction grew by 8.2% (i.e., from 1659.3 to 1796.1 million tonnes). The obtained results indicate that the EU’s biomass self-sufficiency has been higher in the present decade than in the previous decade but has slightly decreased in recent years (i.e., from almost 98.9% in 2016 (when it was at its highest degree for the past nineteen years) to 97.1% by 2018).
Biomass self-sufficiency varied spatially across the EU countries, as illustrated by the spatial variation coefficient of self-sufficiency ratio (VC) in Table 3. In this regard, a previous study [54] has revealed that nearly two thirds of the EU member states specialised in primary production (in other words: biomass as renewable resources production) and can meet all domestic requirements for biomass material and have the potential to export biomass to the EU internal or world markets. By contrast, in the remaining third of the EU member states (Luxembourg, United Kingdom, Belgium, Ireland, Denmark, Malta, Austria, Sweden, and Germany) the primary production sector is under-represented and biomass materials production is insufficient to meet domestic demand, requiring the import of biomass. However, the degree of self-sufficiency in biomass varies significantly across the EU member states, as the coefficient of spatial variation (VC) in Figure 1 (see also Table 3) indicates. The trend revealed by Figure 1 is a steadily decreasing difference in biomass self-sufficiency between the EU countries in the years following the global economic crisis.
Despite being almost 100% biomass self-sufficient, the EU economy also depends on imports of biomass materials. The EU is both importing and exporting significant amounts of biomass material. Biomass accounts for more than one-tenth of total material import and a quarter of total material export of the EU in the years following the global economic crisis. The EU is a net importer of biomass materials, just as are most of the member states. In 2018, imports exceeded exports by 33% (Figure 1). During the 2000–2018 period, biomass import increased by 38% (i.e., from 158.9 to 217.3 million tonnes) and export increased by 63% (i.e., from 99.8 to 162.9 million tonnes).
Thus, the import dependence of the EU on biomass currently is above 11%, and it shifted to a higher level throughout the study period. The highest and steadily increasing dependence on imports since 2009 was observed in overall woody materials (13% in 2018). The import dependence on the total food material category is 6%, and it increased after the economic crisis, possibly due to slower growth in extraction or harvesting compared to total consumption growth (on average 1.5% and 1.6% per year in 2010–2018, respectively). The import dependence on the general nutrient category is 6% and it increased to a higher level after the economic crisis, possibly due to slower extraction or yield growth compared to total consumption growth (on average 1.5% and 1.6% respectively, 2010–2018).
As for the total food materials group, including small amounts of non-edible biomass, the degree of the EU’s self-sufficiency was 1–2 percentage points lower than 100% over the nineteen study years, except for 3 percentage points in 2007 (Figure 2). A similar result was observed for SSR in materials of crops origin (see the curve of crop materials sub-group in Figure 2). This means that the EU harvests more biomass for food (including feed, fibre, biofuels, and biogas as well) than it consumes, thus avoiding a supply side problem in recent decades [55]. In contrast, the EU’s self-sufficiency in wild fish and aquatic materials (including small amounts of hunting and gathering materials) was noticeably lower, owing to its limited natural resources. Indeed, the SSR of this biomass sub-group decreased from 75% to 61% in the past two decades. Accordingly, the EU’s import dependency on this biomass sub-group shifted from 34% to almost 67% in the last nineteen years.
As for overall woody materials group, the EU’s self-sufficiency increased from 92.9% to 96.9% in 2000–2009 but fell to 95.2% in 2010–2018 (Figure 2). The EU is “approximately self-sufficient”(“approximately food self-sufficient” is proposed by O’Hagan (1975, cited in Clapp [25], p. 4), meaning the self-sufficiency ratio interval between 95 and 105 percent) in woody fuel and domestic needs, mainly relying on its own production. The import dependency ratio of the latter material category was low and stable (i.e., about 5%) during the two decades in the study period, thus the RSS in wood fuel is as high as 95% over the last two decades. The lowest degree of self-sufficiency is illustrated by industrial roundwood; however, its SSR increased from below 92% in 2000 to above 95% in 2018.

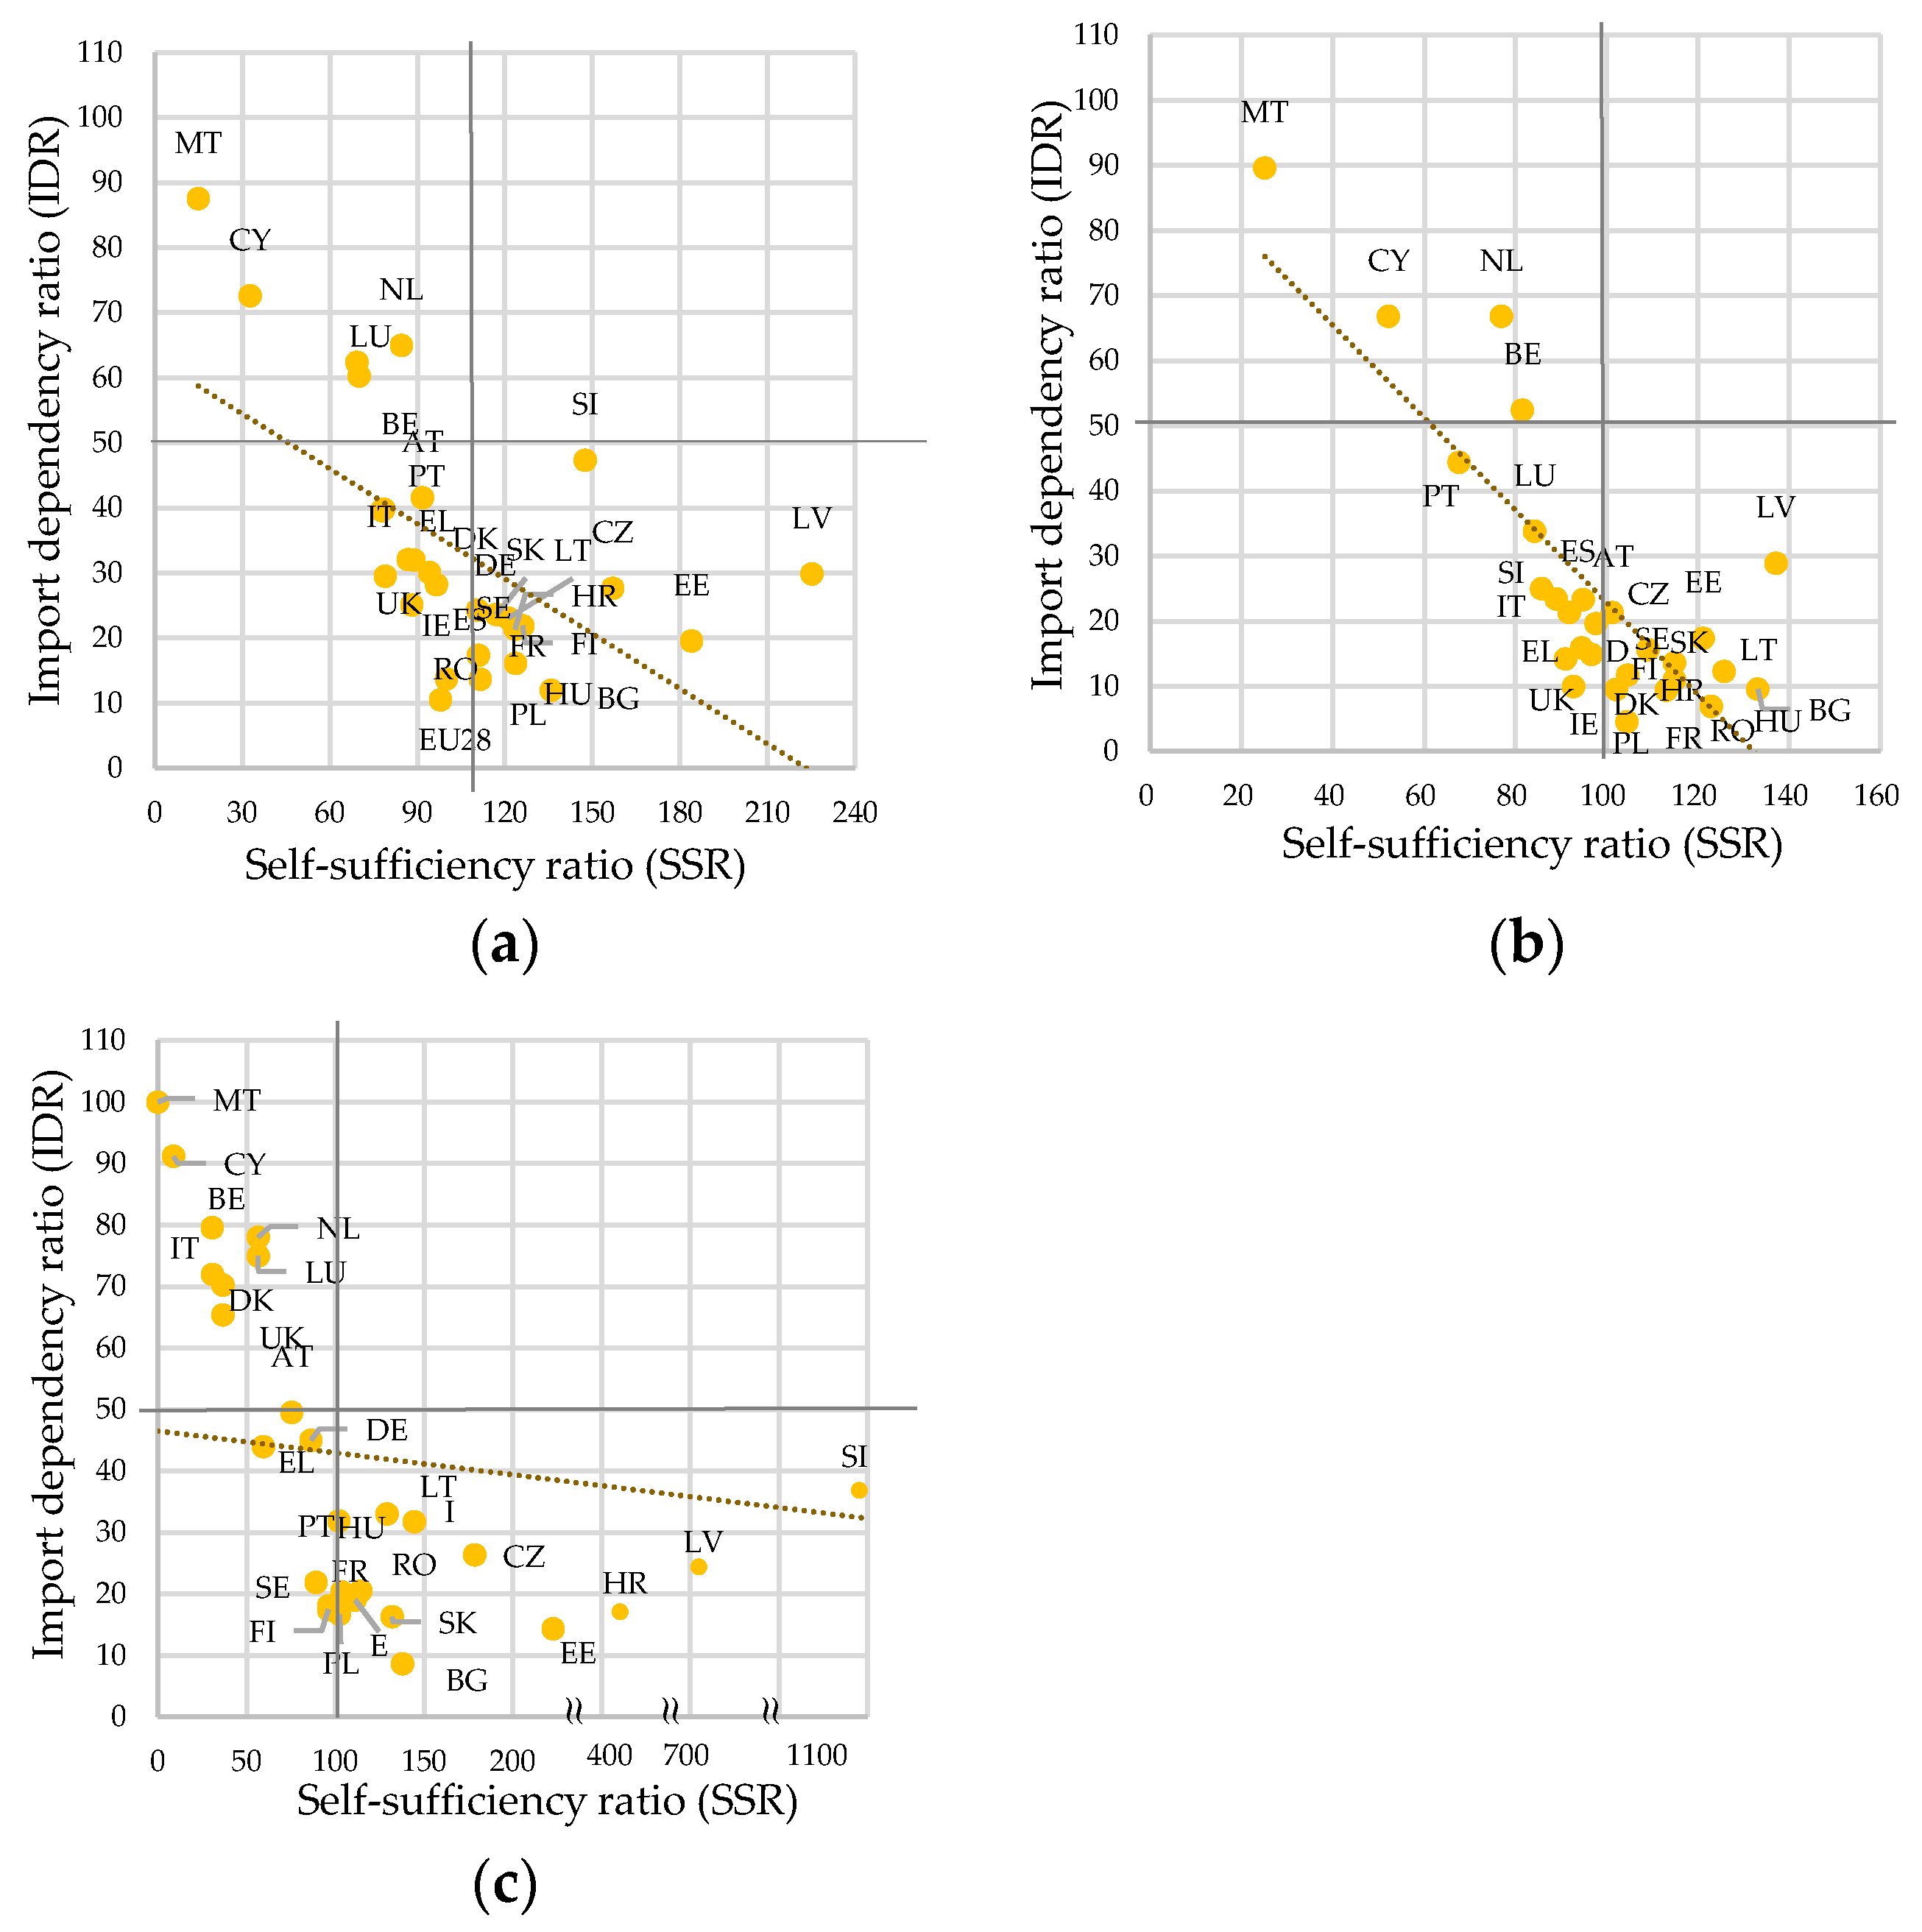
3.2. The Profile of Biomass Self-Sufficiency across the EU Countries

Based on average SSR value and its variation coefficient, Table 3 presents the temporal and spatial distribution characteristics of the biomass self-sufficiency ratio for both the EU as a whole and at the level of member states for the two sub-periods from 2000 to 2009 and 2010 to 2018. The data compiled in the table below reveals that both spatial and temporal variability of SSR is very uneven in the EU. In the EU as a whole, very small coefficients of temporal variation over both sub-periods (approx. 0.8% and 0.6%, respectively CTV1SP and CTV2SP) display stability in all regions for the last nineteen years considered. However, the biomass self-sufficiency varies greatly across members states. The high coefficient of spatial variation (CSV) during both sub-periods illustrates the significant differences in the degree of biomass self-sufficiency among countries. Additionally, the difference among the EU countries increased remarkably over the last decade, as evidenced in the change of SSR variation, from 34.3% in the first sub-period to 43.7% in the second sub-period.
The data in Table 3 illustrates the asymmetry between the degree of biomass self-sufficiency and its temporal variation at the country level. The highest coefficient of the SSR variation was found in countries that display the highest or lowest SSR. Moderate or higher variations of SSR (>10%) during the first sub-period 2000–2009 were found in Latvia, Estonia, and the Czech Republic, which demonstrated the highest SSR (214%, 150%, and 131% on average in 2016–2018, respectively), and in Malta and Cyprus, which displayed the lowest SSR (21%, 150%, and 131% on average, respectively), meaning that the nature of the biomass domestic extraction-consumption system in these countries was the most unstable in the whole EU region. The decreased SSR variation in the second half (2010–2018) displays more stability in Estonia, the Czech Republic, and Cyprus, whereas the increased variation in Latvia and Malta demonstrates more instability. The decreased variation coefficient in the second half indicates more stability of biomass domestic extraction-consumption systems in the other thirteen countries as well.
Nearly half of the EU member countries (i.e., the first thirteen listed in Table 3) were largely self-sufficient in biomass materials originating from the domestic natural environment. They had a ratio of self-sufficiency of over 109% since 2000. In addition, five countries (Latvia, Estonia, the Czech Republic, Slovenia, and Bulgaria) had a very high degree of biomass self-sufficiency, with biomass yields exceeding domestic consumption by more than 1.35 to 2.35 times at the end of the study period. Additionally, the SSR of all these countries increased in the last decade compared to the previous decade, as indicated by a positive difference between the SSR values in both sub-periods (Table 3). Poland and Spain were “approximately biomass self-sufficient”, meaning that they had a ratio of self-sufficiency between 95 and 105% during the last decade. Germany was “approximately biomass self-sufficient” until 2016 as well; however, its self-sufficiency in biomass materials declined to almost 94% by 2018. This implies that all the sixteen countries can meet all domestic requirements for biomass materials, and have potential (except Poland, Spain, and Germany) to export biomass to satisfy the growing demand for biomass, not only on the EU internal market, but also in global markets.
In contrast, an SSR below 95% was found in twelve of the EU member states (these include Austria and the rest of the countries listed in Table 3, above) during both considered decades. This indicates that the degree of biomass self-sufficiency is low, and these countries were less than self-sufficient. Moreover, in most countries (i.e., nine out of twelve, except for Denmark, Greece, and Luxembourg), biomass self-sufficiency declined over the last decade compared to the previous one, indicating the deterioration of their capacity to meet their own domestic demand for biomass materials. As a result, all these countries faced a significant increase in their dependence on biomass imports from the rest of the EU countries or other countries (see Figure 3).
The exceptionally low biomass self-sufficiency ratio for the entire considered period was observed in the two island nations: Cyprus and Malta. This means that both countries satisfied their domestic needs for biomass materials by relying more on imports than on local production. As illustrated in Figure 3, in both countries, the import dependency ratio was higher than 50% (i.e., nearly 90% and 67% on average, in 2016–2018). Indeed, the degree of biomass self-sufficiency decreased in both countries (i.e., from 50% to below 33% in Cyprus and from above 25% to 15% in Malta, in the past half-century). This means that dependence on biomass imports has increased in both countries.
Some countries lack the necessary natural resource base or face ecological asset scarcity to be self-sufficient [56]. Such countries (e.g., Cyprus, Malta, Netherlands, Belgium, and Luxembourg; see Figure 2) tend to rely on imports to meet their needs and may become import dependent. At the same time, however, biomass import dependency is not simply a result of natural resource constraints; this may be due to several other factors, including drops in domestic production, changing production and demographic shifts, subsidies, and export earnings (interpretation extended from food imports to overall biomass imports, based on Luan et al. [57]).
Figure 3a indicates the relative position of the EU countries in terms of their ability to satisfy domestic needs for biomass materials, based on the domestic extraction and import. Both the self-sufficiency and import dependency ratios are expressed through average value in 2016–2018. A moderate negative correlation between SSR and IDR was found for the whole biomass materials group (r = −0.62, p < 0.01), which means a comparatively higher dependence on imports at a lower degree of self-sufficiency. Figure 3 illustrates that only in five EU countries is a larger portion of biomass domestic demand satisfied through imports (i.e., Malta (88%), Cyprus (73%), Netherlands (65%) Luxembourg (88%), and Belgium (60%)). In the remaining EU countries, the greater share of domestic needs for biomass was satisfied through domestic production imports, ranging from 12% for Bulgaria up to 47% for Slovenia.
A strong negative correlation (r = −0.81, p < 0.01) between SSR and IDR was found for the food materials group, including small amounts of non-edible biomass. An export share larger than 50% appears for Malta (90%), Cyprus and the Netherlands, (67%), and Belgium (52%), revealing their dependence on food imports (Figure 3b). As for the whole woody materials group, the correlation analysis indicates a moderately negative relation between the self-sufficiency and import dependency variables (Figure 3c). More than half of domestically consumed woody biomass was imported in seven EU countries, such as Luxembourg (75%), Netherlands (78%), United Kingdom (65%), Denmark (70%), Italy (72%), Belgium (79%), and Cyprus (91%). The imported woody materials amounted to 50% of Austria’s domestic biomass needs, while Malta used only imported wood materials for domestic consumption.

3.3. The Effect of Determinants on Biomass Self-Sufficiency

To obtain valid results of statistical analysis, a log (logarithm) transformation of variables is performed. Also, outliers are removed from the dataset as they can affect the results of the model. The verification of the dependency between explained (y) and each of the explanatory variables (x) was checked, and a linear relation between each pair of variables was revealed. For this reason, a linear form of each variable is included in the model. A bivariate correlation between each pair of different explanatory variables was examined and the results revealed that there is a strong correlation (higher than |0,7|; based on Ratner [57]), between two pairs of variables: l (“l” denotes the log transformation of a variable) pop_dens & l_biomas_extr (0,8) and l_biomas_int & l_res_prod (−0,8). For this reason, the variables that are highly correlated are included in the model separately, and four cases of the model are performed. The results of the estimations are presented in Table 4. The program used to run the model was GRETL.
All estimations in Table 4 passed AR(2) and Sargan over-identification tests and thus the results are not affected by the second-order correlation, and the instruments are valid. The results reveal that the impact of the indicator of major interest (i.e., the agricultural and forest land share variable) on the biomass self-sufficiency ratio is positive and statistically significant in all cases of the model. A positive effect indicates that an increase in agricultural and forest land increases the biomass self-sufficiency ratio,; this confirms the expected effect of the core explanatory variable on the explained variable.
The expected effect of biomass domestic extraction on the biomass self-sufficiency ratio was positive or negative. In both cases of the model, when this variable was included, the negative direction of exposure was obtained, and the results were statistically significant. The coefficient of this variable indicates that a one per cent increase in biomass domestic extraction decreases the biomass self-sufficiency ratio by about 0.05 per cent. The estimation results also indicate that an increase in the share of bioenergy in renewable energy contributes positively to the biomass self-sufficiency ratio, in all four constructed cases of the model; this is in line with previous expectations. Energy import dependency proved to be statistically significant. The magnitude and direction of this variable indicate that an increase in energy import dependency by 1 per cent reduces the biomass self-sufficiency ratio by about 0.13–0.27 per cent; the effect of this variable is as expected.
The estimates suggest that the biomass materials intensity variable has a positive and statistically significant effect on the explained variable, indicating that an increase in biomass material intensity affects an increase in the biomass self-sufficiency ratio.; the results are in line with a priori expectations. This research has demonstrated that population density has a statistically significant effect on the biomass self-sufficiency ratio in all cases of the model. This effect is negative (i.e., when population density increases, biomass self-sufficiency decreases). Further results of the model suggest that three variables are statistically significant only in one case of the model. These variables are the share of bioenergy in total primary energy production, resource productivity, and employment in total knowledge-intensive activities.

4. Discussion

In this section, the study results on biomass self-sufficiency and import dependence, as well as its determinants in the EU countries and the United Kingdom, are discussed in the context of ecological constraints of biomass extraction and harvesting, the EU Green Deal, and biomass supply-demand trends at a global scale.
The obtained results suggest that the European Union is rather self-sufficient in terms of biomass and has the potential to meet all domestic requirements for biomass, with sufficient domestic natural resources. The EU’s biomass self-sufficiency has been higher in the present decade than in the previous decade but has recently slightly diminished. It is emphasised that, although the domestic demand and domestic supply of biomass is currently balanced in the European Union, increasing the supply of biomass that originates from its own sources, to match the large increase in demand, would be very difficult [14]. A range of ecological boundaries place limitations. Biomass is finite in nature and functionally; time for regrowing or recovering is needed. Biomass harvest depends on ecosystem health, regeneration rate, and the availability of land, soil fertility, and productivity, etc. Exceeding ecological boundaries can lead to ecosystem degradation [58]. Due to ecological boundaries, the EU’s bioeconomy strategy requires that biomass be used only within safe ecological limits, to strengthen the resilience of both terrestrial and aquatic ecosystems and ensure their contribution to climate mitigation and sustainability of their biodiversity [6]. Moreover, biomass harvesting or extraction has multifaceted negative implications for natural ecosystems, such as declines in biodiversity, the reduction in natural carbon stocks and sinks, nitrate pollution, and GHG emissions from biomass production. Consequently, biomass continues to play a role in the EU’s low-carbon transition; its use will need to be limited and targeted towards the most added value to climate and environmental objectives [58].
Despite a high degree of self-sufficiency, the EU economy also depends on imports of biomass materials. The EU is a net importer of biomass materials, as are most of the member states; the EU’s imports exceeded exports by 33% (2018). Based on the EU-28 states’ sample, a moderate negative correlation between self-sufficiency and import dependency ratios was found for the whole biomass material group and for the wood materials sub-group, and a strong negative correlation was found for the food material sub-group, including small amounts of non-edible biomass. As several studies have found, on average globally, the largest share of biomass extracted from cultivated and non-cultivated (wild) natural biological resources is used domestically [16,47,59]. Currently, only one tenth of the globally extracted biomass from the natural environment is traded internationally; however, in some countries the share of biomass international trade may be large [16]. Using the simulated interregional flows of goods within the world economy, based on the global multi-regional input-output table [59], it was found that most of the local biomass extraction is consumed locally. On the contrary, only a small part of biomass use, embodied in final consumption, originates from domestic sources. The reasons substantiate the need for biomass self-sufficiency studies to uncover the extent to which a country can satisfy its biomass needs from its own domestic production, based on its natural resource base.
Additionally, the latest research [5] demonstrates that the extraction of raw materials (including biomass) in Europe is under threat due to various reasons, such as the lack of knowledge on raw materials, insufficient awareness of the true ecological boundaries of the planet, competing land use and urbanisation, erosion and degradation of soils, as well as the reluctant and at times hypocritical attitude towards the sustainability of raw materials used in imported products. The “spatial disconnect” between biomass production and consumption has been recognised as pivotal, regarding global environmental degradation [60].
Several studies ([61,62,63]) demonstrate that the availability of biomass as a renewable resource arising from living ecosystems is unevenly distributed, in regards to its demand and availability. Some of the regions with the greatest demand have a relatively low availability of local biomass resources. Our findings, based on the spatio-temporal analysis of biomass self-sufficiency, illustrate that the ability of EU countries to meet their domestic biomass demand, at the expense of local resources, varies greatly. The degree of biomass self-sufficiency varies significantly across the EU member states, although the differences increased remarkably over the last decade. The asymmetry between the degree of biomass self-sufficiency and its temporal variation at the country level is higher in the countries that display the highest or lowest self-sufficiency ratio. Nearly half of the EU member countries (i.e., Latvia, Estonia, Czechia, Slovenia, Bulgaria, Finland, Hungary, Croatia, Lithuania, Slovakia, Romania, France, and Sweden) were largely self-sufficient in biomass materials (SSR above 105%). Poland and Spain were “approximately biomass self-sufficient”. The rest of the EU member countries were under self-sufficiency (SSR below 95%). Exceptionally, the lowest biomass self-sufficiency ratio for the entire considered period was observed in the two island nations: Cyprus and Malta (SSR below 33% and 15%, respectively, at present). Also, four EU member countries (Portugal, Italy, Belgium, and Luxembourg) and the United Kingdom are rather poorly self-sufficient in biomass (from 70% to 80%), and in Austria, Denmark, Ireland, Greece, and the Netherlands, the degree of biomass self-sufficiency is quite low (80–90%). The import dependency on of all these countries is much higher than the EU average, ranging from 30% in Greece and Denmark to 86% in Malta, on average over the last five years. Therefore, it can be expected that a considerable number of challenges for biomass’s supply and demand can be expected, regarding the ambitious targets of the Green Deal and increasing competition in the biomass export markets.
From the point of view of the European Green Deal’s ambitious target to reduce net greenhouse gas emissions to zero by 2050, the EU climate scenarios foresee a 70–80% increase in biomass use demand, while its supply will lag behind, a 40–100% gap relative to the large increases in demand [14]. In addition, the launched strategies of Farm to Fork and Biodiversity, which are a part of the Green Deal, are likely to influence the reduction of agricultural production (production of biomass of agricultural origin in the context of this study) in the EU. According to EW-MFA statistics, biomass of agricultural origins account for 82% of total biomass extraction in the EU-27 on average, over the period 2016–2019. A few studies were performed to analyse the possible impact of the targets of these strategies on the EU‘s agricultural production. The quantitative results of the impact studies are different. Henning et al. [64] identify a decline in agricultural production in the EU from 2.6% to 45%. Bremmer et al. [65] conclude a decrease in agricultural production, up to 30%. Beckman et al. [66] find a decrease in agricultural production from 7% to 12%, and Barreiro-Hurle et al. [67] identify up to a 15% reduction in the supply of agricultural production. In any case, all these impact studies acknowledge that the supply changes of various agricultural products can dramatically decline in 2030 in the EU-27. In addition, on a global level, the consumption of primary biomass is projected to almost double over the coming four decades (rising from 22,5 Gt in 2020 to 41 Gt in 2060), if the new policies to improve resource use efficiency and stimulate the transition to a circular economy are not developed [15].
The main purpose of the econometric analysis in this study is to test the effect of the share of agricultural and forest land in total land area on biomass self-sufficiency. A panel data analysis is proposed in this study. The two-step GMM method is used for econometric analysis, controlling for potential factors, including bioenergy development, and social and economic characteristics. The estimation results indicate that the core explanatory variable (i.e., agricultural and forest land share) has a positive effect on the biomass self-sufficiency ratio; this means that an increase in the share of agriculture and forestry in the total land area increases the biomass self-sufficiency ratio. This finding is in line with the findings of Ladanai and Vinterbäck [68], Field et al. [69], and Benti et al. [29], who stated that land availability is crucial for the future since energy from biomass depends on it. Biomass is defined as, potentially, a main source of energy. As UNEP [16] mentions, regional distinctiveness of the land use system can affect the framework of biomass, both in terms of quantity and quality. Vera et al. [70] note, “the biomass potentials and environmental impacts strongly depend on location of specific biophysical conditions, land use/cover prior to conversion, and feedstock type” (p. 5). Thus, land use is an important factor for biomass accessibility.
In addition, a negative impact of population density on biomass self-sufficiency is present in all cases of the model. This indicator, as a land use characteristic as well, is widely discussed in the scientific literature. A growing population (directly related to population density) increases the fear that, within a few decades, agricultural production will have to increase, but a large portion of the land is not useful, as it is degraded; “there is a deepening awareness of the long-term consequences of the loss of biodiversity, with the prospect of climate change“ [71] (p. 560). As UNEP [16] asserts, a high population density is usually related to a high dependence on biomass imports at a country level, while countries with a low population density are usually net exporters of biomass. Also, population density is associated with the domestic extraction of biomass. As Krausmann et al. [47] stress, the highest domestic extraction is in countries where population density is low.
As expected, the econometric model displays a negative effect of energy import dependency on the biomass self-sufficiency ratio. In this respect, reducing the energy import dependency requires increasing biomass production. As Field et al. [69] state, there are many opportunities for greater energy independence. The potential of bioenergy depends on the protection of forests and agricultural land against such processes as degradation, desertification, etc. [72]. On the contrary, a positive effect of the share of bioenergy in renewable energy on the biomass self-sufficiency ratio is found by the model regression, as was expected while formulating the model. Bioenergy is viewed as the most important option of renewable energy in the future as well as at present. As stated before, closely related to the production of bioenergy is land, which is a crucial element for the bioenergy industry.

5. Conclusions

This study serves as an overview of biomass self-sufficiency in the European Union as a whole and in individual member state levels. It provides an essential framework for this topic and a detailed analysis of the effect of some determinants on the biomass self-sufficiency ratio at the EU level. The analysis covers the 2000–2018 period and includes 28 EU countries (the composition of the EU until 31 January 2020). A pragmatic interpretation of the national self-sufficiency in biomass materials was used in the present study. Biomass self-sufficiency is calculated as a percentage ratio of biomass domestic extraction to its domestic consumption. Thus, biomass self-sufficiency indicates the extent to which a country can meet its needs for biomass materials, using resources coming from domestic extraction or harvest.
Our study has some limitations, mainly related to the narrowed definition of biomass as the primary biological material domestically extracted from the natural environment and domestically used in the national economy, as developed by the economy-wide material flow accounts (EW-MFA). Secondly, data on the biomass domestic extraction and consumption from the EW-MFA database was used in the analysis, keeping in mind that the NEW-MFA accounts for the physical flows of primary biomass from the natural environment to the economy. Due to this limitation, the biological waste generated by primary production and subsequent economic processes (manufacturing, trade, and final consumption), and returned to the production and consumption processes, were not included in the analysis. Despite the limitations, this study can be used by governments, policy makers, bioeconomists, and even macroeconomists, since the concept of self-sufficiency features is prominently used in many regulatory guidelines, policies, and recommendations on food security, anti-poverty, energy security, renewable energy, circularity of economy, sustainable development, transition to a low carbon economy, etc. Further research is needed to explore the contribution of biomass from waste streams into biomass self-sufficiency and to assess the country’s ability to meet domestic demand for biomass. There is a need to explore ecological, economic, and social constraints to biomass use and harvesting from natural and cultivated ecosystems.

Author Contributions

Conceptualization, V.V.; methodology, V.V. and A.A.; software, A.A.; validation, V.V. and A.A.; formal analysis, V.V. and A.A.; investigation, V.V. and A.A.; resources, V.V., A.A. and N.R.; data curation, V.V. and A.A.; writing—original draft preparation, V.V., A.A. and N.R.; writing—review and editing, V.V.; visualization, V.V. and A.A.; supervision, V.V.; project administration, V.V.; funding acquisition, V.V., A.A. and N.R. All authors have read and agreed to the published version of the manuscript.

Funding

This research was supported by the European Union’s Horizon 2020 research and innovation programme, under grant agreement No 862699.

Institutional Review Board Statement

Not applicable.

Informed Consent Statement

Not applicable.

Data Availability Statement

Data are available in the Eurostat’s and FAOSTAT’s databases.

Conflicts of Interest

The authors declare no conflict of interest.

References

  1. United Nations. World Population Prospects 2019: Highlights; Department of Economic and Social Affairs, Population Division (ST/ESA/SER.A/423): New York, NY, USA, 2019; p. 143. [Google Scholar]
  2. Saunders, J.T.; Adenauer, M.; Brooks, J. Analysis of long-term challenges for agricultural markets. OECD Food Agric. Fish. Pap. 2019, 131, 42. [Google Scholar] [CrossRef]
  3. Van Meijl, H.; Havlik, P.; Lotze-Campen, H.; Stehfest, E.; Witzke, H.; Perez Dominguez, I.; Bodirsky, B.; van Dijk, M.; Doelman, J.; Fellmann, T.; et al. Challenges of Global Agriculture in a Climate Change Context by 2050 (AgCLIM50); Publications Office of the European Union: Luxembourg, 2017; p. 70. [Google Scholar] [CrossRef]
  4. McCormick, K.; Kautto, N. The bioeconomy in Europe: An overview. Sustainability 2013, 5, 2589–2608. [Google Scholar] [CrossRef] [Green Version]
  5. VERAM. Vision for Raw Materials in Europe and for Europe Part II. Report on Raw Material Research and Innovation Vision for 2050 European Union’s, Project Funded from the European Union’s Horizon 2020 Research and Innovation Programme Under Grant Agreement No 690388 H2020, Ref. Ares(2018)4131269-06/08/2018.2018. 2018. Available online: http://veram2050.eu/wp-content/uploads/2018/10/D4.2-Report-on-raw-material-research-and-innovation-vision-for-2050.pdf (accessed on 15 October 2021).
  6. European Commission. A Sustainable Bioeconomy for Europe: Strengthening the Connection Between Economy, Society and the Environment (COM(2018) 673); Publications Office of the European Union: Brussels, Belgium, 2018; p. 14. [Google Scholar]
  7. Cristóbal, J.; Matos, C.T.; Aurambout, J.P.; Manfredi, S.; Kavalov, B. Environmental sustainability assessment of bioeconomy value chains. Biomass Bioenergy 2016, 89, 159–171. [Google Scholar] [CrossRef]
  8. Scarlat, N.; Dallemand, J.F.; Monforti-Ferrario, F.; Nita, V. The role of biomass and bioenergy in a future bioeconomy: Policies and facts. Environ. Dev. 2015, 15, 3–34. [Google Scholar] [CrossRef]
  9. European Commission. Innovating for Sustainable Growth: A Bioeconomy for Europe. Communication from the Commission to the European Parliament, the Council, the European Economic and Social Committee and the Committee of the Regions; European Commission: Brussels, Belgium, 2012; p. 9. [Google Scholar]
  10. European Commision. A Vision for the European Industry Until 2030: Final Report of the Industry 2030 High Level Industrial Roundtable; Publications Office of the European Union: Luxembourg, 2019; p. 48. [Google Scholar]
  11. European Commission. Closing the Loop—An EU Action Plan for the Circular Economy; European Commission: Brussels, Belgium, 2015; p. 21. [Google Scholar]
  12. European Commission. Accelerating Clean Energy Innovation; European Commission: Brussels, Belgium, 2016. [Google Scholar]
  13. Joint Research Centre. Bioeconomy Report 2016; JRC Scientific and Policy Report; Joint Research Centre: Brussels, Belgium, 2017; p. 124. [Google Scholar]
  14. Material Economics. EU Biomass Use in a Net-Zero Economy—A Course Correction for EU Biomass; Material Economics Sverige AB: Stockholm, Sweeden, 2021. [Google Scholar]
  15. OECD. Global Material Resources Outlook to 2060: Economic Drivers and Environmental Consequences; OECD Publishing: Paris, France, 2018; p. 214. [Google Scholar]
  16. UNEP. The Use of Natural Resources in the Economy: A Global Manual on Economy Wide Material Flow Accounting; UNEP: Nairobi, Kenya, 2021; p. 143. [Google Scholar]
  17. Carus, M.; Dammer, L. Food or non-food: Which agricultural feedstocks are best for industrial uses? Ind. Biotechnol. 2013, 9, 171–176. [Google Scholar] [CrossRef]
  18. Ramos, J.L.; García-Lorente, F.; Valdivia, M.; Duque, E. Green biofuels and bioproducts: Bases for sustainability analysis. Microb. Biotechnol. 2017, 10, 1111–1113. [Google Scholar] [CrossRef] [Green Version]
  19. Budzianowski, W.M. High-value low-volume bioproducts coupled to bioenergies with potential to enhance business development of sustainable biorefineries. Renew. Sustain. Energy Rev. 2017, 70, 793–804. [Google Scholar] [CrossRef]
  20. Schoenung, S.; Efroymson, R.A. Algae Production from Wastewater Resources: An Engineering and Cost Analysis; Oak Ridge National Lab (ORNL): Oak Ridge, TN, USA, 2018; p. 11. [Google Scholar]
  21. Moorkens, E.; Meuwissen, N.; Huys, I.; Declerck, P.; Vulto, A.G.; Simoens, S. The market of biopharmaceutical medicines: A snapshot of a diverse industrial landscape. Front. Pharmacol. 2017, 8, 12. [Google Scholar] [CrossRef] [PubMed] [Green Version]
  22. Santos, N.V.D.; de Carvalho Santos-Ebinuma, V.; Pessoa, A., Jr.; Pereira, J.F.B. Liquid–liquid extraction of biopharmaceuticals from fermented broth: Trends and future prospects. J. Chem. Technol. Biotechnol. 2017, 93, 1845–1863. [Google Scholar] [CrossRef]
  23. Smith, G.O. Theory and Practice of National Self-Sufficiency in Raw Materials. Proc. Acad. Political Sci. City N. Y. 1926, 12, 116–122. [Google Scholar] [CrossRef]
  24. Kettunen, L. Self-sufficiency of agriculture in Finland in 1970–1983. Agric. Food Sci. 1986, 58, 143–150. [Google Scholar] [CrossRef]
  25. Clapp, J. Food self-sufficiency: Making sense of it, and when it makes sense. Food Policy 2017, 66, 88–96. [Google Scholar] [CrossRef] [Green Version]
  26. Spero, J.E. Energy self-sufficiency and national security. Proc. Acad. Political Sci. 1973, 31, 123–136. [Google Scholar] [CrossRef]
  27. Welfle, A.; Gilbert, P.; Thornley, P. Increasing biomass resource availability through supply chain analysis. Biomass Bioenergy 2014, 70, 249–266. [Google Scholar] [CrossRef]
  28. Saghir, M.; Zafar, S.; Tahir, A.; Quadi, M.; Siddique, B.; Homung, A. Unlocking the Potential of Biomass Energy in Pakistan. Front. Energy Res. 2019, 7, 1–18. [Google Scholar] [CrossRef]
  29. Benti, N.E.; Gurmesa, G.S.; Argaw, T.; Aneseyee, A.B.; Gunta, S.; Kassahun, G.B.; Aga, G.S.; Asfaw, A.A. The current status, challenges and prospects of using biomass energy in Ethiopia. Biotechnol. Biofuels 2021, 14, 1–24. [Google Scholar] [CrossRef] [PubMed]
  30. Fragkou, M.C.; Vincent, T.; Gabarelli, X. An ecosystemic approach for assessing the urban water self-sufficiency potential: Lessons from the Mediterranean. Urban Water J. 2015, 13, 663–675. [Google Scholar] [CrossRef]
  31. Sarabi, S.G.; Rahnama, M.R. From self-sufficient provision of water and energy to regenerative urban development and sustainability: Exploring the potentials in Mashhad City, Iran. J. Environ. Plan. Manag. 2021, 64, 2459–2480. [Google Scholar] [CrossRef]
  32. Østergård, H.; Markussen, M.V. Energy Self-sufficiency from an Emergy Perspective Exemplified by a Model System of a Danish Farm Cooperative. In Proceedings of the 6th Biennial Emergy Research Conference, The Center for Environmental Policy, Gainesville, FL, USA, 14–16 January 2010; Brown, M.T., Sweeney, S., Eds.; University of Florida: Gainesville, FL, USA, 2010; pp. 311–322. [Google Scholar]
  33. Martin, G.; Magne, M.A. Agricultural diversity to increase adaptive capacity and reduce vulnerability of livestock systems against weather variability—A farm-scale simulation study. Agric. Ecosyst. Environ. 2015, 199, 301–311. [Google Scholar] [CrossRef]
  34. Lebacq, T.; Baret, P.V.; Stilmant, D. Role of input self-sufficiency in the economic and environmental sustainability of specialised dairy farms. Animal 2015, 9, 544–552. [Google Scholar] [CrossRef] [PubMed] [Green Version]
  35. Soteriades, A.D.; Stott, A.W.; Moreau, S.; Charroin, T.; Blanchard, M.; Liu, J.; Faverdin, P. The relationship of dairy farm eco-efficiency with intensification and self-sufficiency. Evidence from the French dairy sector using life cycle analysis, data envelopment analysis and partial least squares structural equation modelling. PLoS ONE 2016, 11, 21. [Google Scholar] [CrossRef] [PubMed]
  36. Gaudino, S.; Reidsma, P.; Kanellopoulos, A.; Sacco, D.; van Ittersum, M.K. Integrated assessment of the EU’s Greening reform and feed self-sufficiency scenarios on dairy farms in Piemonte, Italy. Agriculture 2018, 8, 137. [Google Scholar] [CrossRef] [Green Version]
  37. Jouan, J.; Ridier, A.; Carof, M. Legume production and use in feed: Analysis of levers to improve protein self-sufficiency from foresight scenarios. J. Clean. Prod. 2020, 274, 123085. [Google Scholar] [CrossRef]
  38. Masi, M.; Vecchio, Y.; Pauselli, G.; di Pasquale, J.; Adinolfi, F. A typological classification for assessing farm sustainability in the Italian bovine dairy sector. Sustainability 2021, 13, 7097. [Google Scholar] [CrossRef]
  39. Kimming, M.; Sundberg, C.; Nordberg, Å.; Baky, A.; Bernesson, S.; Norén, O.; Hansson, P.A. Life cycle assessment of energy self-sufficiency systems based on agricultural residues for organic arable farms. Bioresour. Technol. 2011, 102, 1425–1432. [Google Scholar] [CrossRef]
  40. Vijay, V.; Subbarao, P.M.; Chandra, R. An evaluation on energy self–sufficiency model of a rural cluster through utilization of biomass residue resources: A case study in India. Energy Clim. Change 2021, 2, 100036. [Google Scholar] [CrossRef]
  41. Algieri, A.; Andiloro, S.; Tamburino, V.; Zema, D.A. The potential of agricultural residues for energy production in Calabria (Southern Italy). Renew. Sustain. Energy Rev. 2019, 104, 1–14. [Google Scholar] [CrossRef]
  42. Terrapon-Pfaff, J.C. Linking energy-and land-use systems: Energy potentials and environmental risks of using agricultural residues in Tanzania. Sustainability 2012, 4, 278–293. [Google Scholar] [CrossRef] [Green Version]
  43. Harchaoui, S.; Chatzimpiros, P. Can agriculture balance its energy consumption and continue to produce food? A framework for assessing energy neutrality applied to French agriculture. Sustainability 2018, 10, 4624. [Google Scholar] [CrossRef] [Green Version]
  44. FAO. FAO Statistical Pocketbook 2012—World Food and Agriculture. Available online: http://www.fao.org/docrep/015/i2490e/i2490e00.htm (accessed on 5 September 2019).
  45. Luan, Y.; Cui, X.; Ferrat, M. Historical trends of food self-sufficiency in Africa. Food Secur. 2013, 5, 393–405. [Google Scholar] [CrossRef] [Green Version]
  46. EUROSTAT. Economy-Wide Material Flow Accounts, Handbook 2018 Edition; Publications Office of the European Union: Luxembourg, 2018; p. 142. [Google Scholar]
  47. Krausmann, F.; Erb, K.H.; Gingrich, S.; Lauk, C.; Haberl, H. Global Patterns of Socioeconomic Biomass Flows in the Year 2000: A Comprehensive Assessment of Supply, Consumption and Constraints. Ecol. Econ. 2008, 65, 471–487. [Google Scholar] [CrossRef]
  48. Mayer, A.; Kaufmann, L.; Kalt, G.; Matej, S.; Theurl, M.C.; Morais, T.G.; Leip, A.; Erb, K.H. Applying the Human Appropriation of Net Primary Production framework to map provisioning ecosystem services and their relation to ecosystem functioning across the European Union. Ecosyst. Serv. 2021, 51, 101344. [Google Scholar] [CrossRef]
  49. OECD. Environment Database—Material Resources: Concepts and Classifications. Available online: https://stats.oecd.org/# (accessed on 16 August 2019).
  50. Leitão, N. GMM Estimator: An Application to Intraindustry Trade. J. Appl. Math. 2012, 2012, 1–12. [Google Scholar] [CrossRef]
  51. Das, D.K. Determinants of current account imbalance in the global economy: A dynamic panel analysis. J. Econ. Struct. 2016, 5, 2–24. [Google Scholar] [CrossRef] [Green Version]
  52. Matuzeviciute, K.; Butkus, M.; Karaliute, A. Do Technological Innovations Affect Unemployment? Some Empirical Evidence from European Countries. Economies 2017, 48, 48. [Google Scholar] [CrossRef] [Green Version]
  53. Brañas-Garza, P.; Bucheli, M.; García-Muñoz, T. Dynamic Panel Data: A Useful Technique in Experiments. 2011. Available online: http://www.ugr.es/~teoriahe/RePEc/gra/wpaper/thepapers10_22.pdf (accessed on 19 November 2021).
  54. Vitunskiene, V.; Ramanauske, N. Spatial Concentration of Biomass Production Sector in the European Union. Current Analysis on Economics & Finance. 2019. Available online: https://mesford.ca/wp-content/uploads/2019/04/Spatial-Concentration-of-Biomass-Production-Sector-in-the-European-Union.pdf (accessed on 16 August 2019).
  55. Candel, J.J.L.; Breeman, G.E.; Stiller, S.J.; Termeer, C.J.A.M. Disentangling the consensus frame of food security: The case of the EU Common Agricultural Policy reform debate. Food Policy 2013, 44, 47–58. [Google Scholar] [CrossRef]
  56. Galli, A.; Halle, M.; Grunewald, N. Physical limits to resource access and utilisation and their economic implications in Mediterranean economies. Environ. Sci. Policy 2015, 51, 125–136. [Google Scholar] [CrossRef] [Green Version]
  57. Ratner, B. The Correlation Coefficient: Its Values Range Between +1/−1, Or Do They? J. Target. Meas. Anal. Mark. 2009, 18, 139–142. [Google Scholar] [CrossRef] [Green Version]
  58. Andersen, S.P.; Allen, B.; Domingo, G.C. Biomass in the EU Green Deal: Towards Consensus on the Use of Biomass for EU Bioenergy, (Policy Report); Institute for European Environmental Policy (IEEP): Brussels, Belgium, 2021; p. 69. [Google Scholar]
  59. Ji, X.; Liu, Y.; Meng, J.; Wu, X. Global supply chain of biomass use and the shift of environmental welfare from primary exploiters to final consumers. Appl. Energy 2020, 276, 115484. [Google Scholar] [CrossRef]
  60. Kalt, G.; Kaufmann, L.; Kastner, T.; Krausmann, F. Tracing Austria’s biomass consumption to source countries: A product-level comparison between bioenergy, food and material. Ecol. Econ. 2021, 188, 107129. [Google Scholar] [CrossRef]
  61. Welfle, A. Balancing growing global bioenergy resource demands-Brazil′s biomass potential and the availability of resource for trade. Biomass Bioenergy 2017, 105, 83–95. [Google Scholar] [CrossRef]
  62. Gough, C.; Garcia-Freites, S.; Jones, C.; Mander, S.; Moore, B.; Pereira, C.; Röder, M.; Vaughan, N.; Welfle, A. Challenges to the use of BECCS as a keystone technology in pursuit of 1.5 °C. Glob. Sustain. 2018, 1, 1–9. [Google Scholar] [CrossRef] [Green Version]
  63. Ying, H.P.; Phun Chien, C.B.; Yee Van, F. Operational management implemented in biofuel upstream supply chain and downstream international trading: Current issues in southeast Asia. Energies 2020, 13, 1799. [Google Scholar] [CrossRef] [Green Version]
  64. Henning, C.; Witzke, P. Economic and Environmental Impacts of the Green Deal on the Agricultural Economy: A Simulation Study of the Impact of the F2F-Strategy on Production, Trade, Welfare and the Environment Based on the CAPRI-Model. 2021. Available online: https://grain-club.de/fileadmin/user_upload/Dokumente/Farm_to_fork_Studie_Executive_Summary_EN.pdf (accessed on 15 December 2021).
  65. Bremmer, J.; Gonzalez-Martinez, A.; Jongeneel, R.; Huiting, H.; Stokkers, R. Impact Assessment Study on EC 2030 Green Deal Targets for Sustainable Food Production. 2021. Available online: https://edepot.wur.nl/555349 (accessed on 15 December 2021).
  66. Beckman, J.; Ivanic, M.; Jelliffe, J.L.; Baquedano, F.G.; Scott, S.G. Economic and Food Security Impacts of Agricultural Input Reduction Underthe European Union Green Deal’s Farm to Fork and Biodiversity Strategies; Agricultural Economic Reports; United States Department of Agriculture (USDA), Economic Research Service: Washington, DC, USA, 2020; p. 59. [Google Scholar] [CrossRef]
  67. Barreiro-Hurle, J.; Bogonos, M.; Himics, M.; Hristov, J.; Pérez-Domínguez, I.; Sahoo, A.; Salputra, G.; Weiss, F.; Baldoni, E.; Elleby, C. Modelling Environmental and Climate Ambition in the Agricultural Sector with the CAPRI Model; JRC121368; Publications Office of the European Union: Luxembourg, 2021. [Google Scholar] [CrossRef]
  68. Ladanai, S.; Vinterbäck, J. Global Potential of Sustainable Biomass for Energy; SLU Report 013; Department of Energy and Technology: Stockholm, Sweden, 2009; ISSN 1654-9406. [Google Scholar]
  69. Field, C.B.; Campbell, H.E.; Lobell, D.B. Biomass energy: The scale of the potential resource. Trends Ecol. Evol. 2008, 23, 65–72. [Google Scholar] [CrossRef] [PubMed]
  70. Vera, I.; Hilst, F.V.D.; Hoefnagels, R. Regional Specific Impacts of Biomass Feed-Stock Sustainability: D4.3 Report on Biomass Potentials and LUC—Related Environmental Impact; Utrecht University: Utrecht, The Netherlands, 2020; p. 70. [Google Scholar]
  71. Popp, J.; Lakner, Z.; Harangi-Rákos, M.; Fári, M. The effect of bioenergy expansion: Food, energy and environment. Renew. Sutainable Energy Rev. 2014, 32, 559–578. [Google Scholar] [CrossRef] [Green Version]
  72. WBA. Global Biomass Potential Towards 2035. 2016. Available online: http://www.worldbioenergy.org/uploads/Factsheet_Biomass%20potential.pdf (accessed on 15 December 2021).
Figure 1. Trends of the biomass extraction, consumption, and self-sufficiency in the EU-28. Source: Own composition based on the material flow accounts data from the Eurostat database.
Sustainability 14 01897 g001
Figure 2. Trends of the self-sufficiency in biomass groups and sub-groups in the EU-28. Notes: * including small amounts of non-edible biomass; SSR value presented by food and woody materials groups. Source: Own composition based on the material flow accounts data from the Eurostat database.
Sustainability 14 01897 g002
Figure 3. Self-sufficiency and import dependency relationship graph for biomass materials across the EU member states. Notes: In the whole sample of the EU−28 countries, a moderate negative correlation was found between the self-sufficiency and import dependency ratio (r = −0.62; correlation is significant at the 0.01 level (2-tailed)), a strong negative correlation was found between the self-sufficiency and import dependency ratio for food materials (r = −0.81; correlation is significant at the 0.01 level (2-tailed)), and a moderate negative correlation between the self-sufficiency and import dependency ratio for woody materials (r = −0.31; correlation is significant at the 0.01 level (2-tailed)). Source: Own composition based on the material flow accounts data from the Eurostat database. (a) Biomass materials (total); (b) food materials; (c) woody materials.
Sustainability 14 01897 g003
Table 1. Research variables.
VariablesExpected
Correlation a
Variable Description
Explained variableBiomass self-sufficiency ratio (B_SSR) -%Ratio between domestic extraction and domestic consumption.
Core
explanatory variable
Agricultural and forest land share, % (land)+ive%Ratio between the sum of both agricultural and forest land areas and the total land area (excluding area under inland waters and coastal waters).
Control
variables
Biomass domestic extraction per ha (biomas_extr) −ive/+iveRatio between biomass domestic extraction and the sum of both agricultural and forest land areas.
Share of bioenergy in renewable energy, % (bioen_renw)+ive%Ratio between bioenergy and primary production of total renewables.
Share of bioenergy in total primary energy production, % (bioen_prim)+ive%Ratio between bioenergy and total primary production.
Energy imports dependency, % (en_imp)−ive%Ratio between net import and gross available energy.
Biomass materials intensity, kg per GDP (PPS b) (biomas_int)+iveRatio between biomass direct inputs and GDP.
Resource productivity, GDP PPS per tonne (res_prod)−ive/+iveRatio between GDP and domestic material consumption.
Population density, persons per km2 (pop_dens)−iveRatio between the number of population and the land area.
Employment in total knowledge-intensive activities, % (empl_kia)−ive%Ratio between employment in total knowledge-intensive activities and total employment.
Notes: a Expected correlation with the explained variable; +ive stands for “positive”; −ive stands for “negative”; b PPS stands for purchasing power standard.
Table 2. Descriptive statistics.
VariableObservationsMeanSt. Dev.MinMax
B_SSR532103.0341.696.86417.19
land53276.8214.4729.2294.14
biomas_extr5325.804.191.4321.00
bioen_renw53067.1421.840.0099.92
bioen_prim53222.8520.590.0092.27
en_imp53255.5527.83−50.60104.14
biomas_int5320.260.140.060.97
res_prod5321.530.750.434.18
pop_dens532171.28245.8817.001548.30
empl_kia30835.366.6219.2060.40
Table 3. Temporal variation of the biomass self-sufficiency ratios in the EU countries.
Average 2016–2018
(SSR)
2000–20092010–2018±%p
SSR2SP Less SSR1SP
±%p
CTV2SP Less CTV1SP
Average (SSR1SP)Standard DeviationCoefficient of Temporal Variation (CTV1SP)Average (SSR2SP)Standard DeviationCoefficient of Temporal Variation (CTV2SP)
EU(28)97.996.10.770.898.20.560.62.1−0.2
LV Latvia225.2214.025.6712.0279.770.7425.365.813.3
EE Estonia183.9150.820.3113.5173.79.815.722.9−7.8
CZ Czechia157.0131.113.6310.4159.17.794.928.0−5.5
SI Slovenia147.5106.020.5619.4142.97.054.936.8−14.5
BG Bulgaria135.9109.76.435.9135.66.725.025.8−0.9
FI Finland126.2114.96.405.6124.03.272.69.0−2.9
HU Hungary123.7115.06.946.0125.86.194.910.8−1.1
HR Croatia123.5109.95.184.7122.36.085.012.50.3
LT Lithuania121.2109.52.372.2120.04.633.910.51.7
SK Slovakia117.1109.33.813.5114.36.345.55.02.1
RO Romania111.5100.12.322.3112.23.403.012.10.7
FR France110.9109.53.052.8111.41.161.01.9−1.8
SE Sweden110.7112.54.113.7110.53.192.9−2.0−0.8
PL Poland99.997.81.231.399.22.302.31.41.1
ES Spain96.688.12.412.796.21.281.38.1−1.4
DE Germany 94.2101.11.871.995.31.161.2−5.8−0.6
AT Austria91.898.32.542.693.11.902.0−5.2−0.5
DK Denmark88.989.52.923.391.73.083.42.30.1
IE Ireland88.293.70.961.090.82.713.0−2.92.0
EL Greece86.886.83.664.288.72.122.42.0−1.8
NL Netherlands84.683.13.824.681.82.913.6−1.4−1.0
UK United Kingdom79.180.91.461.879.91.602.0−0.90.2
PT Portugal78.583.83.544.281.62.983.6−2.2−0.6
IT Italy77.982.82.042.580.53.274.1−2.31.6
BE Belgium70.071.93.134.369.92.463.5−2.0−0.8
LU Luxembourg69.462.95.628.970.67.1910.27.71.2
CY Cyprus32.840.416.1540.037.75.4314.4−2.6−25.6
MT Malta15.021.13.5116.719.03.5218.5−2.01.8
Stand. deviation41.934.0--47.0----
Coefficient of spatial variation (CSV)39.834.3--43.7---9.4
Source: Own calculation based on the material flow accounts data from the Eurostat database.
Table 4. Estimation results of the model.
IIIIIIIV
l_B_SSR(-1)0.5724 ***
(0.0000)
0.5239 ***
(0.0000)
0.5011 ***
(0.0000)
0.5110 ***
(0.0000)
const1.9929 **
(0.0113)
1.8644 ***
(0.0004)
2.5105 ***
(0.0000)
1.7343 ***
(0.0027)
l_land0.2360 ***
(0.0000)
0.2999 ***
(0.0000)
0.2453 ***
(0.0000)
0.3083 ***
(0.0000)
l_biomas_extr−0.0523 ***
(0.0050)
−0.0416 ***
(0.0000)
l_bioen_renw0.1365 ***
(0.0009)
0.0577 **
(0.0180)
0.1954 ***
(0.0000)
0.0826 ***
(0.0002)
l_bioen_prim0.0357 ***
(0.0080)
0.0186
(0.2123)
−0.0127
(0.3090)
0.0050
(0.7510)
l_en_imp−0.2717 ***
(0.0009)
−0.2033 ***
(0.0022)
−0.1329 **
(0.0353)
−0.1408 **
(0.0000)
l_biomas_int 0.1166 ***
(0.0000)
0.0720 ***
(0.0012)
l_res_prod0.0169
(0.5860)
0.1186 ***
(0.0000)
l_pop_dens −0.1288 ***
(0.0000)
−0.0595 ***
(0.0000)
l_empl_kia−0.0800
(0.4050)
−0.0016
(0.9815)
−0.2380 ***
(0.0003)
−0.0249
(0.7221)
AR(2) test0.0233
(0.9814)
−0.0643
(0.9488)
0.3468
(0.7287)
0.2999
(0.7643)
Sargan test20.5052
(1.0000)
19.1705
(1.0000)
21.0238
(1.0000)
19.9745
(1.0000)
Number of countries27 a27 a27 a27 a
Number of observations270269273272
Notes: a Malta is not included because of a lack of some data. *** and ** indicate statistical significance at the 1%, 5%, and 10% significance level, respectively. z-values are presented in parentheses of estimates. p-values of AR(2) and Sargan tests are provided in parentheses. All estimations are two-step GMM-SYS.
Publisher’s Note: MDPI stays neutral with regard to jurisdictional claims in published maps and institutional affiliations.

