Article

Exploring the Impact of Green Walls on Occupant Thermal State in Immersive Virtual Environment

1
Department of Construction Management, Louisiana State University, Baton Rouge, LA 70803, USA
2
School of Plant, Environmental and Soil Sciences, Louisiana State University, Baton Rouge, LA 70803, USA
3
College of Art & Design, Louisiana State University, Baton Rouge, LA 70803, USA
*
Author to whom correspondence should be addressed.
Sustainability 2022, 14(3), 1840; https://doi.org/10.3390/su14031840
Submission received: 29 December 2021 / Revised: 31 January 2022 / Accepted: 2 February 2022 / Published: 5 February 2022
(This article belongs to the Special Issue Built Environment and Sustainability)

Abstract

:
Green walls have been used in built environments as a natural element to bring various benefits, thus improving human health and well-being. However, in conventional virtual environments, the visual connection with a green wall is the only way that this natural element could benefit humans. Unfortunately, the impact of such visual connection on human thermal perception is still not well understood. Thus, we conducted an experimental study with 40 participants comparing the thermal state of two virtual sessions: biophilic (a room with a green wall) and non-biophilic (the same room without a green wall). Both sessions were conducted in a climate chamber under a slightly warm condition (28.89 °C and 50% relative humidity). Participants’ thermal state, skin temperature, and heart rate data were collected. According to the results, participants’ thermal comfort and hand skin temperature were significantly different between the two sessions, and their mean skin temperature was statistically increased over time. The study suggests that before the extent to which the impact of visual stimuli (e.g., green walls) on thermal perception is fully understood, researchers may need to control visual and thermal stimuli separately when using them in immersive virtual environments. Furthermore, the virtual exposure time should be an important consideration when designing experimental procedures.

1. Introduction

Recently, immersive virtual environments (IVEs) have gained significant attention from the architectural, engineering, and construction (AEC) research communities because of the unique ability of IVEs to offer immersive experiences, including virtual natural elements [1,2]. In addition, researchers have applied IVEs to a range of research studies, such as occupant energy behavior [3], thermal comfort, and adaptive behavior [4]. Existing thermal comfort studies using mixed IVEs focus on external thermal stimuli such as temperature while most of the studies rely on the main feature of conventional IVEs, i.e., providing visual stimuli. For example, the human thermal state was explored under different temperatures provided by a climate chamber or evoked through body activity, while participants were exposed to the virtually simulated environments as visual stimuli [5,6,7]. Such studies ignore the potential influence of visual stimuli on thermal state, especially when studying biophilic design features. Moreover, these studies have shown that multiple types of stimuli, such as thermal, can be effectively simulated along with visual stimuli as the main feature of augmented IVEs.
The human perception of surrounding environments occurs through multisensory processing [8]. The multisensory interactions between different senses, such as thermal, visual, and acoustic senses, can affect humans’ environmental perception in a complex manner because the senses may affect each other. For example, thermal and visual comfort increases if noise decreases [9] or daylight may affect human thermal perception, so it needs to be considered in thermal comfort models [10,11]. In particular, previous IVE studies have shown that visual stimuli can change human physiological responses, including skin temperature [12,13] and heart rate [14]. Thus, such studies in virtual reality have identified a theoretical connection between visual stimuli and skin temperature and heart rate. Specifically, the visual perception of indoor environments can change the physiological responses of the body, affecting thermal state. However, the impact of certain visual stimuli on thermal state has not been fully explored. Therefore, when augmented IVEs are used to study human perceptions, it is necessary to first control some stimuli while studying the impact of others. In addition, the connection between thermal sensation and physiological responses has already been established in reality [15,16,17]. Thus, studies investigating the possible connection between visual and thermal senses in a virtual environment may also confirm the effectiveness of IVE applications.
In this study, the authors chose indoor green walls as an application case to investigate the impact of visual stimuli on thermoception in IVEs. Green walls refer to a vertical planting structure that includes living plants with a substrate and an irrigation system [18]. The choice has both practical and theoretical benefits. First, the integration of a green wall as a natural element in interior spaces can improve human connection with nature, according to the biophilia hypothesis [19], and bring a variety of benefits to the occupants through extending the advantages of natural elements into buildings [20], such as cooling effects [21,22], noise reduction [23,24], improved air quality [25,26,27], and enhanced human comfort and well-being [28,29]. Secondly, green walls may affect human thermal perception by lowering the environmental temperature [30] or by establishing a visual connection with nature that influences psychological and physiological processes [31]. A better understanding of how different stimuli impact thermal sensation individually can provide insights on the design of the green wall and the treatment designs involving visual and thermal stimuli. Therefore, green walls are a good candidate for studying stimuli in IVEs that can be simulated using thermal stimuli, visual stimuli, or a combination of both.

2. Research Questions and Hypothesis

In this study, the primary goal is to understand whether green walls as visual stimuli alone in a virtual environment will change participants’ thermal experience. The authors refer to a virtual environment with green walls as a biophilic environment and a virtual environment without green walls as a non-biophilic environment. To achieve the goal, the authors designed a research study comparing participants’ thermal experience states and physiological responses in the biophilic and non-biophilic environments. In addition, the authors investigated the impact of the time exposed to virtual environments on the thermal state of participants in both environments. Accordingly, we are looking for answers to the following research questions:
  • Was the thermal experience significantly different between biophilic and non-biophilic virtual environments?
  • Was the thermal experience significantly different between the time point when the head-mounted display (HMD) was put on and the time point when the experiment was finished?
The first question was intended to explore if the visual connection with green walls alone altered participants’ thermal experience. The second question investigated the changes of the thermal experience over the different time points in each environment. To answer these questions, the authors used two types of variables to evaluate participants’ thermal experience. The first type was the thermal state votes (V (x)), including three variables: sensation (V(s)), comfort (V(c)), and acceptability (V(a)). The second type included the physiological responses (PR (x)) associated with the thermal states of participants: skin temperature (PR (st)), heart rate (PR (hr)), and the ratio between low and high frequencies (PR (f)) resulting from heart rate variability. Accordingly, the following hypotheses were defined by the authors:
  • Participants’ thermal state votes and physiological responses did not differ significantly between the two different virtual environments (biophilic and non-biophilic).
  • Thermal state votes:
Null Hypothesis, H0: V (x) = V’ (x)
Alternate Hypothesis, H1: V (x) ≠ V’ (x)
Where, V(x) is the thermal votes of each type in the biophilic environment, including sensation (V(s)), comfort (V(c)), or acceptability (V(a)); and V’(x) is the thermal votes of each type in the non-biophilic environment, including sensation (V’(s)), comfort (V’(c)), or acceptability (V’(a)).
  • Physiological responses:
Null Hypothesis, H0: PR(x) = PR’(x)
Alternate Hypothesis: H1: PR(x) ≠ PR’ (x)
Where, PR(x) is the physiological responses in the biophilic environment, including skin temperature (PR (st)), heart rate (PR (hr)), and LF/HF ratio (PR(f)); and PR’(x) is the physiological responses in the non-biophilic environment, including skin temperature (PR’(st)), heart rate (PR’(hr)), and LF/HF ratio (PR’(f)).
2.
Participants’ thermal state votes and physiological responses did not differ significantly between two time points, i.e., time point 1 (TP1, when the HMD was put on), and time point 2 (TP2, when the experiment was finished) in the biophilic or non-biophilic environments.
  • Thermal state votes:
Null Hypothesis, H0: V (x) = V’(x)
Alternate Hypothesis, H1: V (x) ≠ V’(x)
Where, V(x) is the thermal votes of each type at time point 1 in the biophilic or non-biophilic environment, including sensation (V(s)), comfort (V(c)), or acceptability (V(a)); and V’(x) is the thermal votes of each type at time point 2 in the biophilic or non-biophilic environments, including sensation (V’(s)), comfort (V’(c)), or acceptability (V’(a)).
  • Physiological responses:
Null Hypothesis, H0: PR(x) = PR’(x)
Alternate Hypothesis, H1: PR (x) ≠ PR’(x)
Where, PR(x) is the physiological responses at time point 1 in the biophilic or non-biophilic environments, including skin temperature (PR (st)), heart rate (PR (hr)), and LF/HF ratio (PR (f)); and PR’(x) is the physiological responses at time point 2 in the biophilic or non-biophilic environment, including skin temperature (PR’(st)), heart rate (PR’(hr)), and LF/HF ratio (PR (f)).
To test these hypotheses, the authors conducted two main statistical analyses with the data accordingly:
  • Between sessions: a comparative analysis between biophilic and non-biophilic sessions to test the first hypothesis.
  • Within sessions: a comparative analysis in each session between the two time points to test the second hypothesis.

3. Research Method

3.1. The Participants

Upon approval of the experimental protocol by the Instructional Review Board, 40 healthy adults, mostly graduate and undergraduate students, participated in this study during the summer of 2021. The sample size was determined to meet the minimum sample size required (n = 34) with power 0.8, according to the G*Power analysis. Participants were informed of the experiment via recruitment flyers distributed in campus buildings. After receiving an email from interested participants, a consent form, including the brief information on the inclusion/exclusion criteria, was sent to the participants for their signature. Then, the participants voluntarily signed up for the two-hour experiment and were paid $30 as compensation. The list of the criteria for inclusion and exclusion is presented in Table 1.

3.2. Climate Chamber

The testing environment for both virtual sessions was a climate chamber on the main campus of Louisiana State University. A wide range of environmental conditions, including indoor air quality, temperature (15 °C to 32 °C), and relative humidity (40–90%), could be simulated and controlled by the climate chamber in order to conduct different thermal comfort-related experiments. The HVAC system of the chamber room is equipped with various sensors, such as temperature and humidity sensors, for controlling and monitoring the environmental conditions.
The climate chamber has three rooms: a testing room, a control room, and a mechanical room (Figure 1). The size of the testing room is about 4.2 × 3.2 × 2.7 m (L × W × H). In both sessions, the temperature and relative humidity were set to 28.89 °C and 50%, respectively. The authors used this slightly warm condition to better observe the capability of the green wall in improving the thermal state of participants.

3.3. Environmental Simulation and IVE Apparatus

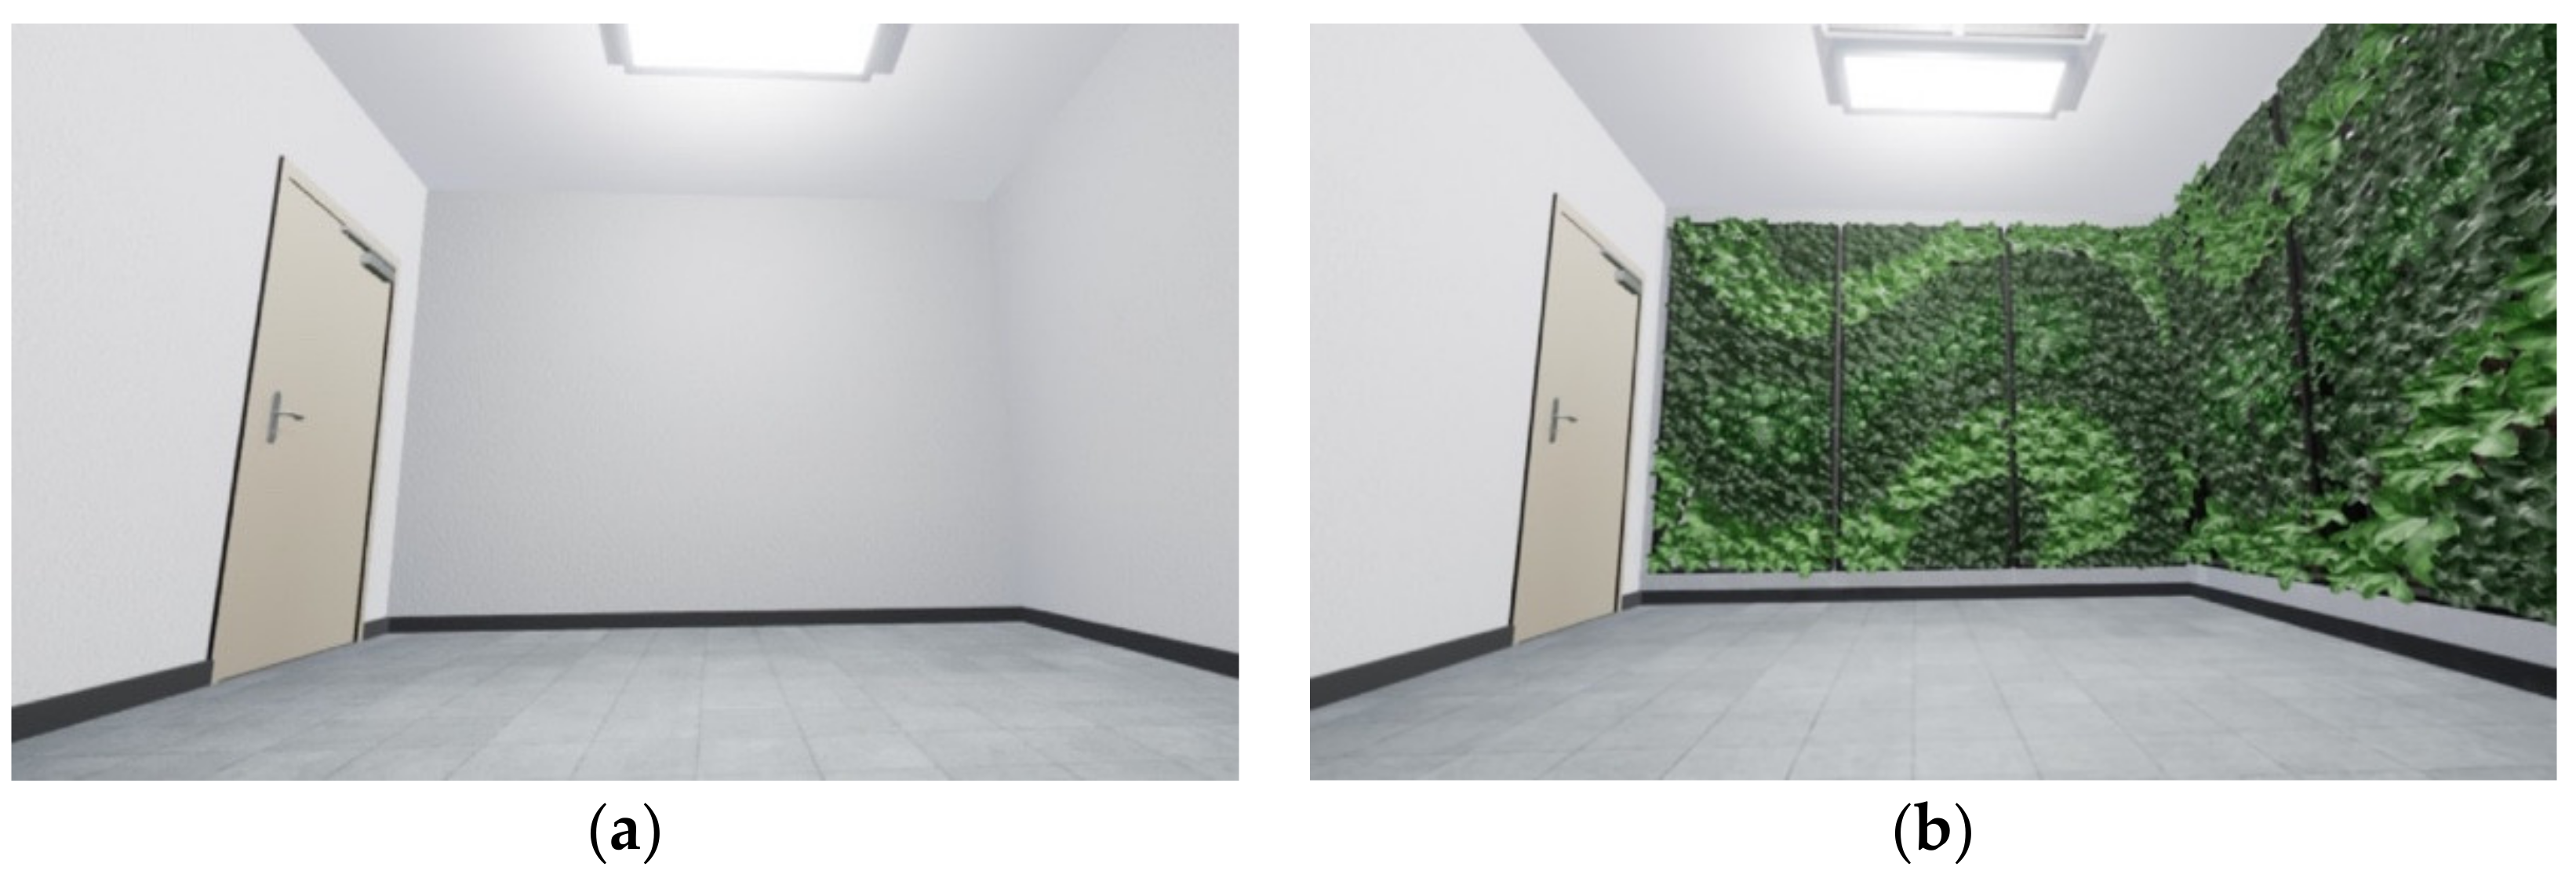
To test the participants’ thermal state after facing the green wall, the authors simulated two experimental sessions, non-biophilic and biophilic, both in virtual environments. The non-biophilic session was referred to as NBS, and the biophilic session was referred to as BS. The experimental procedure included two sessions, and each applied with one of these settings: the NBS session had no furniture in the interior space of the virtual testing room (Figure 2), and the BS session was created by adding green walls to two sidewalls of the same virtual room (Figure 2).
Both environments were rendered during the experiment using Unreal Engine, and participants experienced them using an HMD device. Before the experiment, participants had a chance to familiarize themselves with the environments before the experiment. Two HMD headsets were used in this experiment. The HTC-Vive, which supports a resolution of 2160 × 1200 on dual-AMOLED panels of 91 mm with a refresh rate of 90 Hz and a field of view of 110-degrees, was used for the experimental session. The HTC Vive-Pro, with a dual-OLED display supporting a resolution of 2880 × 1600, was used for the trial session. In addition, dual cameras on the front with a 90 Hz refresh rate helped to monitor the hands’ movements.

3.4. Physiological Measures

3.4.1. Skin Temperature

To measure skin temperature, the authors used temperature sensors known as Vernier surface with an exposed thermistor that results in an extremely short response time. The real-time data was collected using Logger Pro software. Since the human brain is constantly regulating the skin temperature to keep the body temperature fixed, the mean skin temperature measures the body’s reaction to the ambient environment [32]. Thus, researchers collected the mean skin temperature to evaluate thermal state [33,34]. According to the equation from ISO 9886 [35], the mean skin temperature under the warm condition was calculated using the following formula based on the temperature collected from four body locations:
tsk = 0.28 tneck + 0.28 tscapula +0.16 t hand+ 0.28 tshin,
where, tsk is the mean skin temperature and tneck, tscapula, t hand, and tshin are the temperatures measured from the back of the neck, the right scapula, the left hand, and the right shin, respectively.

3.4.2. Heart Rate and LF/HF Ratio

Since heart rate (HR) is highly associated with the metabolic rate of the body, which affects thermal sensation [36], the participants’ heart rates were recorded during the experiment using POLAR Ft7, a wireless heart rate monitor with electrodes. The sensor data were recorded using HRV Logger. Heart rate variability (HRV) was recorded by the same device as the HR. HRV was also considered in this study, as there is a connection between thermal comfort and HRV [17]. Heart rate variability describes the changes of adjacent heartbeats in the time intervals required to adjust the operations needed to adapt to environmental challenges [37]. The LF/HF ratio resulting from an HRV analysis can be used to assess thermal comfort level. This ratio was reported to be significantly higher in thermal discomfort situations [17].

3.5. The Questionnaires

In this study, the questionnaire consisted of two sections. All survey questions were created using the online survey software Qualtrics (www.qualtrics.com (accessed on 5 November 2021)).
  • Demographic and general information: The demographic questionnaire included questions regarding the socio-demographic characteristics of participants, including age, gender, race, birth, raised location, the last five years’ living place, education, occupation, and household. The general questionnaire was designed to acquire necessary information that might have an impact on the thermal comfort states, including body weight and height, food intake within the past hour, beverage intake within the past hour, cigarette use within the past hour, alcohol intake within the past 12 h, intense physical activity within the past 12 h, departure location (off-campus, on-campus, in the building), mode of travel (walking, cycling, motorized means), and menstrual cycle. Participants filled out this survey during the pre-experiment session before entering the experimental BS and NBS sessions.
  • Thermal state evaluation: The thermal state of the participants was measured using the thermal sensation, thermal comfort, and thermal acceptability votes. Participants’ self-reported votes of thermal sensation were reported on the ASHRAE Standard 55 Thermal Comfort, a 7-point Likert scale [38,39]. Thermal sensation was evaluated by this range of scales: “+3, +2, +1, 0, −1, −2, and −3” referring to “Hot, Warm, Slightly Warm, Neutral, Slightly Cool, Cool, and Cold,” respectively. Thermal comfort was evaluated by a different range of scales: “+3, +2, +1, −1, −2, and −3” referring to “Very Comfortable, Comfortable, Slightly Comfortable, Slightly Uncomfortable, Uncomfortable, and Very Uncomfortable,” respectively [40]. Finally, the overall thermal acceptability of the environment was determined through a binary scale consisting of two answers: “-1 or +1,” representing “Acceptable” or “Unacceptable,” respectively, similar to the one in Ref [41].

3.6. Experimental Design and Procedure

Before starting the experiments, the authors conducted an initial test on the validity of the virtual model by asking four participants to each fill in two questionnaires: the Igroup Presence questionnaire (IPQ) [42,43] and the Simulator Sickness Questionnaire (SSQ) [44]. The IPQ included 14 items categorized into four sub-measures, and the final score of each category ranged from 20 to 100. The results from the IPQ (general presence = 80, spatial presence = 75, involvement = 57.5, and experienced realism = 55) were higher than reported studies [42,43], suggesting that the presence of the virtual model is valid. In addition, the total cybersickness score (24.31) was within the acceptable range [45].
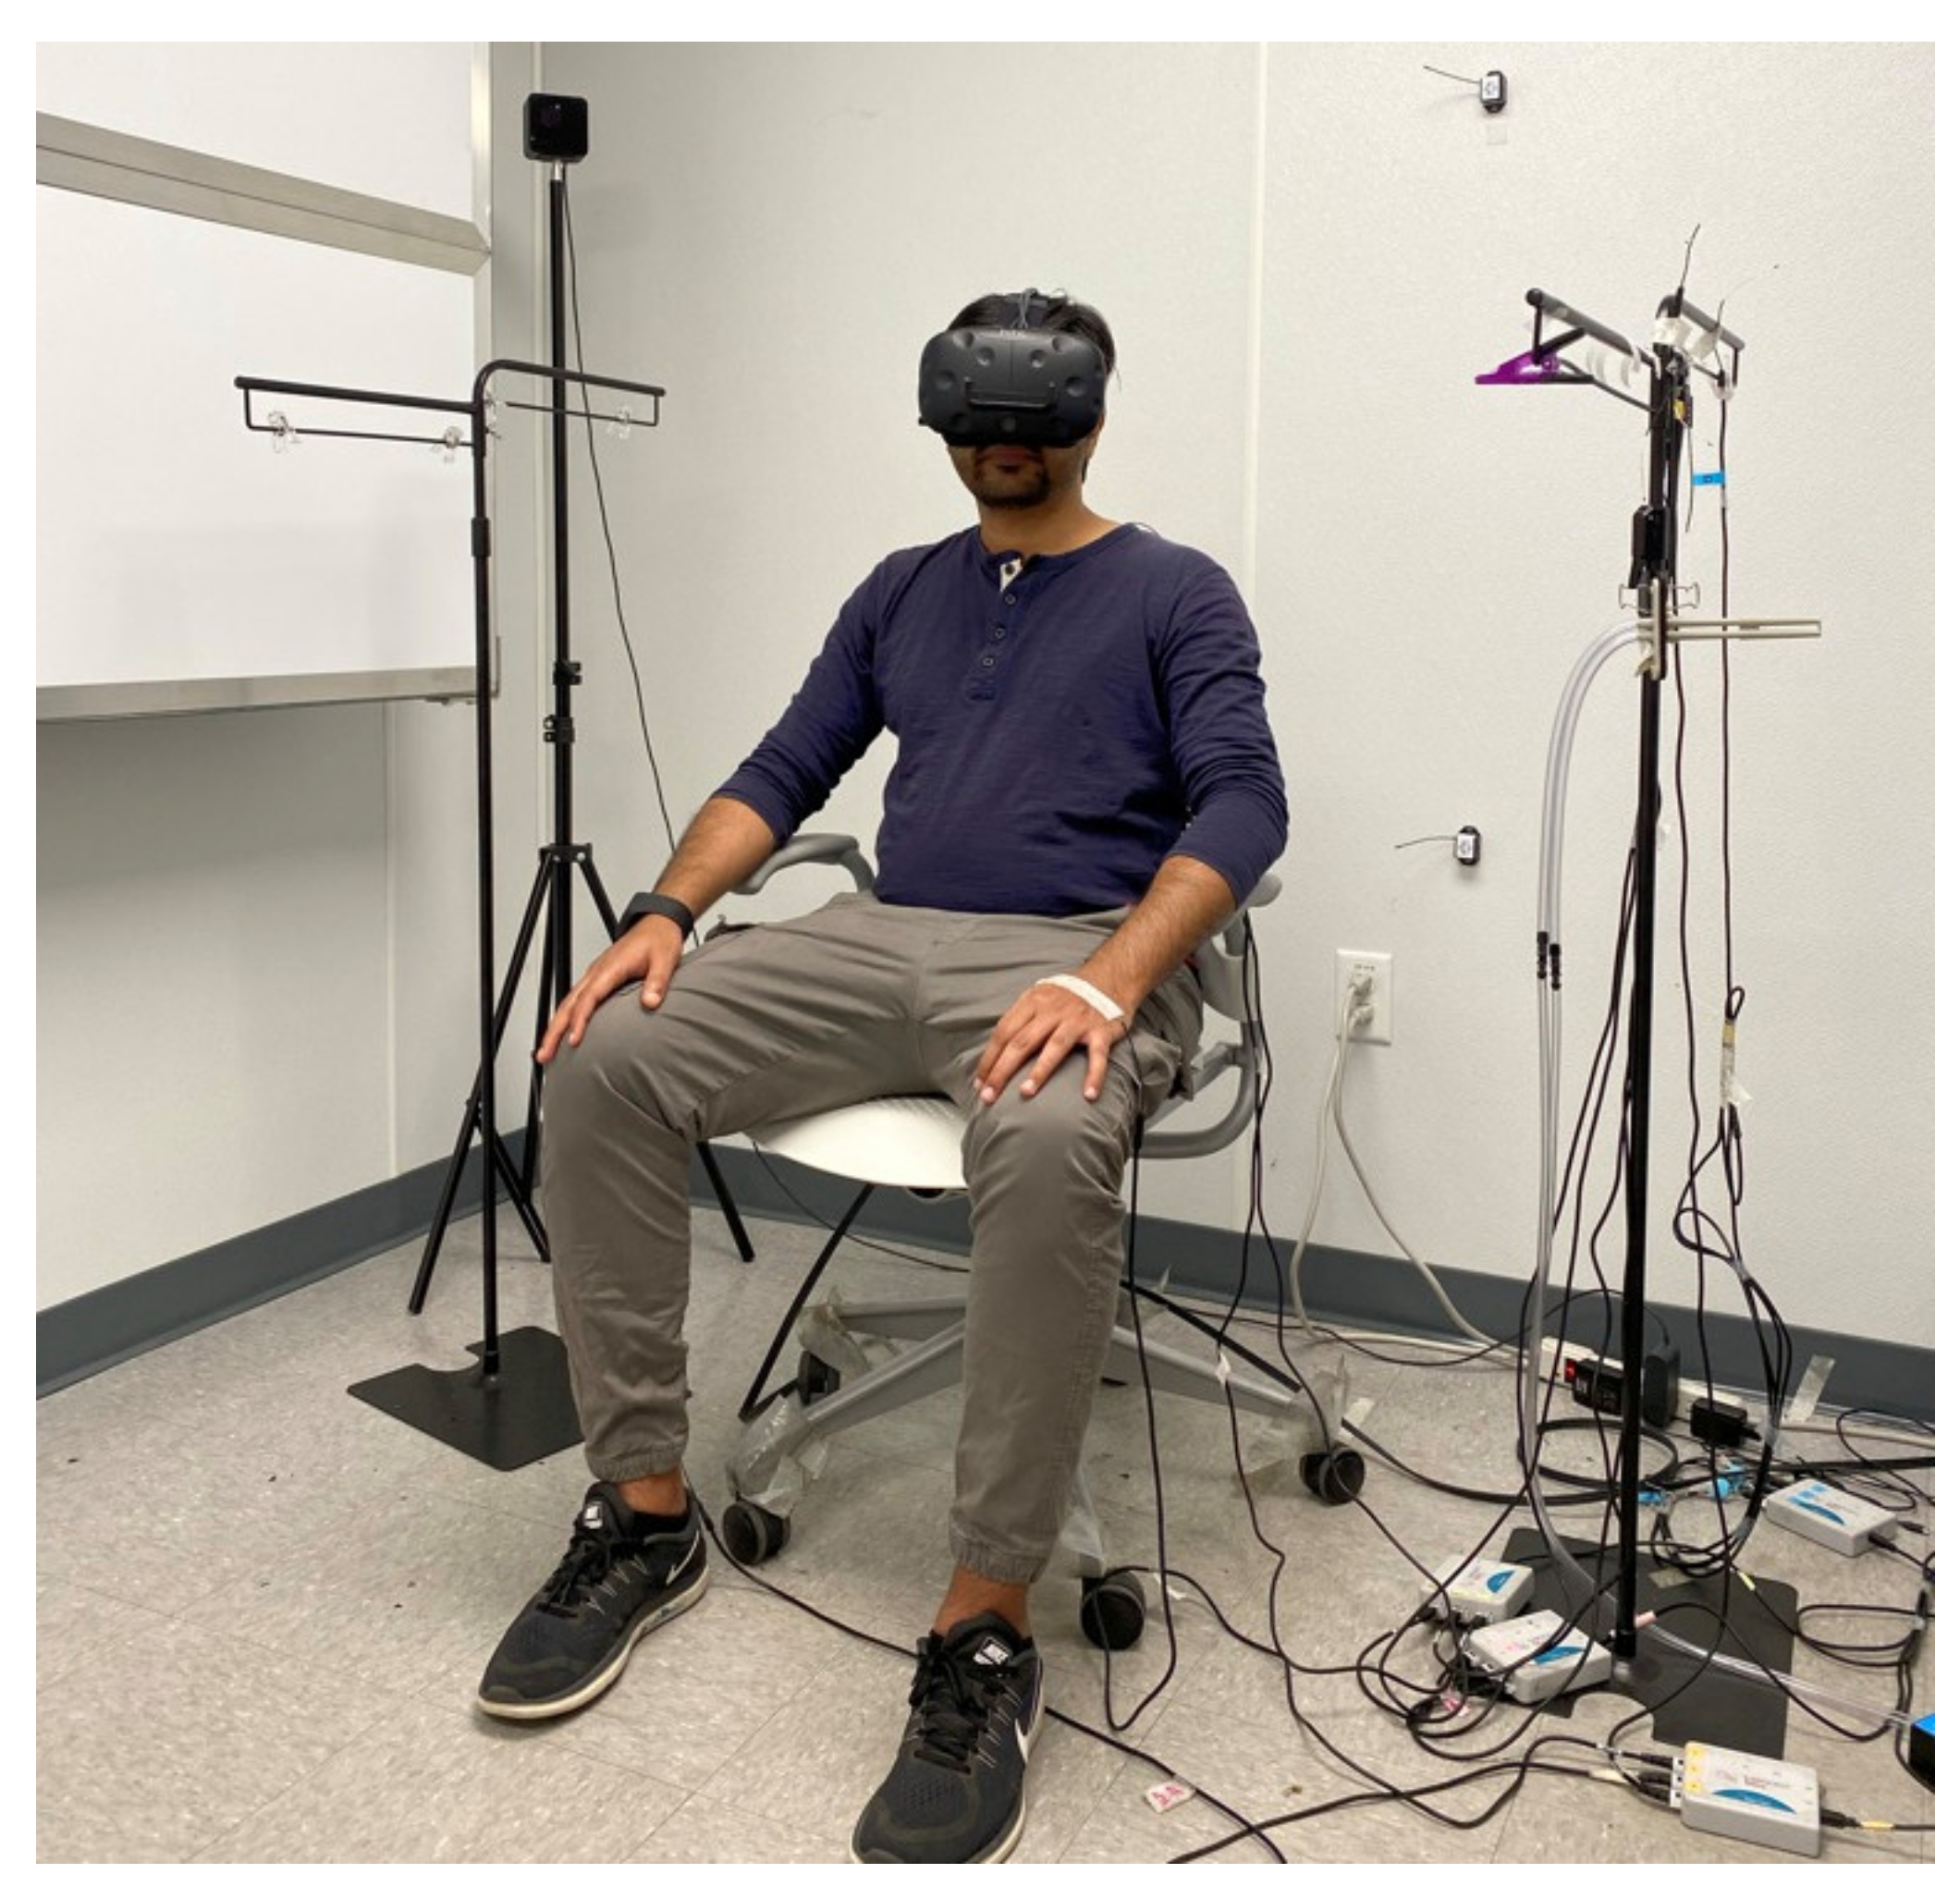
The authors used a within-subject design for this study, because individual human differences, such as gender, may affect thermal comfort and need to be considered as an important variance [46]. All 40 participants participated in both virtual experimental sessions in one visit with a 20-min break period between sessions. Participants had been informed of the clothing requirements, including lightweight pants and a shirt or T-shirt having long sleeves, before the experiment. Moreover, during this study, the participants’ activity was sedentary, and they were seated in a chair during the entire virtual exposure (Figure 3).
The experimental procedure included five steps (Figure 4):
Step 1.
Prior to the experiment: Participants had to complete the demographic and general questionnaires and sign the consent form.
Step 2.
The pre-experiment session (20 min): The height and weight of the participants were measured, and the participants completed the questionnaire about the participant’s condition on the experiment day. Participants also had a chance to familiarize themselves with the virtual environments by exploring them in the control room before the experiment.
Step 3.
The first and second session (10 min): After the pre-experiment session, participants were invited to enter the testing room and be seated in a chair. After attaching the temperature sensors, participants wore an HMD headset for about 10 min: 3 min of filling out thermal state questionnaire and 7 min of freely watching the virtual environments, whether BS or NBS. According to the literature, participants’ physiological states return to the baseline after 7~8 min of habituation in a virtual environment [47].
Step 4.
Break (20 min): Between the two sessions of the experiment, there was a 20-min break in the control area.

3.7. Data Collection and Processing

The demographic and general questionnaires were filled out by participants before the main session of the experiment. Two statistical analyses have been conducted according to the hypotheses. Thus, the following procedures were followed to collect data for each type of analysis:
  • Between sessions: The thermal state questionnaire (TSQ), skin temperature, and heart rate of participants after experiencing the virtual environment for 7 min was compared between the BS and the NBS (Figure 5).
  • Within sessions: To test the impact of virtual exposure time on thermal state, the following procedure was followed to collect and process the data:
Thermal state questionnaire: The thermal state questionnaire was asked of the participants at two time points: TP1, after attaching the body temperature and heart rate sensors and putting on the VR headset; and TP2, after 7 min of freely watching the virtual environment (Figure 6). In addition, participants’ thermal state was examined once the participants entered the chamber’s room and were seated, at TP0. This time point was designed to ensure that participants’ thermal states before experiencing the virtual environment were comparable in both the BS and the NBS. Thus, participants reported their thermal state of the same real environment, the testing room, at the beginning of each session. Using the Wilcoxon test, Table 2 compares the thermal state of the BS and the NBS at TP0. The test results show that there was no significant difference over all three levels of the thermal state. Additionally, the mean thermal sensation was close to 1 in both sessions, indicating that the participants reported that the slightly warm condition that was consistent with the design of the study.
The next two time points, TP1 and TP2, occurred while participants were experiencing different virtual environments according to the session design. The data collected from these time points could help to detect the impact of exposure time (7 min) on the thermal state in virtual environments.
Physiological measures: The local skin temperature, mean skin temperature, and heart rate data were split according to the two time points when the thermal questionnaires were asked during the virtual exposures. Figure 6 shows the time point in the real environment (TP0) and the two time points (TP1 and TP2) when thermal state data, skin temperatures, and heart rate data were collected.

4. Data Analysis and Results

In this study, two types of statistical tests were used according to the types of variables. The authors employed a two-tailed Wilcoxon Sign Rank test fitted for analyzing the qualitative data and ordinally scaled parameters, such as thermal state votes, in this study. A two-tailed pairwise t-test was applied to analyze continuous parameters such as physiological responses [48]. Before conducting any analyses, the authors employed a sample size analysis to detect its potential impact. Several factors may influence the analysis with particular sample sizes, such as significance level and the sample mean differences between the BS and the NBS. The sample mean difference can be determined through the power analysis formula, considering 0.05 as a significant level and 0.8 as a statistical power [49].
Table 3 shows the required sample size for Wilcoxon tests to differentiate between the BS and the NBS, with 0.05 as a significance level and 0.8 as a statistical power. For instance, if the sample mean difference is larger than 0.1 for a Wilcoxon test on thermal sensation, a sample size of 947 is needed to reliably differentiate the BS from the NBS. It is important to consider the different sample size for the thermal state questionnaire, since one survey failed to be saved. Thus, the sample size of 39 in this study can find a significant difference of the mean thermal votes between the two sessions at a 0.5 interval scale for thermal sensation and acceptability, and at a 0.75 interval scale for thermal comfort.
Table 4 shows the required sample size for t-test tests to differentiate the BS and the NBS with 0.05 as a significance level and 0.08 as a statistical power. Similar to the estimated sample sizes from the Wilcoxon tests, the sample size of 40 in this study can find a significant difference in the mean skin temperature and heart rate by using a t-test with sample mean difference of 0.75 °C and 8 bpm, respectively.

4.1. Demographic and General Questionnaires

The demographic data indicated that there were 24 male and 16 female participants, most of whom were graduate or undergraduate students. The questionnaires recorded the age and other general information of participants (Table 5).

4.2. Environmental Temperature Conditions

To ensure the comparability of the environmental conditions between the two experimental sessions, BS and NBS, a two-tailed pairwise t-test was applied to analyze the room temperatures recorded in the BS vs. the NBS. The environmental temperature was measured by a temperature sensor located at a height of 1.1 m, the head level of seated occupants [50]. The authors also compared the room temperature in each session between the two time points, TP1 and TP2. The results indicated that there was no significant difference between all three environmental temperature data sets or between TP1 and TP2 within each session (Figure 7 and Table 6). These results suggest that both types of analysis, between and within sessions, were conducted under comparable environmental temperature conditions.

4.3. Between Sessions Analysis

4.3.1. Thermal State Votes

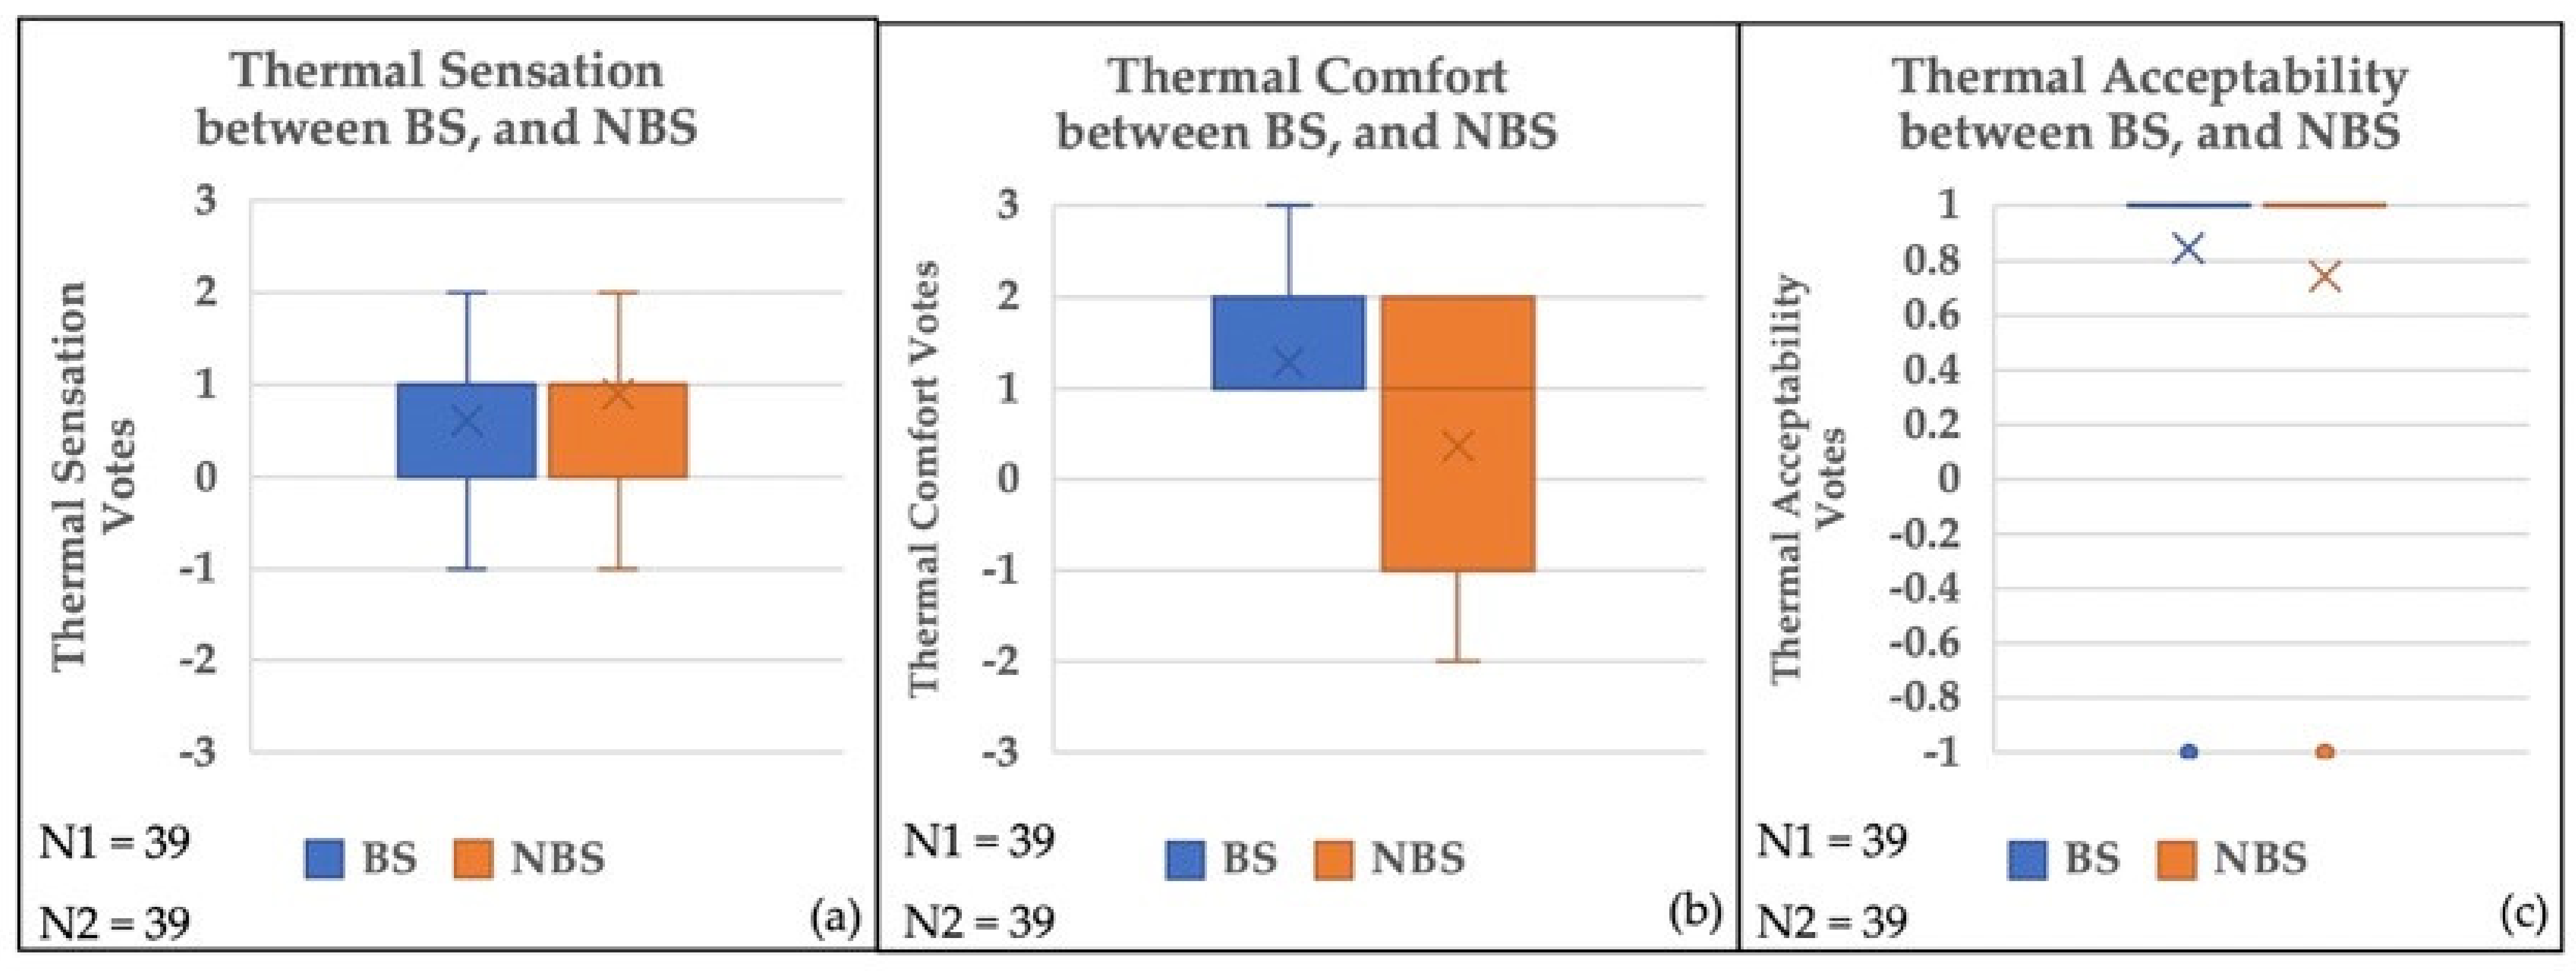
Thermal votes were compared between the two sessions using the Wilcoxon Sign Rank Test at a significance level of 0.05 (Figure 8). Results indicated that there was a significant difference in thermal comfort between the BS and the NBS (Table 7); participants reported the BS as more comfortable. Additionally, no significant difference was observed in terms of thermal sensation and acceptability. However, according to the mean votes (Table 7), participants reported 0.28 lower thermal sensation votes and 0.11 higher thermal acceptability in the BS. The test showed that participants felt more comfortable in the biophilic environment, even though they felt the same slightly warm environment and accepted it.

4.3.2. Physiological Responses

The comparisons of the local and the mean skin temperature between the BS and the NBS were performed using a two-tailed pairwise t-test (Figure 9). According to the results (Table 8), no significant difference in the mean skin temperature was observed between the two sessions. In terms of local skin temperature, there was a significant difference in hand temperature while no difference was observed for neck, scapula, or shin temperature. Thus, hand temperature was significantly higher in the BS while the mean skin temperature was not different between the two sessions.
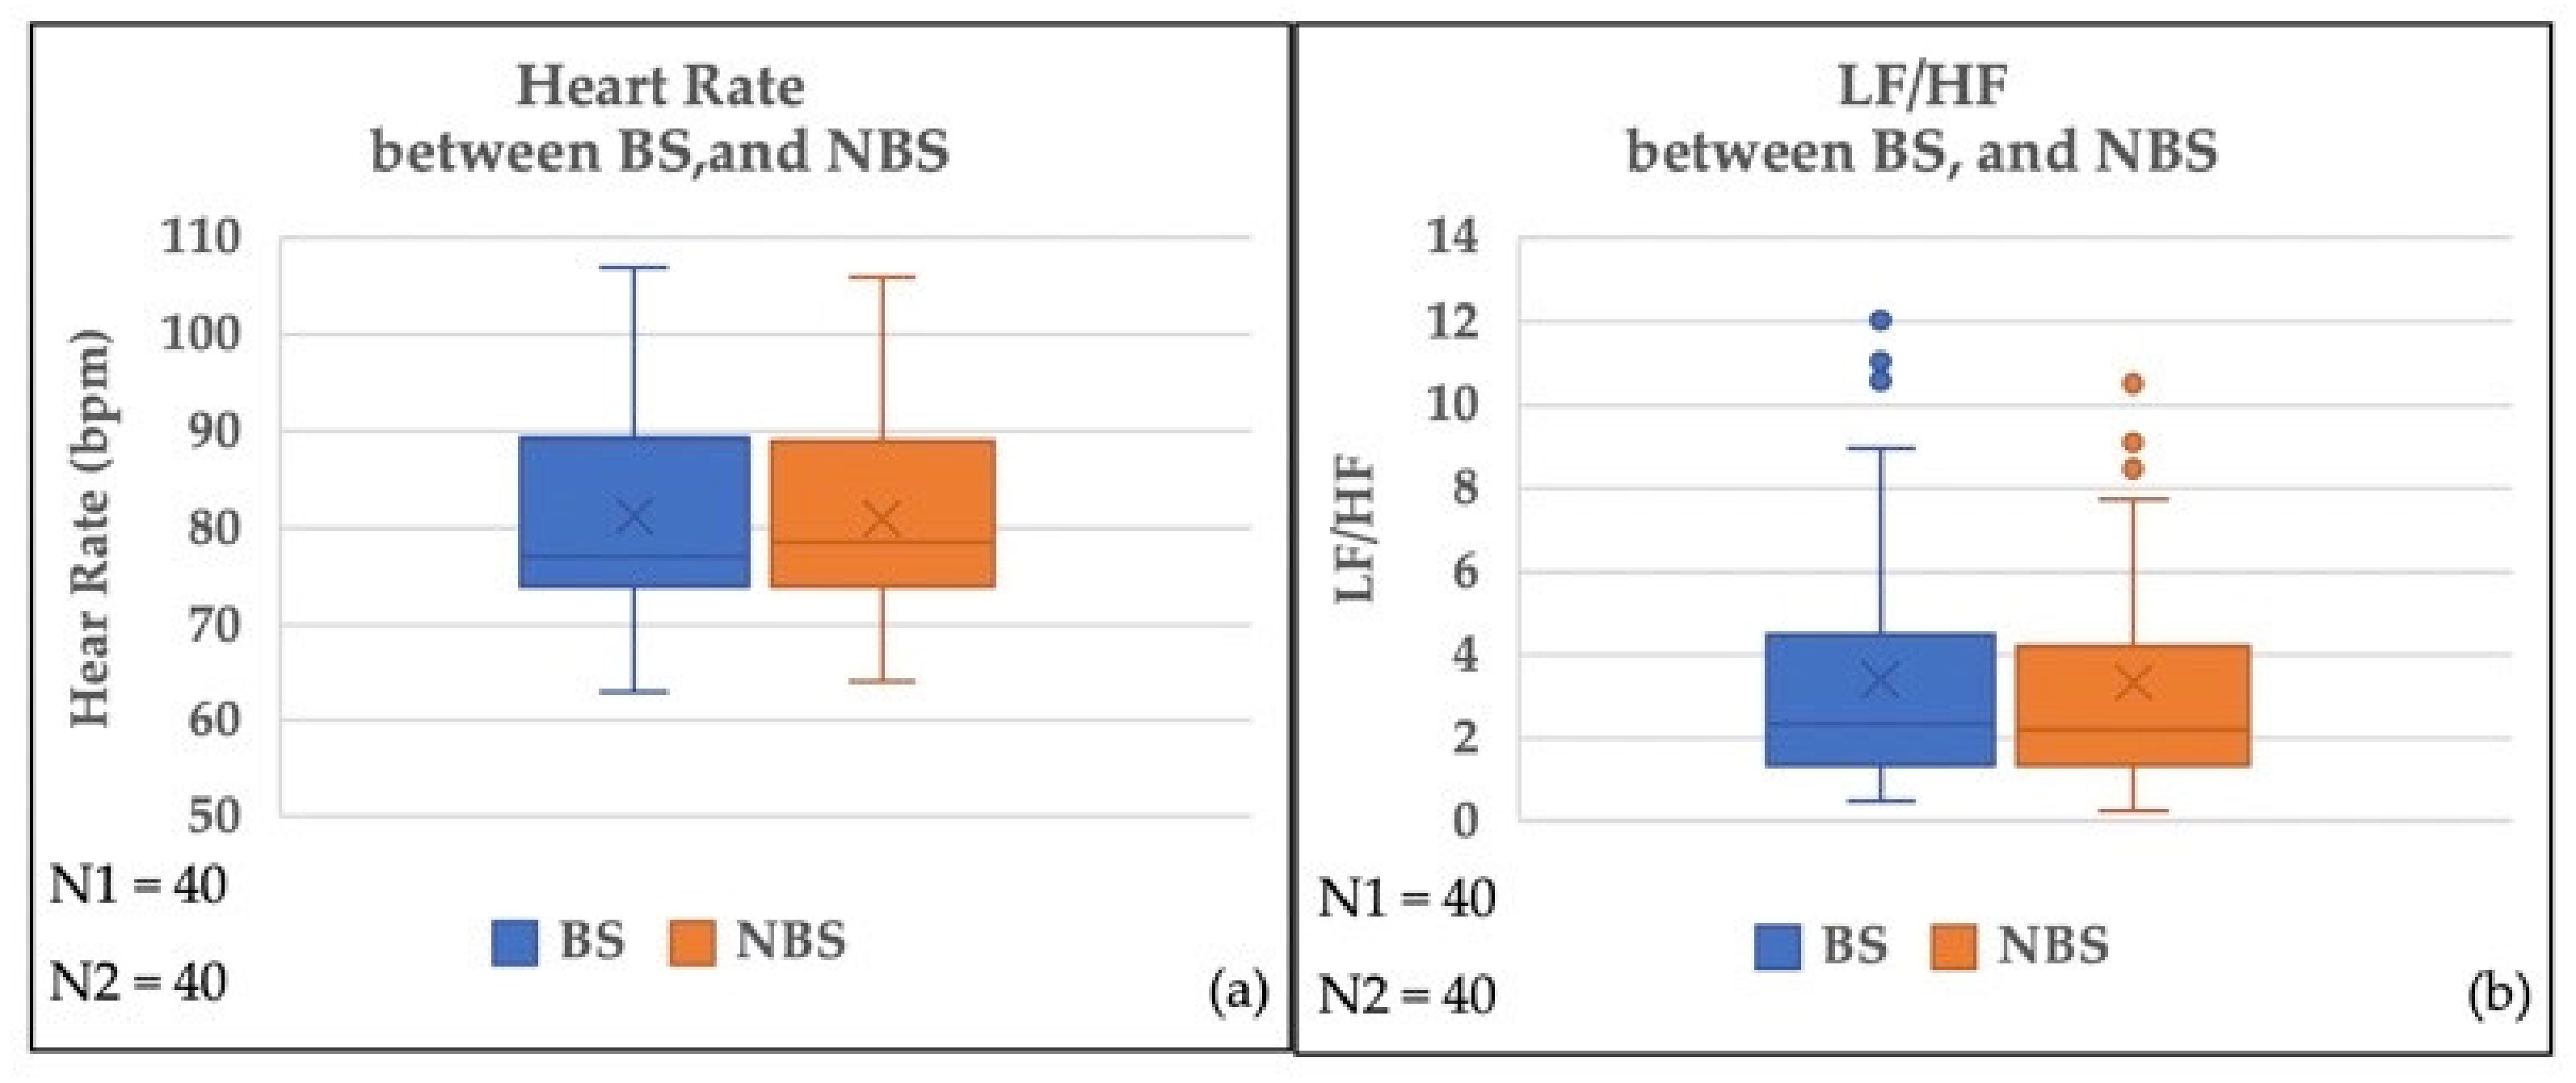
Heart rate and LF/HF were compared between the BS and the NBS using a two-tailed pairwise t-test (Figure 10). According to the results (Table 9), no significant difference was observed in the heart rate and the LF/HF ratio between the two sessions.

4.4. Within Sessions Analysis

4.4.1. Thermal State Votes

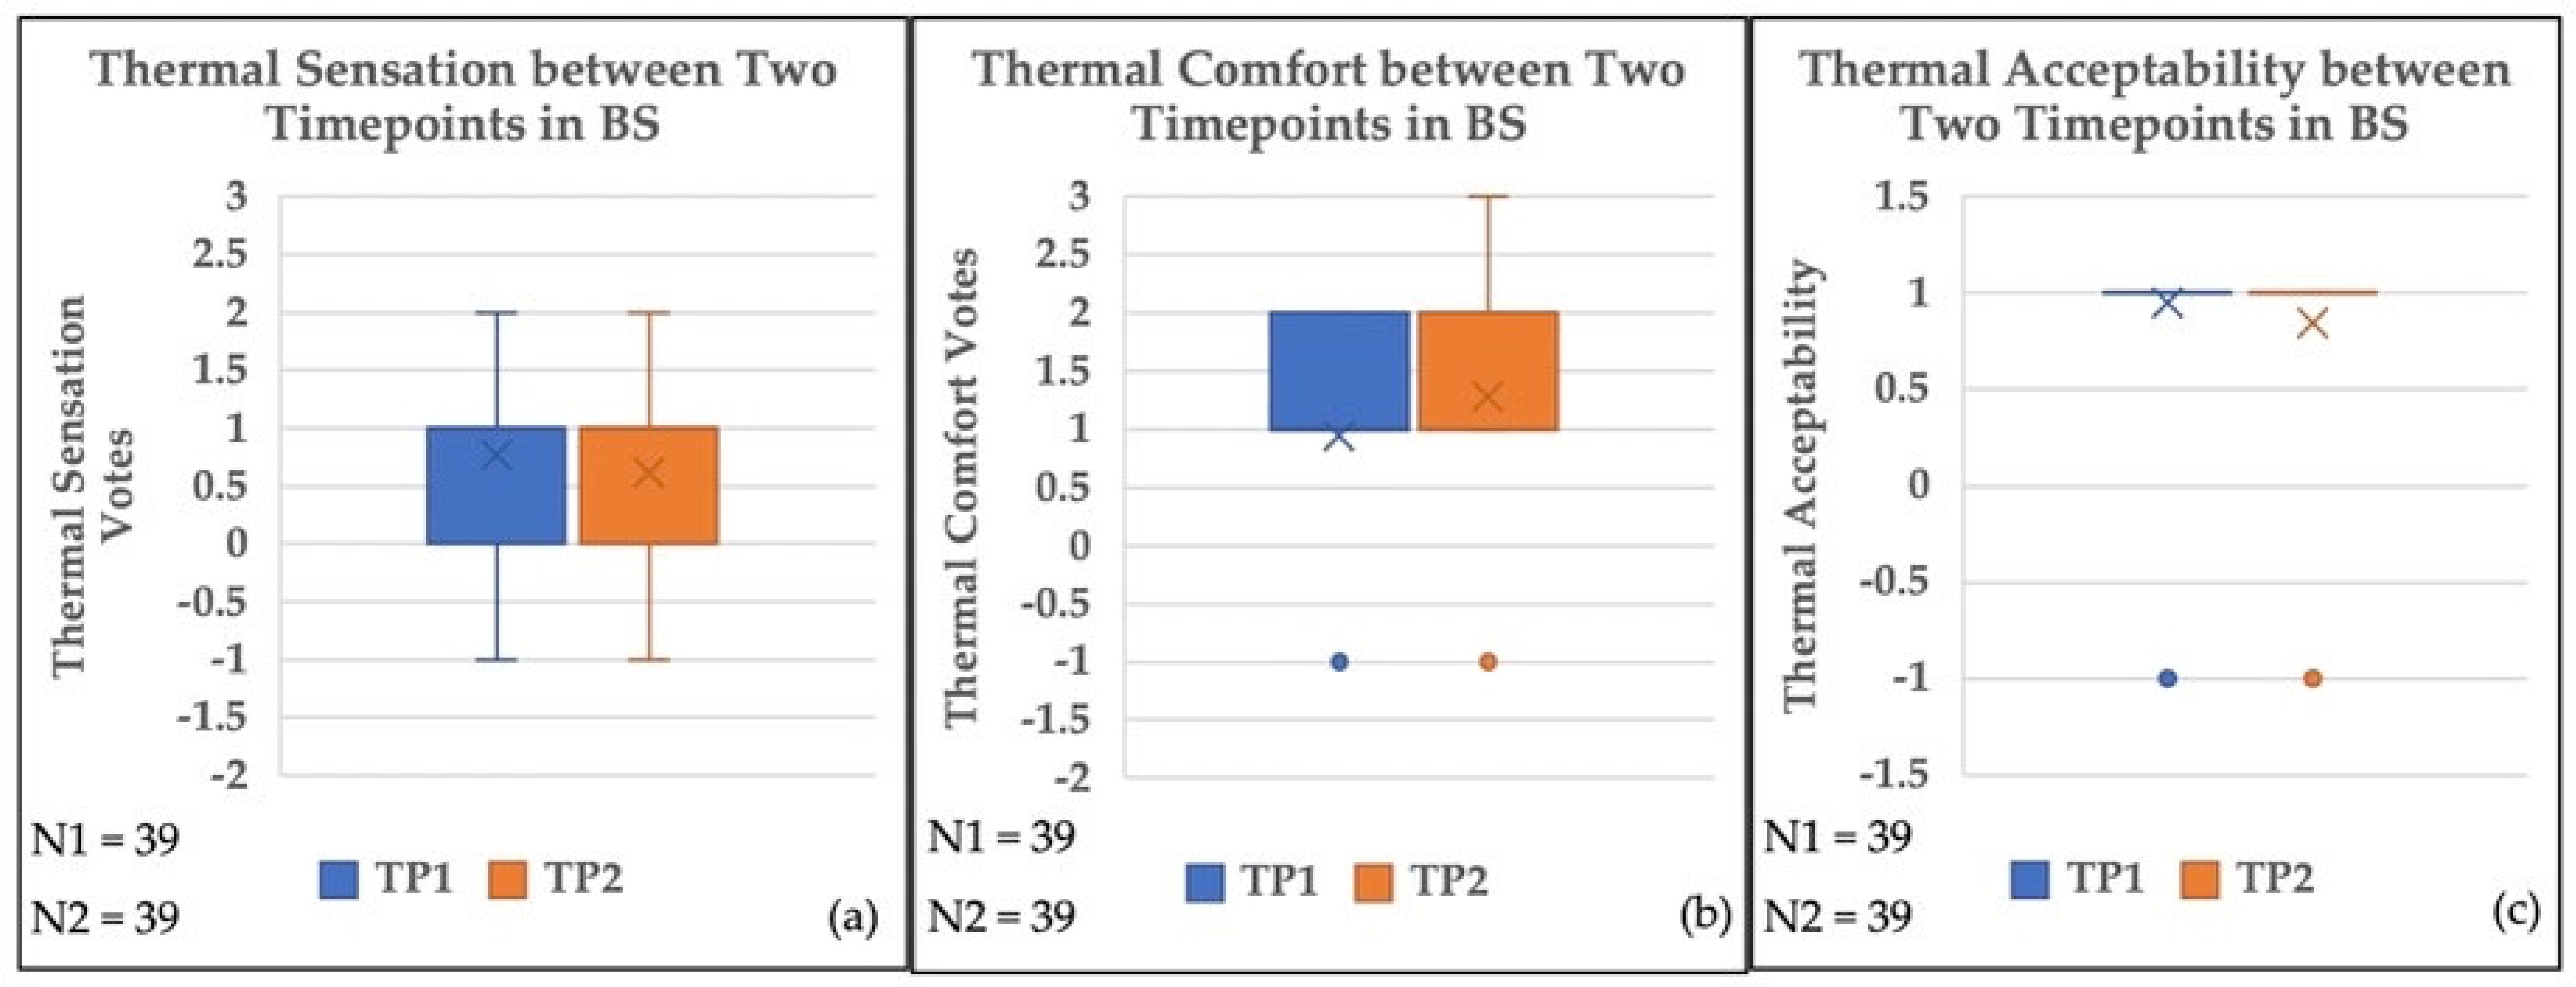
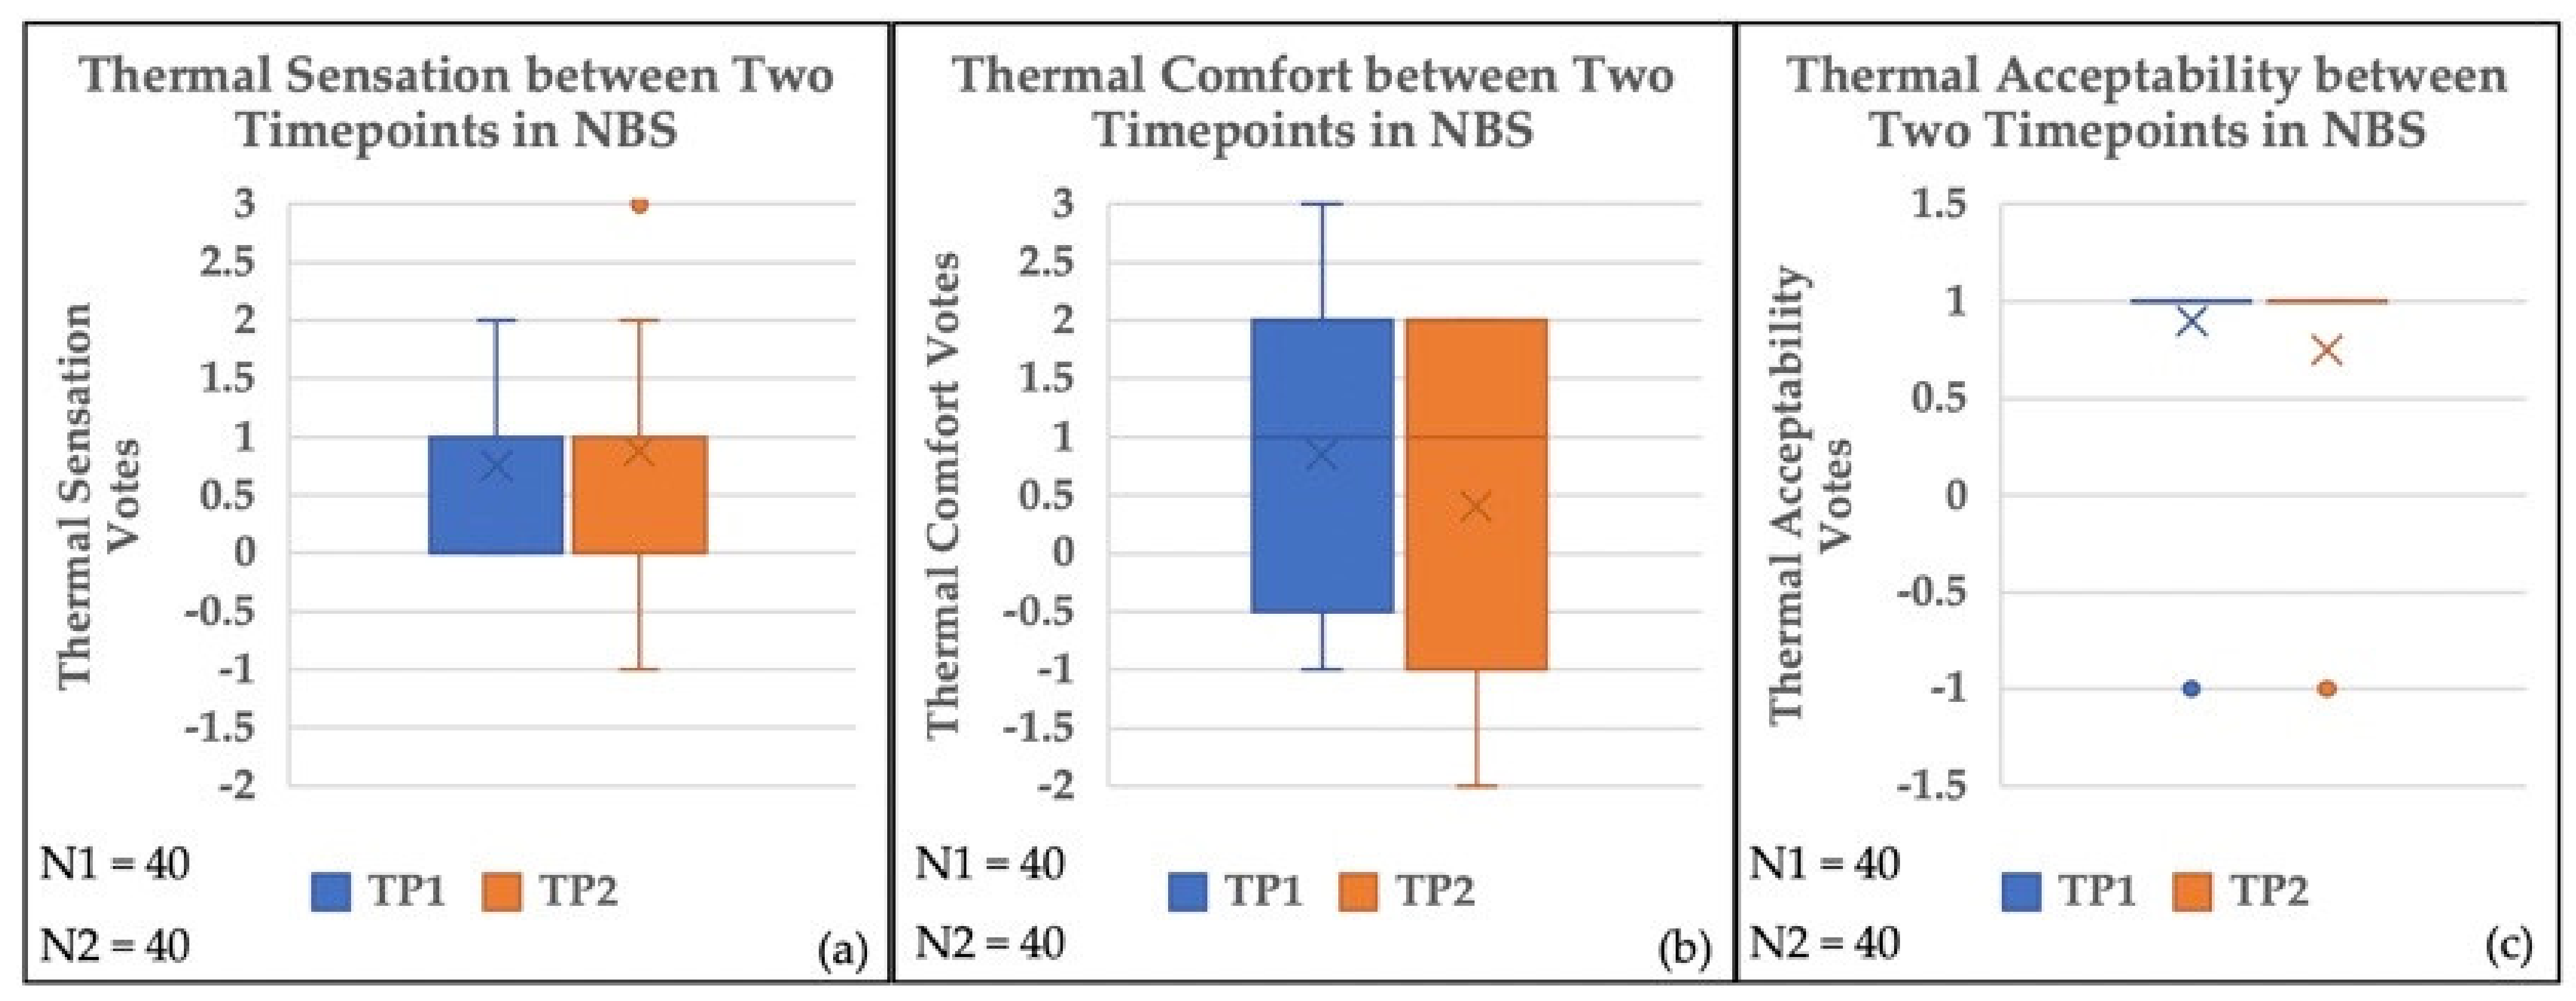
Thermal votes were compared between the two time points using the Wilcoxon Sign Rank Test at a significance level of 0.05 in BS (Figure 11), and NBS (Figure 12). The results showed that there was no significant difference in all three types of thermal state votes between the two time points in the BS or the NBS (Table 10). Thus, the applied virtual exposure time did not affect participants’ thermal states. Moreover, according to the mean votes (Table 10), participants reported 0.15 lower thermal sensation votes and 0.33 higher thermal comfort after 7 min of experiencing a virtual biophilic environment. However, the results of the NBS indicate the exact reverse pattern, since participants reported 0.125 higher thermal sensation votes and 0.45 lower thermal comfort. These results suggest that spending more time in a virtual environment could negatively impact participants’ thermal state, while adding natural elements such as green walls could not only mitigate the negative impact of exposure time, but also improve the thermal state. This observation needs further investigation to study the impact of virtual visual stimuli, time, and individual differences. For instance, a significant difference might be detected by increasing the exposure time to 10 or 15 min.

4.4.2. Physiological Responses

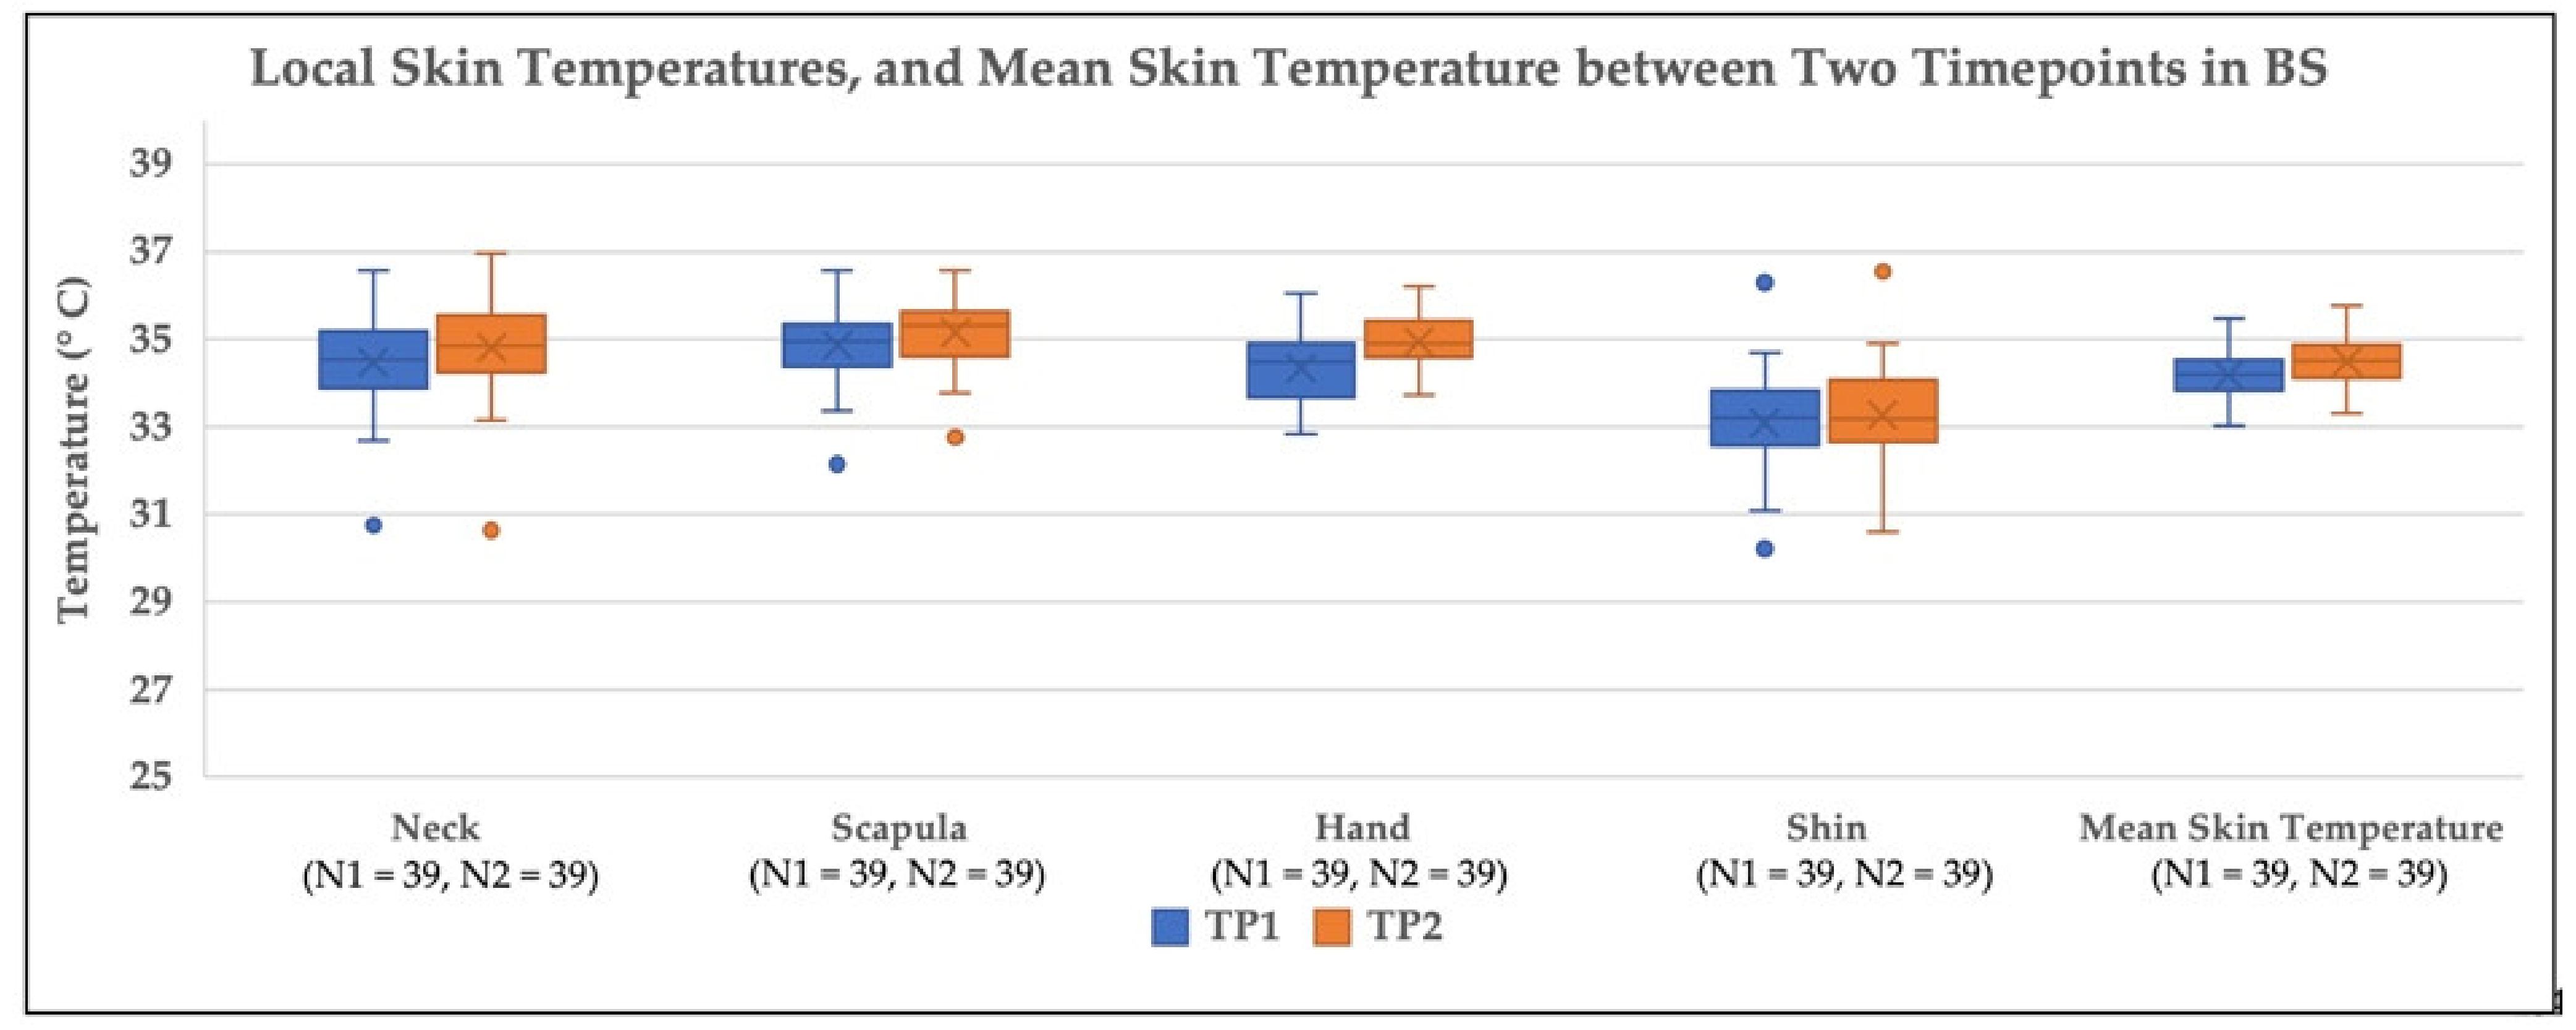
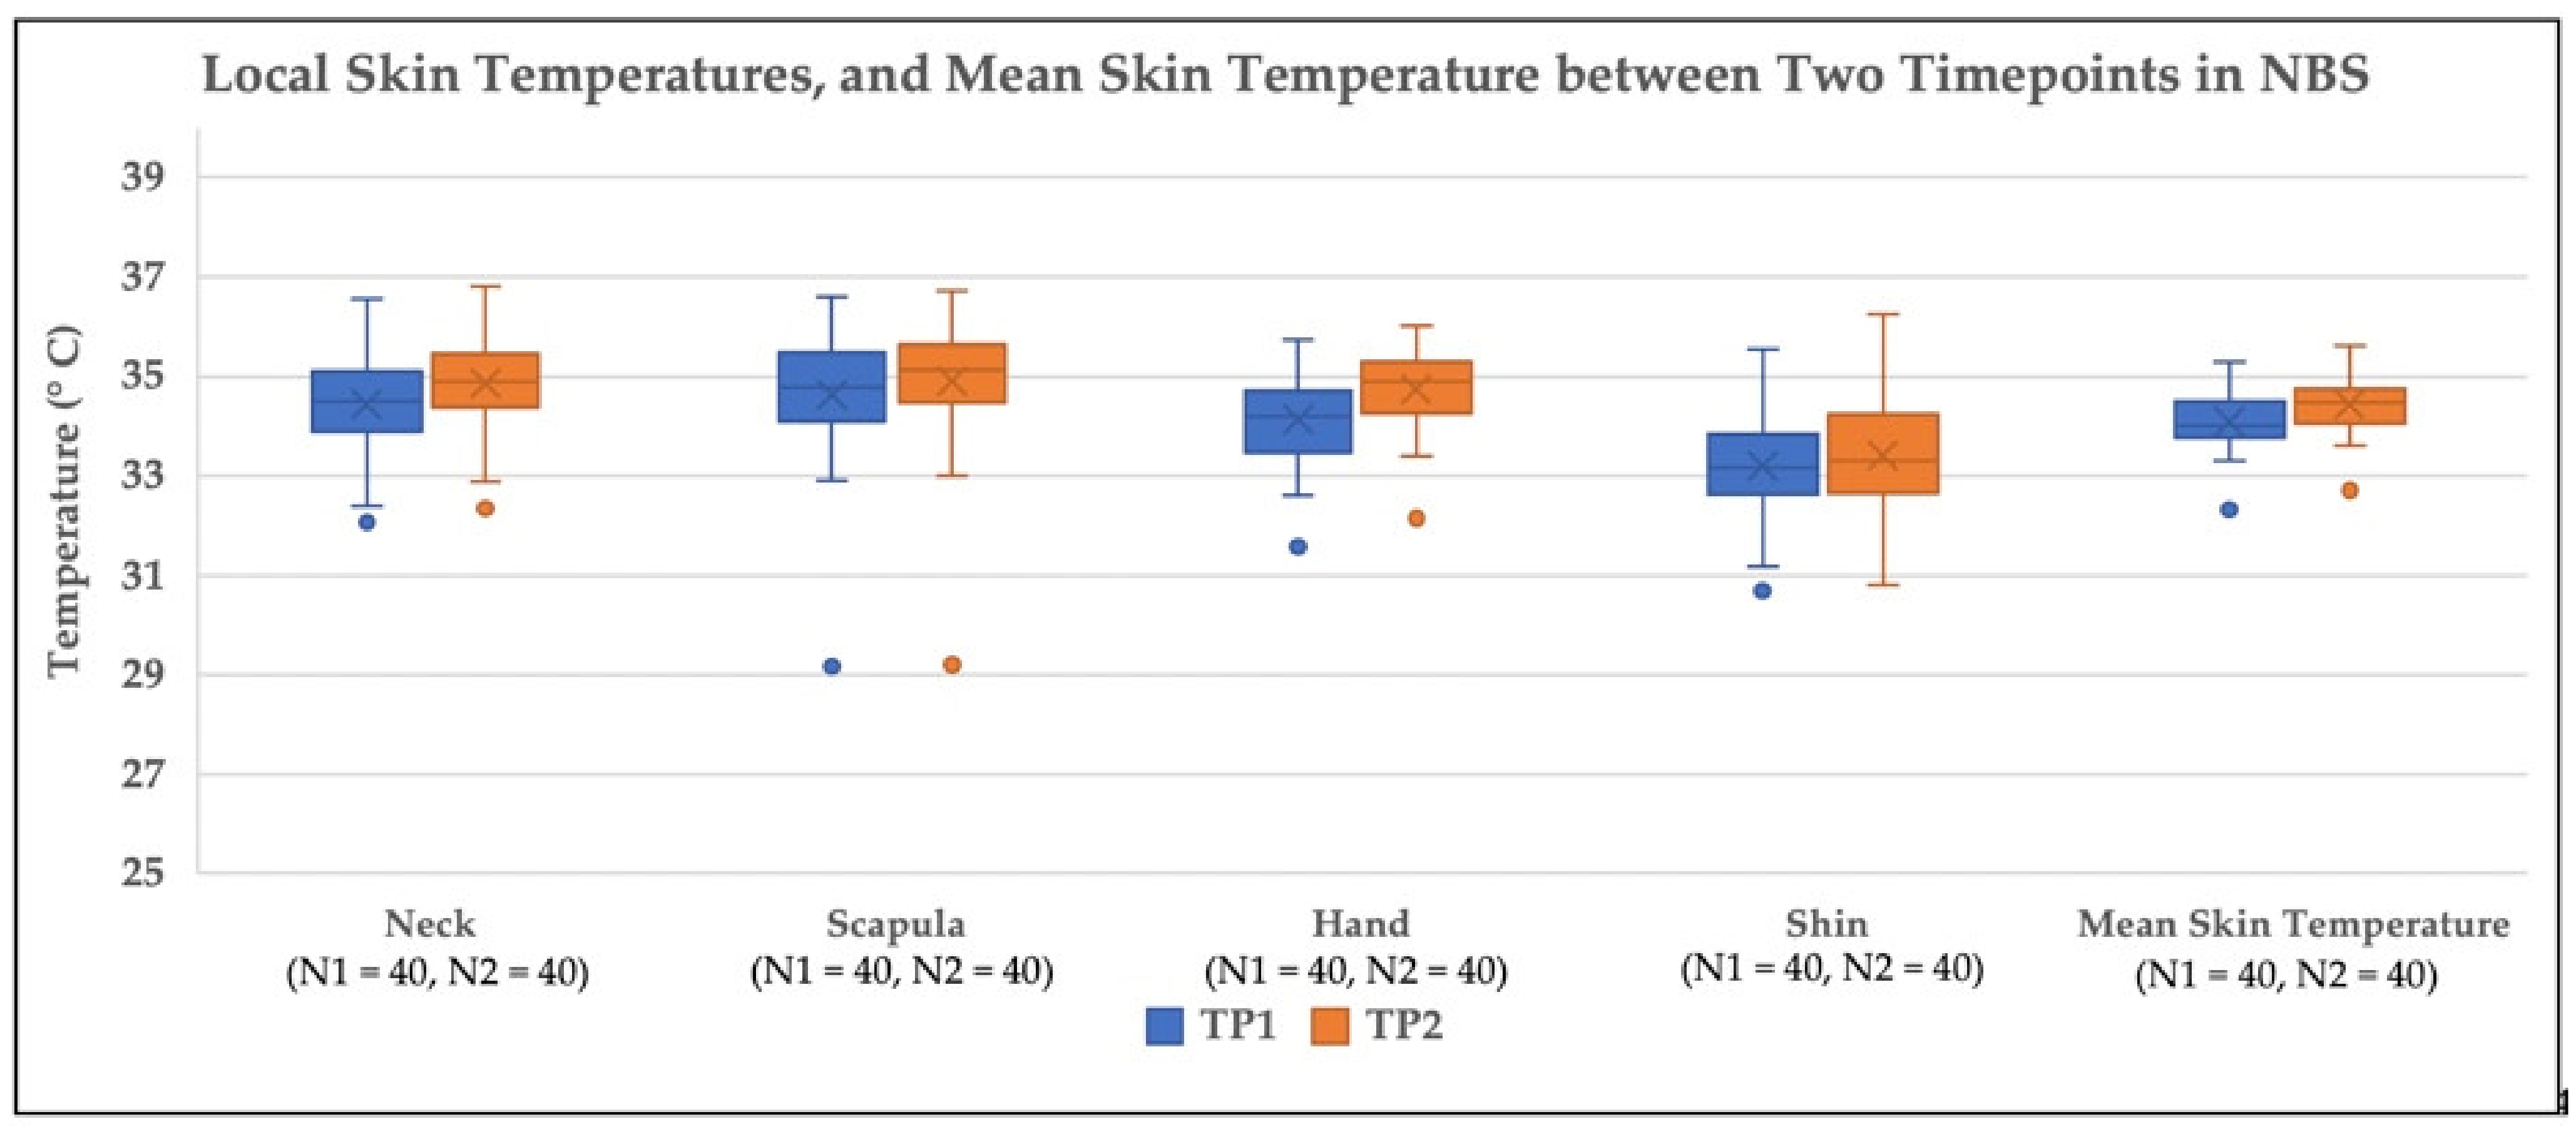
When comparing the local and mean skin temperatures between the two time points using a two-tailed pairwise t-test in BS (Figure 13), and NBS (Figure 14), there was a significant difference in the local and mean skin temperature between the two time points for both sessions (Table 11). Accordingly, the mean and local skin temperatures were raised at the second time point of both sessions. Thus, spending more time in a virtual environment resulted in a higher skin temperature regardless of the type of virtual environment.
The heart rate and LF/HF ratio between the two time points were compared using a two-tailed pairwise t-test in BS (Figure 15), and NBS (Figure 16). There was no significant difference in heart rate and HF/LF ratio between the two time points of both the BS and the NBS (Table 12). However, a lower heart rate and LF/HF ratio were expected after 7 min of virtual exposure for the biophilic session.

5. Discussion

5.1. Between Sessions

When comparing participants’ thermal states and physiological responses between the BS and the NBS, significant differences were observed in thermal comfort and hand skin temperature. Since participants’ thermal state was measured by thermal sensation, thermal comfort, and thermal acceptability, the definition of these different perceptions would help to discuss the results. According to the ASHRAE Standard, thermal comfort refers to the mind’s satisfaction, while thermal sensation indicates a feeling [51]. Thus, thermal sensation is correlated with physiological responses including skin temperature, while thermal comfort is relevant to the psychological aspect of the mind. The distinction between thermal sensation and comfort in evoking various responses may explain the results.
The thermal comfort difference (Table 7) suggests that a green wall as a visual stimulus alone in a virtual environment can improve human thermal comfort. The potential of a visual connection to nature in improving thermal comfort has been found in other studies [31]. The results suggest that adding a natural element such as a green wall to a virtual environment could sufficiently improve participants’ mind satisfaction in terms of thermal comfort. However, thermal sensation and thermal acceptability were not significantly different. The result associated with the thermal sensation can be further explained by the skin temperature. Previous studies proved that skin temperature was a reliable proxy for assessing thermal sensation [32]. In this study, the result of thermal sensation is consistent with the mean skin temperature, since there was no significant difference between the BS and the NBS (Table 7 and Table 8). In addition, the statistical analysis was limited to the sample mean difference presented in Table 3. Thus, if the thermal sensation was significant, a larger sample was needed.
In addition, an environment is thermally acceptable when the majority of its occupants report it as acceptable [51]. The literature suggests an existing connection between thermal acceptability and both thermal sensation and thermal comfort [41]. Since the results from thermal sensation and thermal acceptability are not consistent, it is hard to discuss thermal acceptability based on thermal sensation and comfort. One possibility to explain the results of thermal acceptability is the adaptive hypothesis, which suggests the impact of contextual factors and past experiences on occupants’ thermal expectations [39]. Since most of the participants were from a warm climate, they might prefer warmer indoor temperatures. Thus, both sessions were acceptable for the participants.
There was no effect of the experiments on overall skin temperature. To explain this result, it needs to be noted that the chamber’s temperature was set to 28.89 °C to provide a slightly warm condition during the experiment. Although participants’ mean thermal sensation was close to 1, slightly warm (Table 2) at the first time point (TP0), this temperature might not be high enough for participants to evoke significant physiological responses, such as skin temperature. Thus, a warmer experimental condition such as 30°C [34] or 35 °C [52] may ensure that researchers observe differences in participants’ physiological responses. Regarding the local skin temperature, the significant difference in hand temperature is not consistent with the other local skin temperatures or the mean skin temperature. This could be because the fluctuation of hand temperature is significant when the thermal state is close to the neutral (Table 8) [53].
No difference was observed in the heart rate and LF/HF between the BS and the NBS. Since heart rate is one of the indicators predicting thermal sensation [34], it is consistent with the results of thermal sensation. However, a lower LF/HF was expected in the BS since LF/HF is associated with thermal comfort [17]. Since these two sessions were only different in terms of visual stimuli, adding a green wall to the environment might change the LF/HF normal pattern. Thus, more investigation is needed to detect factors that would impact LF/HF.

5.2. Within Sessions

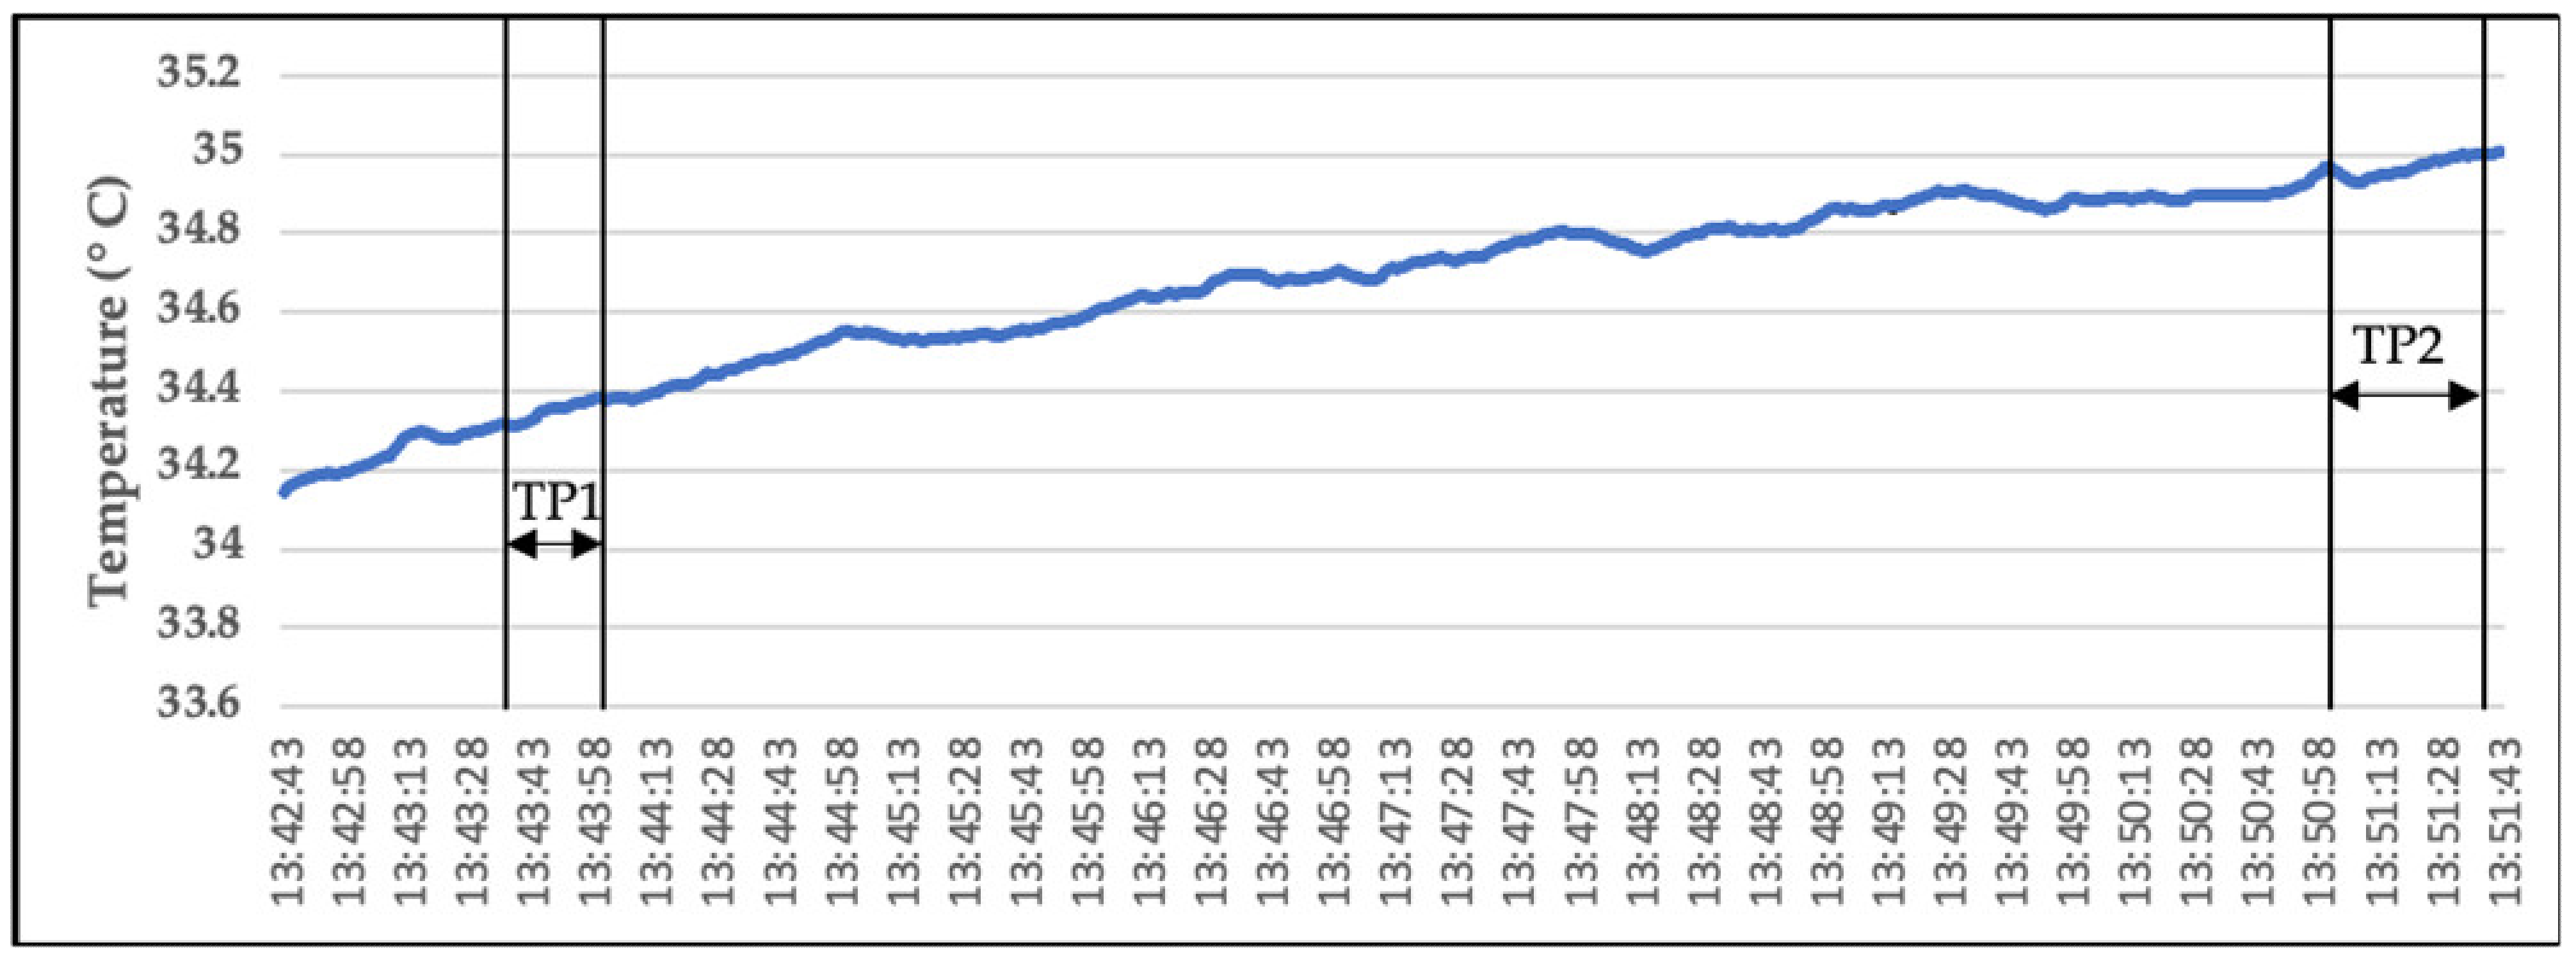
When comparing participants’ thermal states and physiological responses between TP1 and TP2 in both sessions, a significant difference in the local and mean skin temperatures was observed. According to Table 11, the average mean skin temperature at TP2 was significantly higher than at TP1 in both sessions. In addition, the ascending pattern could be visually detected from time series plots of the mean skin temperature for each participant in both sessions (Figure 17 and Figure 18). Although there is not a clear explanation for why participants’ mean skin temperatures were higher after spending time in the virtual environment, the following are two possible explanations:
  • The IVE condition could affect the thermal state and physiological responses [6]. Thus, wearing an HMD and experiencing a virtual environment would increase physiological responses such as skin temperature. However, further investigation is needed to detect the impact of virtual technology based on exposure time and different thermal conditions.
  • The exposure time to various thermal conditions could impact the mean skin temperature since the prediction models of body temperature include the duration time [54,55]. Thus, spending more time in a slightly warm condition might raise the body temperature through body heat accumulation.
Thus, virtual exposure time could affect skin temperature, but a short time of exposure, such as 7 min, might not be enough to statistically change the thermal state.

5.3. Between and Within Sessions Thermal Votes

A closer look at the results from both between- and within-session analyses shows that the thermal comfort votes were significantly different between sessions, while no difference was observed in each session between the two time points. Thus, the same participant felt that the BS was more comfortable, while the participant’s thermal comfort did not change in each session. Further analysis was conducted to determine an explanation for this result. According to the analysis (Figure 19), there was not a significant difference in participants’ thermal comfort votes between the two sessions (Table 13) at TP1. In addition, the room temperature at TP1 was similar between the two sessions (Table 14). Therefore, participants started the experiment in the same thermal state in a comparable environmental condition. However, the thermal comfort vote raised in the BS while it decreased in the NBS. After 7 min, the thermal comfort vote differed significantly in the two sessions due to this exact inverse change. Since the two sessions were only different in terms of the type of virtual environment, the findings suggest that visual connection with a natural element, such as a green wall, could improve thermal comfort. However, there is a need for further studies to detect the impact of the virtual green wall on thermal sensation, acceptability, and physiological responses in other thermal conditions.

6. Limitations

We assessed the effect of visual connection with a green wall in an IVE under a slightly warm condition (28.89 °C). Although the results provided insights into human thermal perception in a warm condition, this study does not investigate a green wall’s impact on thermal perception under other conditions. Thus, more studies are needed to evaluate their effect under cooler or warmer conditions to provide a better understanding of the visual connection with a green wall under all potential thermal conditions.
Moreover, the type of heat loss varies between different thermal conditions, and this study only recorded body temperature changes. However, the transfer of heat is highly controlled by latent heat loss processes such as evaporation in warm conditions [56], and skin wetness data was not collected in this study.
Lastly, each participant was free to observe the virtual environment for seven minutes. According to the literature, participants’ physiological states return to the baseline after 7~8 min habituation in a virtual environment [47]. Thus, the 7 min virtual exposure time was determined to minimize the risk of cybersickness. However, previous studies in real environments employed a longer time [31]. Thus, it may require a longer exposure time to detect the differences between biophilic and non-biophilic environments.

7. Conclusions and Future Research

The study has shown that a visual connection with a green wall in IVEs can affect the thermal comfort perception of participants, although such visual connection affected thermal sensation, acceptability, and physiological responses differently. Thus, the study indicates that when using IVEs to study thermal perception, one needs to consider the compounded effect of visual and thermal stimuli. Consequently, until the extent to which the impact of visual stimuli (e.g., green walls) is fully understood, researchers may need to control visual and thermal stimuli separately when using them for data collection in IVEs.
In addition, the findings for each session show that the virtual exposure time could affect skin temperature, although a short time of exposure, such as seven minutes in this case, might not be enough to statistically change the thermal state. The virtual exposure time should be an important consideration when designing experimental procedures.
These findings suggest that future research is needed in the following areas. First, the inner workings of visual stimuli such as a green wall on thermal state and physiological responses needs more research. For example, although the results of thermal sensation with mean skin temperature were consistent, lower sensation votes and skin temperature were expected. Future research is needed to include other physiological responses, such as skin wetness, based on environmental conditions [56] to accurately study human physiological responses. Secondly, a more thorough investigation is required to determine the extent to which visual stimuli, such as a virtual green wall, may affect the thermal state and physiological responses in other thermal or environmental conditions. For example, experiments may be conducted at a higher environmental temperature (>28.89 °C) or using a stronger treatment (e.g., covering all walls with green walls) [57]. Thirdly, the exposure time of visual stimuli in virtual reality could play a role in the thermal perception of participants. This factor needs more exploration in conjunction with other factors such as room temperature. Finally, it is important to consider that the statistical analysis in the previous section was limited to the sample mean difference (Table 3). Thus, it takes a larger sample to detect the differences in the thermal sensation or the thermal acceptability if their sample mean difference is smaller than 0.5.
Abbreviations:Table 15 includes list of abbreviations used in this paper.

Author Contributions

Conceptualization, A.S., Y.Z., Y.C. and B.H.; methodology, A.S., Y.Z., Y.C. and B.H.; formal analysis, A.S.; investigation, A.S. and Y.Z.; writing—original draft preparation, A.S.; writing—review and editing, Y.Z., Y.C. and B.H.; supervision, Y.Z.; funding acquisition, Y.Z. All authors have read and agreed to the published version of the manuscript.

Funding

This research was supported by the National Science Foundation (Grant No. 1805914).

Institutional Review Board Statement

The study was conducted according to the guidelines of the Declaration of Helsinki, and approved by the Institutional Review Board of Louisiana State University (IRB#3998, 31 January 2018).

Informed Consent Statement

Informed consent was obtained from all subjects involved in the study.

Data Availability Statement

The corresponding author can provide the data presented in this study upon request.

Acknowledgments

This research was supported by the National Science Foundation (Grant No. 1805914). Any opinions, findings, conclusions, or recommendations expressed in this material are those of the authors and do not necessarily reflect the views of the National Science Foundation.

Conflicts of Interest

The authors declare no conflict of interest.

References

  1. Zhang, Y.; Liu, H.; Kang, S.C.; Al-Hussein, M. Virtual reality applications for the built environment: Research trends and opportunities. Autom. Constr. 2020, 118, 103311. [Google Scholar] [CrossRef]
  2. Mollazadeh, M.; Zhu, Y. Application of Virtual Environments for Biophilic Design: A Critical Review. Buildings 2021, 11, 148. [Google Scholar] [CrossRef]
  3. Zhu, Y.; Saeidi, S.; Rizzuto, T.; Roetzel, A.; Kooima, R. Potential and challenges of immersive virtual environments for occupant energy behavior modeling and validation: A literature review. J. Build. Eng. 2018, 19, 302–319. [Google Scholar] [CrossRef]
  4. Alamirah, H.; Schweiker, M.; Azar, E. Immersive virtual environments for occupant comfort and adaptive behavior research—A comprehensive review of tools and applications. Build. Environ. 2022, 207, 108396. [Google Scholar] [CrossRef]
  5. Saeidi, S.; Lowe, A.; Johannsen, N.; Zhu, Y. Computing in Civil Engineering 2017: Sensing, Simulation, and Visualization; American Society of Civil Engineers: Reston, VI, USA, 2017. [Google Scholar] [CrossRef] [Green Version]
  6. Yeom, D.; Choi, J.H.; Kang, S.H. Investigation of the physiological differences in the immersive virtual reality environment and real indoor environment: Focused on skin temperature and thermal sensation. Build. Environ. 2019, 154, 44–54. [Google Scholar] [CrossRef]
  7. Saeidi, S.; Rentala, G.; Rizzuto, T.; Hong, T.; Johannsen, N.; Zhu, Y. Exploring thermal state in mixed immersive virtual environments. J. Build. Eng. 2021, 44, 102918. [Google Scholar] [CrossRef]
  8. Alais, D.; Newell, F.N.; Mamassian, P. Multisensory processing in review: From physiology to behaviour. Seeing Perceiving 2010, 23, 3–8. [Google Scholar] [CrossRef] [Green Version]
  9. Yang, W.; Moon, H.J. Combined effects of acoustic, thermal, and illumination conditions on the comfort of discrete senses and overall indoor environment. Build. Environ. 2019, 148, 623–633. [Google Scholar] [CrossRef]
  10. Chinazzo, G.; Wienold, J.; Andersen, M. Daylight affects human thermal perception. Sci. Rep. 2019, 9, 1–5. [Google Scholar] [CrossRef]
  11. Jiang, Y.; Li, N.; Yongga, A.; Yan, W. Short-term effects of natural view and daylight from windows on thermal perception, health, and energy-saving potential. Build. Environ. 2021, 208, 108575. [Google Scholar] [CrossRef]
  12. Slater, M.; Khanna, P.; Mortensen, J.; Yu, I. Visual Realism Enhances Realistic Response in an Immersive Virtual Environment. IEEE Comput. Graph. Appl. 2009, 29, 76–84. [Google Scholar] [CrossRef]
  13. Palareti, G.; Legnani, C.; Cosmi, B.; Antonucci, E.; Erba, N.; Poli, D.; Testa, S.; Tosetto, A. Comparison between different D-Dimer cutoff values to assess the individual risk of recurrent venous thromboembolism: Analysis of results obtained in the DULCIS study. Int. J. Lab. Hematol. 2017, 38, 42–49. [Google Scholar] [CrossRef]
  14. Costanzo, M.E.; Leaman, S.; Jovanovic, T.; Norrholm, S.D.; Rizzo, A.A.; Taylor, P.; Roy, M.J. Psychophysiological response to virtual reality and subthreshold posttraumatic stress disorder symptoms in recently deployed military. Psychosom. Med. 2014, 76, 670–677. [Google Scholar] [CrossRef] [PubMed] [Green Version]
  15. Gagge, A.P.; Stolwijk, J.A.J.; Hardy, J.D. Comfort and thermal sensations and associated physiological responses at various ambient temperatures. Environ. Res. 1967, 1, 1–20. [Google Scholar] [CrossRef]
  16. Goto, T.; Toftum, J.; de Dear, R.; Fanger, P.O. Thermal sensation and thermophysiological responses to metabolic step-changes. Int. J. Biometeorol. 2006, 50, 323–332. [Google Scholar] [CrossRef]
  17. Liu, W.; Lian, Z.; Liu, Y. Heart rate variability at different thermal comfort levels. Eur. J. Appl. Physiol. 2008, 103, 361–366. [Google Scholar] [CrossRef]
  18. McCullough, M.B.; Martin, M.D.; Sajady, M.A. Implementing green walls in schools. Front. Psychol 2018, 9, 619. [Google Scholar] [CrossRef] [Green Version]
  19. Browning, W.; Ryan, C.; Clancy, J. 14 Patterns of Biophilic Design: Improving Health & Well-Being in the Built Environment; Terrapin, Bright Green: New York, NY, USA, 2014. [Google Scholar]
  20. Manso, M.; Castro-Gomes, J. Green wall systems: A review of their characteristics. Renew. Sustain. Energy Rev. 2015, 41, 863–871. [Google Scholar] [CrossRef]
  21. Nori, C.; Olivieri, F.; Grifoni, R.C. Testing the performance of a green wall system on an experimental building in the summer. In Proceedings of the 29th Conference, Sustainable Architecture for a Renewable Future, Munich, Germany, 10–12 September 2013. [Google Scholar]
  22. Li, J.; Zheng, B.; Shen, W.; Xiang, Y.; Chen, X.; Qi, Z. Cooling and energy-saving performance of different green wall design: A simulation study of a block. Energies 2019, 12, 2912. [Google Scholar] [CrossRef] [Green Version]
  23. Wong, N.H.; Tan, A.Y.K.; Tan, P.Y.; Chiang, K.; Wong, N.C. Acoustics evaluation of vertical greenery systems for building walls. Build. Environ. 2010, 45, 411–420. [Google Scholar] [CrossRef]
  24. Van Renterghem, T.; Hornikx, M.; Forssen, J.; Botteldooren, D. The potential of building envelope greening to achieve quietness. Build. Environ. 2013, 61, 34–44. [Google Scholar] [CrossRef] [Green Version]
  25. Pugh, T.A.M.; MacKenzie, A.R.; Whyatt, J.D.; Hewitt, C.N. Effectiveness of green infrastructure for improvement of air quality in urban street canyons. Environ. Sci. Technol. 2012, 46, 7692–7699. [Google Scholar] [CrossRef] [PubMed] [Green Version]
  26. Abdo, P.; Huynh, B.; Avakian, V.; Nguyen, T.; Gammon, J.; Torpy, F.; Irga, P. Measurement of air flow through a green-wall module. In Proceedings of the 20th Australasian Fluid Mechanics Conference, Perth, Australia, 5–8 December 2016. [Google Scholar]
  27. Kazemi, F.; Rabbani, M.; Jozay, M. Investigating the plant and air-quality performances of an internal green wall system under hydroponic conditions. J. Environ. Manag. 2020, 275, 111230. [Google Scholar] [CrossRef] [PubMed]
  28. Van den Berg, A.E.; Wesselius, J.E.; Maas, J.; Tanja-Dijkstra, K. Green Walls for a Restorative Classroom Environment: A Controlled Evaluation Study. Environ. Behav. 2017, 49, 791–813. [Google Scholar] [CrossRef]
  29. Galagoda, R.U.; Jayasinghe, G.Y.; Halwatura, R.U.; Rupasinghe, H.T. The impact of urban green infrastructure as a sustainable approach towards tropical micro-climatic changes and human thermal comfort. Urban For. Urban Green. 2018, 34, 1–9. [Google Scholar] [CrossRef]
  30. Pérez-Urrestarazu, L.; Fernández-Cañero, R.; Franco, A.; Egea, G. Influence of an active living wall on indoor temperature and humidity conditions. Ecol. Eng. 2016, 90, 120–124. [Google Scholar] [CrossRef]
  31. Ko, W.H.; Schiavon, S.; Zhang, H.; Graham, L.T.; Brager, G.; Mauss, I.; Lin, Y.W. The impact of a view from a window on thermal comfort, emotion, and cognitive performance. Build. Environ. 2020, 175, 1–29. [Google Scholar] [CrossRef] [Green Version]
  32. Choi, J.H.; Loftness, V. Investigation of human body skin temperatures as a bio-signal to indicate overall thermal sensations. Build. Environ. 2012, 58, 258–269. [Google Scholar] [CrossRef]
  33. Wang, D.; Zhang, H.; Arens, E.; Huizenga, C. Observations of upper-extremity skin temperature and corresponding overall-body thermal sensations and comfort. Build. Environ. 2007, 42, 3933–3943. [Google Scholar] [CrossRef] [Green Version]
  34. Lan, L.; Wargocki, P.; Wyon, D.P.; Lian, Z. Effects of thermal discomfort in an office on perceived air quality, SBS symptoms, physiological responses, and human performance. Indoor Air 2011, 21, 376–390. [Google Scholar] [CrossRef]
  35. International Organization for Standardization. Ergonomics—Evaluation of Thermal Strain by Physiological Measurements, 2nd ed.; ISO: Geneva, Switzerland, 2004; p. 9886. [Google Scholar]
  36. Choi, J.H.; Loftness, V.; Lee, D.W. Investigation of the possibility of the use of heart rate as a human factor for thermal sensation models. Build. Environ. 2012, 50, 165–175. [Google Scholar] [CrossRef]
  37. McCraty, R.; Shaffer, F. Heart rate variability: New perspectives on physiological mechanisms, assessment of self-regulatory capacity, and health risk. Glob. Adv. Heal. Med. 2015, 4, 46–61. [Google Scholar] [CrossRef] [Green Version]
  38. ASHRAE. Standard 55-2013-Thermal Environmental Conditions for Human Occupancy; ASHRAE: Atlanta, GA, USA, 2013. [Google Scholar]
  39. De Dear, R.J.; Brager, G.S. Developing an adaptive model of thermal comfort and preference. ASHRAE Trans. 1998, 104, 145–167. [Google Scholar]
  40. Zhang, H.; Huizenga, C.; Arenas, E.; Wang, D. Thermal sensation and comfort in transient non-uniform thermal environments. Eur. J. Appl. Physiol. 2004, 92, 728–733. [Google Scholar] [CrossRef]
  41. Zhang, Y.; Zhao, R. Overall thermal sensation, acceptability and comfort. Build. Environ. 2008, 43, 44–50. [Google Scholar] [CrossRef]
  42. Cao, Z.; Wang, Y.; Zhang, L. Real-time Acute Stress Facilitates Allocentric Spatial Processing in a Virtual Fire Disaster. Sci. Rep. 2017, 7, 1–11. [Google Scholar] [CrossRef] [Green Version]
  43. Hartanto, D.; Kampmann, I.L.; Morina, N.; Emmelkamp, P.G.M.; Neerincx, M.A.; Brinkman, W.P. Controlling social stress in virtual reality environments. PLoS ONE 2014, 14, e0223988. [Google Scholar] [CrossRef]
  44. Taylor, P.; Kennedy, R.S.; Lane, N.E.; Berbaum, K.S.; Lilienthal, M.G. Simulator Sickness Questionnaire: An Enhanced Method for Quantifying Simulator Sickness. Int. J. Aviat. Psychol. 1993, 3, 203–220. [Google Scholar]
  45. Balk, S.A.; Bertola, M.A.; Inman, V.W. Simulator Sickness Questionnaire: Twenty Years Later. In Proceedings of the 7th International Driving Symposium on Human Factors in Driver Assessment, Training, and Vehicle Design, Bolton Landing, NY, USA, 17–20 June 2013; pp. 257–263. [Google Scholar] [CrossRef]
  46. Wang, Z.; de Dear, R.; Luo, M.; Lin, B.; He, Y.; Ghahramani, A.; Zhu, Y. Individual difference in thermal comfort: A literature review. Build. Environ. 2018, 138, 181–193. [Google Scholar] [CrossRef]
  47. Jang, D.P.; Kim, I.Y.; Nam, S.W.; Wiederhold, B.K.; Wiederhold, M.D.; Kim, S.I. Analysis of physiological response to two virtual environments: Driving and flying simulation. Cyberpsychol. Behav. 2002, 5, 11–18. [Google Scholar] [CrossRef]
  48. Prel, J.B.D.; Röhrig, B.; Hommel, G.; Blettner, M. Choosing Statistical Tests. Dtsch. Arztebl. 2010, 107, 343–348. [Google Scholar] [CrossRef] [PubMed]
  49. Power and Sample Size Determination. Available online: https://sphweb.bumc.bu.edu/otlt/mph-modules/bs/bs704_power/bs704_power_print.html (accessed on 29 October 2021).
  50. American Society of Heating Refrigerating and Air-Conditioning Engineers—ASHRAE. Standard 55—Thermal Environmental Conditions for Human Occupancy; ANSI/ASHRAE: Peachtree Corners, GA, USA, 2017. [Google Scholar]
  51. ASHRAE Standard. Thermal Environmental Conditions for Human Occupancy 55-2004; ANSI/ASHRAE: Peachtree Corners, GA, USA, 2004; pp. 1–34. [Google Scholar]
  52. Yochihara, Y.; Ohnaka, T.; Nagai, Y.; Tokuda, T.; Kawashima, Y. Physiological responses and thermal sensations of the elderly in cold and hot environments. J. Therm. Biol. 1993, 18, 355–361. [Google Scholar] [CrossRef]
  53. Huizenga, C.; Zhang, H.; Arens, E.; Wang, D. Skin and core temperature response to partial- and whole-body heating and cooling. J. Therm. Biol. 2004, 29, 549–558. [Google Scholar] [CrossRef] [Green Version]
  54. Takada, S.; Matsumoto, S.; Matsushita, T. Prediction of whole-body thermal sensation in the non-steady state based on skin temperature. Build. Environ. 2013, 68, 123–133. [Google Scholar] [CrossRef]
  55. Potter, A.W.; Blanchard, L.A.; Friedl, K.E.; Cadarette, B.S.; Hoyt, R.W. Mathematical prediction of core body temperature from environment, activity, and clothing: The heat strain decision aid (HSDA). J. Therm. Biol. 2017, 64, 78–85. [Google Scholar] [CrossRef]
  56. Kingma, B.R.M.; Schweiker, M.; Wagner, A.; Lichtenbelt, W.D.V. Exploring internal body heat balance to understand thermal sensation. Build. Res. Inf. 2017, 45, 808–818. [Google Scholar] [CrossRef]
  57. Hallahan, M.; Rosenthal, R. Statistical power: Concepts, procedures, and applications. Behav. Res. Ther. 1996, 34, 489–499. [Google Scholar] [CrossRef]
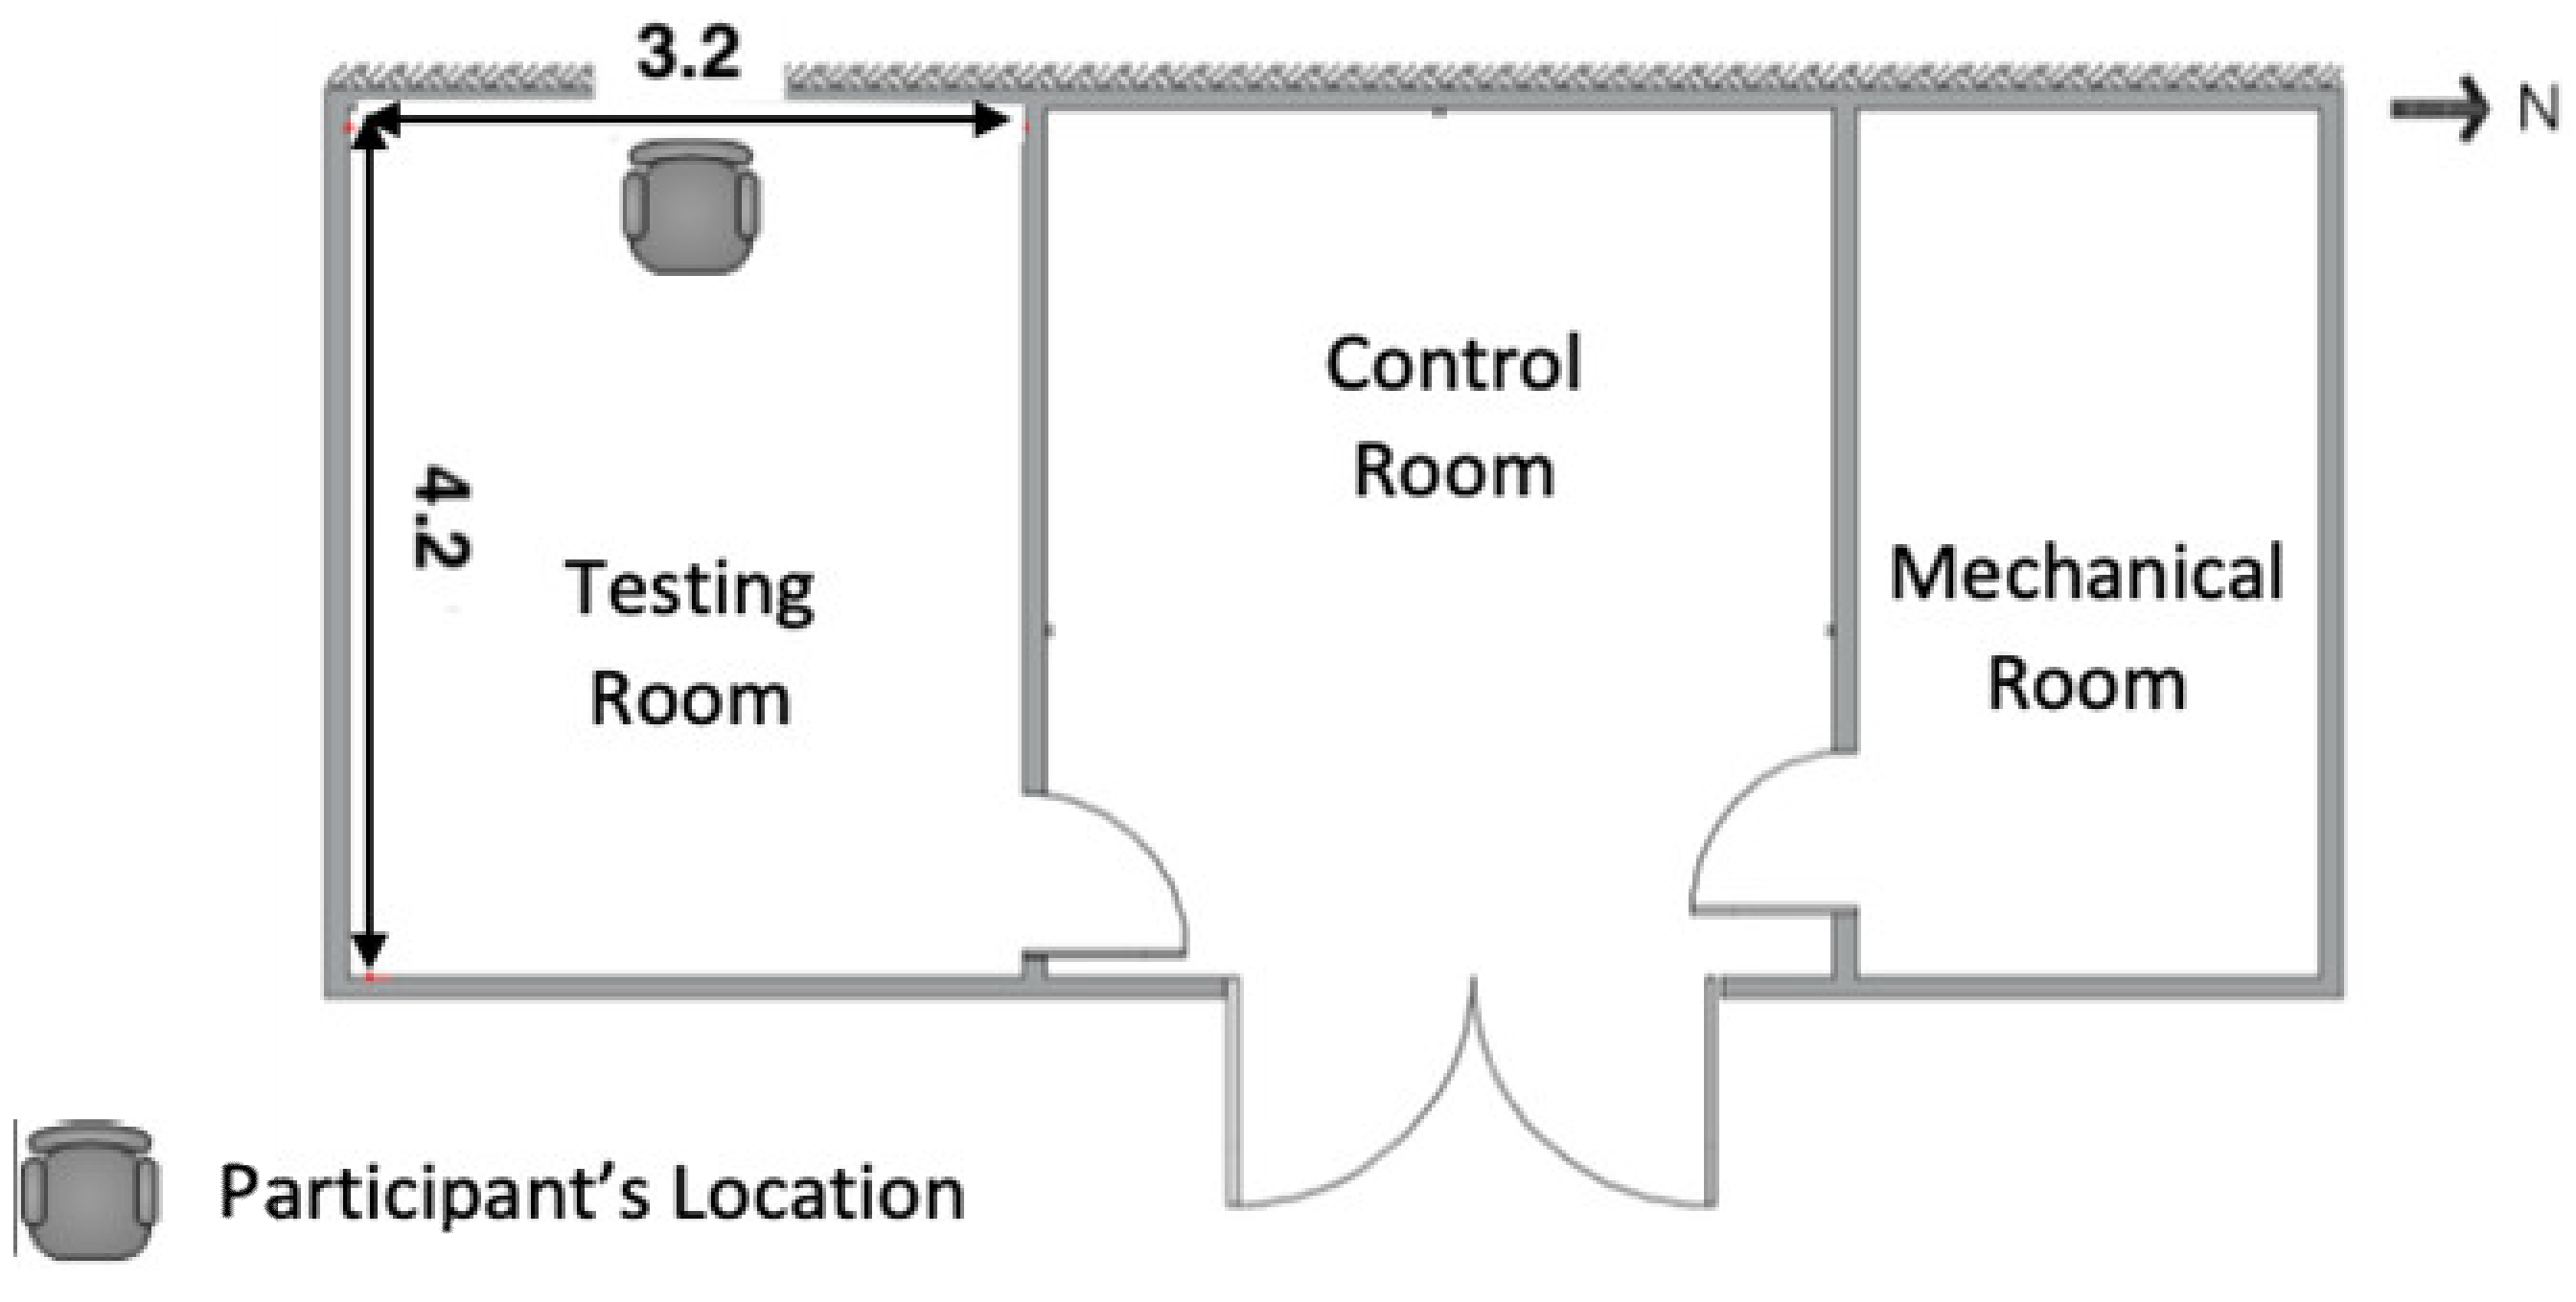
Figure 1. The climate chamber layout.
Sustainability 14 01840 g001
Figure 2. The environmental simulations: (a) the Non-Biophilic Session (NBS); (b) the Biophilic Session (BS).
Sustainability 14 01840 g002
Figure 3. A photo of a participant attending an experimental session.
Sustainability 14 01840 g003
Figure 4. The experimental procedure.
Sustainability 14 01840 g004
Figure 5. The data collection for between-sessions analysis.
Sustainability 14 01840 g005
Figure 6. The procedure for data collection within sessions.
Sustainability 14 01840 g006
Figure 7. The environmental temperature conditions (a) between the two sessions; (b)within the BS; (c) within the NBS. Note: N1 = BS and TP1; N2 = NBS and TP2; × × mean marks.
Sustainability 14 01840 g007
Figure 8. The mean thermal state votes including (a) thermal sensation, (b) thermal comfort, and (c) thermal acceptability between the BS and the NBS. Note: N1 = BS and N2 = NBS;   outliers; × × mean marks.
Sustainability 14 01840 g008
Figure 9. The four local skin temperatures and the mean skin temperature between the BS and the NBS. Note: N1 = BS and N2 = NBS; ● outliers; × × mean marks.
Sustainability 14 01840 g009
Figure 10. (a) Heart rate and (b) LF/HF between the BS and the NBS. Note: N1 = BS and N2 = NBS;   outliers; × × mean marks.
Sustainability 14 01840 g010
Figure 11. The mean thermal state votes including (a) thermal sensation, (b) thermal comfort, and (c) thermal acceptability between the two time points of virtual exposure, TP1 and TP2, in the BS. Note: N1 = TP1 and N2 = TP2;   outliers; × × mean marks.
Sustainability 14 01840 g011
Figure 12. The mean thermal state votes including (a) thermal sensation, (b) thermal comfort, and (c) thermal acceptability between the two time points of virtual exposure, TP1 and TP2, in the NBS. Note: N1 = TP1 and N2 = TP2;   outliers; × × mean marks.
Sustainability 14 01840 g012
Figure 13. The four local skin temperatures and the mean skin temperature between TP1 and TP2 in the BS. Note: N1 = TP1 and N2 = TP2;   outliers; × × mean marks.
Sustainability 14 01840 g013
Figure 14. The four local skin temperatures and the mean skin temperature between TP1 and TP2 in the NBS. Note: N1 = TP1 and N2 = TP2;   outliers; × × mean marks.
Sustainability 14 01840 g014
Figure 15. The (a) heart rate and (b) LF/HF comparisons between TP1 and TP2 in the BS. Note: N1 = TP1 and N2 = TP2;   outliers; × × mean marks.
Sustainability 14 01840 g015
Figure 16. The (a) heart rate and (b) LF/HF comparisons between TP1 and TP2 in the NBS. Note: N1 = TP1 and N2 = TP2;   outliers; × × mean marks.
Sustainability 14 01840 g016
Figure 17. An example of mean skin temperature in the NBS.
Sustainability 14 01840 g017
Figure 18. An example of mean skin temperature in the BS.
Sustainability 14 01840 g018
Figure 19. The thermal comfort of both sessions in each time point. Note: N1 = BS and N2 = NBS;   outliers; × × mean marks.
Sustainability 14 01840 g019
Table 1. The criteria for inclusion and exclusion.
Inclusion Criteria
Age18–35 years
SexMen and women (non-pregnant by self-report)
Informed ConsentParticipants must be able to read, understand, and sign the consent form
Exclusion Criteria
Sufficient medical conditions
(by using participants’ words)
Feeling or being under treatment for any type of health issues or discomfort. Individuals who had been hospitalized because of psychological illness within past five years or were currently undergoing treatment for severe mental illness. Any medical issues that can interfere or be aggravated by using the head-mounted display.
Table 2. The thermal state votes of participants at TP0 between the BS and the NBS.
Thermal StateMean ± SDWilcoxon Sign Rank Test
(p-Value) (Significance Level, 0.05)
BSNBS
Sensation1.17 ± 0.71 ± 0.70.37
Comfort0.5 ± 1.30.6 ± 1.280.83
Acceptability0.6 ± 0.810.85 ± 0.530.11
Note: BS = biophilic session and NBS = non-biophilic session. Thermal sensation scales: 1 = slightly warm, 0 = neutral.
Table 3. The estimated sample sizes required to find a significant difference in thermal state based on the sample mean difference between the BS and the NBS.
Δ meanThermal
Sensation
Thermal
Comfort
Thermal
Acceptability
Estimated Sample Sizes0.19472121487
0.2515240078
0.5388520
0.7517389
110225
Note: BS = biophilic session and NBS = non-biophilic session; Δ mean—Wilcoxon calculation of mean difference between the BS and the NBS including different thermal vote interval scales. The bold numbers suggest the estimated sample sizes required to find a significant difference.
Table 4. The estimated sample sizes required to find a significant difference in skin temperature and heart rate based on the sample mean difference between the BS and the NBS.
Δ MeanSkin TemperatureΔ MeanHeart Rate
0.25 °C2511 bpm 1738
0.5 °C624 bpm46
0.75 °C288 bpm27
Note: Δ mean—Wilcoxon calculation of mean difference between the BS and the NBS including different skin temperature and heart rate interval scales. The bold numbers suggest the estimated sample sizes required to find a significant difference.
Table 5. The demographic and general information of participants.
Age (Mean ± SD)27.67 ± 4.3
Alcohol or cigarettes (12 h before to the experiment)0
Intense Physical Activity (12 h before to the experiment)10%
Departure LocationOff-campus55%
On-campus45%
Type of CommuteMotorized Vehicles52.5%
Walking 40%
Cycling7.5%
Table 6. The environmental temperature comparisons.
Between Session BSNBSDFtp-Value
NMean °CSt. DEV.NMean °CSt. DEV.
4029.0170.084029.0240.08390.540.59
Within Sessions TP1TP2DFtp-value
NMean °CSt. DEV.NMean °CSt. DEV.
BS 3929.0350.193929.0060.2380.70.49
NBS 4028.9720.184029.0170.19391.330.19
Note: BS = biophilic session, NBS = non-biophilic session, TP1= time point 1, and TP2 = time point 2.
Table 7. The thermal state votes of participants between the BS and the NBS.
Thermal StateBSNBSWilcoxon Sign Rank Test (p-Value) (Significance Level, 0.05)
NMeanSt.DEV.NMeanSt.DEV.
Thermal Sensation390.620.75390.90.850.0968
Thermal Comfort391.281.19390.361.440.0044 +
Thermal Acceptability390.850.54390.740.680.4641
Note: BS = biophilic session and NBS = non-biophilic session; + significant result.
Table 8. The four local skin temperatures and the mean skin temperature of participants between the BS and the NBS.
Skin
Temperature
BSNBSTwo-Tailed Pairwise
t-Test
(p-Value)
(Significance Level, 0.05)
NMean °CSt.DEV.NMean °C St.DEV.
Neck4034.6521.064034.650.980.98
Scapula4034.9970.854034.7681.280.17
Hand4034.6260.734034.4390.830.03 +
Shin4033.2151.154033.3031.130.4
Mean Skin Temperature4034.3420.564034.2720.540.22
Note: BS = biophilic session and NBS = non-biophilic session. + significant result.
Table 9. Heart rate and LF/HF of participants between the BS and the NBS.
BSNBSTwo-Tailed Pairwise t-Test (p-Value)
(Significance Level, 0.05)
NMeanSt.DEV.NMeanSt.DEV.
HR (bpm)4081.2510.684080.910.260.55
LF/HF403.413.02403.322.80.84
Note: BS = biophilic session and NBS = non-biophilic session.
Table 10. The heart rate and LF/HF of participants attending the BS and the NBS at two time points, TP1 and TP2.
BSTP1TP2Wilcoxon Sign Rank Test (p-Value) (Significance Level, 0.05)
NMeanSt.DEV.NMeanSt.DEV.
Thermal Sensation390.770.63390.620.750.2179
Thermal Comfort390.951.1391.281.190.0755
Thermal Acceptability390.950.32390.850.540.3139
NBSTP1TP2Wilcoxon Sign Rank Test (p-Value) (Significance Level, 0.05)
NMeanSt.DEV.NMeanSt.DEV.
Thermal Sensation400.750.59400.8750.850.4283
Thermal Comfort400.851.19400.41.450.2670
Thermal Acceptability400.90.44400.750.670.2421
Note: BS = biophilic session, NBS = non-biophilic session, TP1 = time point 1, and TP2 = time point 2.
Table 11. The four local skin temperatures and the mean skin temperature of participants attending the BS and the NBS at the two time points, TP1 and TP2.
BSTP1TP2Two-Tailed Pairwise t-Test
(p-Value)
(Significance Level, 0.05)
NMean °CSt. DEV.NMean °CSt. DEV.
Neck3934.4761.083934.8031.137.69 × 10−9
Scapula3934.8670.913935.1590.812.705 × 10−8
Hand3934.3460.793934.9420.676.92 × 10−13
Shin3933.0971.133933.2751.150.0035
Mean Skin Temperature3934.1790.63934.4970.561.79 × 10−12
NBSTP1TP2Two-Tailed Pairwise t-Test
(p-Value)
(Significance Level, 0.05)
NMean °CSt. DEV.NMean °CSt. DEV.
Neck4034.4330.954034.8530.972.54 × 10−10
Scapula4034.6341.294034.9011.282.59 × 10−10
Hand4034.1270.934034.7480.777.18 × 10−10
Shin4033.1981.114033.4151.190.0005
Mean Skin Temperature4034.0950.544034.4470.562.94 × 10−13
Note: BS = biophilic session, NBS = non-biophilic session, TP1= time point 1, and TP2 = time point 2. All comparisons are significantly different.
Table 12. The heart rate and LF/HF of participants of attending the BS and the NBS at the two time points, TP1 and TP2.
BSTP1TP2Two-Tailed Pairwise t-test (p-Value) (Significance Level, 0.05)
NMeanSt.DEV.NMeanSt.DEV.
HR (bpm)4082.6311.554082.1911.010.48
LF/HF403.133.17403.353.740.76
NBSTP1TP2two-tailed pairwise t-test (p-Value) (significance level, 0.05)
NMeanSt.DEV.NMeanSt.DEV.
HR (bpm)3982.0210.473981.7810.660.62
LF/HF393.073.06393.183.030.86
Note: BS = biophilic session, NBS = non-biophilic session, TP1= time point 1, and TP2 = time point 2.
Table 13. The BS and NBS comparisons at TP1.
Thermal StateBSNBSWilcoxon Sign Rank Test (p-Value) (Significance Level, 0.05)
NMeanSt.DEV.NMeanSt.DEV.
Thermal Sensation400.750.63400.750.590.8978
Thermal Comfort400.971.1400.851.190.6139
Thermal Acceptability400.950.32400.90.440.5686
Note: BS = biophilic session and NBS = non-biophilic session.
Table 14. The BS and NBS environmental temperature comparison at TP1.
TP1BSNBSDFtp-Value
NMean °CSt.DEV.NMean °CSt.DEV.
3929.0350.193928.9720.18381.520.1369
Note: BS = biophilic session, NBS = non-biophilic session, and TP1 = timepoint 1.
Table 15. Abbreviations.
Abbreviation Abbreviation
BSBiophilic SessionSTSkin Temperature
HMDHead-Mounted DisplayTP1Time Point 1
HRHeart RateTP2Time point 2
IVEImmersive Virtual EnvironmentsTSQThermal State Questionnaire
NBSNon-Biophilic SessionV (x)Thermal State Votes
PR (x)Physiological ResponseV (s)Thermal Sensation Votes
PR (st)Physiological Response (skin temperature)V (c)Thermal Comfort Vote
PR (hr)Physiological Response (heart rate)V (a)Thermal Acceptability Vote
Publisher’s Note: MDPI stays neutral with regard to jurisdictional claims in published maps and institutional affiliations.