1. Introduction
Access to clean and adequate water is one of the key agendas of the United Nations [
1], and they declared 2005–2015 as an international decade for Action “Water for Life” [
2]. According to availability and ease of access, surface water may be the most dependent water source for drinking and domestic purposes. However, with increased industrialization and urbanization, surface water faces serious threats, in terms of quality and quantity. The competition for water often results in conflict between different sectors [
3]. Groundwater is present at the unsaturated zones, especially in the pores of sedimentary formations and faults, fractures and joints in hard rocks [
4]. On a global scale, groundwater serves 50% of drinking and 43% of irrigation needs [
5]. India is one the largest users of groundwater resources and the usage is increasing drastically. As an agriculturally lead economy, 80% of the groundwater in India is used for irrigation (Dhavan, 2017), and the remainder is used for drinking, domestic and industrial purposes. Uncontrolled pumping has lowered the groundwater level severely and been reported as overexploited in many parts of India (Dhavan, 2017).
Chennai is India’s fourth largest metropolitan area and the biggest urban area in the Chennai River Basin (CRB). One of the earliest acts on regulating groundwater use and policy in India was The Chennai Metropolitan Area Groundwater (Regulation) Act in 1987, which banned the extraction of groundwater at 229 locations [
6]. Further amendments to this restriction were made in 1995 and 2008. The rapid increase in population, industrialization, urbanization and irrigation, have resulted in huge demand of water from the Chennai Basin. Geographically, the eastern boundary of the basin is a long coastline at the Bay of Bengal. Sea water intrusion into the freshwater zones and groundwater quality deterioration have been reported [
7,
8,
9]. In this region, groundwater depletion and pollution affect the population and the economy, calling for sustainable water resources management. Groundwater is a replenishable resource and its occurrence depends on the recharge process, via seepage of rain or snow to the aquifers [
10]. However, when the extraction exceeds the recharge, the water level lowers and finally dries up. Thus, proper groundwater management needs an efficient estimate of the existing reserve, via identification of potential zones, and also plans for recharging at adequate locations [
11]. There are several factors controlling the groundwater potential, namely, geology, geomorphology, land use, lineaments, rainfall, slope, relief, etc. [
12,
13,
14,
15]. According to the location, the source water for recharge varied considerably. Frequent floods in Chennai can be managed to recharge water, and it is being practiced in many places all over the world [
16,
17].
Estimating groundwater reserves and the demarcation of prospective zones is the preliminary step of any water resources management project. Accurate calculation of inputs (recharge) and outputs (discharge) is essential at this stage. Systematic planning of groundwater exploitation, using modern techniques, is necessary for the proper utilization and management of this precious, but shrinking, natural resource (Chowdhury 2007). The use of conventional techniques, such as geological, geophysical, geostatistical and numerical modeling, are expensive, laborious and time-consuming [
18]. The rapid growth of space technology has played a vital role in groundwater studies. Remote sensing (Rs) and the geographic information system (GIS) are promising tools for the efficient planning and management of groundwater resources [
19,
20,
21,
22]. NRSA, in India, is one of the pioneers in using the integrated study of RS and GIS for delineating groundwater recharge potential in an area [
23]. Geospatial technologies provide cost-effective solutions for the aquifer management and integration of multi-thematic data sets to a uniform scale [
24].The use of RS and GIS is extensive in India, for the mapping and monitoring of groundwater potential zones and locating suitable locations for the artificial groundwater recharge [
25,
26,
27,
28,
29]. There are many studies found in different parts of India (Kurmapalli watershed, Andhara Pradesh [
30]; Bist-Doab Basin, Punjab [
31]; Arkavathi sub-watershed, Karnataka [
32]; Bankura District, West Bengal [
28,
33]; Mandovi river basin, Andhra Pradesh [
34]; Theni district, Tamil Nadu [
27]), and many more on groundwater potential zone delineation, using GIS techniques.
Recently, GIS techniques are used in combination with the multi-criteria decision-making (MCDM) technology, such as the analytic hierarchy process (AHP) [
35], in the weight assignment to the thematic layers [
36]. These techniques can successfully integrate structure, suitability and precision to the decisions [
19,
37]. AHP techniques are now frequently used in environmental problem-solving and management. Many researchers have used AHP in environmental impact assessments [
38,
39,
40] and solid waste management [
41,
42]. Groundwater potential mapping and locating suitable sites for artificial recharge is the most widely used and successfully implemented application of AHP technology [
43,
44,
45,
46,
47].
Most of the studies in the CRB focus on groundwater quality, saline intrusions, hydrochemical investigations, managed aquifer recharge, etc. [
48,
49,
50,
51,
52]. All these studies were performed at a watershed or sub-basin level. A more holistic approach is needed because the groundwater supply to the city also includes the well fields, located north of Chennai. Thus, a study must be performed on the complete basin, with special emphasis on the urban area. The present study is concentrated mainly on mapping the potential groundwater zones in the Chennai River Basin (CRB), using GIS and AHP methods. Eleven thematic layers were generated from vector to raster maps and the weights were assigned using AHP methodology. The groundwater potential map generated was finally compared with the specific capacities of 51 borewells from the field. Finally, this study aims to create a groundwater potential map of the whole CRB, for sustainable groundwater management in future.
2. Study Area Settings
Chennai Basin is located in the north-east region of Tamil Nadu State, with latitudes 12°40′ N and 13°40′ N and longitudes 79°10′ E and 80°25′ E. The major portion of the basin is in Tamil Nadu and the remaining portion is in the Andhra Pradesh state. The climate of the study area is semi-arid tropical, with temperatures ranging from 13.9 °C to 45 °C [
53]. The highest temperature is recorded in Chennai in the summer season and the lowest in Tiruthani in the winter season. Variation in the availability of sunshine varies mostly by season. The location map of the study area is shown in
Figure 1. On average, the annual rainfall is 1156 mm/year. Relative humidity in the basin varies from 53 to 84% and the wind velocity varies from 5.69 to 14.15 km/hr. The total water potential of the basin is 2026.22 MCM, in which 906 MCM is the surface water, 1120.22 is the share of groundwater [
54].
Geomorphology represents the origin, structure, development of landforms and alteration by human beings. Geomorphology can also hint to the underlying futures and processes that control the evolution of the landforms. A wide range of geomorphological features are available in the study area. The major formations are beaches, beach ridges, beach terraces, buried pediments, wash plains, salt pans, swamps, swale, deltaic plains, deep pediment, pediment and shallow pediment, buried course and channels, Tertiary uplands, flood plains, Piedmont, and interfluve. Geologically, Chennai Basin is overlaid by the Precambrian gneisses and charnockites, above which are the marine and estuarine fluvial alluvium. The hard rocks include granite, gneissic complex, schists and chamockites, associated with basic and ultra-basic intrusive rocks. The chamockites form the major rock types and constitute the residual hills around Pallavaram, Tambaram and Vandalur. Among the sedimentary formation’s conglomerates are shale and sandstone, which are covered by a thick layer of laterite. Tertiary sandstone is seen in small patches in the area around Perambur, and the around north-west of Chennai city and up to Satyavedu, and is capped by lateritic soil. In the Chennai Basin, the following four different types of Soils were observed: (i) Entisols, (ii) Inceptisols, (iii) Vertisols and (iv) Alfisols.
The land use pattern of the study area is largely comprised of agricultural lands. These lands are divided into irrigated, non-irrigated and elevated lands. The rivers, tanks, canals, open dug wells and borewells are the source water for irrigation. Of the total area, 20% is intensely irrigated and 25% of the area is lightly irrigated. The remaining area is either water-covered or wastelands. Wells (46.5%) and tanks (42.2%) are the primary source of water for irrigation in this basin and the remaining is contributed by the rainfall. Agriculture is also dependent on the monsoon, and usually one wet and one dry crop is raised in a year. Paddy is the largest cultivation, and groundnuts, gingelly, pulses, ragi, and sugar cane are also grown here. Modern irrigation techniques, such as drip irrigation, may improve production, but the farmers must have awareness of this.
The main aquifer system of the Chennai Basin is formed by the river alluvium, as well as Tertiary formations of the AK basin. The groundwater is mainly recharged by the rainfall recharge and river network. In the northern part, the Minjur aquifer is already overexploited and facing threat from seawater intrusion. South Chennai coastal aquifer is also not an exception. The present situation at the study area calls for immediate action to identify the groundwater potential zone and artificial recharge, to protect the groundwater reserve.
3. Data and Methods
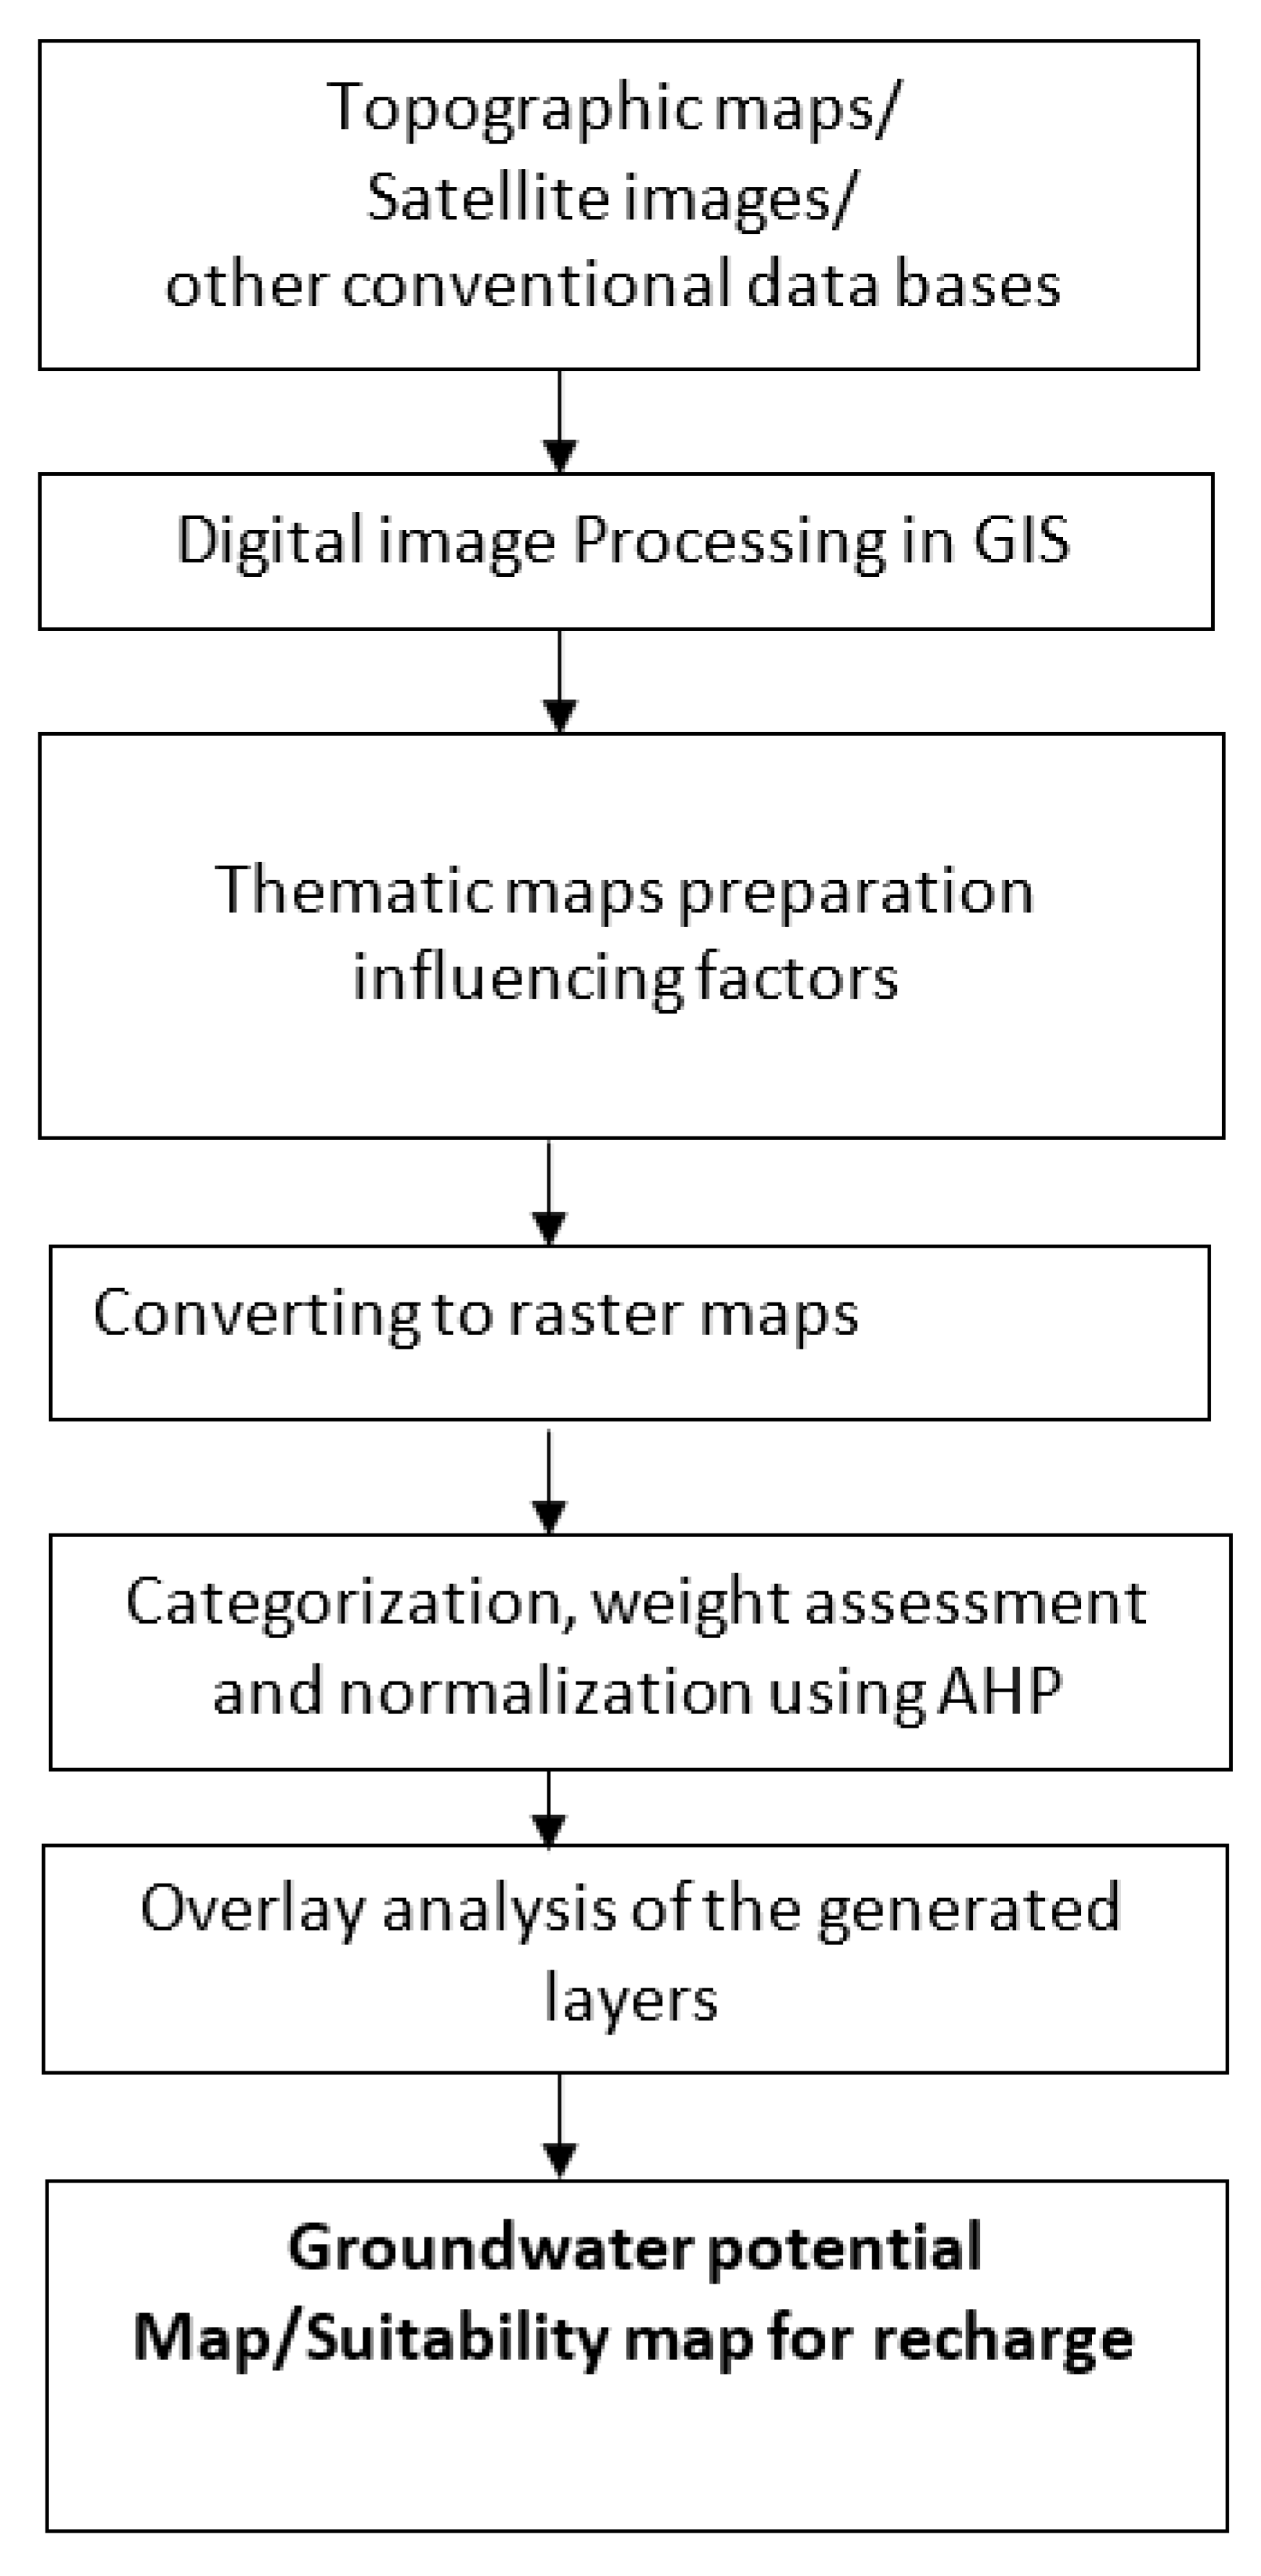
Factors influencing groundwater recharge are determined based on literature survey, field analysis and expert opinion. Based on this preliminary investigation geomorphology, geology, lineament, annual rainfall, pre-monsoon water level, depth to bed rock, soil, land use, aspect and slope were chosen as main factors. All these maps where digitized and integrated into a GIS platform using ArcGIS 10.2. The map layers used, and their hydrogeological significance are summarized in
Table 1. Conventional data sets, such as topographical maps and field data, were used along with advanced data sets, such as satellite data. Corresponding topographic maps were collected from Survey of India (SOI), with a scale of 1:150,000. These maps were digitized in the GIS environment using ArcGIS 10.1. A geological and geomorphological map for the study was prepared from the SOI maps and soil map from the National Bureau of Soil Science and Land Use Planning (NBSS and LUP). SRTM-DEM were used to derive the slope maps. A flow chart of the adopted methodology is shown in
Figure 2.
Data for the analysis were available in vector (from existing maps) and raster (interpolated from point data or classified from satellite images) formats. For rainfall, depth to bed rock, water level, and elevation, layers were created from the point data sources by the Inverse Distance Weighted (IDW) interpolation method. In the IDW method, the unknown data points are calculated from the four surrounding known data points. We opted for IDW over distance threshold methods, because the point data was sparse and distributed. The slope map was derived from the elevation contours from the Survey of India topographical maps of the study area.
Analytic hierarchical process (AHP), which was originally proposed by Saaty [
35], was used for assigning the weights for each thematic layer used in this study. AHP is one of the most commonly used multi-criteria decision-making techniques in the field of environmental and groundwater studies [
55,
56].
In this method a pairwise comparison matrix is generated by comparing the assigned scores for each layer. The scores are generally assigned between 1 (equal importance) and 9 (extreme importance) (
Table 2, [
57]). In the AHP model, a pairwise comparison matrix for the 11 layers was created. The normalized weights of the individual layers were created using the eigenvector method.
The weight of each thematic layer is derived from the maximum eigenvalue in the normalized eigenvalue in the pairwise comparison matrix. The reliability of the judgment is dependent on the consistency ratio (
CR) and its value must be less than or equal to 0.1. In case it exceeds this limit, it is suggested to revise the process.
CR is calculated as follows:
Here
RI is the Random Consistency Index (see
Table 3) and
CI is the Consistency Index, which is calculated as follows:
In this equation, λ is the principal eigenvalue of the matrix and n is the number factors used in the estimation (Saty 1980).
Groundwater potential zones were derived from 11 thematic layers integrated into the GIS environment to calculate the groundwater potential index (
GWPI). This is done by weighted linear combination (WLC), as suggested by Malczewski (1999).
Here GWPI is the groundwater potential index, Xi is the normalized weight of the ith feature of the thematic layer, wj is the normalized weight of the jth thematic layer, m represents total number of themes, and n is the total number of classes in a theme.
4. Results and Discussion
4.1. Thematic Layers and Features in the CRB
4.1.1. Mapping and Analysis of Slope
Slope is an important geomorphological feature that affects the groundwater potential of a region and an important parameter in identifying groundwater recharge prospects [
58]. Groundwater potential is greater in gentle slopes, as more infiltration occurs due to the increased residence time. On the other hand, the increased runoff rate for steep slopes makes them less suitable for groundwater recharge. In this study, the slope varies from 0 to 80.44%, the majority of the area having a slope between 0 and 4.73%. The highest slopes were found mostly in the western region of the study area. Based on this, the slope range between 0–4.73% was given a weightage of 7 (very good), with 4 (moderate), 3 (moderate) and 2 (poor), given to subsequent classes (see
Figure 3). Generally, steep slopes are given lower weights and gentle slopes, higher weights [
13].
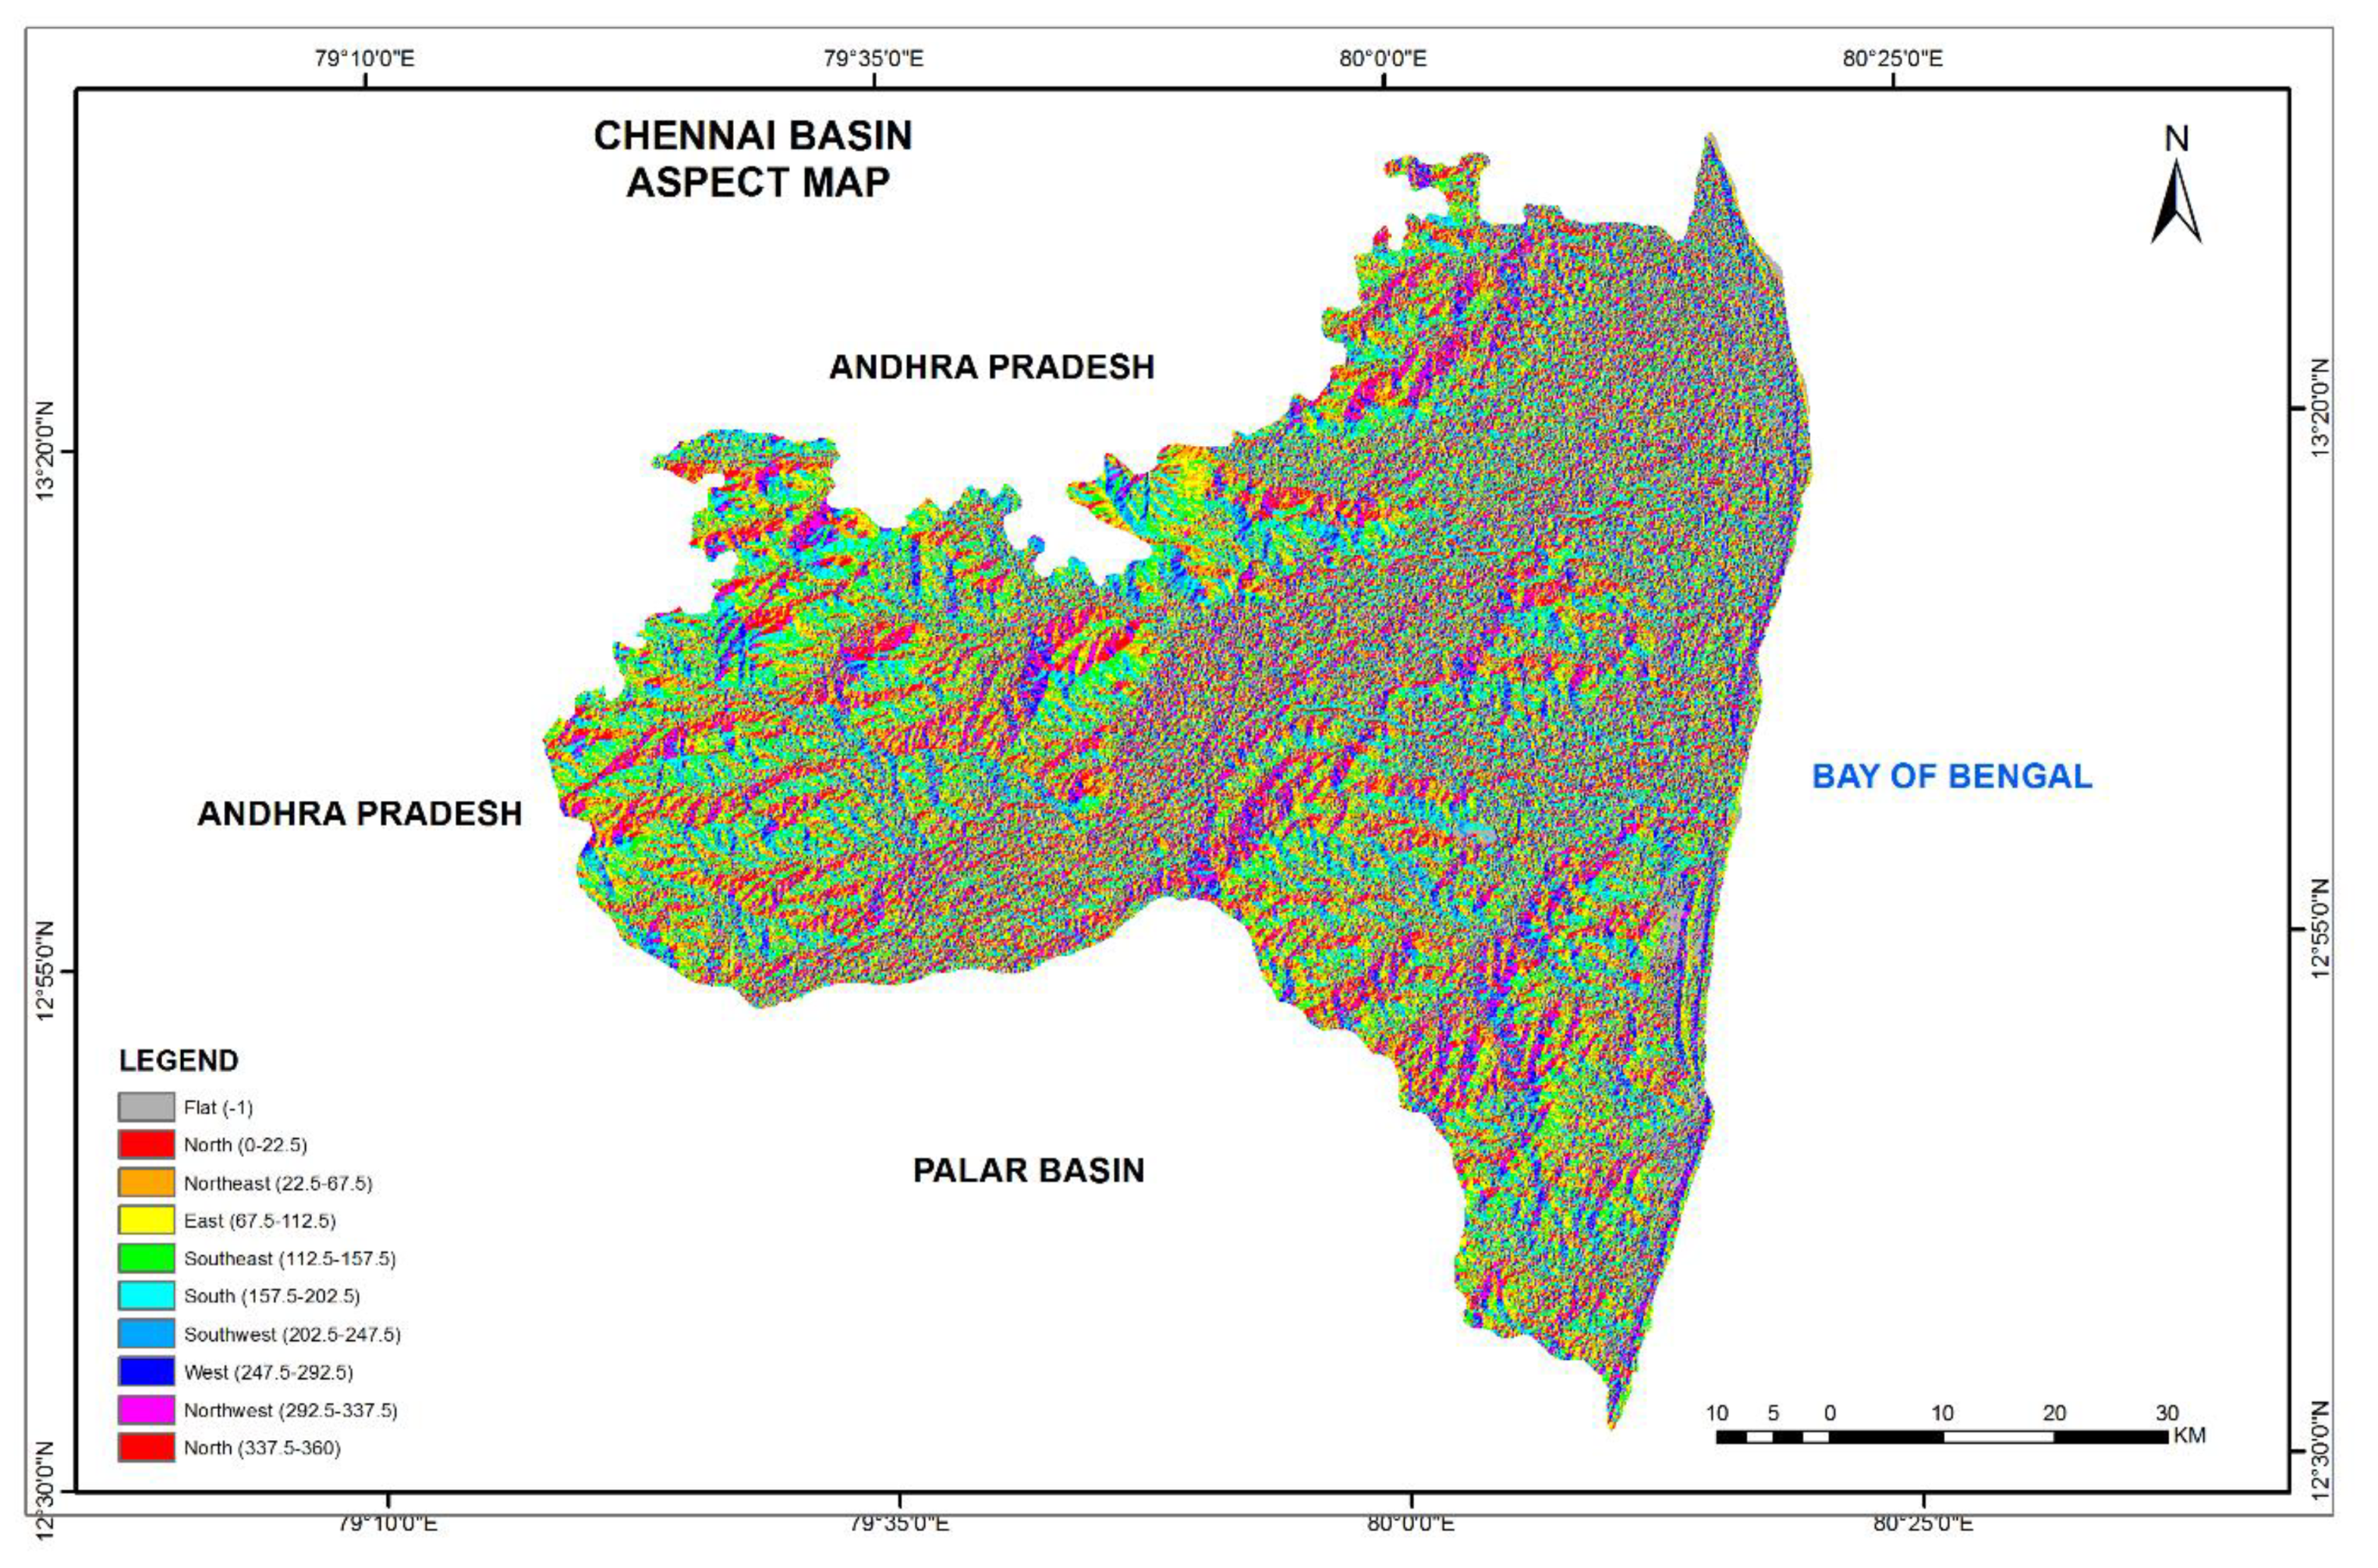
4.1.2. Mapping and Analysis of Aspect
Aspect is an important terrain characteristic that affects the groundwater recharge characteristics of a basin. It is the direction of slope usually measured clockwise, from 0 to 360°. Zero means the aspect is facing north, 90,180 is south-facing, and 270 is west-facing. In arid and semi-arid regions, microclimatic changes are dependent on slope exposure direction and drainage basin development. Thus, the aspect has a direct influence on the microclimates [
59,
60]. An aspect map of the study area is shown in
Figure 4. The aspect of the CRB is trending towards all the directions; however, higher weightage is given to the flat terrains and the lowest to those areas trending north.
4.1.3. Mapping and Analysis of Groundwater Level
In unsaturated conditions, the upper level of the saturated underground surface, in which water pressure equals the atmospheric pressure, is known as groundwater table [
61]. Depth to the water table is a measure of groundwater recharge or discharge. When the water table is deep, the flow is towards the water table, via percolation and infiltration. On the other hand, when the water table meets the land surface, the flow is away from the water table [
62]. So, for potential recharge zones, a higher depth to the water table is an essential factor. The groundwater level in the study area varies from 0 to 21 m below ground level. Most of the region in the study area falls between 6 and 11 m below ground level (MBGL) (
Figure 5). As the depth to the water table increases, the possibility of recharge increases because of the increased storage in the aquifers. Greater weight is given to those regions where the depth to the water table is high and vice versa.
4.1.4. Mapping and Analysis of Rainfall
Timely, adequate rainfall is important in enhancing the groundwater potential of any study area [
63]. In this study, rainfall was considered an important factor and, thus, made it a thematic layer. Rainfall data for the past 44 years has been collected by the India Meteorological Department (IMD). A spatial variation map of the rainfall was created with the IDW interpolation method. The minimum and maximum rainfall received in the Chennai Basin were 770 and 1570 mm, respectively. The coastal part of the basin receives a high amount of rainfall, compared to the western part. A spatial map of rainfall in the Chennai Basin is given in
Figure 6.
4.1.5. Mapping and Analysis of Lithology
The geology of an area is one of the key factors in groundwater potential zone delimitation. Various geological formations have different water-bearing capacities and subsurface flow characteristics. A considerable variation in the water-bearing capacities may be found between sedimentary, igneous and metamorphic rocks, of recent to Precambrian periods (see
Figure 7). The other principal factor is the weathering of the rocks, which increases the groundwater potential of the area. The Chennai Basin exhibited a wide range (sedimentary–metamorphic–igneous) of geological formations. Starting from the eastern coastal region, a long stretch of coastal alluvium is observed throughout the study area, as well as charockites on the southern edge. From the middle to the north, alluvial formation begins and extends to greater areas towards the west. Laterites are found in the northern part of the basin and also spread in between the alluvial formations. In the southern part, just near to the charnockite, there are thick shale sandstone formations. The western end of the area is marked by biotite hornblende gneiss, with a lengthy patch of hornblende-epidote. The geology of the area suggests that the possible high groundwater bearing formations are alluvium and sandstone. Considering the geology of the area, alluvium and sandstone are promising locations for groundwater development. However, the degree of weathering, lineament and fractures determine the same for the hard rock formations.
4.1.6. Mapping and Analysis of Drainage
Drainage, and its density, is a key factor in groundwater potential [
21]. The higher the drainage density, the lower the permeability and infiltration [
36]. The drainage network map of the Chennai Basin is shown in
Figure 8. The Chennai Basin has many rivers, tanks and reservoirs. Since the basin has mostly permeable formations, as well as built-up areas, the drainage density of the basin is very low. Thus, the main features are classified as rivers, tanks/reservoirs and others. Suitable ranking is given to each feature, depending on their groundwater potentiality.
4.1.7. Mapping and Analysis of Soils
Soils play an important role in groundwater potential and its characteristics are varied, with respect to grain size and types [
24]. Soils in the study area can be classified into clay, clay loam, loamy sand, sand, sandy clay, sandy-clay-loam and sandy loam, as shown in
Figure 9. Along the beaches, sand and sandy clay loam types are present, and these formations are permeable and can work as an aquifer. These formations are extensively found along the East Coast Road (ECR) and are useful for agricultural activities.
Clayey soils are found in the northern region, namely Gummidipoondi, Ponneri, Minjur, Madhavaram and Manali, and in the western portion of the East Coast Road around Thiruporur. These soils have much lower infiltration rates. Weights assigned for the soil layer are mainly based on the infiltration rate. As a result, clayey soils have been given the lowest weights, while sandy soil receives the highest.
4.1.8. Mapping and Analysis of Land Use
Land use is a critical factor that determines the water-holding capacity of the soils. Forest areas have high potential, whereas concreted areas have less potential for recharge. The rapid increase in population resulted in extensive changes in the land use pattern of the CRB. Groundwater recharge is largely controlled by the land use. Hence, a proper understanding of land use is necessary for sustainable groundwater development. Overexploitation of water resources, for various purposes, has a severe impact on the water system. Increased water exploitation has led to a reduction in water recharge and groundwater storage of the area. The various land use patterns of the study area are presented in
Figure 10. Cropland, mangroves, shrubs, and Casuarina cover a majority of the study area.
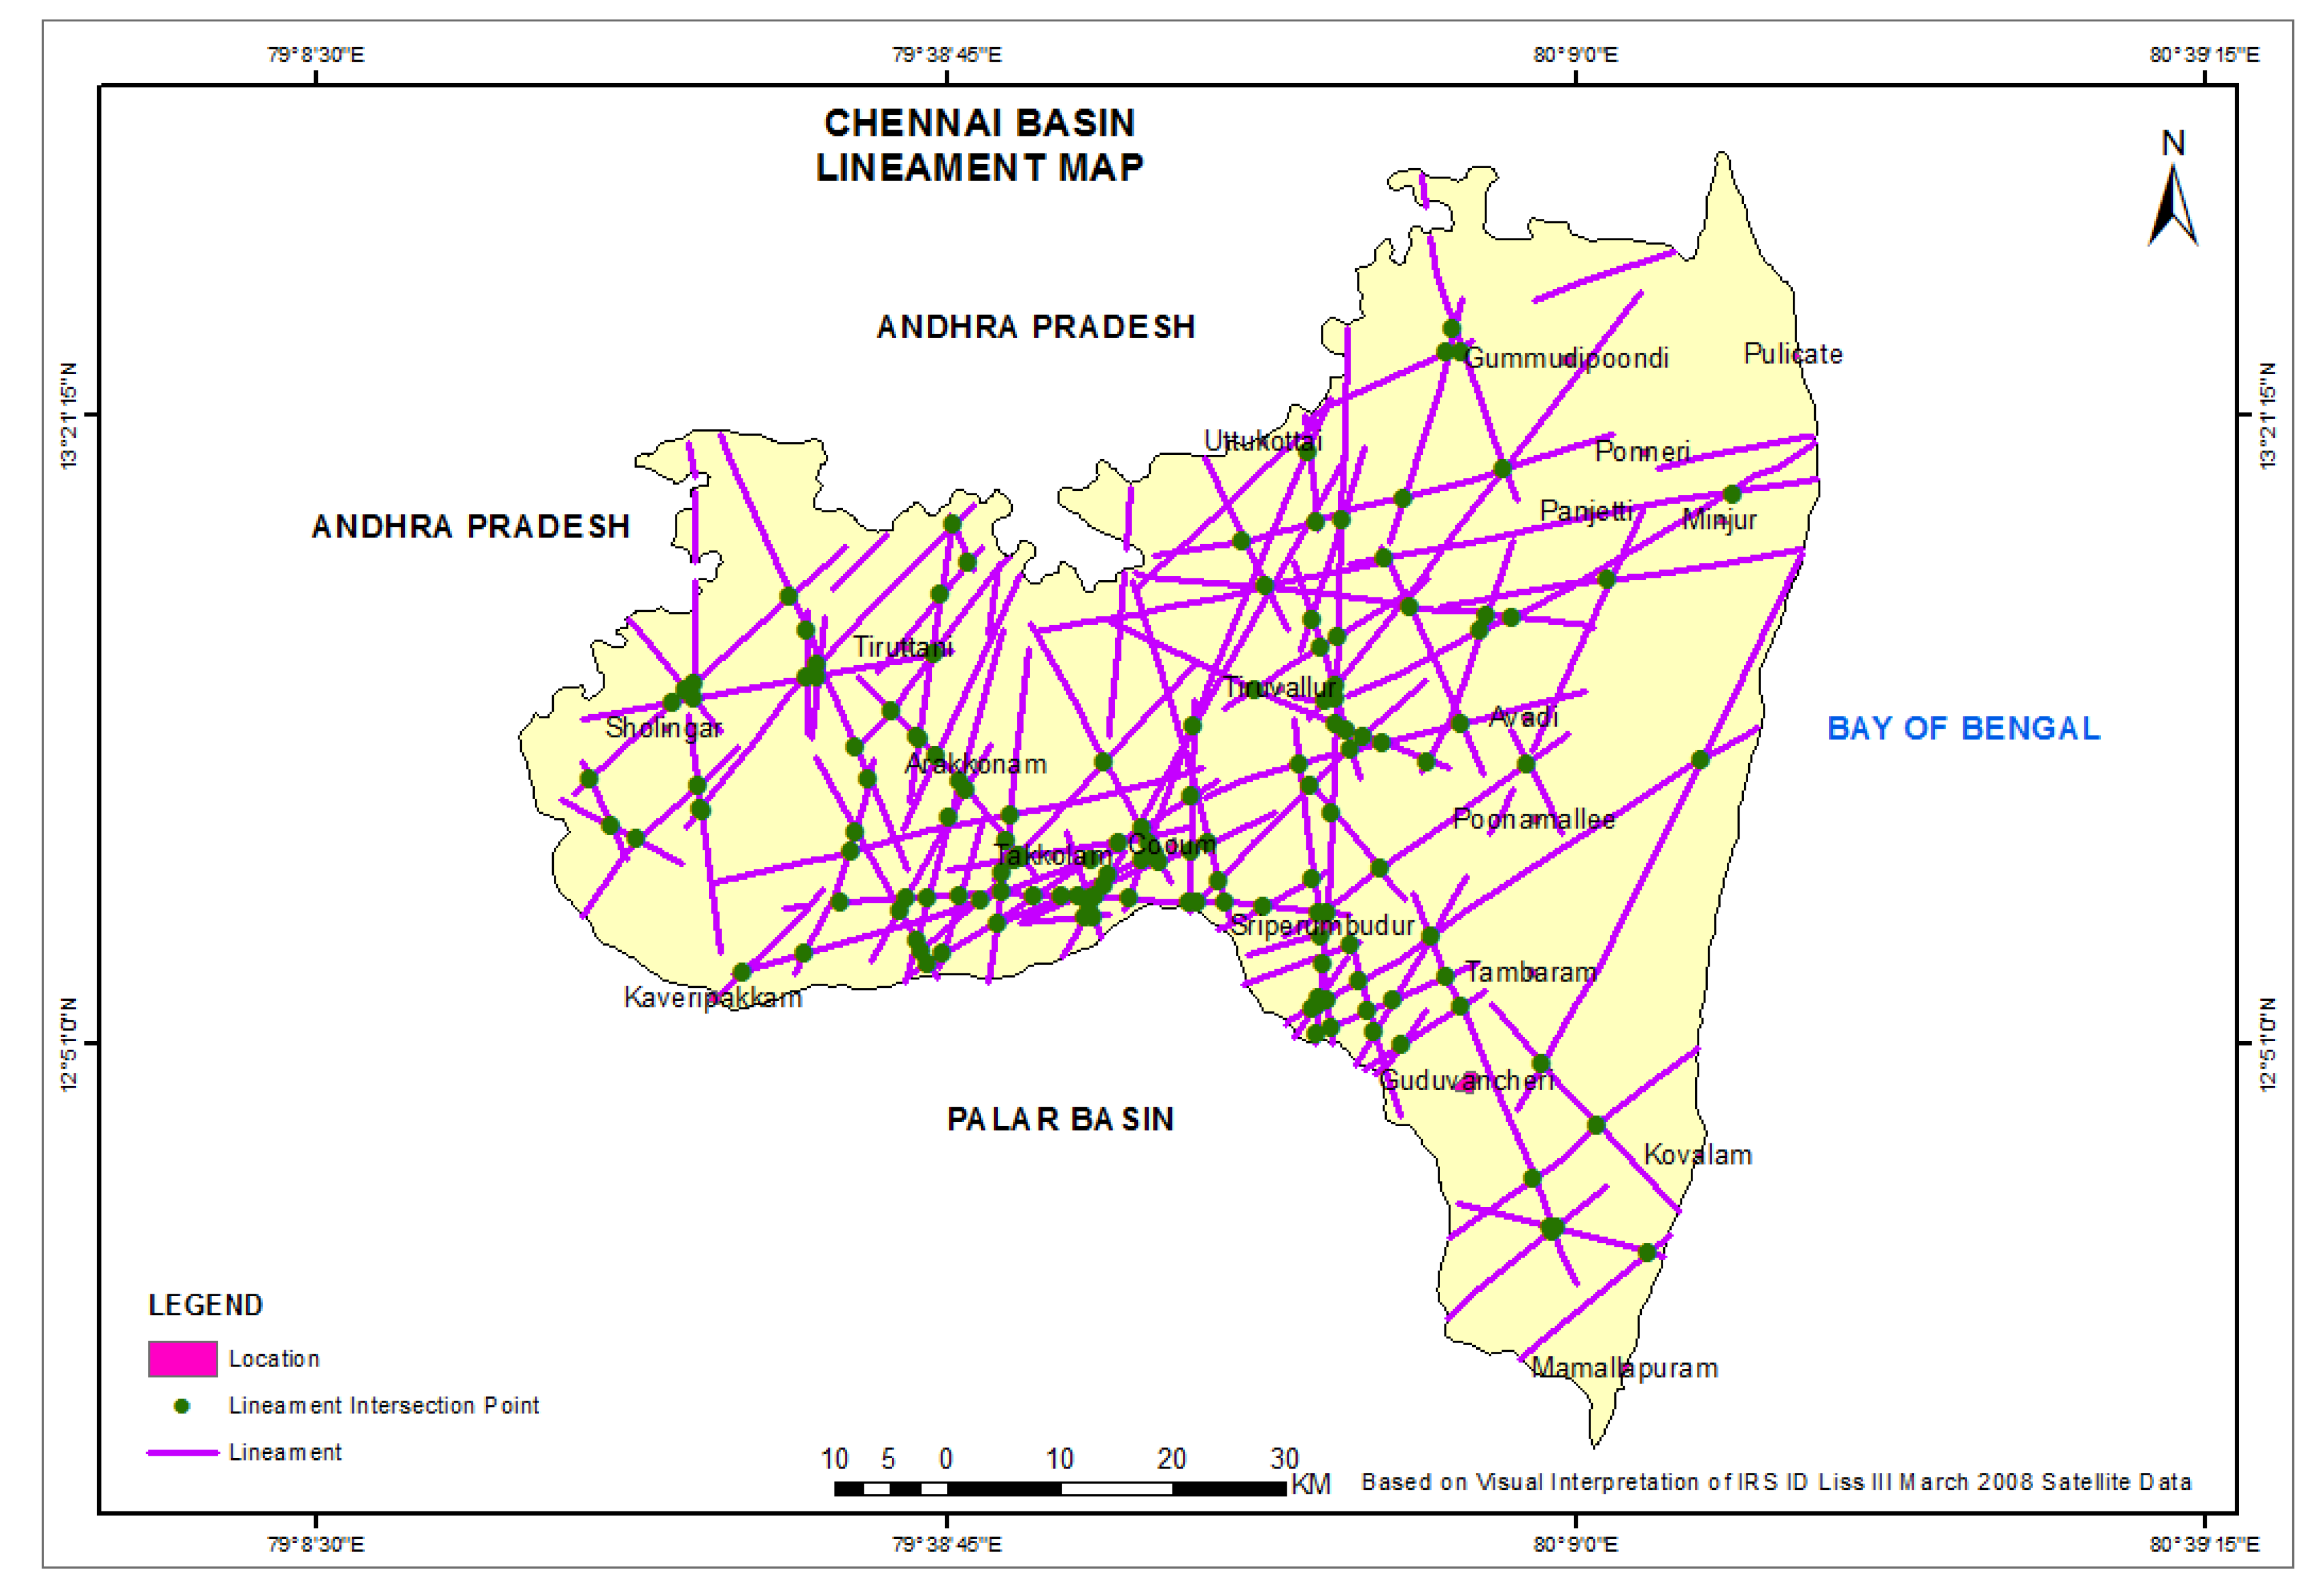
4.1.9. Mapping and Analysis of Lineaments
Lineaments are rectilinear alignments observed on the surface of the earth, which are representations of geological or geomorphological events. They can be observed as straight lines in digital data, which represent a continuous series of pixels, having similar terrain values. Large scale lineaments can be identified from remotely sensed images. Lineaments are the primary indicators of secondary porosity and also for potential sources of water supply. The presence of lineaments is observed in all directions in the study area. The lineament density seems to be very high in Takkolam, Cooum, Sriperumbudur, Thiruvallur, Thiruthani, etc. (
Figure 11).
4.1.10. Mapping and Analysis of Geomorphology
The Chennai Basin has exceptionally versatile geomorphological features, with beaches, beach ridges, beach terraces, buried pediments, wash plains, salt pans, swamps, swale, deltaic plains, deep pediment, pediment and shallow pediment, buried course and channels, Tertiary uplands, flood plains, Piedmont and interfluve. The presence of rivers, coastal regions, hills and plain land make this area an example of a complex geomorphological set up. It has a long coastal belt on the eastern boundary, where the city of Chennai is located, with one of the most densely populated regions in Southern India. The NE boundary of the study area has a long portion with duricrust, a hard mineral layer on top of the sedimentary formations. Tertiary laterites are found as patches all along the basin. In the western part, structural hills are visible. Lower Gondwana formations are seen in the southern and central parts. Upper Gondwana formations are pediments seen in the Tambaam region part of the city. At the northern part, along the state boundary of Andhra Pradesh, Tertiary uplands form a larger area and the same is present in the north of the city. A detailed geomorphological map of the study area is shown in
Figure 12.
4.1.11. Mapping and Analysis of Depth to Bed Rock
Depth to bed rock is a representation of the thickness of unconsolidated or weathered formations in the area. The depth to bed rock in the CRB varied from 11 to 829 m (
Figure 13). Southern coastal regions and the western part of the CRB has weathered thickness up to 45 m. The deepest depth to bed rock is found in the extreme northern region. Based on these values, three major categories, such as poor, moderate and very good, with corresponding weights 5, 6 and 8 were assigned for the layer.
4.2. Normalized Weights for Thematic Maps
The pairwise comparison matrix of the groundwater prospecting thematic layers was derived based on the AHP method. The weights were normalized and the weights for individual thematic layers were calculated using the eigenvector method (
Table 4).
Table 5 shows the normalized weights of each layer and their corresponding total weightage. The maximum weightage shows the most influential parameter, and the minimum weightage represents the least influential parameter. In the CRB, depth to bed rock, or aquifer thickness, play the most important roles, with 20.33% weightage; with 15%, geomorphology was the second most important parameter. The relative importance of the other parameters is as follows: lineament (12.37%), land use (12%), soil (9%), drainage (8.2%), geology (6.6%), rainfall (4.9%), aspect (4.5%), water level (4.2%), and slope (2.6%).
To check the consistency of the assigned weights, the consistency ratio was calculated using the formula mentioned in the methodology. For the 11 layers (
n = 11), the consistency ratio was found as 0.98, which is <0.10. This means that the weight assessment was consistent (
Table 6).
4.3. Groundwater Potential Zones
Groundwater potential zone identification and mapping, using GIS and RS, is widely done in India and on a global scale [
12]. Assigning weights accurately is the key factor in obtaining reasonable results [
64]. Choosing the controlling factors of groundwater potential depends on the study area and, of course, the availability of the data. Based on these factors, the thematic layers were prepared from the vector data. As the number of layers increased, the accuracy of the map is improved [
42]. The most common factors used in groundwater potential identification are geology, geomorphology, soils, land use, slope, lineaments and drainage density [
63].
The accuracy of the potential map depends on how precisely the weights are assigned to each layer [
19]. Researchers used several methods in assigning accurate weights to the thematic layers and the AHP method is widely used [
13,
15,
22,
65,
66]. In this study, groundwater potential zones were identified using AHP-aided methodology. The output map, generated by weighted linear combination (WLC), shows five different classes, such as very poor, poor, moderate, good and very good potential for groundwater. The results are presented in
Table 7 and the spatial variation map for groundwater potential is shown in
Figure 14.
The groundwater potential is very poor in the western regions, especially the north-western region and the coastal region of the Chennai and Kancheepuram area. It is 15.4% of the total area, with a land area of 930.9 km2. Geologically, the western region is mostly made up of charnockite formations, and the coastal region of alluvium deposits. It is obvious that the enormous charnockite is not a good aquifer, unless there are factures or joints. In general, alluviums have good water-bearing capacity, but the potential is shown to be low in the analysis. This can be explained by the over-exploited aquifer system, especially in the South Chennai coastal aquifer. Increased urbanization and population growth directly affect the groundwater potential of these regions. These results agree with the land use map of the study area. There are many barren lands in the western region, and this is also a reason for the poor potential of this area. The second classification of groundwater potential was “poor”, and it is also located mostly in the same geographic regions of the very poor category, possessing the same geological and geomorphological characteristics. This category is second largest among the five classes, with a share of 22.86%, spread over 1379.2 km2 in the CRB. Moderate potential zones are dominant among all classes, with an area of 1636 Km2, 27% of the total land area of the CRB. Moderate potential is observed throughout the basin, however, it is largely located in the SE and NE regions, as well as the central part. The major geology for this group is alluvium, coastal alluvium, and charnockite formations. There is a patch in the middle area of the basin, extending north from Gummidipoondi, in the Thiruvallur district to south in Kaveripakkam, in the Vellore district, which has good and very good groundwater potential. This includes some bordering portions of the Chennai district as well. Both these classes together constitute 34% of the study area, spread over 2100 km2. This area is mostly covered by alluvial formations, resulting from the river system and its deposits.
4.4. Cross Verification of the Groundwater Potential Zones with Bore Hole Data
The groundwater potential map was created based on the available maps of different factors, using a GIS based AHP method. However, it is necessary to verify the results using actual data collected from the field. Researchers have used different methods to validate the generated groundwater potential maps. The authors of [
67] used depth to water table and flow direction, to compare the potential zone with the field data. Most of the studies have used well yield to cross-check the groundwater potential map’s accuracy [
12,
13,
65,
68]. This study used 51 bore holes, in which the specific capacity was compared with the groundwater potential, mapped using a GIS based method. The yield data from the field is classified into low yield (<3 lps), moderate yield (3–6 lps) and high yield (>6 lps). The details of the procedure and the results of the comparison are provided in
Table 8.
The accuracy calculations were done as follows:
- -
Number of boreholes = 51
- -
Number of boreholes that agreed with the result of the mapping = 40
- -
Number of boreholes that disagreed with the result of the mapping = 11
- -
Accuracy of the potential mapping = 40/51 ×100 = 78.43%
This suggests that among the 51 wells, the prediction was reliable in 40 wells. This means that 78% of the potential delineation agreed with the actual data from the field. The use of AHP based groundwater potential zonation, thus, proved to be successful and can be adopted as a cost-effective groundwater prospecting method.


