Article

Research on the Impact of Environmental Regulation on Green Technology Innovation from the Perspective of Regional Differences: A Quasi-Natural Experiment Based on China’s New Environmental Protection Law

Business School, University of Shanghai for Science and Technology, Shanghai 200093, China
*
Author to whom correspondence should be addressed.
These authors contributed equally to this work.
Sustainability 2022, 14(3), 1714; https://doi.org/10.3390/su14031714
Submission received: 9 January 2022 / Revised: 27 January 2022 / Accepted: 29 January 2022 / Published: 1 February 2022
(This article belongs to the Collection Air Pollution Control and Sustainable Development)

Abstract

:
Environmental regulations have a certain impact on regional green technology innovation affected by regional differences. Using the panel data of 30 provincial-level administrative regions in China (excluding Tibet, Hong Kong, Macao, and Taiwan) from 2011 to 2019, we consider China’s new environmental protection law (NEPL) as a quasi-natural experiment to evaluate the impact of environmental regulation on green technology innovation in a difference-in-differences (DID) framework and further analyze the influences of regional differences. The results indicate that environmental regulations can promote regional green technology innovation, and that regional differences have a significant impact on this issue. Furthermore, environmental regulations in regions with high and low levels of economic development and education, and regions with medium and low levels of energy consumption have a significant impact on green technology innovation. The government should reasonably formulate environmental regulation policies on the basis of regional differences, encourage cross-regional exchanges and cooperation, and more efficiently stimulate regional green technology innovation to achieve sustainable development.

1. Introduction

The extensive economic development model in the past decades has made environmental pollution one of the factors restricting the sustainable development of China’s economy. The deterioration of resource and environmental conditions has increased the uncertainty of global development and the unprecedented challenges of the global governance system. Many countries have promulgated environmental laws and regulations to promote environmental protection [1]. Since the green development model has been the basic strategy to promote the harmonious coexistence of man and nature in the report of the 19th National Congress of the Communist Party of China (CPC), ecological civilization construction has become an important strategy for China’s development. The construction of ecological civilization is not only related to the sustainable development of China’s social economy, but also to global ecological security and the healthy development of human beings. The concept of an ecological civilization is increasingly rooted in the hearts of the people, and while pollution control efforts continue to increase, improving environmental quality is urgent [2]. The Chinese government, aware of the seriousness of environmental problems and the importance of green technology innovation, has formulated a series of environmental regulation policies to urge enterprises to reduce their pollution emissions, and to encourage enterprises to carry out green technology innovation through capital investment in recent years.
The Chinese government released the Environmental Protection Law of the People’s Republic of China (Old Environmental Protection Law) in 1989. The revised Environmental Protection Law of the People’s Republic of China (New Environmental Protection Law, NEPL) was implemented in 2015. Compared to the Old Environmental Protection Law, the NEPL implemented more severe penalties and significant supervision, emphasized information disclosure and encouraged public participation. Therefore, the NEPL has been described as the strictest environmental protection law in China’s history. The promulgation of the NEPL marked a new stage of Chinese environmental legislation. The policy impact of environmental regulations has been of wide concern to many scholars.
In April 2019, the National Development and Reform Commission of the People’s Republic of China and the Ministry of Science and Technology of China jointly issued guidance on the construction of a market-oriented green technology innovation system, which further refined the road map and timetable of green technology innovation system construction [3]. Since then, green technology innovation has become the key task of the current national ecological civilization construction. In a brief report on the green patent classification system construction and a green patent statistical analysis of the China National Intellectual Property Administration, the connotation and standard of the green patent were preliminarily clarified. Under the guidance of policies and funds, green industries were represented by energy conservation and environmental protection. Moreover, clean production, clean energy and a circular economy have increasingly become the focus of investment.
On the one hand, environmental regulation, as an important part of public regulation is an effective way to correct market failure. Researching the impact of environmental regulations on the coordinated development of the environment and economy is conducive to the design of the most suitable environmental management system for the Chinese government [4]. On the other hand, green technology innovation is an important means to guide enterprises to improve production technology and to achieve energy conservation and emissions reduction. Therefore, understanding the relationship between the environmental regulations and green technology innovation is helpful to clarify the relationship between environmental protection and economic development, so as to seek the way of a balanced development of the environment and the economy.
China is vast, with some regional differences in social and economic development and natural resources. Whether environmental regulation policies will have different effects in different types of regions is an important research topic. Therefore, based on the study of the impact of environmental regulation policies on green technology innovation, this study further analyzes the differences of environmental regulation policy effects from the perspective of regional differences, with a quasi-natural experiment based on China’s NEPL. In this study, the NEPL is treated as an exogenous policy shock to identify its policy impact on green technology innovation via a difference-in-differences (DID) framework. The impact mechanisms were also investigated to clarify how the NEPL affects green technology innovation and how regional differences affect the policy impact. It is hoped this will provide suggestions for the government to formulate environmental regulation policies according to the actual situation of a region, and for enterprises to carry out green technology innovation according to their own individual situations.

2. Literature Review

2.1. Research on Environmental Regulation

Environmental regulation as an effective means to restrain corporate behavior and protect the environment, and the study of its connotations and effects have been the focus of academic attention. Scholars’ researches on environmental regulation have mainly focused on the following three aspects. First, many scholars have studied the definition and evolution of environmental regulation. There are a number of classifications of environmental regulation according to definitions from different angles. Command-and-control regulation (CCR) and market-based incentive regulation (MIR) are two commonly mentioned environmental regulations [5,6,7]. Some researchers have also proposed environmental regulations such as informal environmental regulation, implicit environmental regulation and public participation environmental regulation that are not implemented by the government [8,9,10]. Second, the research on the measurement of the level of environmental regulation, index selection and measurement method has been one of the most important themes. Considering the quality of relevant variable data, many empirical studies have certain limitations, and there is no unified measurement standard. At present, domestic and foreign scholars mainly measure environmental regulation from the following two perspectives. One is from the perspective of the specific implementation of environmental regulation, the selection of pollution control costs, the proportion of pollution control investment in the total cost or output value of enterprises, or the amount of policy supervision [11,12,13]. The other is to consider pollutant treatment efficiency to construct a comprehensive environmental index from the perspective of an environmental governance effect under environmental regulation [14,15,16]. In addition, environmental regulation efficiency may vary across regions due to being influenced by external environmental factors such as the economic base, industrial structure and education levels [17]. The third aspect reveals that an increasing number of scholars have studied the impact and driving mechanism of environmental regulation and the relationships between environmental regulations, green development and enterprises’ innovation have been the main research aspect. Moreover, these relationships may vary in different regions and periods because of other factors and effects [18,19].

2.2. Research on Green Technology Innovation

The methods for measuring green technology innovation have varied across this research area due to the limitation of data availability. For one thing, some scholars have constructed the green technology innovation index and calculated the green innovation efficiency (GIE) to measure green innovation development [20,21], and for another, green patents have been increasingly used to measure green technology innovation in recent years [22]. According to the relevant definition of the State Intellectual Property Office of China, green technology refers to technologies that are conducive to saving resources, improving energy efficiency, preventing and controlling pollution, and achieving sustainable development [23]. It mainly includes alternative energy, environmental materials, energy conservation and emissions reduction, pollution control and governance, and recycling technology. A green patent refers to the invention, utility model and design patent with the theme of green technology. Patent documents also provide information such as patent inventors, claims, patent families and citations, which is conducive to identifying the type of innovation subject and the quality of the innovation.

2.3. The Impact of Environmental Regulation on Green Technology Innovation

Many scholars have researched the impact of environmental regulation tools and intensity on green technology innovation from the perspective of environmental regulation. At present, there is still much controversy about the research in this area, mainly manifested as a question of whether environmental regulations will positively promote or negatively inhibit the development of green technology innovation in the long run. There are mainly three different views. First is that environmental regulation promotes green technology innovation. The Porter hypothesis claimed that environmental protection policies actually increase the net output of enterprises, and finally improve enterprises’ competitive advantages [24]. Lanjouw and Mody (1996) [25] expanded the study to the United States, Japan, and Germany, and verified the positive effect of environmental regulation on green technology innovation. In addition, Domazlicky (2004) [26], Yang et al. (2012) [27], Mazzanti (2009) [28] and other studies have also verified that environmental regulation has certain technical effects. Xing et al. (2019) [29] found that environmental commitment and sustainability exploitation innovation are fundamental for realizing the positive effects of environmental regulation on firm performance and provided deeper insight into the effect of ambidextrous sustainability innovation in the ‘strong’ Porter hypothesis. Yuan and Xiang (2018) [30] found that in the long run, environmental regulation inhibits patent output and does not support the ‘weak’ Porter hypothesis, while improving energy efficiency hinders labor productivity and does not support the ‘strong’ version of the Porter Hypothesis. Second, environmental regulations may hinder green technological innovation. For example, Chintrakam and Weber (2008) [31] selected the relevant data on the American manufacturing industry to study and concluded that the government’s environmental regulations caused enterprises to lack sufficient funds for the invention of environmental protection technology patents. The third view holds that there is no simple linear relationship between environmental regulations and green technological innovation. On the one hand, some scholars have found that there is a U-shaped relationship between environmental regulations and green technological innovation [32,33], while on the other hand, some scholars have found that there is an inverted U-shaped relationship between environmental regulation and green technology innovation [10,34].
In recent years, scholars have analyzed this problem from different angles. First, from the perspective of different environmental regulation means and tools, different means and tools of environmental regulation have different effects on green technology innovation. For example, the flexible environmental policies have a significant positive impact on technological innovation, and the implementation of environmental regulation has actively alleviated the relationship between flexible environmental policies and technological innovation [35]. The non-linear impact of formal and informal environmental regulations on green growth, and formal and informal environmental regulations have showed different effects at different stages [36]. Government direct funding and tax incentives may promote green technology innovation [37]. The productivity effect driven by market-based incentive regulation is much stronger than that of command-and-control by investigating how different regulatory instruments and the relative stringency impact green productivity based on China’s reality [38]. Second, from the perspective of international technology transfer, the research on the mechanism of foreign direct investment (FDI), the environmental regulation effect, and green technology innovation is one of the most commonly considered aspects. For example, environmental regulations may have a positive effect on enterprise ecological technology innovation through FDI [39]. The influence of environmental regulation and FDI exerted on green innovation efficiency may be different for different manufacturing industries [40]. In addition, the impact of trade structure upgrading on green technology innovation is closely related to environmental regulation [41]. Third, from the perspective of heterogeneity, industry heterogeneity has been the most popular angle. Scholars have usually studied the influence of industry heterogeneity from the aspects of pollution-intensive industries, cleaning industries, technology-intensive industries and labor-intensive industries. For example, Cai et al. (2020) [42] have found that direct environmental regulation has a strong and significant incentive effect on green technology innovation in pollution-intensive industries, and direct environmental regulation can effectively encourage green technology innovation in technology-intensive industries compared with labor-intensive industries. In addition, heterogeneity of the enterprises’ ownership may influence the relationship between the environmental regulations and green technology innovation [43].

2.4. Innovation of This Study

In conclusion, the relationship between environmental regulations and green technological innovation is a complex problem and researching it from different perspectives is conducive to a more profound understanding of this problem. This study focuses on the impact of environmental regulation policies represented by the promulgation and implementation of China’s new environmental protection law (NEPL) on green technological innovation and innovates and supplements the research content on the basis of existing research. Due to the vast territory of China, there are some differences in the scale of economic development, industrial development models and natural resources between different regions, so whether environmental regulation policies will have different effects in different types of regions is an important research topic. In view of this, the innovation of this study is that this study researches the relationship between the environmental regulation policy and green technology innovation from the perspective of regional differences by using the generalized difference method, and further analyzes the influence of regional differences in it, hoping to provide a reference for the formulation of government policies.
Further, the research steps of this study are as follows: First, the generalized difference-in-differences method is used to group the empirical research referring to Cai et al. (2016) [44]. According to the policy effect of the new environmental protection law, 30 provinces in China are divided into 14 treated groups and 16 control groups. Second, the environmental regulation policy selected in this study is representative. According to the impact of the NEPL on the number of green patent applications, this study determines its policy effects and dynamic effects test. Third, this study innovatively sets the grouping and dummy variables according to regional differences, and divides the provinces into three levels, namely, at the level of economic development, the level of education and the level of energy consumption, so as to further identify the impact of environmental regulation policies in the different regions on green technological innovation at the different levels. Fourth, robustness tests are used to further illustrate the reliability of this study. This study changes the explained variables, with the amount of green patent as an indicator for regression testing, and then changes the explanatory variables, testing the effect of the environmental regulation policy with fixed regional differences, with multiplication terms conducted by dummy variables according to the level of the regional differences and environmental regulation policy effect. Fifth, this study summarizes conclusions, analyzes reasons, provides corresponding recommendations for the decision-making of government and enterprises, and finally illustrates the limitations and future research prospects.

3. Mechanism Analysis and Research Hypotheses

This study analyzes the mechanism of environmental regulation affecting enterprise green technology innovation from three aspects: government, enterprise, and regional differences.

3.1. The Mechanism of the New Environmental Protection Law on Green Innovation Activities

Environmental regulation is a policy tool for governments to use mandatory means to reduce environmental pollution. The NEPL is an ordered environmental regulation policy. Compared with other incentive environmental regulation means, its scope of action is more extensive, and it has more stringent mandatory guidelines. Faced with the severe constraints caused by the mandatory environmental regulation policy, enterprises will make decisions according to their own situation, showing heterogeneous self-selection behavior, namely, transfer, upgrading or transformation [45,46]. For small businesses, due to their financial and technical constraints, the cost of environmental regulation cannot be internalized in a short period of time, and relocation or being shut down become the main responses for dealing with the environmental regulation policy. For medium-sized enterprises with certain financial and technical support, green technology innovation is carried out with the goal of energy conservation and emission reduction, and the production line can be transformed, so as to move towards upgrading their business. For large enterprises with strong comprehensive strength, they can carry out all-round resource reconfiguration in the technical space, geographical space and industrial space according to their own characteristics, so as to cope with the environmental regulation through the three ways of transfer, upgrading and transformation [22]. When the compensation effect of the environmental regulation on enterprise innovation exceeds the offset effect of the cost internalization caused by the environmental regulation, then enterprise innovation obtains sustainable conditions, that is, the environmental regulation plays a positive role in promoting enterprise innovation. As with the opinions of the Porter hypothesis, environmental regulation can improve enterprises’ innovation abilities and enhance their competitiveness [24].
With the transfer of time, when mandatory constraints become routine, the society will generally recognize the green development path. At this time, green innovation becomes the main development mode of enterprises. When the enterprise is guided by the concept of green innovation throughout the whole process of output, this process requires a certain period of accumulation and precipitation, and this upgrading and transformation cannot be completed in a short timeframe. Therefore, there is a certain lag in the positive effect from environmental regulation on green technological innovation.
Hypothesis 1 (H1).
The New Environmental Protection Law (NEPL) of China has a positive impact on green technology innovation, but the policy effect is lagging behind.

3.2. The Mechanism of the Regional Differences Influencing Environmental Regulation and Enterprises’ Green Innovation

With regard to environmental protection, in the process of carrying out the national policy, provinces often formulate local laws and regulations according to local conditions from the aspects of economic development, industrial development, and the technical level of their respective provinces. China has a vast territory, and the difference in economic level, education level and energy consumption between the regions will lead to different intensities and types of environmental regulation policies, leading to different effects on green technology innovation.

3.2.1. Differences in Economic Development Levels

This study analyzes the influence of the difference in economic development level on the green technology innovation of the government and from enterprises.
From the perspective of the government, the government’s policy objectives and focus will transform according to the trend of economic development. When regional economic development reaches a certain level, the government often transfers the working focus to industrial transformation and upgrading. Moreover, the relevant literature reveals that environmental regulation can promote the adjustment and optimization of industrial structures in the region. Therefore, the government will actively innovate green technology to accelerate green and clean industrial development. From the perspective of enterprises, the better the regional economic development, the more active the innovation of enterprises is.

3.2.2. Differences in Education Levels

The difference in education level between regions also affects the policy effect of environmental regulation. This study explains the mechanism of environmental regulation in two ways.
First, human capital plays an important role in technological innovation, especially in the R&D ability of employees. The higher education level in the region can often cultivate more high-quality innovative talent, thus providing the necessary human capital support for the green technology innovation of enterprises. Second, as a new engine of economic development, the industry–university–institute cooperation model can promote the R&D innovation activities of enterprises by integrating the tripartite resources of industry, university, and research institutions [47]. In regions with high levels of education, research institutions and universities are more intensive, and the combination of production, education, and research is more active, which can provide the necessary talents and technical support for green technology research and development and reduce the cost of information.

3.2.3. Differences in Energy Consumption Levels

In addition to the difference in economic development levels and education levels, the difference in energy consumption between regions will also affect the green technology innovation of enterprises. Specifically, a regional industrial structure with more energy consumption is generally characterized by a large proportion of the first and second industries, and a small proportion of the tertiary industry, while environmental pollution in the region is often more serious. The government will formulate stringent environmental regulation policies to reduce pollutant emissions to transform the mode of economic development. If the proportion of tertiary industry in the region with less energy consumption is larger, then the pollutants emitted by enterprises in the region are lower, therefore, the environmental protection policy is more relaxed, and the pressure of green technology research and development is reduced.
Hypothesis 2 (H2).
The impact of environmental regulation policies on green technological innovation is different under different economic levels, education levels and energy consumption levels.

4. Materials and Methods

4.1. Model Building Econometric Strategy

4.1.1. Benchmark Difference-in-Differences

This study uses the difference-in-differences (DID) model to analyze the impact of environmental regulation on green technology innovation. Therefore, this study constructs the following regression model and selects the following control variables based on the theoretical analysis:
Y i , t = α 0 + α 1 · t r e a t i , t × p o s t i , t + δ · x i , t + μ i , t + γ i , t + ε i , t
In the upper formula, i denotes a province, t denotes the year. The explained variable Y i , t measures the growth of green technology innovation activities, represented by green invention patent applications and p o s t i , t denotes the time-determination variable. This variable is 0 before the policy shock year and is taken as 1 after the policy shock, while t r e a t i , t denotes the virtual variable of whether each province strengthens the environmental regulation in response to policy shocks. The indicator variable t r e a t i , t × p o s t i , t denotes a cross variable determined by the value of the annual p o s t i , t and t r e a t i , t . The coefficient of the cross variable reflects the effect of environmental regulation policy, that is, after a policy shock, whether the enhancement of government environmental regulation will effectively promote green technology innovation. If the implementation of the province’s policy was set as the following year, t r e a t i , t × p o s t i , t is 1, otherwise t r e a t i , t × p o s t i , t is 0. x i , t represents other control variables that also affect green technology innovation (GTI). Additionally, μ i , t is the city fixed effect, γ i , t is the time fixed effect, and ε i , t is a random disturbance.

4.1.2. Parallel Trend Assumption and Time Trend Analysis

The parallel trend assumption is the basic premise of DID analysis. Therefore, this study conducted a dynamic effect analysis to test whether the benchmark regression met the parallel trend assumption, as well as to identify the time effect of the environmental regulation policy. An event study approach was employed to study the dynamic effect of the environmental regulation policy on green technology innovation. In order to observe how the promulgation of the new environmental law affects the behavior of green technology innovation over time, reference is made to Chen (2017) [48] and Tao Feng et al. (2021) [22]. The model is described as follows:
Y i , t = β 0 + β t · t = 2011   t 2014 2019 t r e a t i , t × p o s t i , t + δ · x i , t + μ i , t + ε i , t
where p o s t i , t is the time dummy variable, t r e a t i , t × p o s t i , t is the interaction term of the grouping variable t r e a t i , t and the time dummy variable p o s t i , t , and β t represents the policy effect of the new environmental law on the quantity and quality of green patents in this year. Here, the first year (2014) of the formal implementation of the new environmental law was taken as the reference group, and the corresponding interaction term was not introduced. This model can also be used for the key parallel trend test in a DID estimation. If the estimated coefficient β t of t r e a t i , t × p o s t i , t is not significant before 2015, it means that the parallel trend condition is satisfied.

4.1.3. Regional Differences Analysis

In addition, this study intended to analyze the environmental regulation policy effect on green technology innovation with regional differences. The model is further described as follows:
Y i , t = λ + γ · t r e a t i , t × p o s t i , t × H , M , L g d p i , t + δ · x i , t + μ i , t + ε i , t
Y i , t = λ + γ · t r e a t i , t × p o s t i , t × H , M , L e d u i , t + δ · x i , t + μ i , t + ε i , t
Y i , t = λ + γ · t r e a t i , t × p o s t i , t × H , M , L e n e r g y i , t + δ · x i , t + μ i , t + ε i , t
where H g d p i , t , M g d p i , t and L g d p i , t represent high, medium and low levels of economic development, respectively, and H e d u i , t , M e d u i , t , and L e d u i , t represent high, medium and low education levels, respectively. This study also used local unit GDP energy consumption to measure the level of local energy consumption, grouped by high, medium and low, generating three virtual variables: H e n e r g y i , t , M e n e r g y i , t , and L e n e r g y i , t , represent high, medium and low levels of energy consumption, respectively.

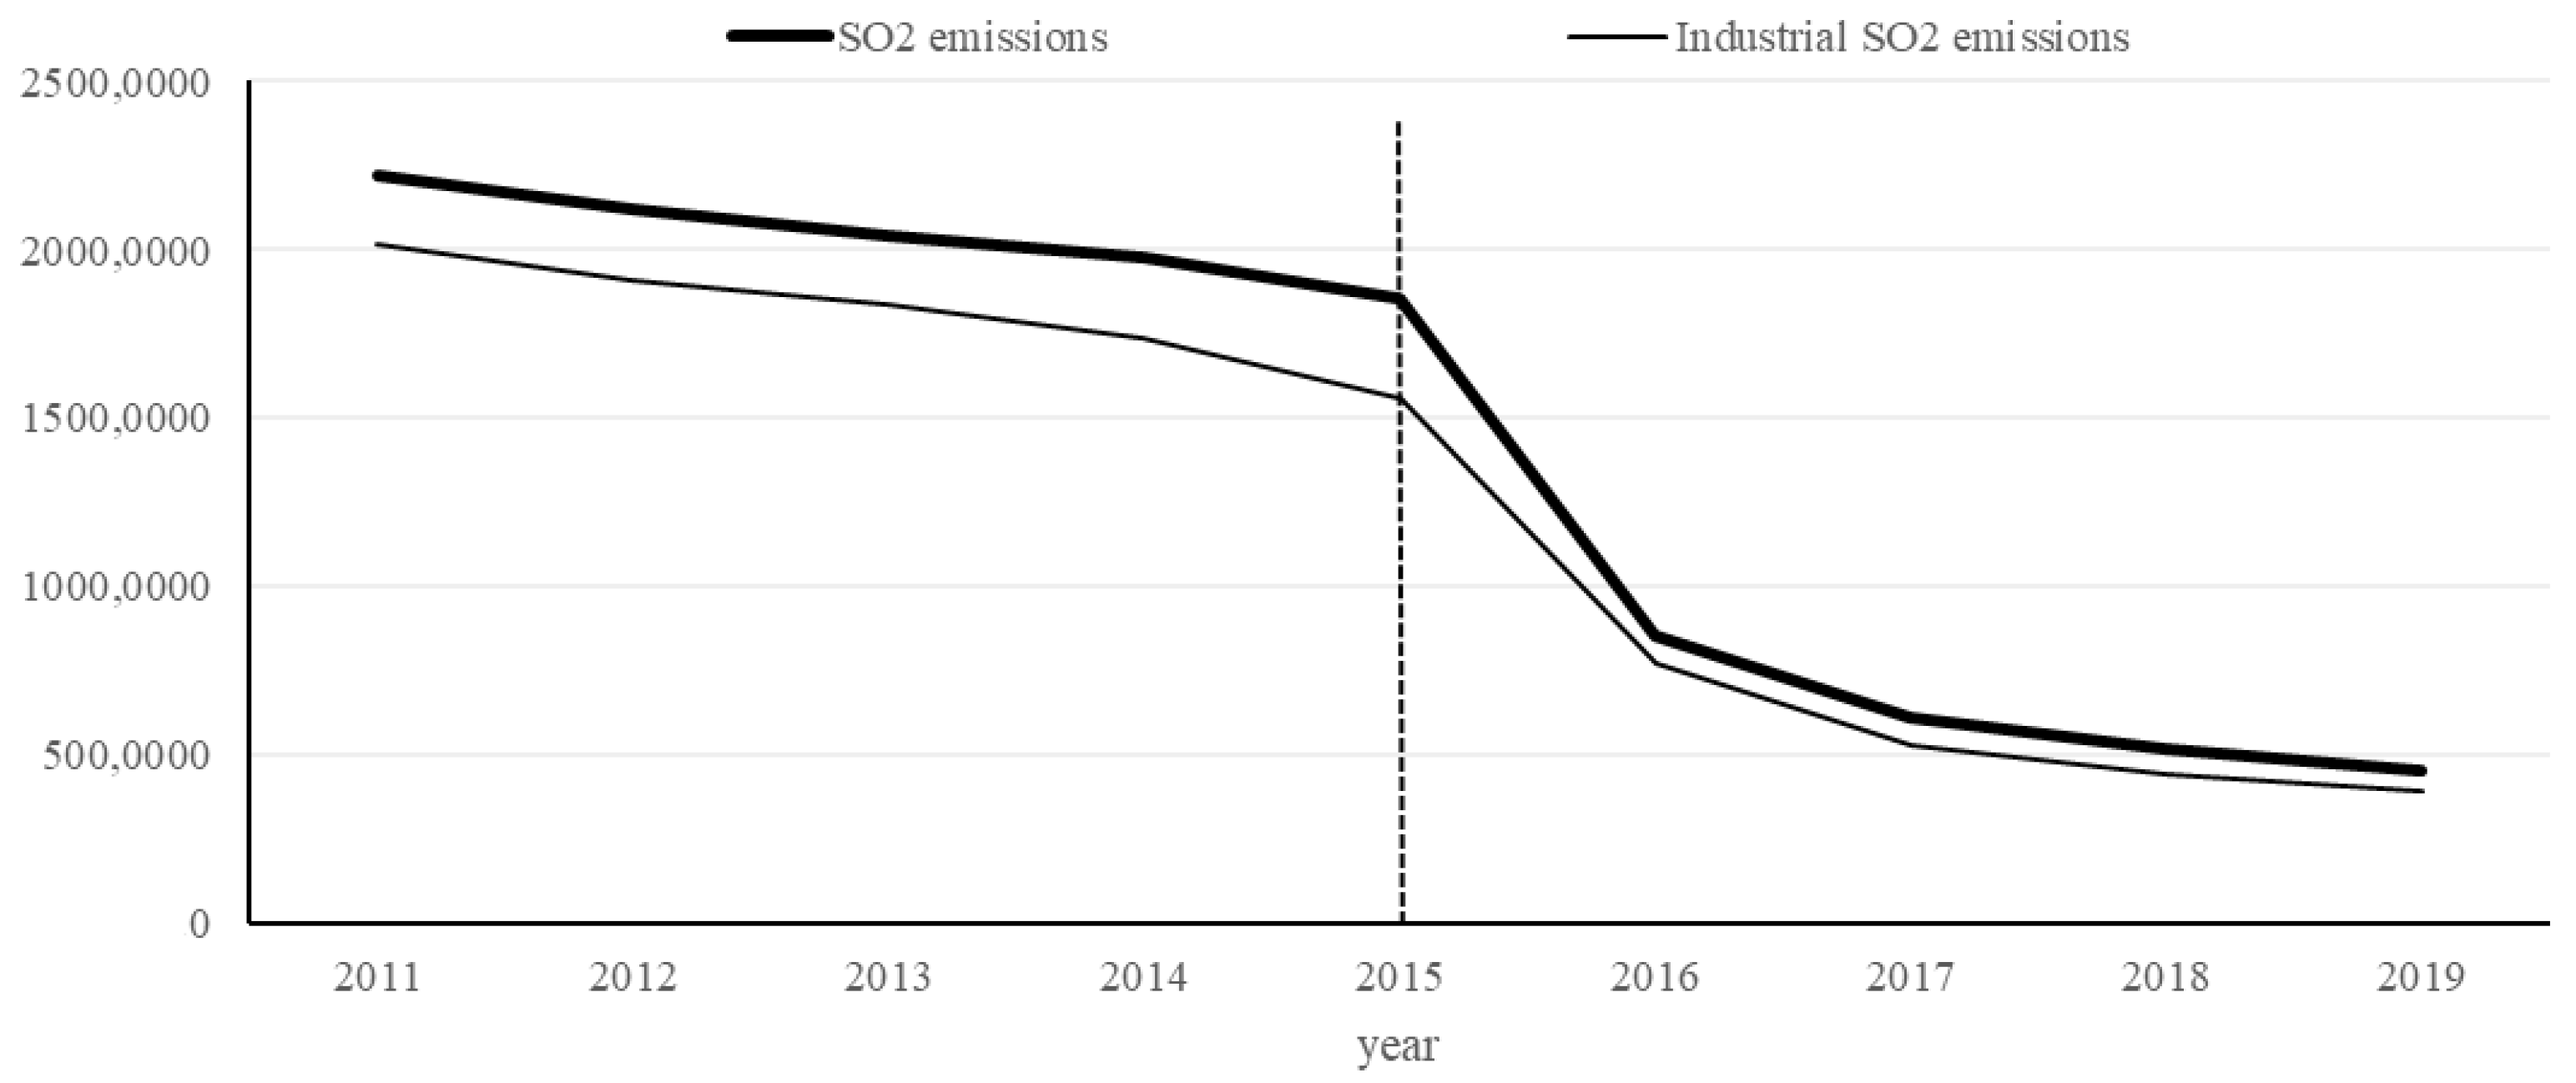
4.1.4. Determination on the Time-Point of Policy Shocks

By consulting the policies and regulations promulgated by the relevant departments in China in the last 10 years, this study selected the revised Environmental Protection Law (New Environmental Protection Law, NEPL) adopted by vote on 24 April 2014 and formally implemented on 1 January 2015, as the time point of the policy impact. The reasons for choosing the NEPL as a policy shock were as follows: first, the NEPL differs from local laws and regulations, and its influence is national, dominant and authoritative. The NEPL also has far-reaching implications because it is accompanied by a large number of legal documents and technical standards updates. Second, the NEPL is the most significant since the implementation of China’s Environmental Protection Law, defining the mission and responsibility of government departments for environmental supervision, and making environmental regulation operational and enforceable [49]. Finally, the NEPL has exerted considerable pressure on enterprises, including limiting the emissions standards of some pollutants, and updating the environmental protection indicators of some products in some industries. On the one hand, the implementation of these measures has increased the cost of sewage from enterprises. On the other hand, it also encourages enterprises to develop green technology innovation, reduce pollutant emissions in their production processes, and improve the green level of products. Therefore, in terms of the severity of the policy, the promulgation of the NEPL has an obvious environmental regulation effect, which in turn has a certain impact on enterprises’ green technology innovation. Considering the accuracy of the study, this study uses the panel data of 30 provincial-level administrative regions in China (excluding Tibet, Hong Kong, Macao, and Taiwan) from 2011 to 2019 to verify whether the promulgation of the NEPL has a significant policy impact effect.
Figure 1 shows the change of total sulfur dioxide emissions in China from 2011 to 2019. Overall, it can be seen that the promulgation of the new Environmental Protection Law has a more obvious inhibitory effect on SO2 emissions and industrial SO2 emissions, and that the emissions of various provinces in China have been reduced to varying degrees. Therefore, it was reasonable to choose the new Environmental Protection Law as the time point of the policy shocks.

4.1.5. Selection of Treatment Group and Control Group

For empirical analysis, the samples needed to be divided into a treated group and a control group. Since the implementation of the NEPL is of national significance, it was impossible to distinguish between the provinces that do not implement policies and provinces that do implement policies. Therefore, this study adopted the generalized difference-in-differences method to divide the treated group and the control group according to the effect after implementation. Among them, the treatment group was the province with significantly enhanced environmental regulation after the implementation of the NEPL, and the control group was the region with insignificant enhancement of environmental regulation after the implementation of the NEPL. In this study, the degree of decline in total SO2 emissions was the basis for classification. Therefore, the average reduction ratio of total SO2 emissions in each province from 2015 to 2019 and 2011 to 2014 was calculated. Taking 61.24% as the dividing standard, the provinces with higher emissions than 61.24% were set as the treated group, and the provinces with lower emissions than 61.24% were set as the control group. Table 1 presents the grouping results, with 14 provinces in the treated group and 16 provinces in the control group.

4.2. Variable Setting

This part introduces the selection of explained variables, explanatory variables and control variables. The main variables and the associated definitions are in Table 2.

4.2.1. Explained Variable

The explained variable is the level of green technological innovation. Constructing the green technological innovation index and green patents are currently the two most popular methods to measure the level of green technological innovation. The number of patent applications reflects the active degree of innovation, which is mainly divided into invention patents and utility model patents. According to the Chinese patent survey report, compared with utility model patents, invention patents have more R&D investment, longer R&D cycles, more stringent audits and thus more difficulties to apply. Therefore, invention patents can better reflect the innovation ability [50]. This study mainly used the number of green invention patents to measure the number of green technological innovation activities, and then reflected the level of green technological innovation. This study used the logarithm of the number of green invention patent applications in each province from 2011 to 2019 as the explained variable.

4.2.2. Explanatory Variable

The core explanatory variable is the environmental regulation policy effect. On the connotation and measurement of environmental regulation, it is mainly analyzed from the perspective of command-and-control regulation (CCR) and market-based incentive regulation (MIR). Different authors have measured the intensity of environmental regulations in a variety of ways, including the method of comprehensive index and the method of single index. The DID model is one of the most common methods for measuring the policy effect. Some scholars have taken the implementation of environmental regulation policy as a policy impact and used the DID method to verify the effect of command-and-control environmental regulation policy [7]. In recent years, some scholars have begun to measure and analyze from the perspective of implicit environmental regulation, and to measure the intensity of environmental regulation from the perspective of public awareness of environmental protection and participation. This study’s authors believe that it is important to improve public awareness of environmental protection and participation, but in the current situation, such implicit environmental regulation cannot achieve the expected significant effect, therefore the measurement of such environmental regulation was not included in the main research scope of this study. This study took the implementation of the NEPL as a policy shock point, set up a treatment group and a control group, constructed a time dummy variable and a policy dummy variable, and took the product of the two variables as the core explanatory variable to measure the policy effect of mandatory environmental regulation.
Moreover, this study took the explanatory variables reflecting regional differences. First, this study used local per capita GDP data to measure the level of local economic development reflecting differences in economic development, and grouped them by high, medium and low, generating three virtual variables: H g d p i , t , M g d p i , t , and L g d p i , t . Second, this study measured the level of local education with the per capita years of education, and grouped them by high, medium and low, generating three virtual variables: H e d u i , t , M e d u i , t , and L e d u i , t . Third, this study used local unit GDP energy consumption to measure the level of local energy consumption, and grouped them by high, medium and low, generating three virtual variables: H e n e r g y i , t , M e n e r g y i , t , and L e n e r g y i , t .

4.2.3. Control Variable

This study set the control variables from both government and enterprise aspects. Here follows the five control variables.
Government subsidy reward and government pollution tax punishment. Environmental regulation is a policy tool for governments to use mandatory means to reduce environmental pollution. Generally speaking, the ultimate goal of environmental regulation is not to stimulate green technological innovation in enterprises. Previous studies have found that environmental regulation policies have positive technical effects and negative distortion effects. On the one hand, the policy compulsion of environmental regulation urges enterprises to perform green technology innovation to reduce environmental pollution. On the other hand, the high environmental tax in environmental regulation may crowd out the R&D investment in green technology innovation, and enterprises can obtain green technology through patent purchases rather than through their own R&D; in summary, the effect of environmental regulation policy is different from that of the technical and distortion effects.
Green technology R&D investment. R&D investment has a direct positive impact on enterprise innovation performance [51]. Green R&D investment is the premise and foundation of green technology innovation, and related research points out that the relationship between them is not a simple linear relationship. In particular, only reasonable and sustained R&D investment can make the innovation activities of enterprises achieve obvious results. If R&D investment is insufficient and innovation activities lack the necessary financial support, the technological R&D progress of enterprises will be affected. If R&D investment is excessive, the unreasonable allocation of resources within the enterprise will reduce the economic benefits of the enterprise and ultimately have a negative impact on the enterprises’ green technology innovation.
Foreign trade dependence of enterprises. There are two reasons why the level of foreign trade affects enterprises’ green technology innovation. First, the level of green technology and environmental standards for products are different, so countries import and export products in accordance with their own standards. Second, based on traditional trade protection and trade sanctions, an increasing number of countries have begun to adopt ‘green trade barriers’ to protect their markets [52]. Specifically, green trade barriers refer to laws, regulations, standards, and other means to limit the import of products with higher pollution. To achieve trade protection, this standard is generally not lower than the national environmental standards. From the perspective of theoretical research, many scholars have analyzed and demonstrated from various industries that domestic enterprises should increase the level of green environmental protection of their own products in order to deal with the constraints of ‘environmental trade barriers’ in various countries.
Ownership structure of enterprises. China’s corporate ownership forms are diverse, and the impact of environmental regulation on green technology innovation may differ under different ownership structures. First, state-owned enterprises and collectively owned enterprises have the attributes of policy tools [53], and they need to play the role of policy tools in environmental protection. Therefore, under the background of environmental regulation, the green technology innovation effect of this type of enterprise is more obvious. Second, to alleviate the pressure of capital investment in enterprises’ innovative activities, the government often subsidizes these enterprises; however, it is difficult to obtain government subsidies for enterprises with different forms of ownership. Related documents point out that compared with state-owned and collectively owned enterprises, other types of ownership enterprises have more difficulties in applying for government subsidies. Third, green technology innovation has the characteristics of large investment and a lagging return on income so that it cannot bring economic benefits to enterprises in the short term. Therefore, compared with state-owned and collectively owned enterprises, other ownership types of enterprises lack the initiative to perform green technology innovation.

4.3. Data Sources

This study used the panel data of 30 provincial-level administrative regions in China (excluding Tibet, Hong Kong, Macao, and Taiwan) from 2011 to 2019. For the purpose of ensuring the accuracy and rigor of this study, the data used in this study were from the following official sources: the data on GDP, government’s fiscal expenditure, fiscal revenue, and population education level derived from the National Bureau of Statistics of the People’s Republic of China. The data on SO2 emissions, environmental subsidies and sewage charges were derived from the China Environmental Statistics Yearbook. The energy consumption was derived from the China Energy Statistics Yearbook; and the relevant data of enterprises were derived from the China Industrial Economic Statistics Yearbook. The green patent data was taken from the China Research Data Service Platform (CNRDS) and filtered by province. Table 3 provides some descriptive statistical results for the variables.

5. Empirical Results and Discussions

5.1. Benchmark Regression Results

This study first conducted a regression analysis of the full sample data without considering the regional differences to prove that the green technology innovation in provinces with an enhanced environmental regulation also improved after the policy shock. As mentioned above, this study used the DID method for empirical analysis. The benchmark regression results are shown in Table 4.
According to the regression results of the model (6), the coefficient of interaction term t r e a t i , t × p o s t i , t was significantly positive at the 1% level, indicating that the environmental regulation policy had a positive effect on green technology innovation. Furthermore, the t r e a t i , t × p o s t i , t increased the a p p _ i n v e n t i o n i , t statistically significantly, by approximately 21.53% with all the control variables. Meanwhile, the promotion effect of government subsidies on green technology innovation was not obvious, but the negative effect of a government pollution tax on green technology innovation was obvious. As expected, R&D investment promoted green technology innovation, and state-owned or collective-owned enterprises had stronger green technology innovation capabilities. The coefficient of the foreign trade dependence was negative but not obvious, indicating that foreign trade dependence is not the main reason affecting green technology innovation.

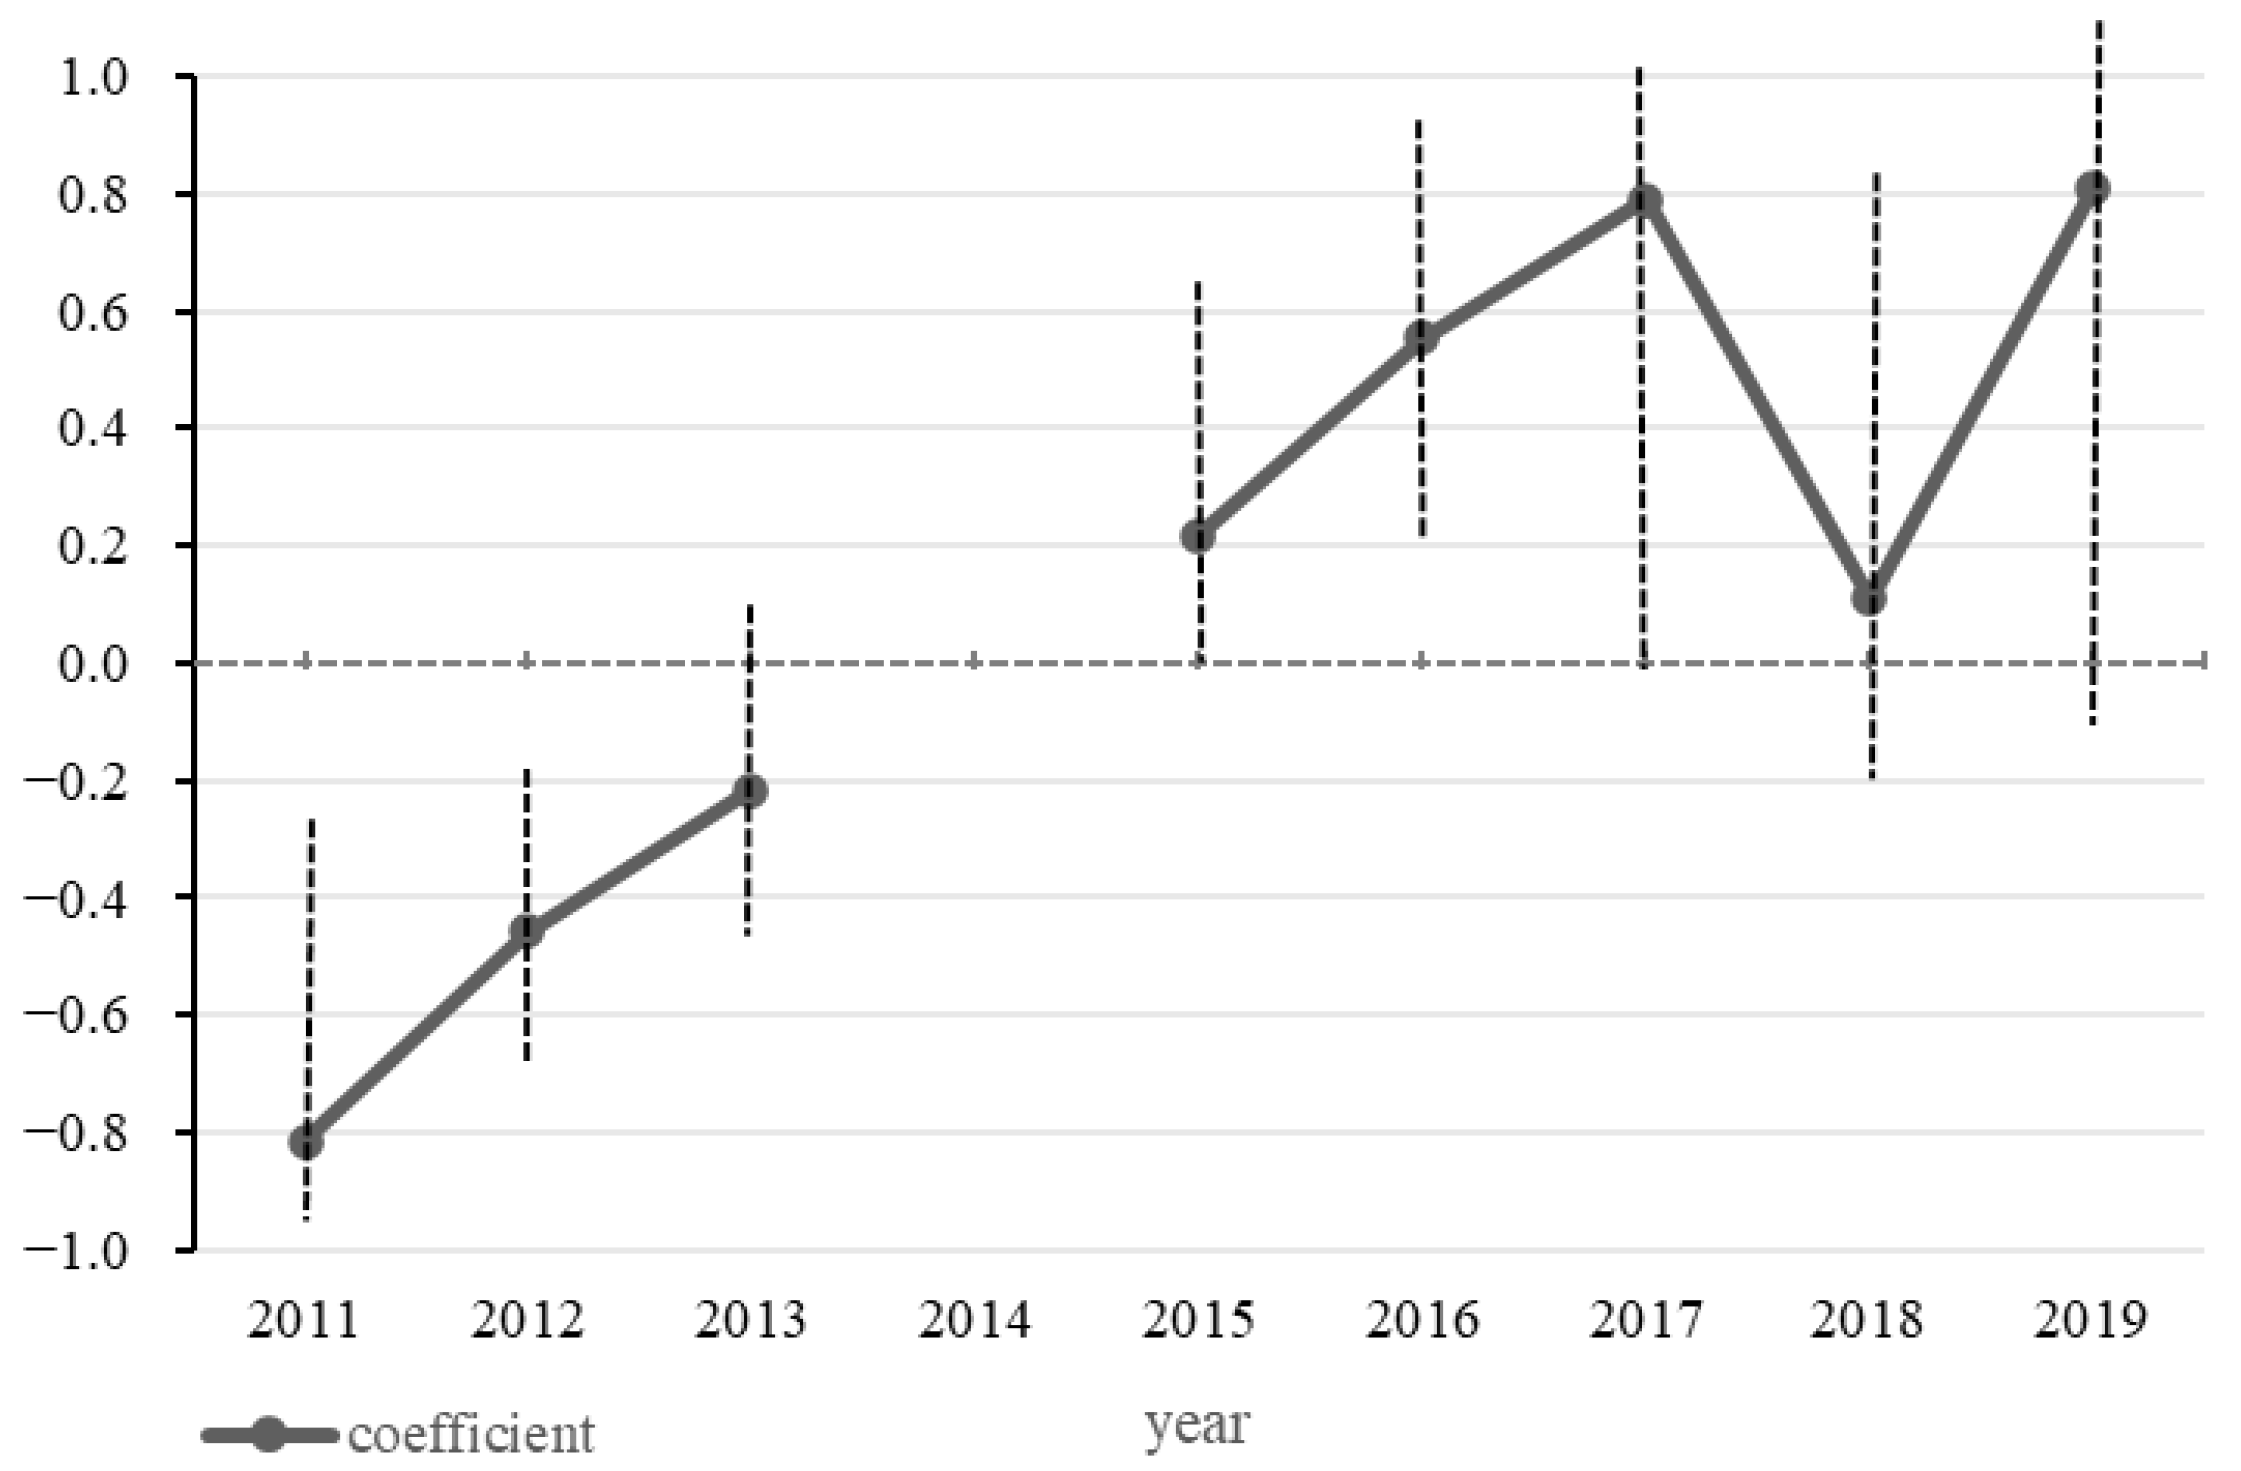
5.2. Parallel Trend Assumption and Time Trend Analysis

In addition to the premise of randomness, the DID method also needed to verify the parallel trend assumption, that is, it needed to verify that if the treated group was not affected by policy shocks, then the change trend should be the same as the control group. Therefore, if this assumption does not hold, it cannot be explained that the impact on the treated group was caused by policy shocks. At present, for the assumption of a parallel trend, the treated group and the plotting method can be generally used to observe the change trend of the two groups of data. In addition, the year before the policy shock could also be selected as the time dummy variable to observe whether the corresponding interaction terms were significant. If they are not significant, this indicates that the data basically meets the parallel trend assumption. The latter detection method is also more common in practical applications. In this study, we generated the interaction terms between the year virtual variables and the processing group virtual variables, and then regressed these interaction terms as explanatory variables. The coefficients of the interaction terms reflected the difference between the treated and control groups in a specific year. We needed to confirm whether the coefficients of the interaction terms were significant or not, and if not significant, then the data basically met the parallel trend assumption.
Figure 2 shows the dynamic effect of the promulgation and implementation of the NEPL on the green technology innovation activities. The regression results of the parallel trend assumption and time trend are in Appendix A. It can be seen that the estimated coefficients of the years before the implementation of the NEPL were negative and basically insignificant, which indicated that the parallel trend assumption of the DID estimation was satisfied. After the promulgation and implementation of the NEPL, the number of green patent applications had increased significantly from 2015 to 2019. Specifically, the coefficients of the interaction terms in 2015 to 2019 were significantly positive, while the coefficients of the interaction terms from 2013 to 2015 were basically not significant. The above results show that the promulgation and implementation of the NEPL had increased the number of green innovation patents, and that the policy effect was lagging behind. Therefore, Hypothesis 1 was verified.

5.3. Regression Results Based on Regional Differences

In addition to the two direct entities of government and enterprise, the differences between the different categories are also worth discussing. This study holds that from the three angles of economic development difference, education difference, and energy consumption difference, the regional interaction terms are constructed to perform regression analysis. The regression results are presented in Table 5. The coefficients of control variables are not showed in Table 5 for simplicity.
According to the regression results of the environmental regulation policy effect with differences in economic development, the coefficients of t r e a t i , t × p o s t i , t × H g d p i , t , t r e a t i , t × p o s t i , t × M g d p i , t , and t r e a t i , t × p o s t i , t × L g d p i , t were positive. To be exact, the coefficients of t r e a t i , t × p o s t i , t × H g d p i , t and t r e a t i , t × p o s t i , t × L g d p i , t were significantly positive at the 5% level. Furthermore, t r e a t i , t × p o s t i , t × H g d p i , t and t r e a t i , t × p o s t i , t × L g d p i , t separately increased a p p _ i n v e n t i o n i , t statistically by approximately 22.78% and 25.33% with all the control variables, indicating that the environmental regulation policy was more likely to promote green technology innovation in regions with high or low economic development levels. Conversely, the coefficient of t r e a t i , t × p o s t i , t × M g d p i , t was not obvious, indicating that the environmental regulation policy had little positive effect on green technology innovation in areas with a medium economic development level.
As far as the difference in education level is concerned, the coefficients of the t r e a t i , t × p o s t i , t × H e d u i , t , t r e a t i , t × p o s t i , t × M e d u i , t , and t r e a t i , t × p o s t i , t × L e d u i , t were positive. To be exact, the coefficients of t r e a t i , t × p o s t i , t × H e d u i , t and t r e a t i , t × p o s t i , t × L e d u i , t were significantly positive at the 10% level and 1% level, respectively. Furthermore, t r e a t i , t × p o s t i , t × H e d u i , t and t r e a t i , t × p o s t i , t × L e d u i , t increased a p p _ i n v e n t i o n i , t statistically by nearly 18.85% and 33.61% with all the control variables, indicating that the environmental regulation policy was more likely to promote green technology innovation in regions with high or low education levels. Additionally, the coefficient of t r e a t i , t × p o s t i , t × M e d u i , t was not obvious, indicating that the environmental regulation policy had little positive effect on green technology innovation in areas with a medium education level.
In terms of the difference in energy consumption, the coefficients of t r e a t i , t × p o s t i , t × H e n e r g y i , t , t r e a t i , t × p o s t i , t × M e n e r g y i , t , and t r e a t i , t × p o s t i , t × L e n e r g y i , t were positive. To be exact, the coefficients of t r e a t i , t × p o s t i , t × M e n e r g y i , t and t r e a t i , t × p o s t i , t × L e n e r g y i , t were significantly positive at the 5% level. Furthermore, t r e a t i , t × p o s t i , t × M e n e r g y i , t and t r e a t i , t × p o s t i , t × L e n e r g y i , t increased a p p _ i n v e n t i o n i , t statistically by approximately 23.71% and 26.39% with all the control variables, indicating that the environmental regulation policy was more likely to promote green technology innovation in regions with a lower energy consumption levels. The coefficient of t r e a t i , t × p o s t i , t × H e n e r g y i , t was not obvious, indicating that environmental regulation policy had little positive effect on green technology innovation in areas with a high energy consumption level.
Therefore, Hypothesis 2 was verified.

5.4. Robust Check

5.4.1. Replace Explained Variable into Green Invention Patent Acquisition

Although the number of patent applications can reflect the degree of activity and ability of green technology innovation to some extent, not all the patents applied for can be approved. Therefore, this study further selected the quantitative index of patent acquisition as the explained variable and took its logarithm for the regression test to verify the reliability of the research conclusion. The regression results are shown in Table 6.
In models (1) to (6), the coefficients of the interaction terms t r e a t i , t × p o s t i , t were significantly positive at the 1% level, indicating that the promulgation of the NEPL had a certain positive promotion effect on green technology innovation, which was basically consistent with the benchmark regression results, indicating that the research conclusions are robust.

5.4.2. Replace Explanatory Variables into Interaction Terms with Regional Differences

According to the regional economic development level, education levels and energy consumption levels, the different provinces were divided into high level and low level. Among them, the provinces with a high economic development level corresponded to the dummy variable 1, and the provinces with a low economic development level corresponded to the dummy variable 0; the provinces with a high education level corresponded to the dummy variable 1, and the provinces with a low education level corresponded to the dummy variable 0; provinces with a high energy consumption level corresponded to the dummy variable 0; and provinces with a low energy consumption level corresponded to the dummy variable 1. The regression results are shown in Table 7.
In models (1) to (3), the number of green invention patent applications was used as the explained variable indicator, and the coefficients of interaction terms were significantly positive. In models (4) to (6), the number of green invention patents acquisitions was used as the explained variable indicator, and the interaction coefficients were also significantly positive. The coefficients of the product terms of environmental regulation policy effects were significantly positive, indicating that on the basis of controlling regional differences, the promulgation of the NEPL can have a certain positive promotion effect on green technology innovation, which is basically consistent with the benchmark regression results. It also further explains the impact of regional differences on the impact of the environmental regulation on green technology innovation effect and verifies the empirical results’ robustness.

6. Conclusions

6.1. Research Findings

While examining the policy effect of the environmental regulation on green technology innovation, this study further introduced the influence of regional differences on the basis of previous literature research, clarified the mechanism from three levels of economy, education and energy consumption, and deepened the research on the impact of environmental regulation on green technology innovation. From the results of the mechanism analysis and empirical analysis, the key findings of this study are as follows:
First, the New Environmental Protection Law (NEPL) of China has a positive impact on green technology innovation. According to the benchmark regression results and robustness checks, the coefficients interaction terms are significantly positive. That is, the weak Porter hypothesis is established, which shows that the implementation of environmental regulation policy in China has a certain effect at this stage; however, it should be emphasized that the empirical results of this study cannot judge the competitiveness of enterprises so that this study cannot verify whether a ‘strong’ Porter hypothesis is established. According to the empirical results, the government’s pollution charge punishment will crack down on the development of green technology innovation activities, while the R&D investment of enterprises promotes the development of green technology innovation activities, and they show that state-owned and collective enterprises have more enthusiasm to carry out green technology innovation activities.
Second, the impact of the environmental regulation policy on green technological innovation is affected by regional differences. That is, the environmental regulation policy has different effects on green technology innovation under different economic levels, education levels and energy consumption levels. According to the regression results based on regional differences, t r e a t i , t × p o s t i , t × H g d p i , t , t r e a t i , t × p o s t i , t × L g d p i , t , t r e a t i , t × p o s t i , t × H e d u i , t , t r e a t i , t × p o s t i , t × L e d u i , t , t r e a t i , t × p o s t i , t × M e n e r g y i , t and t r e a t i , t × p o s t i , t × L e n e r g y i , t can increase a p p _ i n v e n t i o n i , t statistically significantly with all the control variables, but the coefficients of t r e a t i , t × p o s t i , t × M g d p i , t , t r e a t i , t × p o s t i , t × M e d u i , t and t r e a t i , t × p o s t i , t × H e n e r g y i , t are not obvious. On the one hand, in regions with high and low levels of economic development and education, the promulgation and implementation of the new environmental law has a significant positive promoting effect on green technology innovation, while the policy effect in regions with medium levels of economic development and education is not significant. Theoretically, regions with a higher economic development level and higher education levels have richer social resources, and the effect of policy implementation should be more obvious. In fact, regions with low levels of economic development and education will receive more government attention and support than medium-level regions. This may be the main reason for the insignificant policy effect in the medium economic development and education level areas in the regression results. On the other hand, in regions with medium and low energy consumption levels, the promulgation and implementation of the new environmental law has a significant positive promoting effect on green technology innovation, while the policy effect in regions with high energy consumption levels is not significant. This is consistent with common sense. The environmental problems in regions with high energy consumption levels are relatively more serious. Environmental regulation policy has played a more regulatory role in limiting their pollution emissions, and their impact on innovation activities is not obvious compared with regions with medium and low energy consumption levels.

6.2. Suggestions

In view of the above findings, this study proposes several suggestions on how to improve the effect of the environmental regulation policy and green technology innovation, so as to provide a reference for government and enterprise decision-making.
On the one hand, for the government, there are four policy suggestions. First, the central government of China should take into account the impact on the optimal level of green technology innovation exerted by decision-making models of enterprises and local governments when formulating effective environmental regulation policies [54]. The government should fully consider the differences between regions and clarify the characteristics of performance and root causes of regional development differences, such as the actual situation of regional industrial structure characteristics and business development. Furthermore, the government should realize that the level of regional economic development, education and energy consumption can impact the level of the effects of government policies [55,56]. The government needs to pay attention to the policy effect results of those regions with medium levels of economic development and education, and to not reduce their attention, but rather they need to provide targeted guidance policies. Second, regional governments should promote interregional exchanges and cooperation while paying attention to their own development. Government departments can act as intermediaries to promote the transfer of green technology innovation among regions and make good use of the external characteristics of green technology innovation. For regions with weak innovation ability, the introduction of green technology should be strengthened, while for regions with strong innovation ability, the output of green technology innovation should be encouraged, so that the efficient transfer and diffusion of green technology innovation can be promoted [57]. Third, environmental problems are not short-term. Similarly, the solution to environmental problems should be viewed from a long-term perspective, rather than being solved overnight. The government should formulate environmental regulation policies that conform to the long-term development of regions and the long-term operation of enterprises, adjusting the regulatory means according to the development stage. It is necessary to avoid business difficulties that may be caused by too strict an environmental regulation, while also avoiding too much environmental pollution from enterprises caused by a weak environmental regulation policy [58,59,60]. For example, the government should appropriately reduce pollution tax pressure when the level of green technology innovation reaches a certain level in the future. Finally, the government needs to measure the balance between strengthening environmental protection and encouraging green innovation when choosing positive incentive policies and negative punitive policies. If the policy choice is more inclined to encourage green technology innovation, then the government can appropriately reduce the collection of unnecessary punitive emission fees. While encouraging enterprises’ innovation activities, the government should also pay attention to the quality of those enterprises’ innovation and formulate an evaluation system of the innovation development from multiple perspectives.
On the other hand, in terms of enterprises, first of all, the necessary R&D investment contributes to the improvement of enterprises’ innovation abilities. Enterprises can appropriately increase R&D investment for green technology innovation when their own capital base is strong and their operation ability is strong, which is the most important way to enhance enterprises’ green technology innovation abilities and to carry out green transformation. Second, the improvement of enterprise nationalization and collectivization contributes to the improvement of that green technology innovation ability [61,62]. Enterprises should learn to cooperate with the government in projects while maintaining their independent development. Compared with large enterprises, small-sized and medium-sized enterprises need more government support and project funding because of their weak capital base and operation ability. In this way, while responding to the development of national green innovation and the protection of the environment, enterprises can also improve their adaptability for survival and thus have a longer-term development.

6.3. Limitations and Future Study

This study had some limitations that should be addressed in future work. First, the number of indicators that measure regional green technology innovation quality was limited. Only one indicator was chosen for measuring green technology innovation: the number of green patent applications and acquisitions; however, green technology innovation activities are not only documented by patents. Therefore, the number of indicators representing the green technological and economic benefits of innovation activities should be increased in future studies, and the measurement of green innovation quality will be involved in further studies. Second, the definition of environmental regulation in this study was relatively simple, the measurement method adopted was relatively singular, and many aspects were not refined. In future research, the definition and measurement of environmental regulation will be more accurately refined and classified. Third, this study measured the impact of environmental regulation on regional green technology innovation from the three aspects of regional economy, education, and energy consumption through a regression analysis. In particular, innovation may bring social benefits to the region, such as the reduction of the unemployment rate, an improvement in people’s income and consumption levels, and an increase in people’s happiness, which will be addressed in future research. Future studies will extend the influence factors of the regional innovation quality, such as the characteristics of green technology innovation subjects and the degree of urbanization.

Author Contributions

Conceptualization, Q.L. and Y.Z.; methodology, Q.L., Y.Z., W.Y. and X.W.; software, Y.Z.; validation, Q.L., Y.Z. and W.Y.; formal analysis, Q.L., Y.Z. and W.Y.; investigation, Y.Z. and X.W.; resources, Y.Z. and X.W.; data curation, Y.Z. and X.W.; writing—original draft preparation, Q.L., Y.Z., X.W. and W.Y.; writing—review and editing, Q.L., Y.Z. and W.Y.; visualization, Q.L.; supervision, Q.L. and W.Y. All authors have read and agreed to the published version of the manuscript.

Funding

This research was funded and supported by the National Natural Science Foundation of China (71003070), Ministry of Education Key Funding Project (15YJC790060), General Project of Shanghai Philosophy and Social Science Planning (2021BGL014), and Special Project of The Development Research Center of Shanghai Municipal People Government (2018-YJ-L04). We gratefully acknowledge the above financial supports.

Institutional Review Board Statement

Not applicable.

Informed Consent Statement

Not applicable.

Data Availability Statement

The data presented in this study are all from the statistical data officially released by China and have been explained in Section 4.3.

Conflicts of Interest

The authors declare no conflict of interest. The funders had no role in the design of the study; in the collection, analyses, or interpretation of data; in the writing of the manuscript, or in the decision to publish the results.

Appendix A

The regression results of parallel trend assumption and time trend are in Table A1.
Table A1. The regression results of parallel trend assumption and time trend.
a p p _ i n v e n t i o n
Before4−0.8143 ***
(0.2034)
Before3−0.4575 **
(0.2034)
Before2−0.2160
(0.2034)
Current0.2172
(0.2034)
After10.5551 ***
(0.2034)
After20.7886 ***
(0.2034)
After30.1082 ***
(0.0673)
After40.8108 ***
(0.2034)
Year effectsYes
City effectsYes
Observations270
R-squared0.3813
Note: Standard errors in parentheses; ** and *** represent 5%, and 1% significance levels, respectively.

References

  1. Cai, W.; Ye, P. How Does Environmental Regulation Influence Enterprises’ Total Factor Productivity? A Quasi-Natural Experiment Based on China’s New Environmental Protection Law. J. Clean. Prod. 2020, 276, 124105. [Google Scholar] [CrossRef]
  2. 2018 Xi Jinping Attended the National Conference on Ecological Environment Protection and Delivered an Important Speech Published by the Ministry of Ecology and Environment of China. Available online: https://www.mee.gov.cn/home/ztbd/gzhy/qgsthjbhdh/qgdh_tt/201807/t20180713_446605.shtml (accessed on 21 December 2021). (In Chinese)
  3. ‘Green Patent’, Building Protection Barrier of Ecological Civilization Published by the China National Intellectual Property Administration. Available online: https://www.cnipa.gov.cn/art/2017/8/4/art_55_125994.html (accessed on 21 December 2021). (In Chinese)
  4. Zhang, H.; Zhu, Z.; Fan, Y. The Impact of Environmental Regulation on the Coordinated Development of Environment and Economy in China. Nat. Hazards 2018, 91, 473–489. [Google Scholar] [CrossRef]
  5. Zhang, Y.; Wang, J.; Xue, Y.; Yang, J. Impact of Environmental Regulations on Green Technological Innovative Behavior: An Empirical Study in China. J. Clean. Prod. 2018, 188, 763–773. [Google Scholar] [CrossRef]
  6. Zhang, N.; Jiang, X.-F. The Effect of Environmental Policy on Chinese Firm’s Green Productivity and Shadow Price: A Metafrontier Input Distance Function Approach. Technol. Forecast. Soc. Chang. 2019, 144, 129–136. [Google Scholar] [CrossRef]
  7. Tang, K.; Qiu, Y.; Zhou, D. Does Command-and-Control Regulation Promote Green Innovation Performance? Evidence from China’s Industrial Enterprises. Sci. Total Environ. 2020, 712, 136362. [Google Scholar] [CrossRef] [PubMed]
  8. Su, X.; Zhou, S. Dual environmental regulation, government subsidy and enterprise innovation output. China Popul. Resour. Environ. 2019, 29, 31–39. (In Chinese) [Google Scholar]
  9. Zhao, Y.; Zhu, F.; He, L. Definition, Classification and Evolution of Environmental Regulations. China Popul. Resour. Environ. 2009, 19, 85–90. (In Chinese) [Google Scholar]
  10. Feng, Z.; Chen, W. Environmental Regulation, Green Innovation, and Industrial Green Development: An Empirical Analysis Based on the Spatial Durbin Model. Sustainability 2018, 10, 223. [Google Scholar] [CrossRef] [Green Version]
  11. Lanoie, P.; Patry, M.; Lajeunesse, R. Environmental Regulation and Productivity: Testing the Porter Hypothesis. J Prod Anal 2008, 30, 121–128. [Google Scholar] [CrossRef]
  12. Zhang, C.; Lu, Y.; Guo, L.; Yu, T. The Intensity of Environmental Regulation and Technological Progress of Production. Econ. Res. J. 2011, 46, 113–124. (In Chinese) [Google Scholar]
  13. Wang, R.; Sun, T. Research on the Influence of Environmental Regulation on China’s Regional Green Economy Efficiency Based on Super Efficiency DEA Model. Ecol. Econ. 2019, 35, 131–136. (In Chinese) [Google Scholar]
  14. Fu, J.; Li, L. A Case Study on the Environmental Regulation, the Factor Endowment and the International Competitiveness in Industries. Manag. World 2010, 10, 87–98. (In Chinese) [Google Scholar] [CrossRef]
  15. Li, L.; Tao, F. Selection of Optimal Environmental Regulation Intensity for Chinese Manufacturing Industry—Based on the Green TFP Perspective. China Ind. Econ. 2012, 5, 70–82. (In Chinese) [Google Scholar] [CrossRef]
  16. Qian, Z.; Liu, X. Environmental Regulation and Green Economic Efficiency. Stat. Res. 2015, 32, 12–18. (In Chinese) [Google Scholar] [CrossRef]
  17. Feng, M.; Li, X. Evaluating the Efficiency of Industrial Environmental Regulation in China:A Three-Stage Data Envelopment Analysis Approach. J. Clean. Prod. 2020, 242, 118535. [Google Scholar] [CrossRef]
  18. Liu, Y.; Zhu, J.; Li, E.Y.; Meng, Z.; Song, Y. Environmental Regulation, Green Technological Innovation, and Eco-Efficiency: The Case of Yangtze River Economic Belt in China. Technol. Forecast. Soc. Chang. 2020, 155, 119993. [Google Scholar] [CrossRef]
  19. Fang, Z.; Bai, H.; Bilan, Y. Evaluation Research of Green Innovation Efficiency in China’s Heavy Polluting Industries. Sustainability 2020, 12, 146. [Google Scholar] [CrossRef] [Green Version]
  20. Fan, F.; Lian, H.; Liu, X.; Wang, X. Can Environmental Regulation Promote Urban Green Innovation Efficiency? An Empirical Study Based on Chinese Cities. J. Clean. Prod. 2021, 287, 125060. [Google Scholar] [CrossRef]
  21. Li, J.; Du, Y. Spatial Effect of Environmental Regulation on Green Innovation Efficiency: Evidence from Prefectural-Level Cities in China. J. Clean. Prod. 2021, 286, 125032. [Google Scholar] [CrossRef]
  22. Tao, F.; Zhao, J.; Zhou, H. Does Environmental Regulation Improve the Quantity and Quality of Green Innovation——Evidence from the Target Responsibility System of Environmental Protection. China Ind. Econ. 2021, 2, 136–154. (In Chinese) [Google Scholar] [CrossRef]
  23. China Green Patent Statistics Report Published by the China National Intellectual Property Administration. Available online: https://www.cnipa.gov.cn/col/col87/index.html?uid=669&pageNum=3 (accessed on 21 December 2021). (In Chinese)
  24. Porter, M.E.; van der Linde, C. Toward a New Conception of the Environment-Competitiveness Relationship. J. Econ. Perspect. 1995, 9, 97–118. [Google Scholar] [CrossRef] [Green Version]
  25. Lanjouw, J.O.; Mody, A. Innovation and the International Diffusion of Environmentally Responsive Technology. Res. Policy 1996, 25, 549–571. [Google Scholar] [CrossRef]
  26. Domazlicky, B.R.; Weber, W.L. Does Environmental Protection Lead to Slower Productivity Growth in the Chemical Industry? Environ. Resour. Econ. 2004, 28, 301–324. [Google Scholar] [CrossRef]
  27. Yang, C.-H.; Tseng, Y.-H.; Chen, C.-P. Environmental Regulations, Induced R&D, and Productivity: Evidence from Taiwan’s Manufacturing Industries. Resour. Energy Econ. 2012, 34, 514–532. [Google Scholar] [CrossRef]
  28. Mazzanti, M.; Zoboli, R. Environmental Efficiency and Labour Productivity: Trade-off or Joint Dynamics? A Theoretical Investigation and Empirical Evidence from Italy Using NAMEA. Ecol. Econ. 2009, 68, 1182–1194. [Google Scholar] [CrossRef]
  29. Xing, X.; Liu, T.; Wang, J.; Shen, L.; Zhu, Y. Environmental Regulation, Environmental Commitment, Sustainability Exploration/Exploitation Innovation, and Firm Sustainable Development. Sustainability 2019, 11, 6001. [Google Scholar] [CrossRef] [Green Version]
  30. Yuan, B.; Xiang, Q. Environmental Regulation, Industrial Innovation and Green Development of Chinese Manufacturing: Based on an Extended CDM Model. J. Clean. Prod. 2018, 176, 895–908. [Google Scholar] [CrossRef]
  31. Chintrakarn, P. Environmental Regulation and U.S. States’ Technical Inefficiency. Econ. Lett. 2008, 100, 363–365. [Google Scholar] [CrossRef]
  32. Song, M.; Wang, S.; Zhang, H. Could Environmental Regulation and R&D Tax Incentives Affect Green Product Innovation? J. Clean. Prod. 2020, 258, 120849. [Google Scholar] [CrossRef]
  33. Wang, X.; Sun, C.; Wang, S.; Zhang, Z.; Zou, W. Going Green or Going Away? A Spatial Empirical Examination of the Relationship between Environmental Regulations, Biased Technological Progress, and Green Total Factor Productivity. Int. J. Environ. Res. Public Health 2018, 15, 1917. [Google Scholar] [CrossRef] [Green Version]
  34. Yuan, B.; Ren, S.; Chen, X. Can Environmental Regulation Promote the Coordinated Development of Economy and Environment in China’s Manufacturing Industry?–A Panel Data Analysis of 28 Sub-Sectors. J. Clean. Prod. 2017, 149, 11–24. [Google Scholar] [CrossRef]
  35. Yuan, B.; Zhang, Y. Flexible Environmental Policy, Technological Innovation and Sustainable Development of China’s Industry: The Moderating Effect of Environment Regulatory Enforcement. J. Clean. Prod. 2020, 243, 118543. [Google Scholar] [CrossRef]
  36. Wang, X.; Shao, Q. Non-Linear Effects of Heterogeneous Environmental Regulations on Green Growth in G20 Countries: Evidence from Panel Threshold Regression. Sci. Total Environ. 2019, 660, 1346–1354. [Google Scholar] [CrossRef]
  37. Guo, Y.; Xia, X.; Zhang, S.; Zhang, D. Environmental Regulation, Government R&D Funding and Green Technology Innovation: Evidence from China Provincial Data. Sustainability 2018, 10, 940. [Google Scholar] [CrossRef] [Green Version]
  38. Xie, R.; Yuan, Y.; Huang, J. Different Types of Environmental Regulations and Heterogeneous Influence on “Green” Productivity: Evidence from China. Ecol. Econ. 2017, 132, 104–112. [Google Scholar] [CrossRef]
  39. Cai, W.; Li, Q. Dual effect of environmental regulation on enterprise’s eco-technology innovation. Sci. Res. Manag. 2019, 40, 87–95. (In Chinese) [Google Scholar] [CrossRef]
  40. Feng, Z.; Zeng, B.; Ming, Q. Environmental Regulation, Two-Way Foreign Direct Investment, and Green Innovation Efficiency in China’s Manufacturing Industry. Int. J. Environ. Res. Public Health 2018, 15, 2292. [Google Scholar] [CrossRef] [Green Version]
  41. Wang, H.; Zhang, Y. Trade Structure Upgrading, Environmental Regulation and Green Technology Innovation in Different Regions of China. China Soft Sci. 2020, 2, 174–181. (In Chinese) [Google Scholar]
  42. Cai, X.; Zhu, B.; Zhang, H.; Li, L.; Xie, M. Can Direct Environmental Regulation Promote Green Technology Innovation in Heavily Polluting Industries? Evidence from Chinese Listed Companies. Sci. Total Environ. 2020, 746, 140810. [Google Scholar] [CrossRef]
  43. Wang, Z.; Cao, Y.; Lin, S. The characteristics and heterogeneity of environmental regulation’s impact on enterprises’ green technology innovation—Based on green patent data of listed firms in China. Stud. Sci. Sci. 2021, 39, 909–919. (In Chinese) [Google Scholar] [CrossRef]
  44. Cai, X.; Lu, Y.; Wu, M.; Yu, L. Does Environmental Regulation Drive Away Inbound Foreign Direct Investment? Evidence from a Quasi-Natural Experiment in China. J. Dev. Econ. 2016, 123, 73–85. [Google Scholar] [CrossRef]
  45. Jiang, F.; Wang, Z.; Bai, J. The Dual Effect of Environmental Regulations’ Impact on Innovation—An Empirical Study Based on Dynamic Panel Data of Jiangsu Manufacturing. China Ind. Econ. 2013, 7, 44–55. (In Chinese) [Google Scholar] [CrossRef]
  46. Milani, S. The Impact of Environmental Policy Stringency on Industrial R&D Conditional on Pollution Intensity and Relocation Costs. Env. Resour. Econ 2017, 68, 595–620. [Google Scholar] [CrossRef]
  47. Wang, B.; Zhang, M. Marketization, collaboration with academics and innovation performance of enterprises. Stud. Sci. Sci. 2015, 33, 748–757. (In Chinese) [Google Scholar] [CrossRef]
  48. Chen, S.X. The Effect of a Fiscal Squeeze on Tax Enforcement: Evidence from a Natural Experiment in China. J. Public Econ. 2017, 147, 62–76. [Google Scholar] [CrossRef]
  49. Cui, G.; Jiang, Y. The Influence of Environmental Regulation on the Behavior of Enterprise Environmental Governance:Based on a Quasi-Natural Experiment of New Environmental Protection Law. Bus. Manag. J. 2019, 41, 54–72. (In Chinese) [Google Scholar] [CrossRef]
  50. 2020 China Patent Survey Report Published by the China National Intellectual Property Administration. Available online: https://www.cnipa.gov.cn/col/col88/index.html (accessed on 21 December 2021). (In Chinese)
  51. Jiang, Z.; Wang, Z.; Li, Z. The Effect of Mandatory Environmental Regulation on Innovation Performance: Evidence from China. J. Clean. Prod. 2018, 203, 482–491. [Google Scholar] [CrossRef]
  52. He, R.; Zhu, D.; Chen, X.; Cao, Y.; Chen, Y.; Wang, X. How the Trade Barrier Changes Environmental Costs of Agricultural Production: An Implication Derived from China’s Demand for Soybean Caused by the US-China Trade War. J. Clean. Prod. 2019, 227, 578–588. [Google Scholar] [CrossRef]
  53. Dai, J. Research on the Attribute of Policy Instruments in State-owned Enterprises. Economist 2013, 8, 65–70. (In Chinese) [Google Scholar] [CrossRef]
  54. Deng, Y.; You, D.; Wang, J. Optimal Strategy for Enterprises’ Green Technology Innovation from the Perspective of Political Competition. J. Clean. Prod. 2019, 235, 930–942. [Google Scholar] [CrossRef]
  55. Gao, H.; Yang, W.; Wang, J.; Zheng, X. Analysis of the Effectiveness of Air Pollution Control Policies based on Historical Evaluation and Deep Learning Forecast: A Case Study of Chengdu-Chongqing Region in China. Sustainability 2021, 13, 206. [Google Scholar] [CrossRef]
  56. Liu, H.; Liu, J.; Yang, W.; Chen, J.; Zhu, M. Analysis and Prediction of Land Use in Beijing-Tianjin-Hebei Region: A Study Based on the Improved Convolutional Neural Network Model. Sustainability 2020, 12, 3002. [Google Scholar] [CrossRef] [Green Version]
  57. Yuan, G.; Yang, W. Study on optimization of economic dispatching of electric power system based on Hybrid Intelligent Algorithms (PSO and AFSA). Energy 2019, 183, 926–935. [Google Scholar] [CrossRef]
  58. Yang, W.; Yang, Y. Research on Air Pollution Control in China: From the Perspective of Quadrilateral Evolutionary Games. Sustainability 2020, 12, 1756. [Google Scholar] [CrossRef] [Green Version]
  59. Yang, Y.; Yang, W.; Chen, H.; Li, Y. China’s energy whistleblowing and energy supervision policy: An evolutionary game perspective. Energy 2020, 213, 118774. [Google Scholar] [CrossRef]
  60. Shen, X.; Yang, W.; Sun, S. Analysis of the Impact of China’s Hierarchical Medical System and Online Appointment Diagnosis System on the Sustainable Development of Public Health: A Case Study of Shanghai. Sustainability 2019, 11, 6564. [Google Scholar] [CrossRef] [Green Version]
  61. Li, Y.; Yang, W.; Shen, X.; Yuan, G.; Wang, J. Water Environment Management and Performance Evaluation in Central China: A Research Based on Comprehensive Evaluation System. Water 2019, 11, 2472. [Google Scholar] [CrossRef] [Green Version]
  62. Yang, W.; Li, L. Energy Efficiency, Ownership Structure, and Sustainable Development: Evidence from China. Sustainability 2017, 9, 912. [Google Scholar] [CrossRef] [Green Version]
Figure 1. SO2 emissions and industrial SO2 emissions in China from 2010 to 2019.
Sustainability 14 01714 g001
Figure 2. Dynamic effect analysis.
Sustainability 14 01714 g002
Table 1. Results of treated group and control group.
GroupsProvinces
Treated groupBeijing (78.23%), Tianjin (75.07%), Shanxi (61.77%), Shanghai (75.40%), Zhejiang (69.12%), Shandong (61.31%), Henan (70.23%), Hubei (61.78%), Guangdong (64.51%), Guangxi (64.96%), Chongqing (67.15%), Sichuan (61.45%), Shaanxi (65.07%), Gansu (62.40%)
Control groupHebei (58.32%), Inner Mongolia (55.25%), Liaoning (56.05%), Jilin (56.69%), Heilongjiang (54.36%), Jiangsu (50.72%), Anhui (50.62%), Fujian (49.48%), Jiangxi (36.54%), Hunan (50.64%), Qinghai (30.26%), Hainan (57.31%), Guizhou (58.11%), Yunnan (46.57%), Ningxia (51.62%), Xinjiang (49.62%)
Table 2. Main variables and the associated definitions.
Type of VariableDefinitionVariableDescription
Explained variableLevel of enterprises’ green technology innovation a p p _ i n v e n t i o n i , t The logarithm of the number of patent applications for green technology inventions for each year in each province is used as a measurement index.
Explanatory variable of policy effectTime effect p o s t i , t The variable value is set to 0 before 2015 and taken as 1 after 2015 (including 2015).
Policy effect t r e a t i , t The variable value is set to 0 in the control group and taken as 1 after 2015 in the treated group.
Cross term t r e a t i , t × p o s t i , t The variable value is determined by the value of t r e a t i , t and p o s t i , t .
Explanatory variable of regional differencesEconomic development levels g d p i , t GDP per capita with 2000 as base is used as a group of indicators, divided into high, medium and low groups: H g d p i , t ,   M g d p i , t ,   L g d p i , t .
Education levels e d u i , t The number of years of education is used as a grouping indicator and di-vided into three groups: H e d u i , t ,   M e d u i , t ,   L e d u i , t .
Energy consumption levels e n e r g y i , t Energy consumption per unit GDP as a grouping indicator, divided into high, medium and low groups: H e n e r g y i , t ,   M e n e r g y i , t ,   L e n e r g y i , t .
Cross term t r e a t i , t × p o s t i , t × H , M ,   L g d p i , t
t r e a t i , t × p o s t i , t × H , M ,   L e d u i , t
t r e a t i , t × p o s t i , t × H , M ,   L e n e r g y i , t
The variable value is determined by the value of t r e a t i , t ,   p o s t i , t and H , M ,   L g d p i , t ( e d u i , t ,   e n e r g y i , t ).
Control variableGovernment subsidies s u b s i d y i , t Proportion of environmental protection subsidy to total fiscal expenditure in each province is used as a measurement index.
Collection of sewage charges t a x i , t Proportion of collection of sewage to total fiscal expenditure per year in each province is used as a measurement index.
R&D Investment of the enterprise r d i , t The logarithm of the internal expenditure of R&D funds per year in each province is used as a measurement index.
Foreign trade dependence t r a d e i , t The ratio of the total export to GDP in each province per year is used as a measurement index.
Ownership structure s h a r e h o l d i , t The ratio of state-owned and collective-owned enterprises to total number of enterprises in each province per year.
Table 3. The statistical description of the main variables.
VariablesObservationMeanStd. Dev.MinMax
a p p _ i n v e n t i o n i , t 2707.44021.45312.639110.7811
t r e a t i , t 2700.46670.49980.00001.0000
p o s t i , t 2700.55560.490690.00001.0000
t r e a t i , t × p o s t i , t 2700.25930.43900.00001.0000
t r e a t i , t × p o s t i , t × H g d p i , t 2700.11110.31490.00001.0000
t r e a t i , t × p o s t i , t × M g d p i , t 2700.07410.26240.00001.0000
t r e a t i , t × p o s t i , t × L g d p i , t 2700.07410.26240.00001.0000
t r e a t i , t × p o s t i , t × H e d u i , t 2700.09260.29040.00001.0000
t r e a t i , t × p o s t i , t × M e d u i , t 2700.09260.29040.00001.0000
t r e a t i , t × p o s t i , t × L e d u i , t 2700.07410.26240.00001.0000
t r e a t i , t × p o s t i , t × H e n e r g y i , t 2700.05560.22950.00001.0000
t r e a t i , t × p o s t i , t × M e n e r g y i , t 2700.09260.29040.00001.0000
t r e a t i , t × p o s t i , t × L e n e r g y i , t 2700.11110.31490.00001.0000
s u b s i d y i , t 2700.02990.000980.01180.0681
t a x i , t 2700.00290.00210.00010.0151
r d i , t 27014.71631.311811.549417.2490
t r a d e i , t 2700.13960.13810.00690.6602
s h a r e h o l d i , t 2700.10580.07490.01710.2953
Note: Table 3 is a statistical description of the standard numerical values (no logarithm) of the main variables in this study. This study used exponential smoothing to interpolate sewage charges data due to data missing for individual years in individual provinces.
Table 4. Benchmark regression results.
a p p _ i n v e n t i o n i , t
(1)(2)(3)(4)(5)(6)
t r e a t i , t × p o s t i , t 1.0189 ***
(0.1013)
0.9586 ***
(0.1034)
0.8010 ***
(0.0957)
0.2432 ***
(0.0632)
0.2236 ***
(0.0645)
0.2153 ***
(0.0627)
s u b s i d y i , t 14.0406 **
(5.8608)
15.7923 ***
(5.2874)
0.6152
(3.2439)
−0.2664
(3.2959)
0.9730
(3.2147)
t a x i , t −181.1505 ***
(24.2092)
−62.8807 *** (15.5571)−63.9463 *** (15.5417)−49.4819 ***
(15.5286)
r d i , t 1.2434 *** (0.0663)1.5540 *** (0.0795)1.6553 ***
(0.0814)
t r a d e i , t −0.9124
(0.6421)
−0.3797
(−0.6379)
s h a r e h o l d i , t 4.9062 ***
(1.2492)
Constant7.1760 ***
(0.0433)
14.0406 **
(5.8608)
7.2930 ***
(0.1715)
−15.7796 ***
(1.1205)
−15.1643 ***
(1.1990)
−17.3253 ***
(1.2873)
Year effectsYesYesYesYesYesYes
City effectsYesYesYesYesYesYes
Observations270270270270270270
R−squared0.29730.31380.44490.80260.80430.8164
Note: Standard errors in parentheses; ** and *** represent 5% and 1% significance levels, respectively.
Table 5. Regression results based on regional differences.
a p p _ i n v e n t i o n i , t
Difference in economy levels(1)(2)(3)
t r e a t i , t × p o s t i , t × H g d p i , t 0.2278 **
(0.1037)
t r e a t i , t × p o s t i , t × M g d p i , t 0.1020
(0.1082)
t r e a t i , t × p o s t i , t × L g d p i , t data0.2533 **
(0.1042)
Observations270270270
R-squared0.81100.80790.8119
Difference in education levels(4)(5)(6)
t r e a t i , t × p o s t i , t × H e d u i , t 0.1885 *
(0.1100)
t r e a t i , t × p o s t i , t × M e d u i , t 0.0627
(0.0962)
t r e a t i , t × p o s t i , t × L e d u i , t 0.3361 ***
(0.1034)
Observations270270270
R-squared0.80950.80750.8155
Difference in energy consumption(7)(8)(9)
t r e a t i , t × p o s t i , t × H e n e r g y i , t 0.0290
(0.1216)
t r e a t i , t × p o s t i , t × M e n e r g y i , t 0.2371 **
(0.0950)
t r e a t i , t × p o s t i , t × L e n e r g y i , t 0.2639 **
(0.1020)
Observations270270270
R-squared0.80720.81210.8125
Note: Standard errors in parentheses; *, ** and *** represent 10%, 5%, and 1% significance levels, respectively.
Table 6. Results of the robustness checks 1.
a c q _ i n v e n t i o n i , t
(1)(2)(3)(4)(5)(6)
t r e a t i , t × p o s t i , t 0.7782 ***
(0.0768)
0.7380 ***
(0.0787)
0.6264 ***
(0.0738)
0.2086 ***
(0.0513)
0.1945 ***
(0.0525)
0.841 ***
(8.060)
s u b s i d y i , t 9.3644 ***
(4.4564)
10.6058 ***
(4.0823)
−0.7620
(2.6348)
−1.3932
(2.6796)
−0.4343
(2.6217)
t a x i , t −128.3800 *** (18.6917)−39.7943 ***
(12.6359)
−40.5571 ***
(12.6355)
−29.3662 ***
(12.6641)
r d i , t 1.1871 ***
(0.0623)
1.1650 ***
(0.0646)
1.2434 ***
(0.0663)
t r a d e i , t −0.6531
(0.5221)
−0.2410
(0.5202)
s h a r e h o l d i , t 3.7959 ***
(1.0187)
Constant5.8751 ***
(0.0328)
5.6059 ***
(0.1322)
5.9748 ***
(0.1324)
−11.3069 ***
(0.9101)
−10.8664 ***
(0.9748)
12.5383 ***
(1.0498)
Year effectsYesYesYesYesYesYes
City effectsYesYesYesYesYesYes
Observations270270270270270270
R-squared0.30330.31310.42710.77450.77600.7886
Note: Standard errors in parentheses; *** represents 1% significance level.
Table 7. Results of the robustness checks 2.
a p p _ i n v e n t i o n i , t a c q _ i n v e n t i o n i , t
(1)(2)(3)(4)(5)(6)
t r e a t i , t × p o s t i , t × g d p i , t 0.2398 **
(0.0928)
0.1665 **
(0.0762)
t r e a t i , t × p o s t i , t × e d u i , t 0.1491 *
(0.0869)
0.1294 *
(0.0711)
t r e a t i , t × p o s t i , t × e n e r g y i , t 0.2373 ***
(0.0686)
0.2069 ***
(0.0559)
s u b s i d y i , t 0.8468
(3.2614)
0.7513
(3.3253)
0.9939
(3.2129)
−0.3660
(2.6799)
−0.6213
(2.7193)
−0.4148
(2.6204)
t a x i , t −55.9687 ***
15.8030
−50.3484 ***
(15.8145)
−55.3665 ***
(15.5676)
−34.1441 ***
(12.9853)
−30.1273 ***
(12.9328)
−34.5012 ***
(12.6965)
r d i , t 1.7175 ***
(0.0784)
1.7372 ***
(0.0784)
1.6520 ***
(0.0816)
1.3034 ***
(0.0644)
1.3150 ***
(0.0641)
1.2406 ***
(0.0665)
t r a d e i , t −0.0215
(0.7031)
−0.4556
(0.6711)
−0.2694
(0.6446)
−0.0717
(0.5777)
−0.3095
(0.5488)
−0.1454
(0.5257)
s h a r e h o l d i , t 5.1061 ***
(1.2618)
5.1012 ***
(1.2719)
5.1992 ***
(1.2487)
3.9607 ***
(1.0368)
3.9660 ***
(1.0401)
4.0517 ***
(1.0184)
Constant−18.2645 ***
(1.2512)
−18.4954 ***
(1.2554)
−17.3028 ***
(1.2880)
−13.4239 ***
(1.0281)
−13.5614 ***
(1.0267)
12.5206 ***
(1.0505)
Year effectsYesYesYesYesYesYes
City effectsYesYesYesYesYesYes
Observations270270270270270270
R-squared0.81250.80950.81650.78080.77940.7887
Note: Standard errors in parentheses; *, ** and *** represent 10%, 5%, and 1% significance levels, respectively.
Publisher’s Note: MDPI stays neutral with regard to jurisdictional claims in published maps and institutional affiliations.

