Article

6+: A Novel Approach for Building Extraction from a Medium Resolution Multi-Spectral Satellite

1
School of Computer Science Engineering and Technology, Bennett University, Greater Noida 201310, India
2
Department of Computer Science & Engineering, Galgotias College of Engineering & Technology, Greater Noida 201306, India
3
School of Electrical Engineering and Computer Science, Gwangju Institute of Science and Technology, Gwangju 61005, Korea
*
Author to whom correspondence should be addressed.
Sustainability 2022, 14(3), 1615; https://doi.org/10.3390/su14031615
Submission received: 31 December 2021 / Revised: 23 January 2022 / Accepted: 27 January 2022 / Published: 29 January 2022
(This article belongs to the Special Issue Sustainable Smart Cities and Societies Using Emerging Technologies)

Abstract

:
For smart, sustainable cities and urban planning, building extraction through satellite images becomes a crucial activity. It is challenging in the medium spatial resolution. This work proposes a novel methodology named ‘6+’ for improving building extraction in 10 m medium spatial resolution multispectral satellite images. Data resources used are Sentinel-2A satellite images and OpenStreetMap (OSM). The proposed methodology merges the available high-resolution bands, super-resolved Short-Wave InfraRed (SWIR) bands, and an Enhanced Normalized Difference Impervious Surface Index (ENDISI) built-up index-based image to produce enhanced multispectral satellite images that contain additional information on impervious surfaces for improving building extraction results. The proposed methodology produces a novel building extraction dataset named ‘6+’. Another dataset named ‘6 band’ is also prepared for comparison by merging super-resolved bands 11 and 12 along with all the highest spatial resolution bands. The building ground truths are prepared using OSM shapefiles. The models specific for extracting buildings, i.e., BRRNet, JointNet, SegUnet, Dilated-ResUnet, and other Unet based encoder-decoder models with a backbone of various state-of-art image segmentation algorithms, are applied on both datasets. The comparative analyses of all models applied to the ‘6+’ dataset achieve a better performance in terms of F1-Score and Intersection over Union (IoU) than the ‘6 band’ dataset.

1. Introduction

The social and economic developments of society through good governance helps to create a better life. The developments that are done for smart living are backed-up by technical innovations and it helps to better serve the needs of people and creates a smart, sustainable city [1].
The planning of such cities needs efficient solutions along with good governance. For such governance and good planning of smart cities, the government needs to automatically track urban development activities. This monitoring can be done with the latest development in Geographical Information System (GIS) and Remote Sensing technologies. For example, the urban expansions happening in an area require monitoring and management, including the identification of densely populated or slum areas and understanding their social-economic condition [2], identifying the legal or illegal buildings in an area, building height estimation, identification of areas that are suitable for deployment of industries, the insurance and tax assessment of an area based on the population density [3], the estimation of population count based on the built-up areas [4], the identification of places in urban areas for green parks and artificial lakes, and short-term economic forecasts [5]. Apart from that, another more important area is the use of renewable resources, such as the sun for energy supply. It is very useful for handling the climate conditions and preserves the nonrenewable resources of the earth. In smart cities, the deployment of multiple solar panel plants can serve the electricity needs of different local areas, to an extent. For identification of appropriate areas for the deployment of a solar panel plant, the extraction of the buildings of an area from remote sensing satellite images is an important activity [6].
Remote sensing is an area that is widely used for the monitoring of any environmental changes and various developments performed by human beings. Aerial and satellite images are tools used for such analysis, and are cost-effective. It saves time and the manual efforts used for performing these surveys on the ground.
In the cases of natural disasters, such as earthquakes, tornados, tsunamis, floods due to heavy rains, snow cover monitoring [7], etc., the built-up area under the affected region is the one most impacted. The analysis of it helps to understand the actual impact of disasters on the urban population. Another important area is urban expansion that is dependent on humans and their societal needs. Monitoring, change detection, and planning can be done by utilizing satellite images for extracting the built-up areas of different regions. Built-up areas consist of impermeable surfaces where water cannot infiltrate to reach the soil, i.e., buildings, roads, parking areas [8,9], etc. Buildings are one of the important features of the built-up areas and its extraction is an active research area.
Several challenges exist when extracting buildings from satellite images, including misclassification of pixels as different objects due to same spectral values, varying spatial resolution, occlusion presents near building structure, illumination condition, location of the study area, shooting angles, the material used on a rooftop, various kinds of shapes, sizes, and heights [10] etc. The problem of misclassification of pixel values impacts the building extraction algorithm performances and it happens due many reasons. One of the reasons is the similarity in spectral reflectance of the different class of objects present near the building structure. The usage of highly detailed satellite images can improve building segmentation performance.
In most of the previous works in building extraction, high-resolution satellite images have been used, because there is more spatial information along with a higher texture and geometrical information [11] than medium spatial resolution multispectral satellite images. However, the high-resolution images only have three to four bands, which limits the probability of identifying the proper class of a pixel [12]. Also, the high-resolution building dataset that is publicly available belongs to specific areas. At the same time, multispectral images have a greater number of bands. These bands capture images of various wavelengths across the electromagnetic spectrum and highlight the different classes of features present on the earth surface. Also, these satellite images, such as Landsat-8/Sentinel-2 covers a much bigger area, which gives a broader view for smart city and urban planning. It gives a free to use privilege and these images are up-to-date due to temporal resolution of the satellites [13]. So, to better generalize the research for any area, the multi-spectral satellite images like Sentinel-2 have been used in this work. However, in the case of multi-spectral satellite images, the major challenge still seen in previous approaches comes from the side of spatial resolutions, the miss-classification of pixel values, proper segregation of building boundaries in closely situated buildings of an area, and a smaller number of training datasets [11,14]. So, to improve on the above-mentioned challenges under building extraction, the proposed approach uses the multi-spectral bands, which helps in discriminating a variety of features more clearly and reduces class confusion. Another important step in the proposed approach is the incorporation of additional information for enhancement of available bands information. This is important for supporting better spectral characteristics, texture, and shape information in medium spatial resolution [11]. This is very much reasonable and important for obtaining better results in building extraction. This helps in reducing the probability of pixel misclassification and improving on building segregation boundaries. This additional data could be information rich with impervious surface features of the study areas. These impervious surface features can be extracted from the multispectral satellite images like Sentinel-2 by applying available built-up indices proposed in the literature. This additional information further helps the training model to learn better differentiation between buildings and other similar-looking objects. Also, it helps the model in emphasizing more on the buildings’ geometrical shape and size, their patterns, and segregation of building boundaries in dense building infrastructures. These impervious surfaces feature information along with available bands that will help in better urban feature extraction. Furthermore, it improves the building extraction performances. The deep, learning-based approaches have much better generalization capabilities with high accuracy and have proven to be very successful in computer vision research and remote sensing domain. This work uses deep learning, state-of-art, image segmentation techniques and algorithms, which are specifically tuned for building extraction for evaluating the proposed methodology.
The major research objective of this work is to improve the performances of various deep learning models in building extraction for medium spatial resolution satellite images. This is achieved by enhancing the available multispectral image data using the proposed methodology. In this methodology, the available highest 10 m spatial resolution bands, super-resolved 20 m spatial resolution bands are merged with a built-up index image. The building shapefiles that are used in this work help the deep learning models to learn and extract the building structure features only. The deep learning models that are used for evaluating the quality of building extraction shows better performance in the case of enhanced data produced by the proposed methodology than the raw satellite image data. The following are the prime contributions of this work:
(1)
A novel approach named ‘6+’ is proposed for improving the building extraction performance of various deep learning models in medium spatial resolution, i.e., 10 m satellite images.
(2)
A novel medium spatial resolution building extraction dataset is prepared using Sentinel-2 and OpenStreetMap (OSM) data.
(3)
Extensive experiments are drawn to validate the performance of the proposed work.
The remaining part of the research work is organized as follows: The discussion on relevant literature is presented in Section 2. The details about the study areas and data resources, the proposed methodology, and the evaluation metrics used for this research work are mentioned in Section 3. Section 4 presents and discusses the statistical and visual results. Section 5 concludes the paper.

2. Related Literature

This section presents some of the relevant techniques from the literature for urban feature extraction.
Due to the importance of built-up extraction from an urban area, several methodologies have been developed to perform land-use classification. Some techniques are based on supervised learning, e.g., neural network, object, knowledge, and contextual-based classification [15]. These approaches need training, so it is time consuming. There are other quick techniques also based on built-up indices.
These built-up index-based approaches do direct segmentation of the built-up area from the satellite image [16]. These built-up indices are simple and fast to implement. It generates an image by utilizing multiple bands and represents specific phenomena, such as vegetation, barren land, water bodies, built-up areas, etc. Several built-up indices have been proposed in the past for built-up extraction in previous works [8,13,17,18,19,20]. However, many factors affect or limit the performance of these built-up index methods. Some of these are varying spatial resolutions of satellite images, different environmental conditions and locations of study areas, dissimilarities in intra-urban structures, image acquisition time, confusion in class types due to spectral similarity, and fewer generalization capabilities.
At the same time, it is well seen that Convolution Neural Network (CNN)-based approaches have many more generalization capabilities and better protect the spatial characteristics of the objects. They have been proved successful in many areas, such as text [21], small object segmentation, such as counting the number of cars in a parking area for identifying the business done in a retail store [22], digits recognition [23], clouds detection [24], recognition of faces [25], detection of fasteners for railway tracks [26], classifying various crops [27], identifying temperature of water surfaces [28], and extracting roads from remote sensing imagery [29].
Deep learning techniques, such as convolution neural network (CNN) and its variants, have been proposed in the past for building extraction from remote sensing satellite images [14,30]. Reference [31] proposed a deep learning model EU-Net that deals with error ground truth labels with the help of the reverse focal loss function. Also, it extracts various features on multiple scales by using the proposed dense spatial pyramid pooling block (DSPPB), which uses a larger receptive field. Reference [32] proposed a deep learning model for building extraction named JointNet, which switches its loss function to extract both roads and buildings. This work also contributes to multi-scale feature extraction based on the utilization of dilated convolution for larger receptive field and dense connectivity blocks by proposing a dense atrous convolution block. While extracting large and complicated building structures, inaccuracy and incompleteness become a problem. Reference [33] proposed a deep learning model named BRRNet for a building extraction model that deals with this problem using multi-scale feature extraction, which is fused for obtaining enriched information. The prediction module of this model uses dilated convolution with different dilation factors for producing multi-scale features. The model also consists of a residual refinement module for the improvement in its accuracy. In [34], the authors proposed an efficient building extraction named ‘RU-Unet’ based on the Unet encoder-decoder structure. The model combines the capabilities of residual learning for reducing the vanishing gradient problem and atrous spatial pyramid pooling for obtaining the multi-scale features and better context information. This model used focal loss function and worked on WHU aerial and Inria datasets. The authors of [35] proposed a deep learning model named B-FGC-Net for building extraction. This model has three main modules; the first, SA, is for obtaining spatial-level information about building features. Another module, GFIA, serves the contextual- and global-level information with the help of dilated-convolution and self-attention mechanisms. The other module, CLFR, has been used for obtaining the cross-level information through fusion technique. This work used two building datasets, i.e., WHU and Inria datasets. Reference [36] proposed a novel building extraction model named RSR-Net, which targets the problem of huge parameterization and extensive calculation in deep learning. For a better performance, this model assigns the channel weights to the low- and high-level features and fuses them. This process reduces the noise in the fusion of features produced by shallow features. The Dr-net [37] deep learning-based building extraction model is specifically related to reducing the memory and training time of the learning models. Their model is based on encoder-decoder architecture and having a backbone of DeepLabv3+Net in composition of Residual network (ResNet) and densely connected CNN. This work utilized the two popular building datasets, i.e., WHU and Massachusetts. The Dilated-ResUnet deep learning model proposed by [10] extracts building structures from 10 m, i.e., medium spatial resolution multispectral satellite images. The Sentinel-2 satellite image and Open Streetmap (OSM) have been used in this work. Reference [12] proposed a deep learning model SegUnet that applies the combination of both SegNet and Unet for dealing with misclassification of pixels and salt-and-pepper noises while classifying pixel values.
Consequently, built-up index images better conserve the spectral characteristics of the targeted earth object. So, this work combines its capabilities with available satellite bands for better building using deep learning models.

3. Materials and Methodology

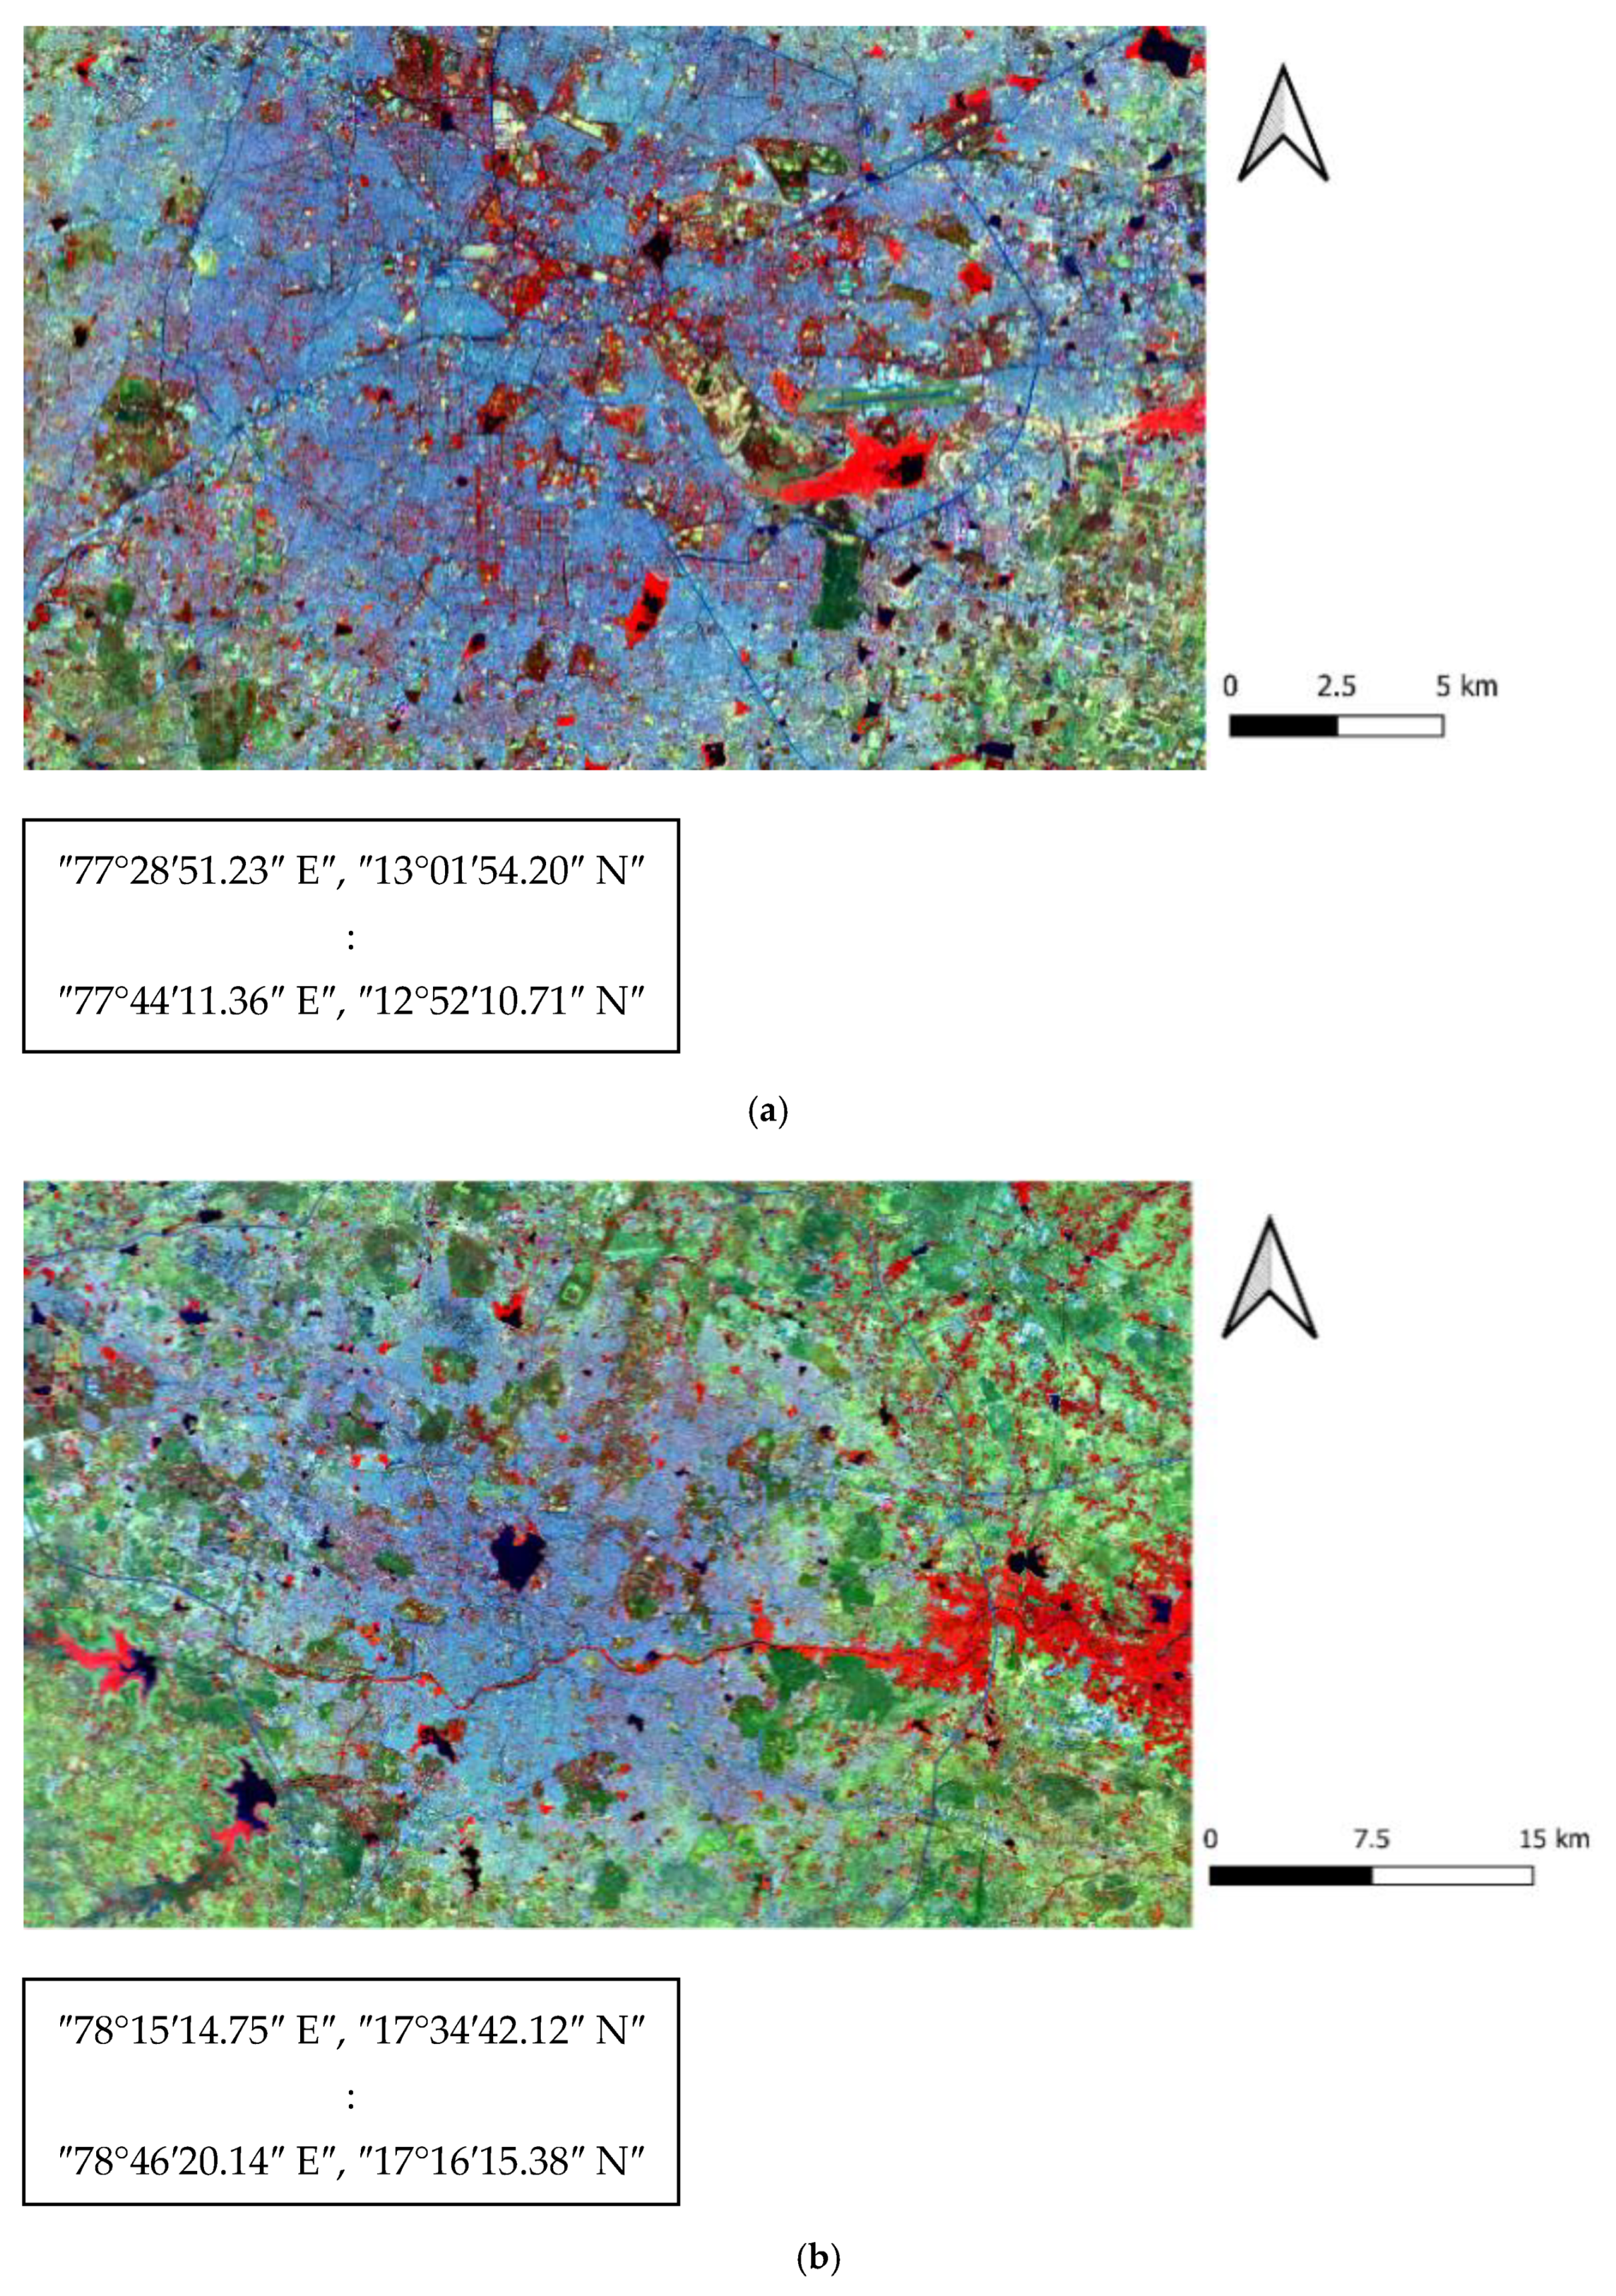
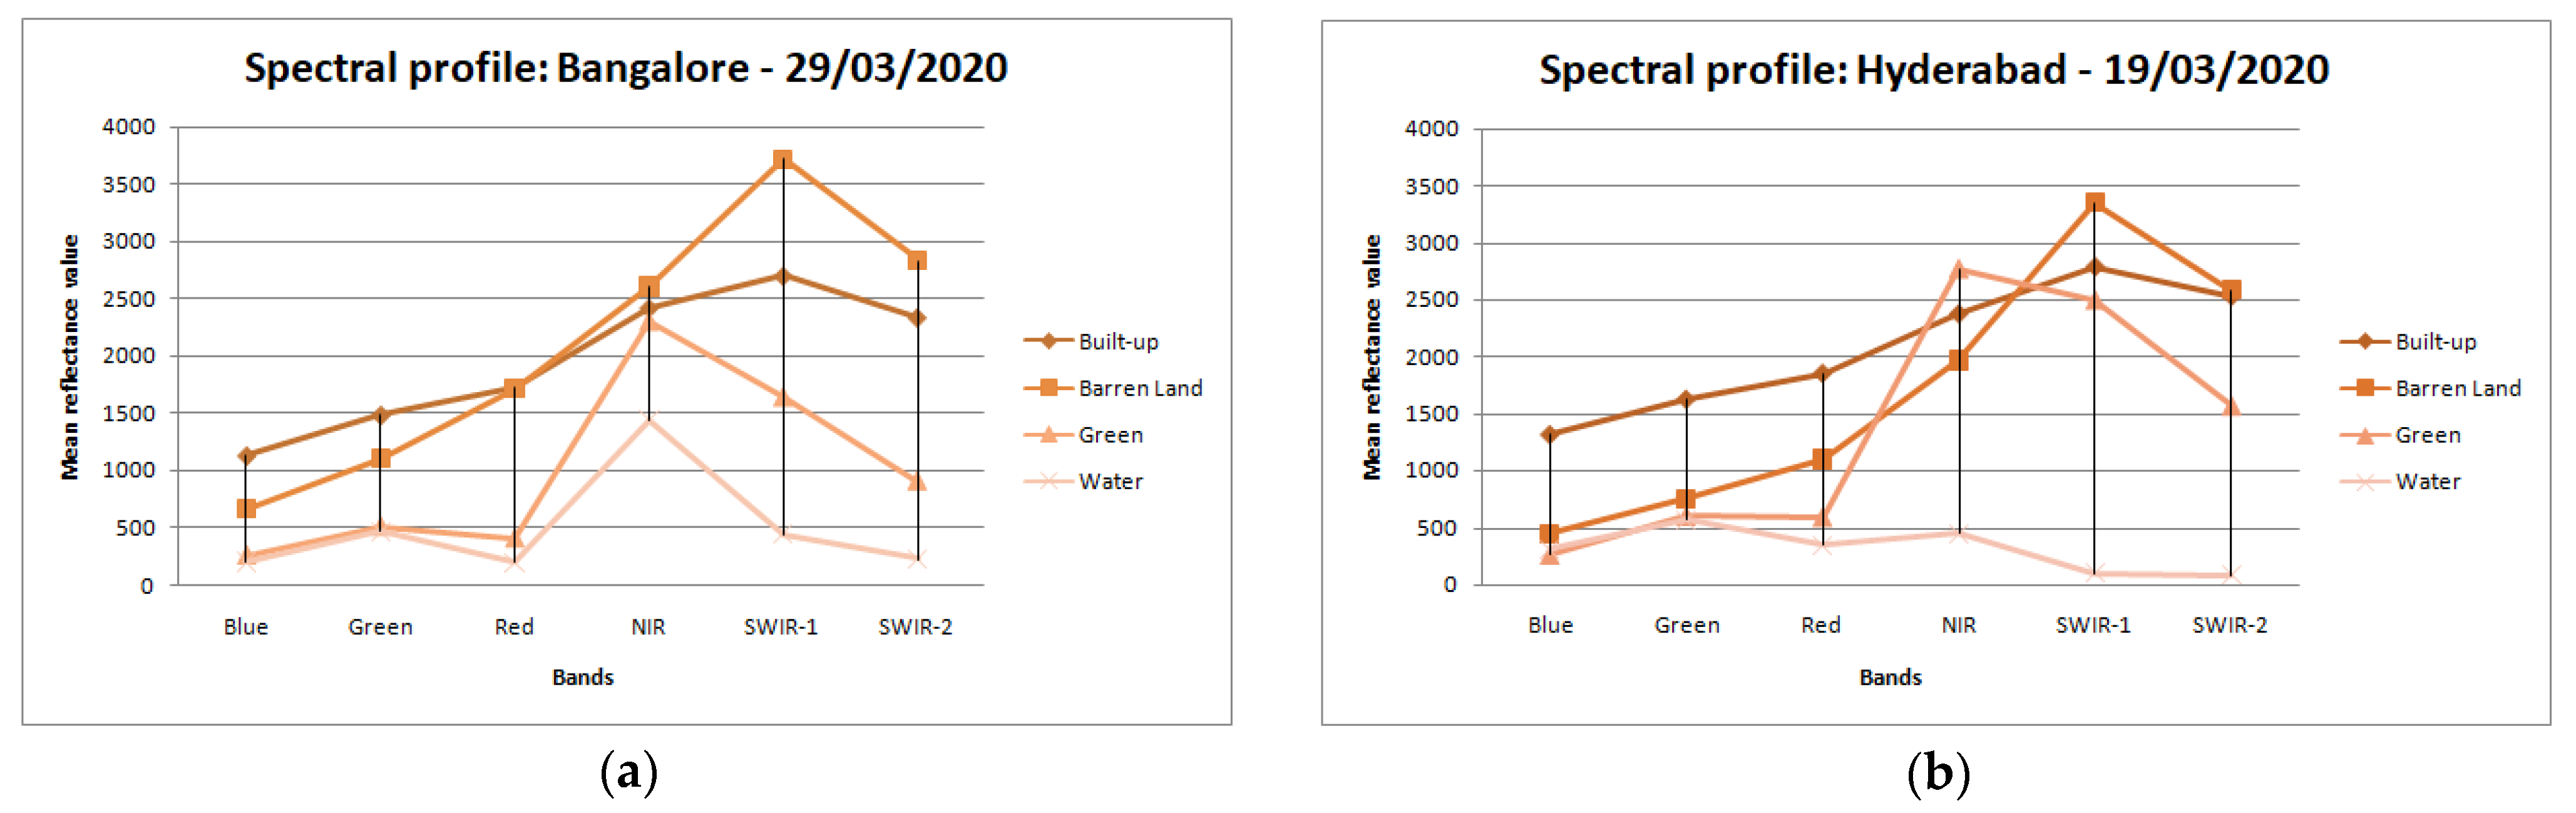
3.1. Study Areas and Data Resources

The Copernicus Sentinel-2A [38] satellite launched on 23 June 2015. Its development and operation are handled by the European Space Agency (ESA). The Sentinel-2 satellite has 13 multi-spectral bands covering the range of spectrum from Visible, to Near-Infrared (NIR), to Short-Wave Infrared (SWIR). Its spatial resolution ranges between 10 m and 60 m. These images are Bottom-Of-Atmosphere (BOA) corrected reflectance products and eradicate the various atmospheric conditions impacts. The details about the Sentinel-2 bands that have been used in this work are shown in Table 1. The free usage of Sentinel-2 satellite is provided by Copernicus Open Access Hub. It provides a privilege that encourages future researchers to choose any study area captured by Sentinel-2 satellite for their work [10]. This opportunity of free access to satellite data is crucial for conducting further research in the areas of land cover monitoring. It can also be helpful to replicate or apply the proposed methodology to the other study areas easily. In this work, the Bengaluru and Hyderabad cities are chosen as the study area because they are one of the largest cities of India. These cities consist of big area building structures due to the presence of multi-national companies and industries and consist of small-area building structures as well because of the dense population.
The Sentinel-2 satellite images for Bengaluru is acquired on 29 March 2020 with a cloud percentage of 0.07315 and for Hyderabad, it is 19 March 2020 with a cloud percentage of 0.057243. The OSM shapefiles and satellite images are geo-referenced to the projected coordinated system, i.e., the UTM zone 43 N/44 N. The Sentinel-2 satellite images in Figure 1a,b represents near-infrared (NIR) band by red, SWIR-1 band by green, and Enhanced Normalized Difference Impervious Surface Index (ENDISI)-based built-up information by blue. The Sentinel-2 bands with the highest spatial resolution and better spectral reflectance for the built-up areas are chosen for this work [17,19]. These bands are short wave infrared (SWIR-1 and SWIR-2) of 20m and near-infrared region (NIR), Red, Green, Blue bands of 10 m spatial resolution. The spectral profile for both the study areas is also presented in Figure 2a,b. These figures clearly show a better mean reflectance value for the built-up areas and justifies the importance and use of SWIR-1 (Band 11) and SWIR-2 (Band 12) in this work.

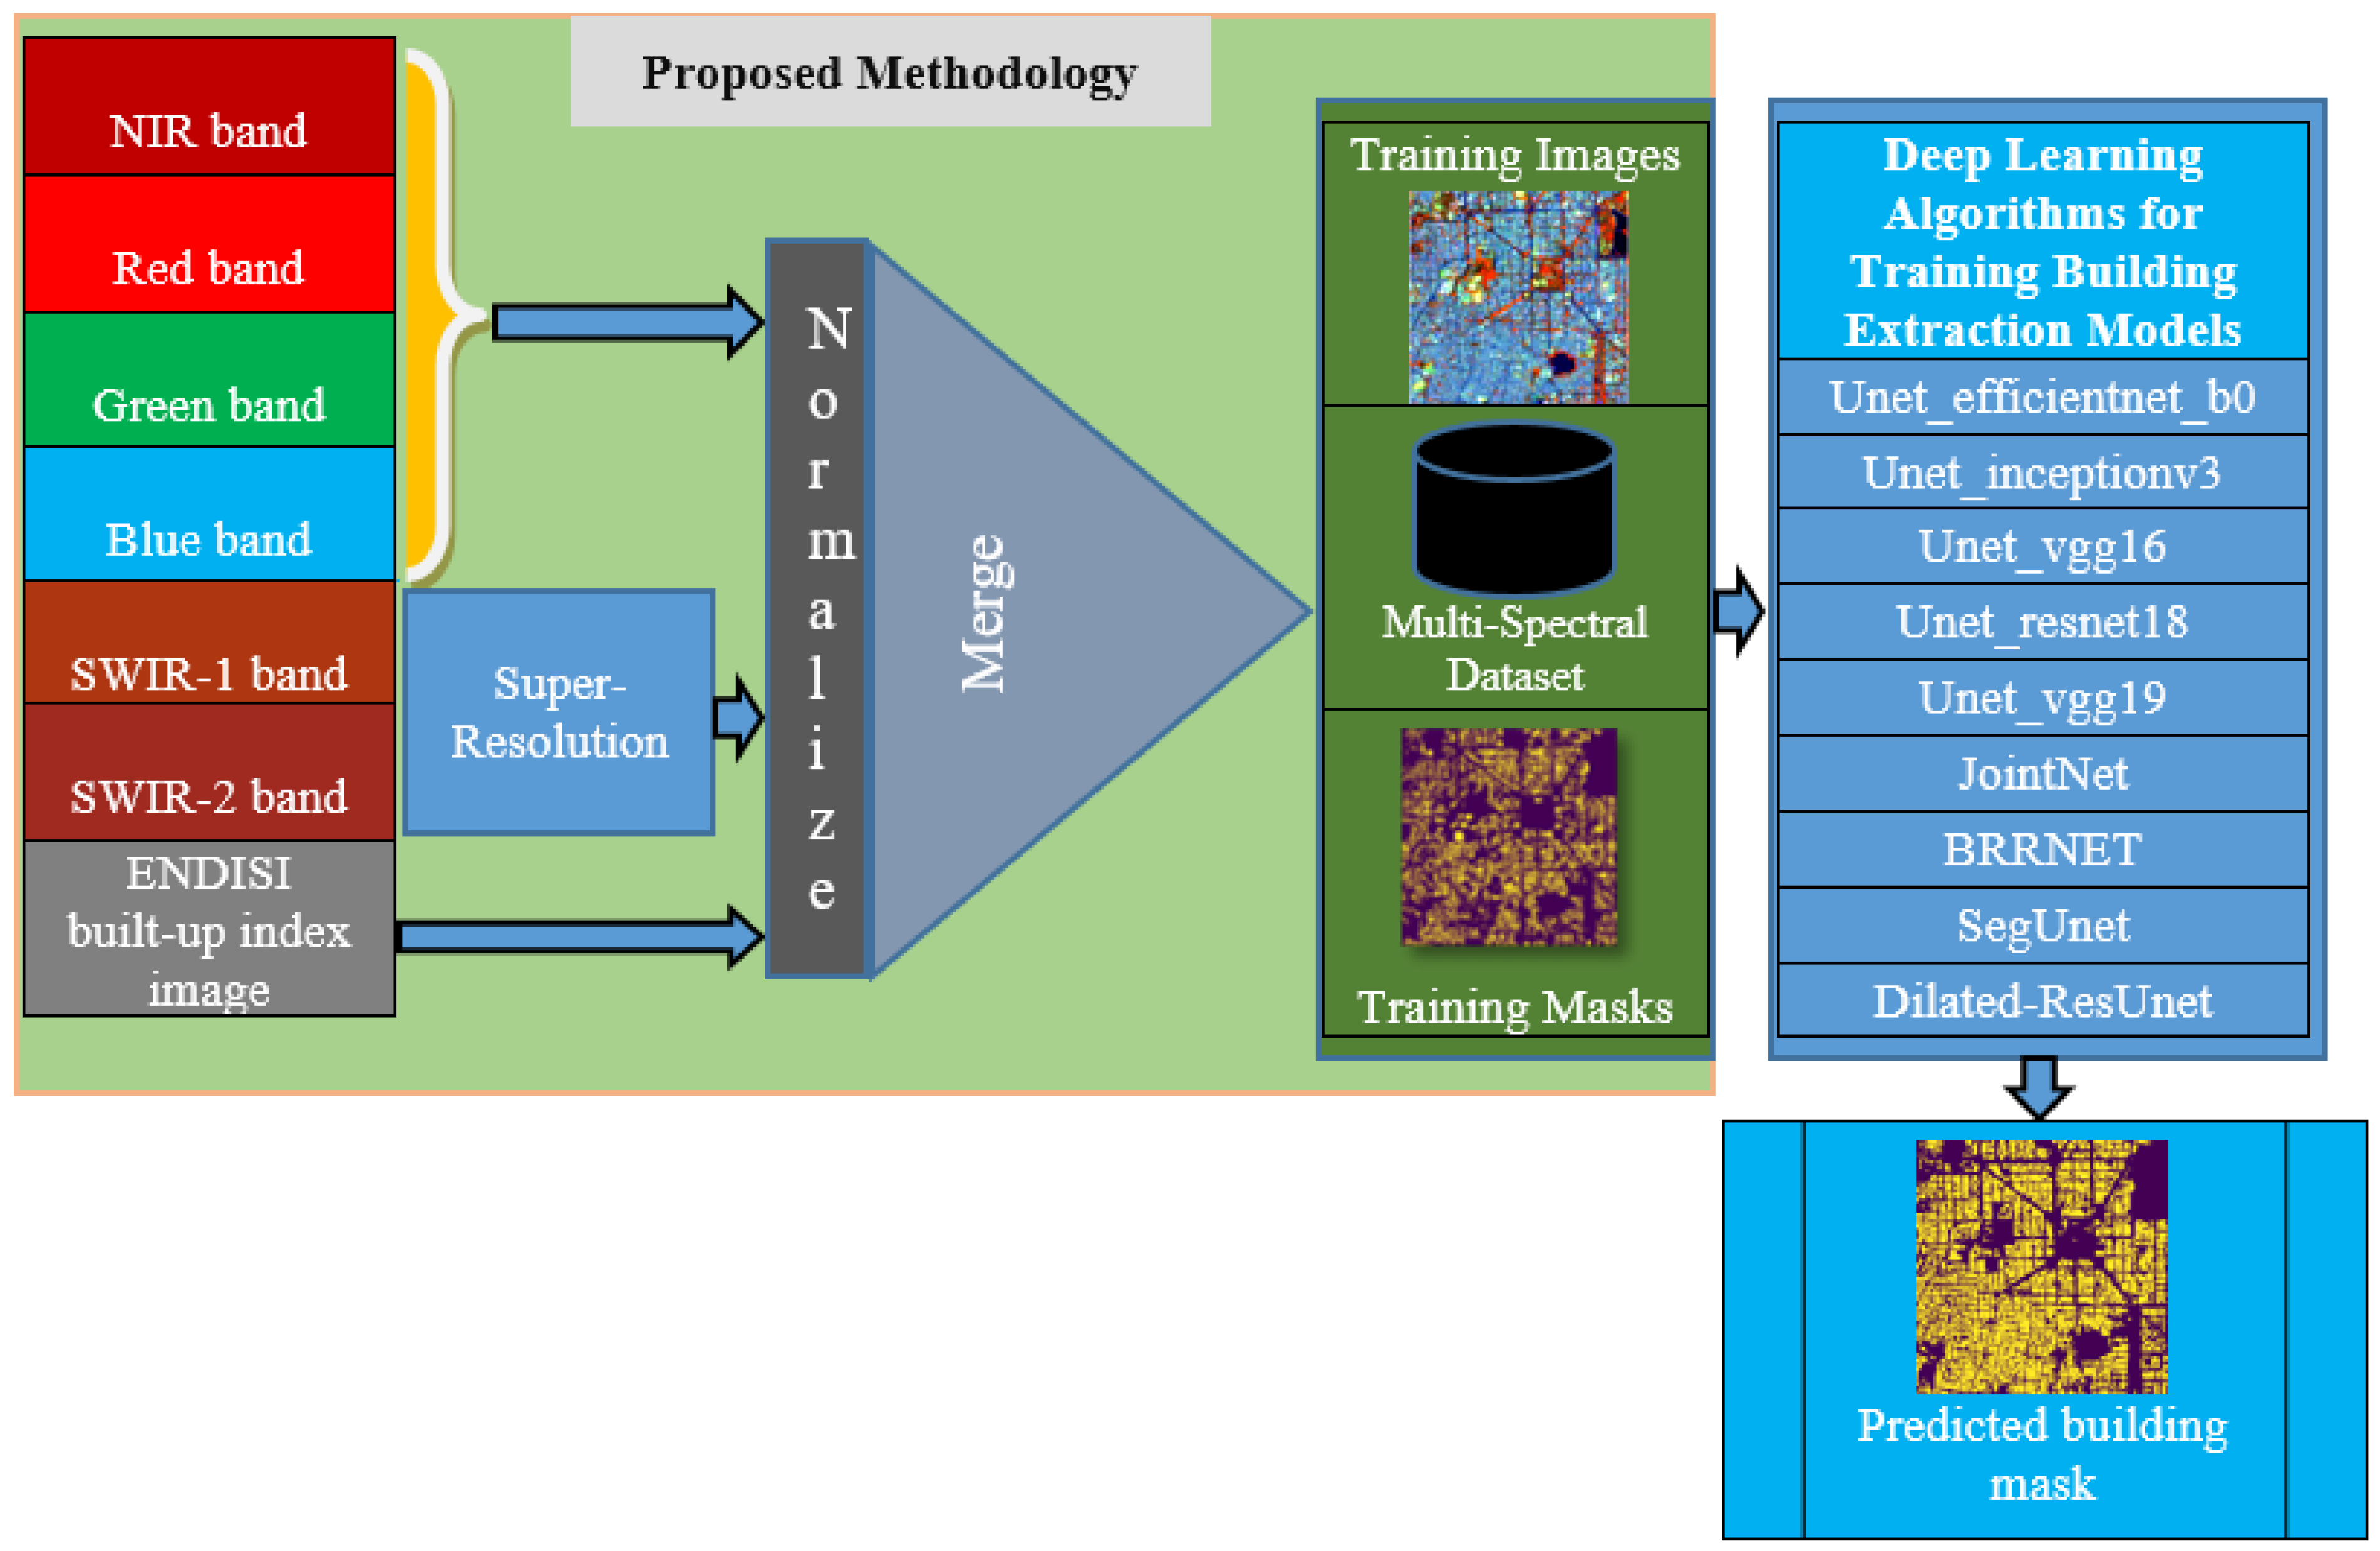
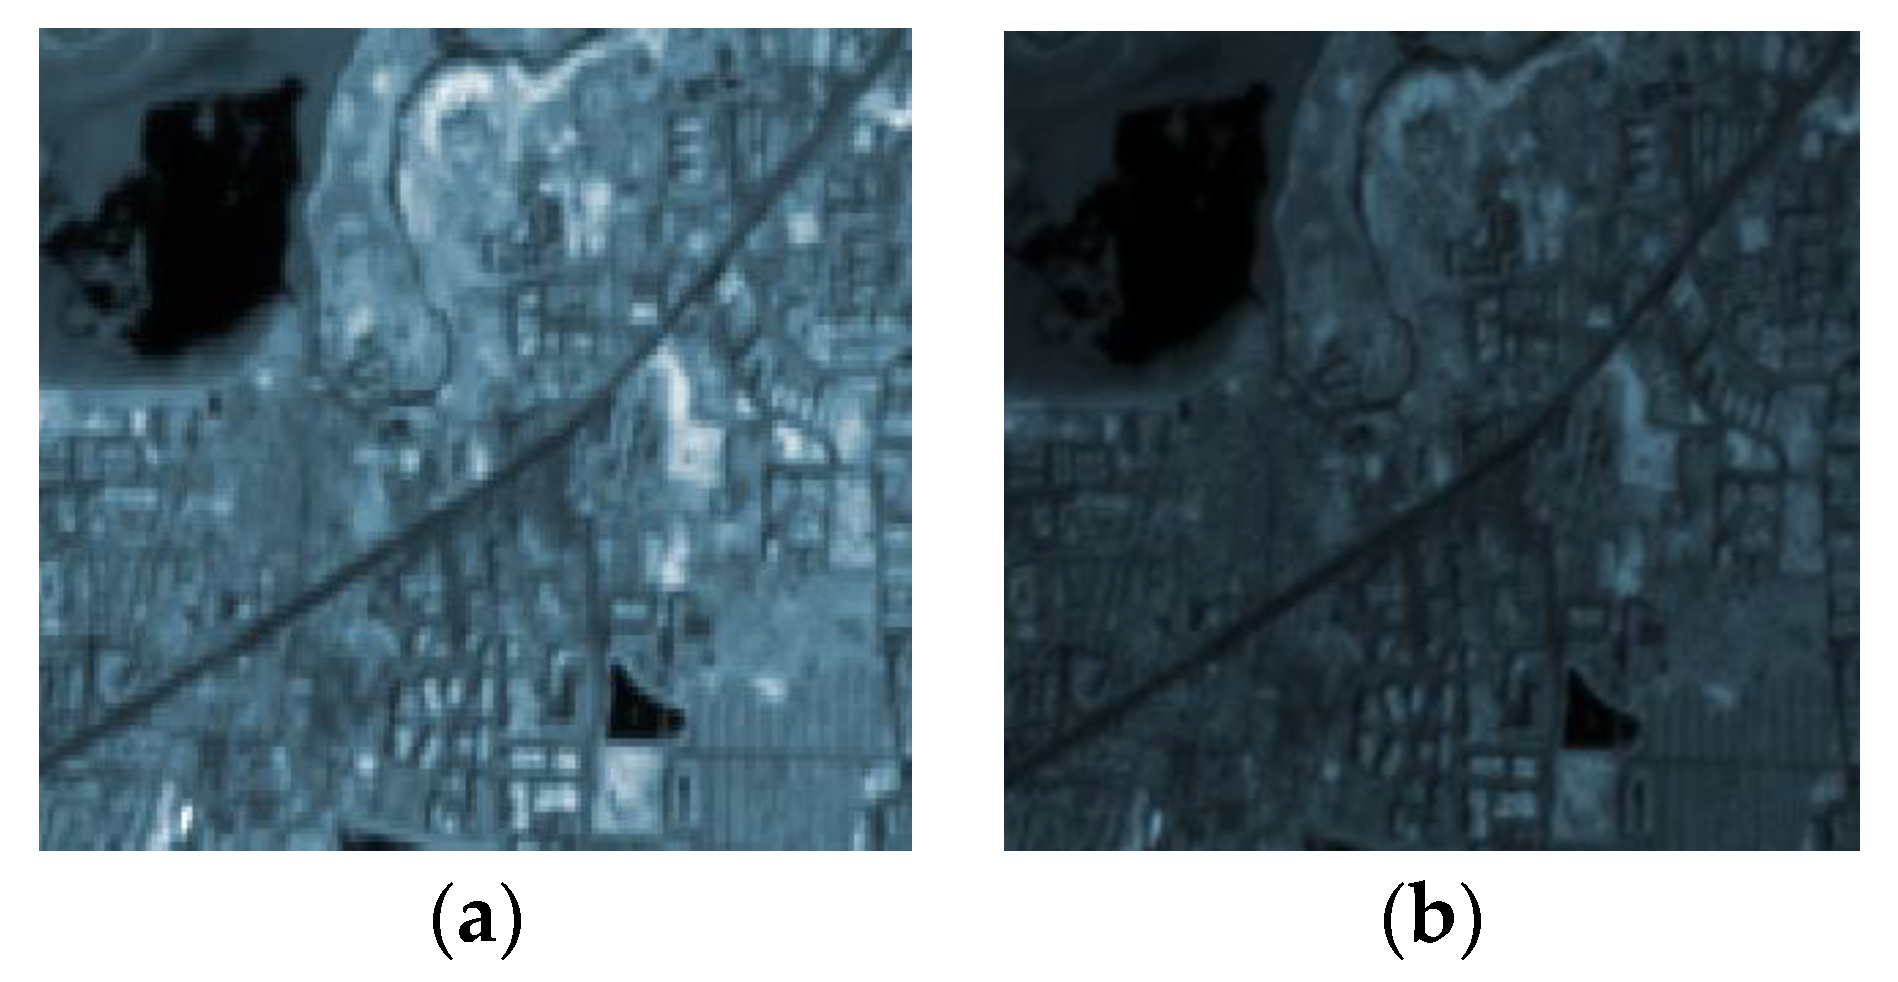
3.2. Proposed Methodology

The architecture of the proposed methodology, ‘6+’, is presented in Figure 3 under a light green compartment. It majorly focuses on improving the building extraction results for medium 10 m [39,40] spatial resolution satellite images. Mainly, three components are used in the proposed methodology as the input: First, all highest spatial resolution bands; second, short-wave infrared bands, i.e., SWIR-1 and 2; and third, a built-up index image. The first component, i.e., band-2, 3, 4, and 8 are easily available with Sentinel-2 data. The second component, i.e., bands 11 and 12, in their original form, are not very suitable for extraction of building structures due to their spatial resolution, which is 20 m, because 20-m spatial resolution covers only structures that are at least 20 m2 or more. The building structures having such a size are big, which can be often seen in the case of companies/industrial building structures, etc. Such spatial resolution generally loses small building structures, such as houses, small offices, etc. At the same time, bands 11 and 12 are important from the perspective of urban extraction as they have a high spectral reflectance value for built-up areas. To make these bands useful for this work, bands 11 and 12 are super-resolved to a 10 m spatial resolution. Super-resolution is a way to enhance the resolution of a multispectral and multi-resolution image. These multispectral bands have shared information that consists of the band-dependent spectral reflectance of the constituent’s elements in nearby pixels and is represented by ‘Ŝ’ and are known as shared values. The proportion of these shared elements within each pixel represented by ‘ W ˆ x ’ are known as weights. In this process [41], a mixing equation for shared values, i.e., Equation (1), is needed for computing the shared information between the neighboring pixels. In Equation (1), the term S ˆ x + 1 , y + 1 can be read as the reflectance of a shared part of high-resolution pixels and so on.
O ˆ ( x , y ) = W ˆ 0 ( x , y ) S ˆ x , y + W ˆ 1 ( x , y ) S ˆ x + 1 , y + W ˆ 2 ( x , y ) S ˆ x , y + 1 + W ˆ 3 ( x , y ) S ˆ x + 1 , y + 1
{ S ˆ o p t ,   W ˆ o p t } = a r g m i n 𝒷 O ˆ   x , y || O ˆ 0 𝒷 ,   x ,   y   O ˆ n 𝒷 ,   x ,   y     ||   2
Both the shared values, i.e., S ˆ o p t between high-resolution pixels for each band and weights common to all bands ( W ˆ o p t ) are calculated using Equation (2) iteratively. Here, O ˆ 0 is the observed pixel value and O ˆ n is the resolution-enhanced value. Here, 𝒷 O ˆ represents high-resolution band sets. For each coarse band, the corrected shared values are calculated and combined with band-independent weights for producing high-resolution images [42]. In summary, the overall process of super-resolution has two steps; the first step separates the reflectance, which is the band-dependent information from the common band independent information, i.e., “geometry of scene elements”. Second, to unmix (super-resolve) the low-resolution bands, this model is applied, which uses the band-independent geometric information while preserving their overall reflectance to solve the super-resolution problem. The super-resolved images of SWIR bands for both study areas are generated from the SNAP tool [43] by utilizing the super-resolution plugin obtained from [41]. A sample, cropped image of an area in Bengaluru is shown in Figure 4a, which presents the SWIR-1 band of Sentinel-2A satellite images. The Figure 4b shows its corresponding super-resolved image of 10 m spatial resolution. The third input component in the proposed methodology is a built-up index image. For this, the ENDISI [19] built-up index is used, and it is presented using Equations (3)–(5). This built-up index is applied to extract impervious surfaces information present in both study areas.
E N D I S I = B l u e α × [ S W I R 1 S W I R 2 + ( M N D W I ) 2 ] B l u e + α × [ S W I R 1 S W I R 2 + ( M N D W I ) 2 ]
α = 2 × M · ( B l u e ) M · ( S W I R 1 S W I R 2 ) + M · [ ( M N D W I ) 2 ]
M N D W I = G r e e n S W I R 1 G r e e n + S W I R 1
Here, B l u e , Green , SWIR 1 ,   SWIR 2 represent the surface reflectance of Blue, Green, SWIR-1, and SWIR-2 bands. M · represents the mean value of the image and MNDWI stands for modified normalized difference water index.
The ENDISI built-up index is used in the proposed methodology, as it provides a higher separability degree and eliminates the effect of water bodies. The other built-up indices, such as CBCI (combinational biophysical composition index), IBI (index-based built-up index), and NDBI, have influence based on the study areas. The other built-up indices, such as BCI (biophysical index) and CBI (combinational built-up index) are impacted by water bodies [19]. The ENDISI built-up index reduces the impact of arid land, bare rock, bare soil, and in this way it reduces the problem of spectral similarity b/w building and other objects. The ENDISI-generated built-up index image, as shown in Figure 5, highlights the impervious surfaces of the same study area which is shown in Figure 4a. Similarly, for the Hyderabad study area, such an image is also generated.
In the next step of the proposed methodology, the bands 2, 3, 4, 8, super-resolved bands 11 and 12, and the ENDISI built-up index image are normalized. They are merged to produce a multi-spectral image named ‘6+’. The merge operation is performed using QGIS Desktop 3.10.0 software. Since the range of values of bands 2, 3, 4, and 8 are different from the super-resolved bands 11 and 12 and ENDISI built-up image, all the data are normalized to a common range of 0 to 255. Here, normalization of data helps to better distribution of feature values for each of the features [44]. Therefore, the learning rate will not deviate from the weights of the network, and it helps by being a better and quicker training model. The ‘6+’ merged image has additional information about spectral characteristics of the impervious surface in the form of the ENDISI built-up index image. It helps in identifying and better training the model on impervious surfaces, such as building structures based on building ground truths. Apart from our proposed methodology-based ‘6+’ merged image, another multi-spectral image named ‘6 band’ is prepared. This image is produced by merging the bands 2, 3, 4, and 8, and the super-resolved bands 11 and 12. This image does not merge the ENDISI built-up index image. This ‘6 band’ image is produced by comparing the performance with the proposed methodology-based ‘6+’ image using various deep learning models for building extraction.
In the next step, both ‘6 band’ and ‘6+’ merged images along with their corresponding building ground truths obtained from OpenStreetMap (OSM) data [45] are cropped into 224 × 224-dimension images. This process produces 391 trainings and 46 testing images to form datasets ready to feed in for the training of various deep learning models. The building ground truths that are not updated or corrupt are identified by visually observation. Those ground truths are filtered out of the dataset along with their corresponding satellite images. This prepares the exact building extraction dataset of medium resolution satellite images. Both the prepared datasets have 90% training and 10% testing images of different variations separately, which include buildings of various shapes and sizes, dense and closely situated building structures, no building areas, i.e., water bodies, barren lands, green areas, etc. The ‘6+’ dataset is made public for future researchers at the following link: https://drive.google.com/drive/folders/1aV-bSIa51xd3oxrHWCVrHgQIPrMKfSzE?usp=sharing (accessed on 28 November 2021).

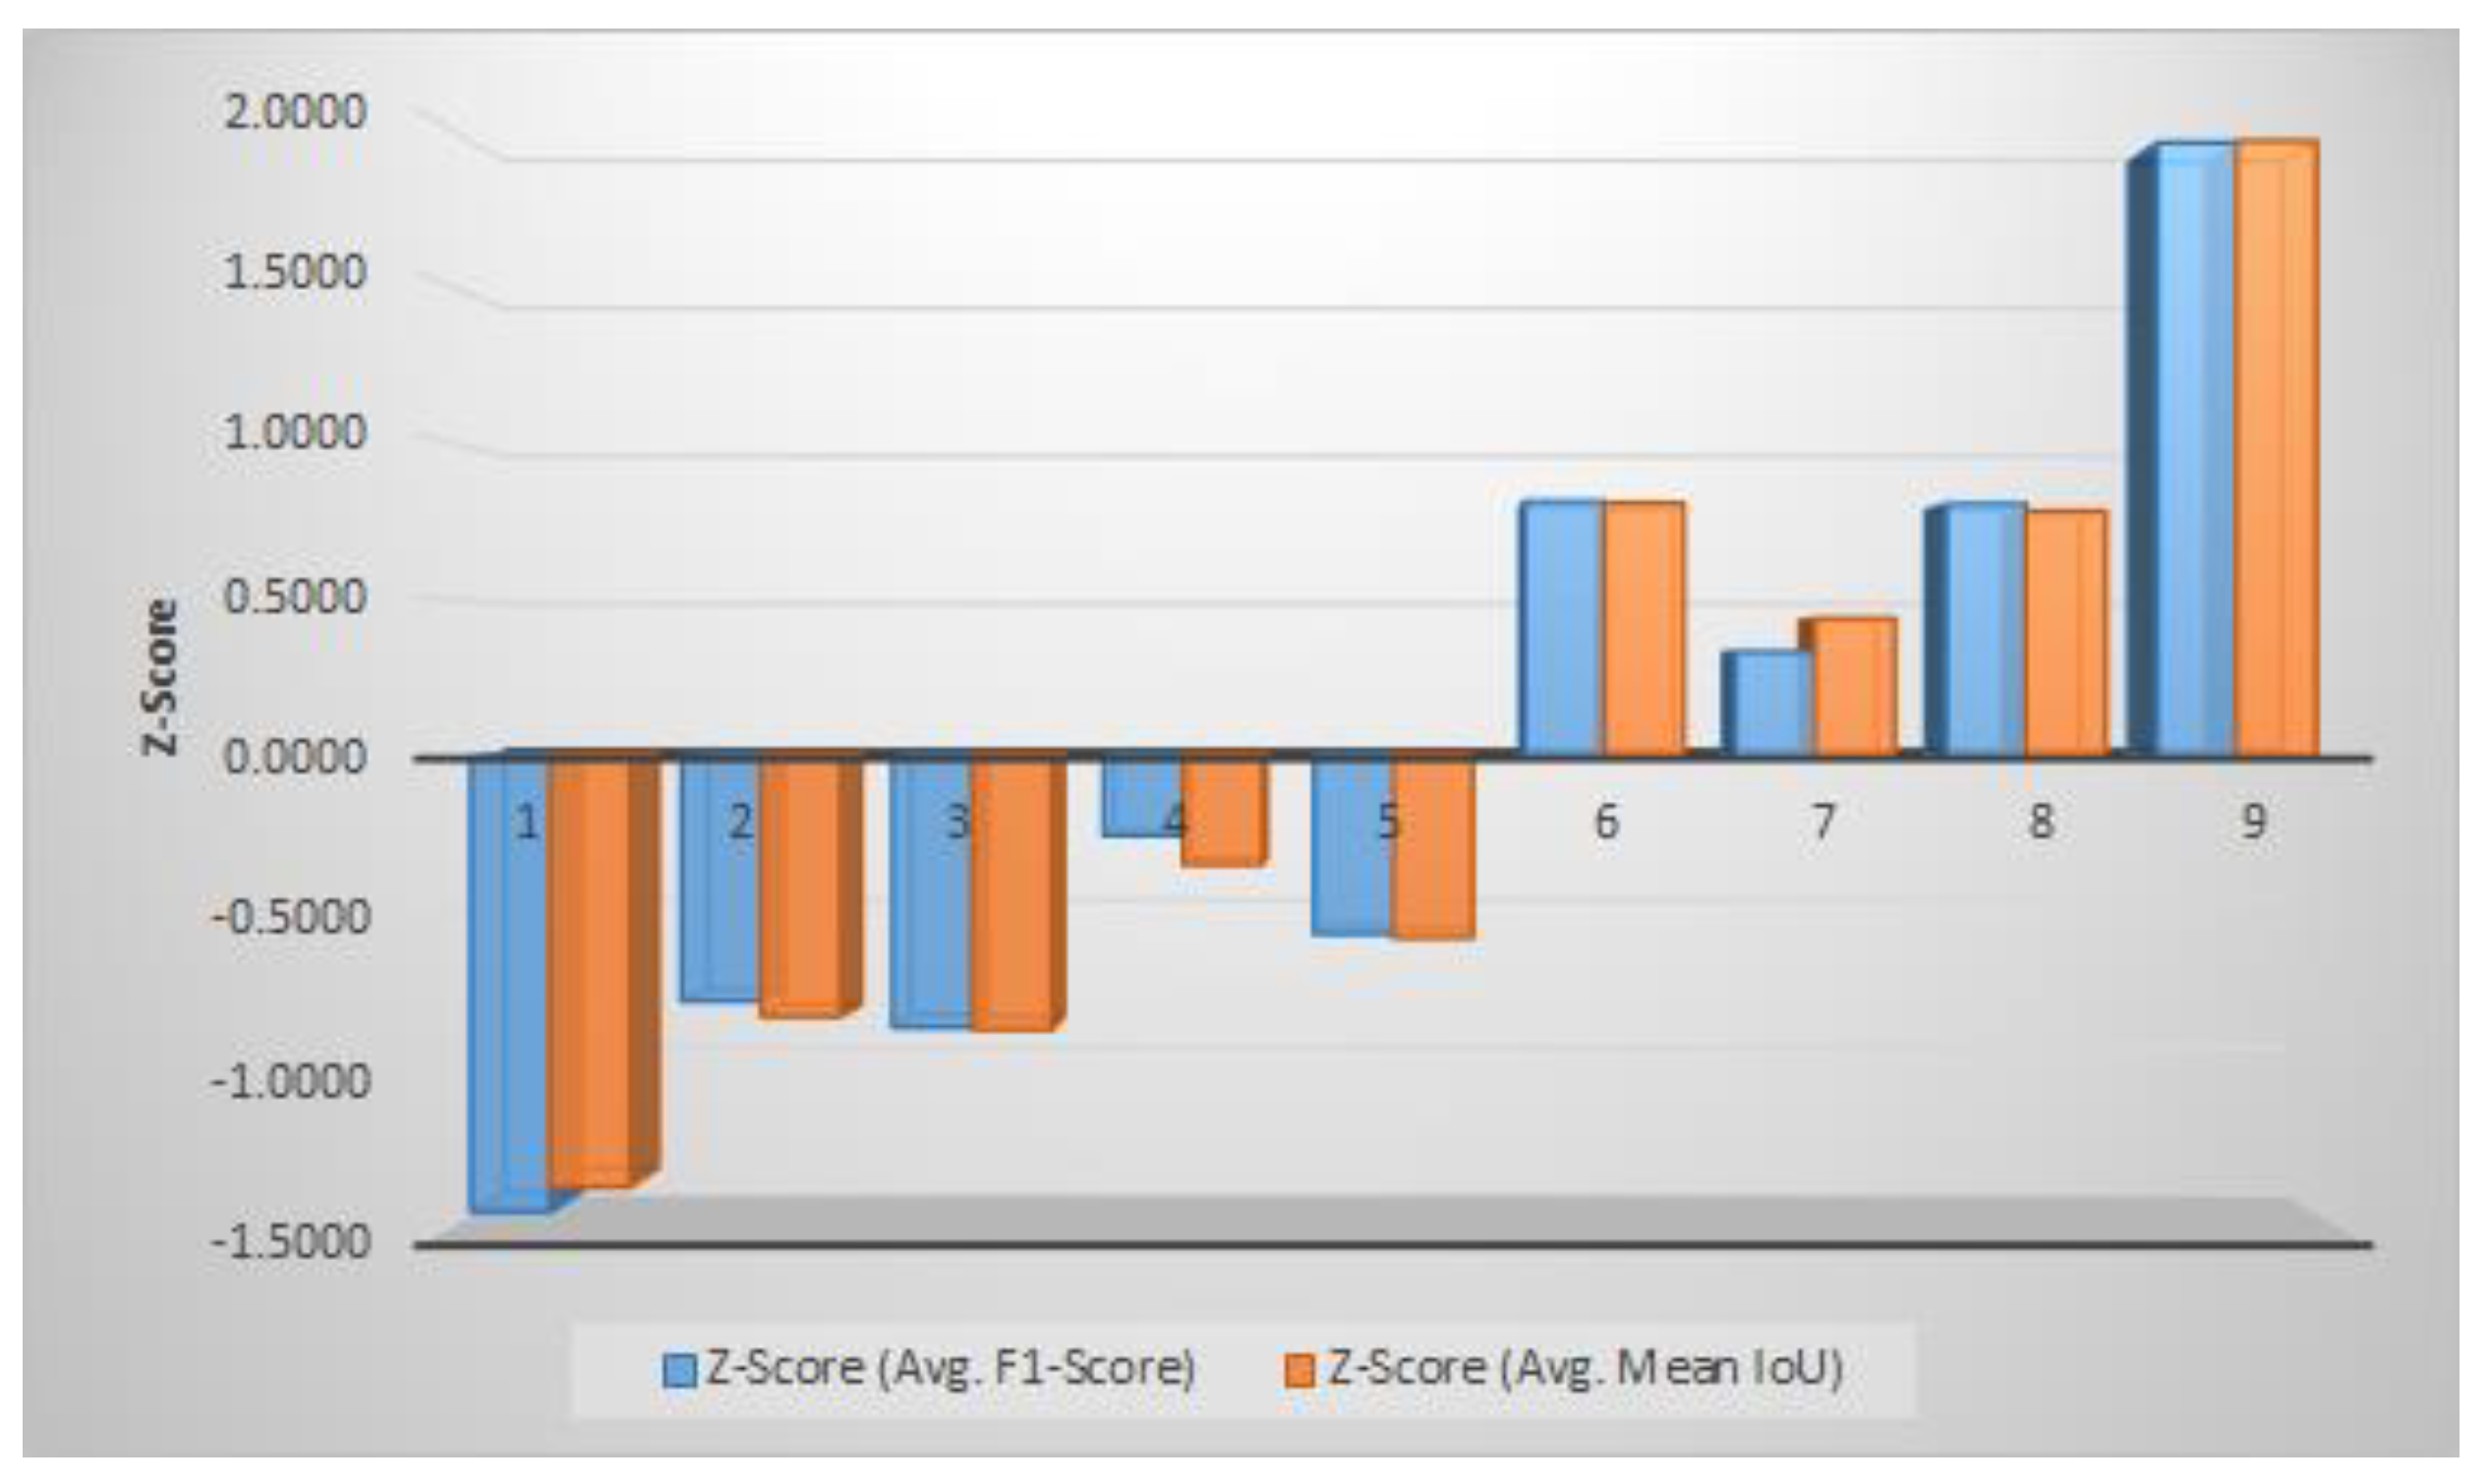
3.3. Evaluation Metrics

Two well-known performance evaluation metrics, F1-Score and Intersection over Union (IoU), are used by the applied deep learning model for accessing the performance of the proposed methodology in building extraction.
The F1-Score is a harmonic mean of recall and precision. It can be calculated as shown below:
F 1 Score   = 2 × P r e c i s i o n R e c a l l P r e c i s i o n + R e c a l l
Intersection over Union (IoU) is a popular metric for image segmentation that provides the measurement of overlap between the predicted and actual building masks. It can be calculated as shown below:
IoU   = A   B A     B

4. Experimental Results and Discussion

The NVIDIA DGX-1 v100 supercomputer is used for performing the experimentations. For the development of relevant codes, the Keras library is used with the backend being TensorFlow.
After preparing both datasets as shown in Figure 3, several experimentations are performed on both the ‘6+’ and ‘6 band’ datasets using various deep learning-based models for testing the efficacy of the proposed approach. The models that are specifically tuned for building extraction, i.e., JointNet [32], BRRNet [33], Dilated-ResUnet [10], and SegUnet [12], are implemented for analyzing the improvements through the proposed approach in their building extraction performance from medium spatial resolution satellite images. JointNet, BRRNet, and SegUnet models use Adam optimization and JointNet; SegUnet uses binary cross-entropy as the loss function whereas BRRNet uses dice coefficient loss. Apart from the above building extraction models, the other popular state-of-art image segmentation models, such as efficientnet_b0 [46], inceptionv3 [47], resnet18 [48], vgg16, and vgg19 [49] are used as the backbone in the Unet [50] based encoder-decoder [51] model for analyzing the performance improvement in segmentation of buildings from input satellite images. For Unet-based models, Adam is used as an optimizer and its hyper-parameter is set as mentioned in [52], i.e., the learning rate is set to 0.001, beta1 as 0.90, and beta2 as 0.999. The loss function for Unet-based encoder-decoder models is taken as binary cross-entropy. All these models perform the building extraction on both the prepared datasets, separately.
Table 2 and Table 3 present the F1-score and Mean IoU statistics generated on the test dataset by various models for building extraction. These statistics are arranged in ascending order of the values, generated by the proposed methodology. It can be seen from the upper green color arrow in Table 2 and Table 3 that the values of both the evaluation metrics, i.e., the F1-score and Mean IoU generated by all the models, has better results in the ‘6+’ dataset prepared by the proposed methodology when compared with the ‘6 band’ dataset. The Z-score is also calculated for each model, applied on the ‘6+’ entire dataset, which includes both training and testing images for observing how far the results obtained by various models are away from the mean in terms of standard deviation. Figure 6 presents the Z-Score for the models mentioned in Table 2 and Table 3 by serial numbers. It shows that the results obtained by various models using the proposed methodology are under the normal distribution and do not have any anomaly or outlier values. This shows the generalization ability and signifies the consistency and reliability of obtained results using the ‘6+’ dataset prepared by the proposed methodology.
Figure 7a,c show sample test satellite images of the proposed methodology and their building ground truth is shown in Figure 7b,d. These input satellite images show the NIR band using a red color, SWIR-1 with Green, and the ENDISI built-up index image with blue. These satellite images have several features, including big and small building structures, roads, green areas, barren lands, water bodies, such as lakes, etc. Figure 8 and Figure 9 show the building masks predicted by BRRNet, JointNet, SegUnet and Dilated-ResUnet building extraction models. In BRRNet-based predictions, improvement can be seen from Figure 8a and Figure 9a to Figure 8b and Figure 9b in terms of small buildings. The segregation of building boundaries is better with the proposed methodology. The JointNet-based prediction from ‘6 band’, i.e., Figure 8c and Figure 9c, shows too many misclassified pixels and mixing of building boundaries, but with the proposed methodology it produces better segregation of building boundaries as shown in Figure 8d and Figure 9d. The SegUnet based predictions as shown in Figure 8e and Figure 9e have a slightly better segregation of building boundaries than Figure 8f but show more misclassified pixels in small, densely located building structures as shown in Figure 9f. The Dilated-ResUnet-based model also shows improvements, as shown in Figure 8h, for the lower-middle areas of Figure 8g. It produces more structured and refined building boundaries. In the upper left areas of Figure 9h, the ‘6 band’ approach misses some of the building pixels whereas ‘6+’-based prediction classifies them correctly when compared to the ground truth.
The above discussion analyses show that the proposed methodology has improved the performance of all the applied models in building extraction. The improvement using the proposed approach is due to several factors, such as the use of built-up index images that specifically provides information only on impervious surfaces of the study area. It helps in better capturing the spectral and spatial information about building features. Along with the built-up index image, the involvement of SWIR bands further supports in capturing more built-up details due to high mean reflectance values for built-up areas. At the same time, super-resolution of SWIR bands provides the details about texture in more and better ways [53], and maintains the spatial resolution to 10 m. In this way, more information on built-up structures is available along with available 10 m bands, i.e., Red, Green, Blue, and NIR bands. The merge of available 10 m bands, super-resolved SWIR bands, and built-up index images helps in further improving the performances of all the deep learning models in building extraction by seeing a smaller amount of pixel misclassifications and better building segregation among closely situated building structures.

5. Conclusions

Urban and smart city planning needs a broader view for understanding the infrastructure developmental needs of society. These needs must be tracked and monitored by good governance for their controlled growth. Building extraction from satellite images is an important activity for this purpose. In this work, a novel approach, ‘6+’, was proposed for improving medium spatial resolution building extraction. This approach has utilized the highest spatial resolution for NIR, Red, Green, and Blue bands, super-resolved SWIR bands, and ENDISI built-up index images. These bands and the built-up index image are merged after applying normalization to produce an enhanced multispectral image. This produced multi-spectral image has better spectral and spatial characteristics and can be utilized to extract impervious surfaces, such as buildings, more efficiently. Two novel datasets were prepared. The first was based on the proposed methodology, i.e., ‘6+’, and the second one based on ‘6 band’ was produced by merging 10 m bands with super-resolved SWIR-1/2 bands. Extensive experimentations have been drawn by considering various building extraction models and other popularly known models for image segmentation. F1-Score and Mean IoU results of all the applied models have proved that the proposed, methodology-based ‘6+’ dataset achieved a better performance for building extraction than the ‘6 band’ dataset. Therefore, this paper has produced a novel model for improving the building extraction results in medium spatial resolution multi-spectral satellite images and can be useful for the benefit of society. In the near future, we will extend the proposed model by developing novel deep segmentation models.

Author Contributions

M.D.: methodology, investigation, data curation, software, visualization, writing—original draft preparation, and writing—review and editing. K.C.: conceptualization, methodology, visualization, and supervision. V.K.M.: methodology, visualization, supervision, and writing—review and editing. D.S.: funding acquisition, and writing—review and editing. H.-N.L.: funding acquisition, writing—review and editing. All authors have read and agreed to the published version of the manuscript.

Funding

This work was supported in part by the National Research Foundation of Korea (NRF) Grant funded by the Korean government (MSIP) (NRF-2021R1A2B5B03002118) and This research was supported by the Ministry of Science and ICT (MSIT), Korea, under the ITRC (Information Technology Research Center) support program(IITP-2021-0-01835) supervised by the IITP(Institute of Information & Communications Technology Planning & Evaluation).

Institutional Review Board Statement

Not applicable.

Informed Consent Statement

Not applicable.

Data Availability Statement

Conflicts of Interest

The authors declare no conflict of interest.

References

  1. Viale Pereira, G.; Schuch de Azambuja, L. Smart Sustainable City Roadmap as a Tool for Addressing Sustainability Challenges and Building Governance Capacity. Sustainability 2022, 14, 239. [Google Scholar] [CrossRef]
  2. Gómez, P.M.; Carrillo, O.J.J.; Kuffer, M.; Thomson, D.R.; Quiroz, J.L.O.; García, E.V.; Vanhuysse, S.; Abascal, Á.; Oluoch, I.; Nagenborg, M.; et al. Earth Observations and Statistics: Unlocking Sociodemographic Knowledge through the Power of Satellite Images. Sustainability 2021, 13, 640. [Google Scholar] [CrossRef]
  3. Wang, Y. Automatic Extraction of Building Outline from High Resolution Aerial Imagery. Int. Arch. Photogramm. Remote Sens. Spat. Inf. Sci.—ISPRS Arch. 2016, 41, 419–423. [Google Scholar] [CrossRef] [Green Version]
  4. Yuan, J.; Cheriyadat, A.M. Learning to Count Buildings in Diverse Aerial Scenes. In Proceedings of the ACM International Symposium on Advances in Geographic Information Systems, Dallas, TX, USA, 4–7 November 2014; pp. 271–280. [Google Scholar] [CrossRef]
  5. Juergens, C.; Meyer-Heß, F.M.; Goebel, M.; Schmidt, T. Remote Sensing for Short-Term Economic Forecasts. Sustainability 2021, 13, 9593. [Google Scholar] [CrossRef]
  6. Chhor, G.; Engineering, M.; Aramburu, C.B. Satellite Image Segmentation for Building Detection Using U-Net. 2017. Available online: http://cs229.stanford.edu/proj2017/final-reports/5243715.pdf (accessed on 1 August 2021).
  7. Muhuri, A.; Manickam, S.; Bhattacharya, A. Snehmani Snow Cover Mapping Using Polarization Fraction Variation with Temporal RADARSAT-2 C-Band Full-Polarimetric SAR Data over the Indian Himalayas. IEEE J. Sel. Top. Appl. Earth Obs. Remote Sens. 2018, 11, 2192–2209. [Google Scholar] [CrossRef]
  8. Mukherjee, A.; Kumar, A.A.; Ramachandran, P. Development of New Index-Based Methodology for Extraction of Built-Up Area From Landsat7 Imagery: Comparison of Performance With SVM, ANN, and Existing Indices. IEEE Trans. Geosci. Remote Sens. 2020, 59, 1592–1603. [Google Scholar] [CrossRef]
  9. Deliry, S.I.; Avdan, Z.Y.; Avdan, U. Extracting Urban Impervious Surfaces from Sentinel-2 and Landsat-8 Satellite Data for Urban Planning and Environmental Management. Environ. Sci. Pollut. Res. 2020, 28, 6572–6586. [Google Scholar] [CrossRef]
  10. Dixit, M.; Chaurasia, K.; Kumar, V. Dilated-ResUnet: A Novel Deep Learning Architecture for Building Extraction from Medium Resolution Multi-Spectral Satellite Imagery. Expert Syst. Appl. 2021, 184, 115530. [Google Scholar] [CrossRef]
  11. Shi, W.; Mao, Z.; Liu, J. Building Area Extraction from the High Spatial Resolution Remote Sensing Imagery. Earth Sci. Inform. 2019, 12, 19–29. [Google Scholar] [CrossRef]
  12. Abdollahi, A.; Pradhan, B.; Alamri, A.M. An Ensemble Architecture of Deep Convolutional Segnet and Unet Networks for Building Semantic Segmentation from High-Resolution Aerial Images. Geocarto Int. 2020, 11, 1856199. [Google Scholar] [CrossRef]
  13. Xu, J.; Xiao, W.; He, T.; Deng, X.; Chen, W. Extraction of Built-up Area Using Multi-Sensor Data—A Case Study Based on Google Earth Engine in Zhejiang Province, China. Int. J. Remote Sens. 2021, 42, 389–404. [Google Scholar] [CrossRef]
  14. Yuan, X.; Shi, J.; Gu, L. A Review of Deep Learning Methods for Semantic Segmentation of Remote Sensing Imagery. Expert Syst. Appl. 2021, 169, 114417. [Google Scholar] [CrossRef]
  15. Varshney, A.; Rajesh, E. A Comparative Study of Built-up Index Approaches for Automated Extraction of Built-up Regions From Remote Sensing Data. J. Indian Soc. Remote Sens. 2014, 42, 659–663. [Google Scholar] [CrossRef]
  16. He, C.; Shi, P.; Xie, D.; Zhao, Y. Improving the Normalized Difference Built-up Index to Map Urban Built-up Areas Using a Semiautomatic Segmentation Approach. Remote Sens. Lett. 2010, 1, 213–221. [Google Scholar] [CrossRef] [Green Version]
  17. Valdiviezo-N, J.C.; Téllez-Quiñones, A.; Salazar-Garibay, A.; López-Caloca, A.A. Built-up Index Methods and Their Applications for Urban Extraction from Sentinel 2A Satellite Data: Discussion. J. Opt. Soc. Am. A 2018, 35, 35. [Google Scholar] [CrossRef] [PubMed]
  18. Benkouider, F.; Abdellaoui, A.; Hamami, L. New and Improved Built-Up Index Using SPOT Imagery: Application to an Arid Zone (Laghouat and M’Sila, Algeria). J. Indian Soc. Remote Sens. 2019, 47, 185–192. [Google Scholar] [CrossRef]
  19. Chen, J.; Yang, K.; Chen, S.; Yang, C.; Zhang, S.; He, L. Enhanced Normalized Difference Index for Impervious Surface Area Estimation at the Plateau Basin Scale. J. Appl. Remote Sens. 2019, 13, 016502. [Google Scholar] [CrossRef] [Green Version]
  20. Li, C.; Wang, X.; Wu, Z.; Dai, Z.; Yin, J.; Zhang, C. An Improved Method for Urban Built-up Area Extraction Supported by Multi-Source Data. Sustainability 2021, 13, 5042. [Google Scholar] [CrossRef]
  21. Jaderberg, M.; Simonyan, K.; Vedaldi, A.; Zisserman, A. Reading Text in the Wild with Convolutional Neural Networks. Int. J. Comput. Vis. 2016, 116, 120. [Google Scholar] [CrossRef] [Green Version]
  22. Kampffmeyer, M.; Salberg, A.B.; Jenssen, R. Semantic Segmentation of Small Objects and Modeling of Uncertainty in Urban Remote Sensing Images Using Deep Convolutional Neural Networks. In Proceedings of the IEEE Computer Society Conference on Computer Vision and Pattern Recognition Workshops, Las Vegas, NV, USA, 26 June–1 July 2016; pp. 680–688. [Google Scholar] [CrossRef]
  23. Ali, S.; Shaukat, Z.; Azeem, M.; Sakhawat, Z.; Mahmood, T.; ur Rehman, K. An Efficient and Improved Scheme for Handwritten Digit Recognition Based on Convolutional Neural Network. SN Appl. Sci. 2019, 1, 1125. [Google Scholar] [CrossRef] [Green Version]
  24. Jeppesen, J.H.; Jacobsen, R.H.; Inceoglu, F.; Toftegaard, T.S. A Cloud Detection Algorithm for Satellite Imagery Based on Deep Learning. Remote Sens. Environ. 2019, 229, 247–259. [Google Scholar] [CrossRef]
  25. Wang, Q.; Guo, G. Benchmarking Deep Learning Techniques for Face Recognition. J. Vis. Commun. Image Represent. 2019, 65, 102663. [Google Scholar] [CrossRef]
  26. Wei, X.; Yang, Z.; Liu, Y.; Wei, D.; Jia, L.; Li, Y. Railway Track Fastener Defect Detection Based on Image Processing and Deep Learning Techniques: A Comparative Study. Eng. Appl. Artif. Intell. 2019, 80, 66–81. [Google Scholar] [CrossRef]
  27. Zhong, L.; Hu, L.; Zhou, H. Deep Learning Based Multi-Temporal Crop Classification. Remote Sens. Environ. 2019, 221, 430–443. [Google Scholar] [CrossRef]
  28. Vanhellemont, Q. Automated Water Surface Temperature Retrieval from Landsat 8/TIRS. Remote Sens. Environ. 2020, 237, 111518. [Google Scholar] [CrossRef]
  29. Zhang, Z.; Liu, Q.; Wang, Y. Road Extraction by Deep Residual U-Net. IEEE Geosci. Remote Sens. Lett. 2018, 15, 749–753. [Google Scholar] [CrossRef] [Green Version]
  30. Zhu, Q.; Liao, C.; Hu, H.; Mei, X.; Li, H. MAP-Net: Multi Attending Path Neural Network for Building Footprint Extraction from Remote Sensed Imagery. IEEE Trans. Geosci. Remote Sens. 2021, 59, 6169–6181. [Google Scholar] [CrossRef]
  31. Kang, W.; Xiang, Y.; Wang, F.; You, H. EU-Net: An Efficient Fully Convolutional Network for Building Extraction from Optical Remote Sensing Images. Remote Sens. 2019, 11, 2813. [Google Scholar] [CrossRef] [Green Version]
  32. Zhang, Z.; Wang, Y. JointNet: A Common Neural Network for Road and Building Extraction. Remote Sens. 2019, 11, 696. [Google Scholar] [CrossRef] [Green Version]
  33. Shao, Z.; Tang, P.; Wang, Z.; Saleem, N.; Yam, S.; Sommai, C. BRRNet: A Fully Convolutional Neural Network for Automatic Building Extraction from High-Resolution Remote Sensing Images. Remote Sens. 2020, 12, 1050. [Google Scholar] [CrossRef] [Green Version]
  34. Wang, H.; Miao, F. Building Extraction from Remote Sensing Images Using Deep Residual U-Net. Eur. J. Remote Sens. 2022, 55, 71–85. [Google Scholar] [CrossRef]
  35. Remote, R.; Imagery, S. B-FGC-Net: A Building Extraction Network from High Resolution Remote Sensing Imagery. Remote Sens. 2022, 14, 269. [Google Scholar]
  36. Huang, H.; Chen, Y.; Member, S.; Wang, R.; Member, S. A Lightweight Network for Building Extraction from Remote Sensing Images. IEEE Trans. Geosci. Remote Sens. 2021, 2892, 3131331. [Google Scholar] [CrossRef]
  37. Chen, M.; Wu, J.; Liu, L.; Zhao, W.; Tian, F.; Shen, Q.; Zhao, B.; Du, R. Dr-net: An Improved Network for Building Extraction from High Resolution Remote Sensing Image. Remote Sens. 2021, 13, 294. [Google Scholar] [CrossRef]
  38. Copernicus Open Access Hub. Available online: https://scihub.copernicus.eu/dhus/#/home (accessed on 6 July 2021).
  39. Xi, Y.; Thinh, N.X.; Li, C. Preliminary Comparative Assessment of Various Spectral Indices for Built-up Land Derived from Landsat-8 OLI and Sentinel-2A MSI Imageries. Eur. J. Remote Sens. 2019, 52, 240–252. [Google Scholar] [CrossRef] [Green Version]
  40. Satellite Data: What Spatial Resolution Is Enough? Available online: https://eos.com/blog/satellite-data-what-spatial-resolution-is-enough-for-you/ (accessed on 5 May 2021).
  41. Brodu, N. Super-Resolving Multiresolution Images With Band-Independent Geometry of Multispectral Pixels. IEEE Trans. Geosci. Remote Sens. 2017, 55, 4610–4617. [Google Scholar] [CrossRef] [Green Version]
  42. Armannsson, S.E.; Ulfarsson, M.O.; Sigurdsson, J.; Nguyen, H.V.; Sveinsson, J.R. A Comparison of Optimized Sentinel-2 Super-Resolution Methods Using Wald’s Protocol and Bayesian Optimization. Remote Sens. 2021, 13, 2192. [Google Scholar] [CrossRef]
  43. Snap Download. Available online: https://step.esa.int/main/download/snap-download/ (accessed on 2 January 2021).
  44. Banerjee, B.; Bhattacharya, A.; Buddhiraju, K.M. A Generic Land-Cover Classification Framework for Polarimetric SAR Images Using the Optimum Touzi Decomposition Parameter Subset—An Insight on Mutual Information-Based Feature Selection Techniques. IEEE J. Sel. Top. Appl. Earth Obs. Remote Sens. 2014, 7, 1167–1176. [Google Scholar] [CrossRef]
  45. Download OpenStreetMap Data for This Region. Available online: http://download.geofabrik.de/asia/india.html (accessed on 3 February 2021).
  46. Tan, M.; Le, Q.V. EfficientNet: Rethinking Model Scaling for Convolutional Neural Networks. In Proceedings of the 36th International Conference on Machine Learning, ICML 2019, Long Beach, CA, USA, 9–15 June 2019; pp. 10691–10700. [Google Scholar]
  47. Szegedy, C.; Vanhoucke, V.; Ioffe, S.; Shlens, J.; Wojna, Z. Rethinking the Inception Architecture for Computer Vision. In Proceedings of the IEEE Computer Society Conference on Computer Vision and Pattern Recognition, Las Vegas, NV, USA, 27–30 June 2016; pp. 2818–2826. [Google Scholar] [CrossRef] [Green Version]
  48. He, K.; Zhang, X.; Ren, S.; Sun, J. Deep Residual Learning for Image Recognition. In Proceedings of the IEEE Computer Society Conference on Computer Vision and Pattern Recognition, Las Vegas, NV, USA, 27–30 June 2016; pp. 770–778. [Google Scholar] [CrossRef] [Green Version]
  49. Simonyan, K.; Zisserman, A. Very Deep Convolutional Networks for Large-Scale Image Recognition. In Proceedings of the 3rd International Conference on Learning Representations, ICLR 2015—Conference Track Proceedings, San Diego, CA, USA, 7–9 May 2015; pp. 1–14. [Google Scholar]
  50. Ronneberger, O.; Fischer, P.; Brox, T. U-Net: Convolutional Networks for Biomedical Image Segmentation. In Lecture Notes in Computer Science (Including Subseries Lecture Notes in Artificial Intelligence and Lecture Notes in Bioinformatics); Springer: Berlin/Heidelberg, Germany, 2015; Volume 9351, pp. 234–241. [Google Scholar] [CrossRef] [Green Version]
  51. Welcome to Segmentation Models’s Documentation! Available online: https://segmentation-models.readthedocs.io/en/latest/ (accessed on 4 August 2021).
  52. Adam. Available online: https://keras.io/api/optimizers/adam/ (accessed on 1 August 2021).
  53. Guo, Y.; Zhou, M.; Wang, Y.; Wu, G.; Shibasaki, R. Learn to Be Clear and Colorful: An End-to-End Network for Panchromatic Image Enhancement. IEEE Geosci. Remote Sens. Lett. 2022, 14, 3142994. [Google Scholar] [CrossRef]
Figure 1. (a) Bengaluru (b) Hyderabad satellite images and their corner coordinates in Degree, Minutes, and Seconds.
Sustainability 14 01615 g001
Figure 2. Spectral reflectance curve for (a) Bengaluru area and (b) Hyderabad area.
Sustainability 14 01615 g002
Figure 3. The proposed methodology ‘6+’ for building extraction improvement.
Sustainability 14 01615 g003
Figure 4. Visual analysis (a) SWIR-1 band and (b) corresponding super-resolved version.
Sustainability 14 01615 g004
Figure 5. ENDISI built-up index image.
Sustainability 14 01615 g005
Figure 6. The Z-Score for average F1-Score and Mean IoU by all models on ‘6+’ dataset.
Sustainability 14 01615 g006
Figure 7. (a,c) are test satellite images and (b,d) are their corresponding building ground truths.
Sustainability 14 01615 g007
Figure 8. (a) 6 band (BRRNet) (b) 6+ (BRRNet) (c) 6 band (JointNet) (d) 6+ (JointNet) (e) 6 band (SegUnet) (f) 6+ (SegUnet) (g) 6 band (Dilated-ResUnet) (h) 6+ (Dilated-ResUnet)-based building extraction for Figure 7a.
Sustainability 14 01615 g008
Figure 9. (a) 6 band (BRRNet) (b) 6+ (BRRNet) (c) 6 band (JointNet) (d) 6+ (JointNet) (e) 6 band (SegUnet) (f) 6+ (SegUnet) (g) 6 band (Dilated-ResUnet) (h) 6+ (Dilated-ResUnet)-based building extraction for Figure 7c.
Sustainability 14 01615 g009
Table 1. Details of multi-spectral bands used in this work.
Sr. NoStudy AreaSensorBands UtilizedCentral Wavelength (nm)Spatial Resolution (m)
1BengaluruSentinel-2ARed,
Green,
Blue,
NIR,
SWIR-1
SWIR-2
664.6 (Red),
559.8 (Green),
492.4 (Blue),
832.8 (NIR)
10 m
2Hyderabad1613.7 (SWIR-1),
2202.4 (SWIR-2)
20 m
Table 2. Performance statistics on ‘6 band’ and ‘6+’ test datasets by state-of-art image segmentation models.
S. NoModelsF1-Score
(6 Band)
F1-Score
(6+)
Mean
IoU
(6 Band)
Mean IoU
(6+)
1Unet_efficientnet_b00.51700.5220 Sustainability 14 01615 i0010.6220.626 Sustainability 14 01615 i001
2Unet_inceptionv30.52390.5379 Sustainability 14 01615 i0010.6250.632 Sustainability 14 01615 i001
3Unet_vgg160.53610.5396 Sustainability 14 01615 i0010.6330.634 Sustainability 14 01615 i001
4Unet_resnet180.54280.5489 Sustainability 14 01615 i0010.6370.639 Sustainability 14 01615 i001
5Unet_vgg190.53970.5514 Sustainability 14 01615 i0010.6330.640 Sustainability 14 01615 i001
Table 3. Performance statistics on ‘6 band’ and ‘6+’ test datasets by building extraction models.
S. NoModelsF1-Score
(6 Band)
F1-Score
(6+)
Mean IoU
(6 Band)
Mean IoU
(6+)
6Neural-Network-for-Road-and-Building-Extraction (JointNet)0.52250.55220.624 Sustainability 14 01615 i0010.643 Sustainability 14 01615 i001
7Building Residual Refine Network (BRRNET)0.55170.55430.642 Sustainability 14 01615 i0010.645 Sustainability 14 01615 i001
8Dilated-ResUnet0.55720.56630.646 Sustainability 14 01615 i0010.650 Sustainability 14 01615 i001
9SegUnet0.57280.58200.654 Sustainability 14 01615 i0010.660 Sustainability 14 01615 i001
Publisher’s Note: MDPI stays neutral with regard to jurisdictional claims in published maps and institutional affiliations.

