Article

Can Biogas Plants Become a Significant Part of the New Polish Energy Deal? Business Opportunities for Poland’s Biogas Industry

by
Łukasz Mamica
1,*,
Monika Mazur-Bubak
1 and
Renata Wróbel-Rotter
2
1
Department of Public Economics, Cracow University of Economics, Rakowicka 27, 31-510 Kraków, Poland
2
Department of Econometrics and Operational Research, Cracow University of Economics, Rakowicka 27, 31-510 Kraków, Poland
*
Author to whom correspondence should be addressed.
Sustainability 2022, 14(3), 1614; https://doi.org/10.3390/su14031614
Submission received: 4 January 2022 / Revised: 24 January 2022 / Accepted: 25 January 2022 / Published: 29 January 2022

Abstract

:
The agricultural biogas sector is now facing the opportunity to become a significant actor in the new energy deal as a low-carbon source of electricity. Given the current prospects for rapid growth in the industry, the authors developed an economic model of a medium-sized agricultural biogas plant to assess the rate of return on such an investment. The analysis comprises energy prices, substrates, and other costs reported by the plants already in operation, as well as the electricity sales support system, the actual biogas and electricity yield from the substrates, and the digestate utilisation. It shows that a biogas plant capable of delivering ca. 2000 MWe generates a profit in a much shorter timeframe than 20 years, even under quite uncertain economic conditions. In the model scenario, the breakeven point is reached at slightly below 5000 MWh of power output or at ca. 5800 MWh including financing costs, with a planned annual output of approx. 8000 MWh. The profitability of the model biogas plant was also demonstrated by calculations made for other scenarios which differ in substrate composition and financing structure. The parameters of the econometric model are based on the data collected from a group of 41 units that use only organic plant matter for biogas production.

1. Introduction

Accelerating climate change and global warming are increasing the pressure for the energy transition to renewable energy sources [1]. Agricultural biogas can play an important role in the process, especially in the context of a projected nearly 50% increase in world energy consumption between 2018 and 2050 [2]. Considering the soaring energy prices in late 2021 and Poland’s untapped biogas production potential, prompt and significant investment in this sector is economically justified and should be considered a major priority. The motivation for this article is to provide an up-to-date analysis of the investment options in biogas plants under the current economic and political conditions in Poland, whereas the main aim is to encourage one of the more promising local options for energy transition.
This paper is organised as follows. Section 2 reviews Poland’s economic and legal framework. Section 3 discusses the key operating factors, such as investment costs, the electricity sales support system, and the econometric model for energy yield vs. substrate demand. Section 4 presents the empirical findings as simulated profitability scenarios depending on the financing structure adopted, while Section 5 contains the conclusions.
The literature review shows that there are a number of ways of constructing a profitability assessment model to determine whether biogas power plants can constitute a significant part of the new Polish energy deal [3]. The original model proposed in this paper covers both the technical and economic aspects of biogas plant operation over a 20-year time horizon. The technical side is captured by an econometric model that estimates the amount of electricity obtained from a range of substrates. Such an approach better reflects the reality of how biogas plants function as it includes all the sector-specific factors that affect biogas yield. The economic model of a medium-sized agricultural biogas plant that can deliver approx. 1 MWe is then used to analyse a variety of economic scenarios that differ in terms of sales mechanisms, operating costs, substrate acquisition, and investment costs.
The development of agricultural biogas plants complies with both the new Polish socio-economic programme and the new European one [4]. Given Poland’s relatively low population density, sufficient agricultural land resources could be deployed for the cultivation of energy crops [5,6]. Biogas plants are environmentally sustainable [7,8], produce eco-friendly renewable energy [9], and can also reduce the demand for electricity storage infrastructure, which can be costly due to the rising prices of the rare metals used for battery production [10]. Likewise, researchers increasingly recognise the benefits of such plants as sustainable and cost-effective biodegradable waste utilisers with favourable perspectives for the development of the biogas market in Poland and elsewhere [11,12,13].
The literature on the Polish biogas industry is sparse. In 2012, 24 operating plants were described by Igliński et al. [14] and an article on the optimisation of the agricultural biogas installations was published by Budzianowski [15]. Papers describing the impact of a variety of raw materials on the economic performance of this sector appeared in the subsequent years [16,17]. Sector-specific studies include the publication on the anticipated costs of investment in agricultural biogas plants with an installed electrical capacity of 1 Mwe in the Polish economic conditions [18]. Later papers reveal a growing interest in biogas in Poland in terms of both the location possibilities and the profitability of investing in new plants [19], prospective biomethane production [20,21], and biomass management options [22]; there are also analyses concerning the disposal of digestate from the local agricultural biogas plants. Biogas yield models were considered, e.g., by Dandikas et al. [23], whereas certain financial aspects of plant operation were studied by Zabolotnyy and Melnyk [24]. Igliński et al. [25] summarise 15 years of Poland’s experience with biogas plants. Usually, however, the available biogas production models differ widely in the optimal substrate composition, which results in up to a 60% variability of findings [26]. Moreover, they fail to take into account the economic side of biogas plant operation by disregarding a range of impacts on profitability, such as labour and service costs, substrate collection, and digestate disposal. It should also be mentioned that energy crops used for biogas production can be successfully grown on degraded land, and their biomethane potential and specific energy yield are no different from crops grown on arable land, which opens up new opportunities for the former [27]. Biogas plants are treated as important elements of the bottom-up development of the second tier administrative units [13,28]. As was confirmed by calculations made for the Warmia-Mazury Province (northern Poland), biogas plants are an important component of the energy self-sufficiency of the studied area due to the easy availability of biomass as well as the achievable high efficiency of generators and heat recovery (ca. 40% and 50%, respectively) [13].

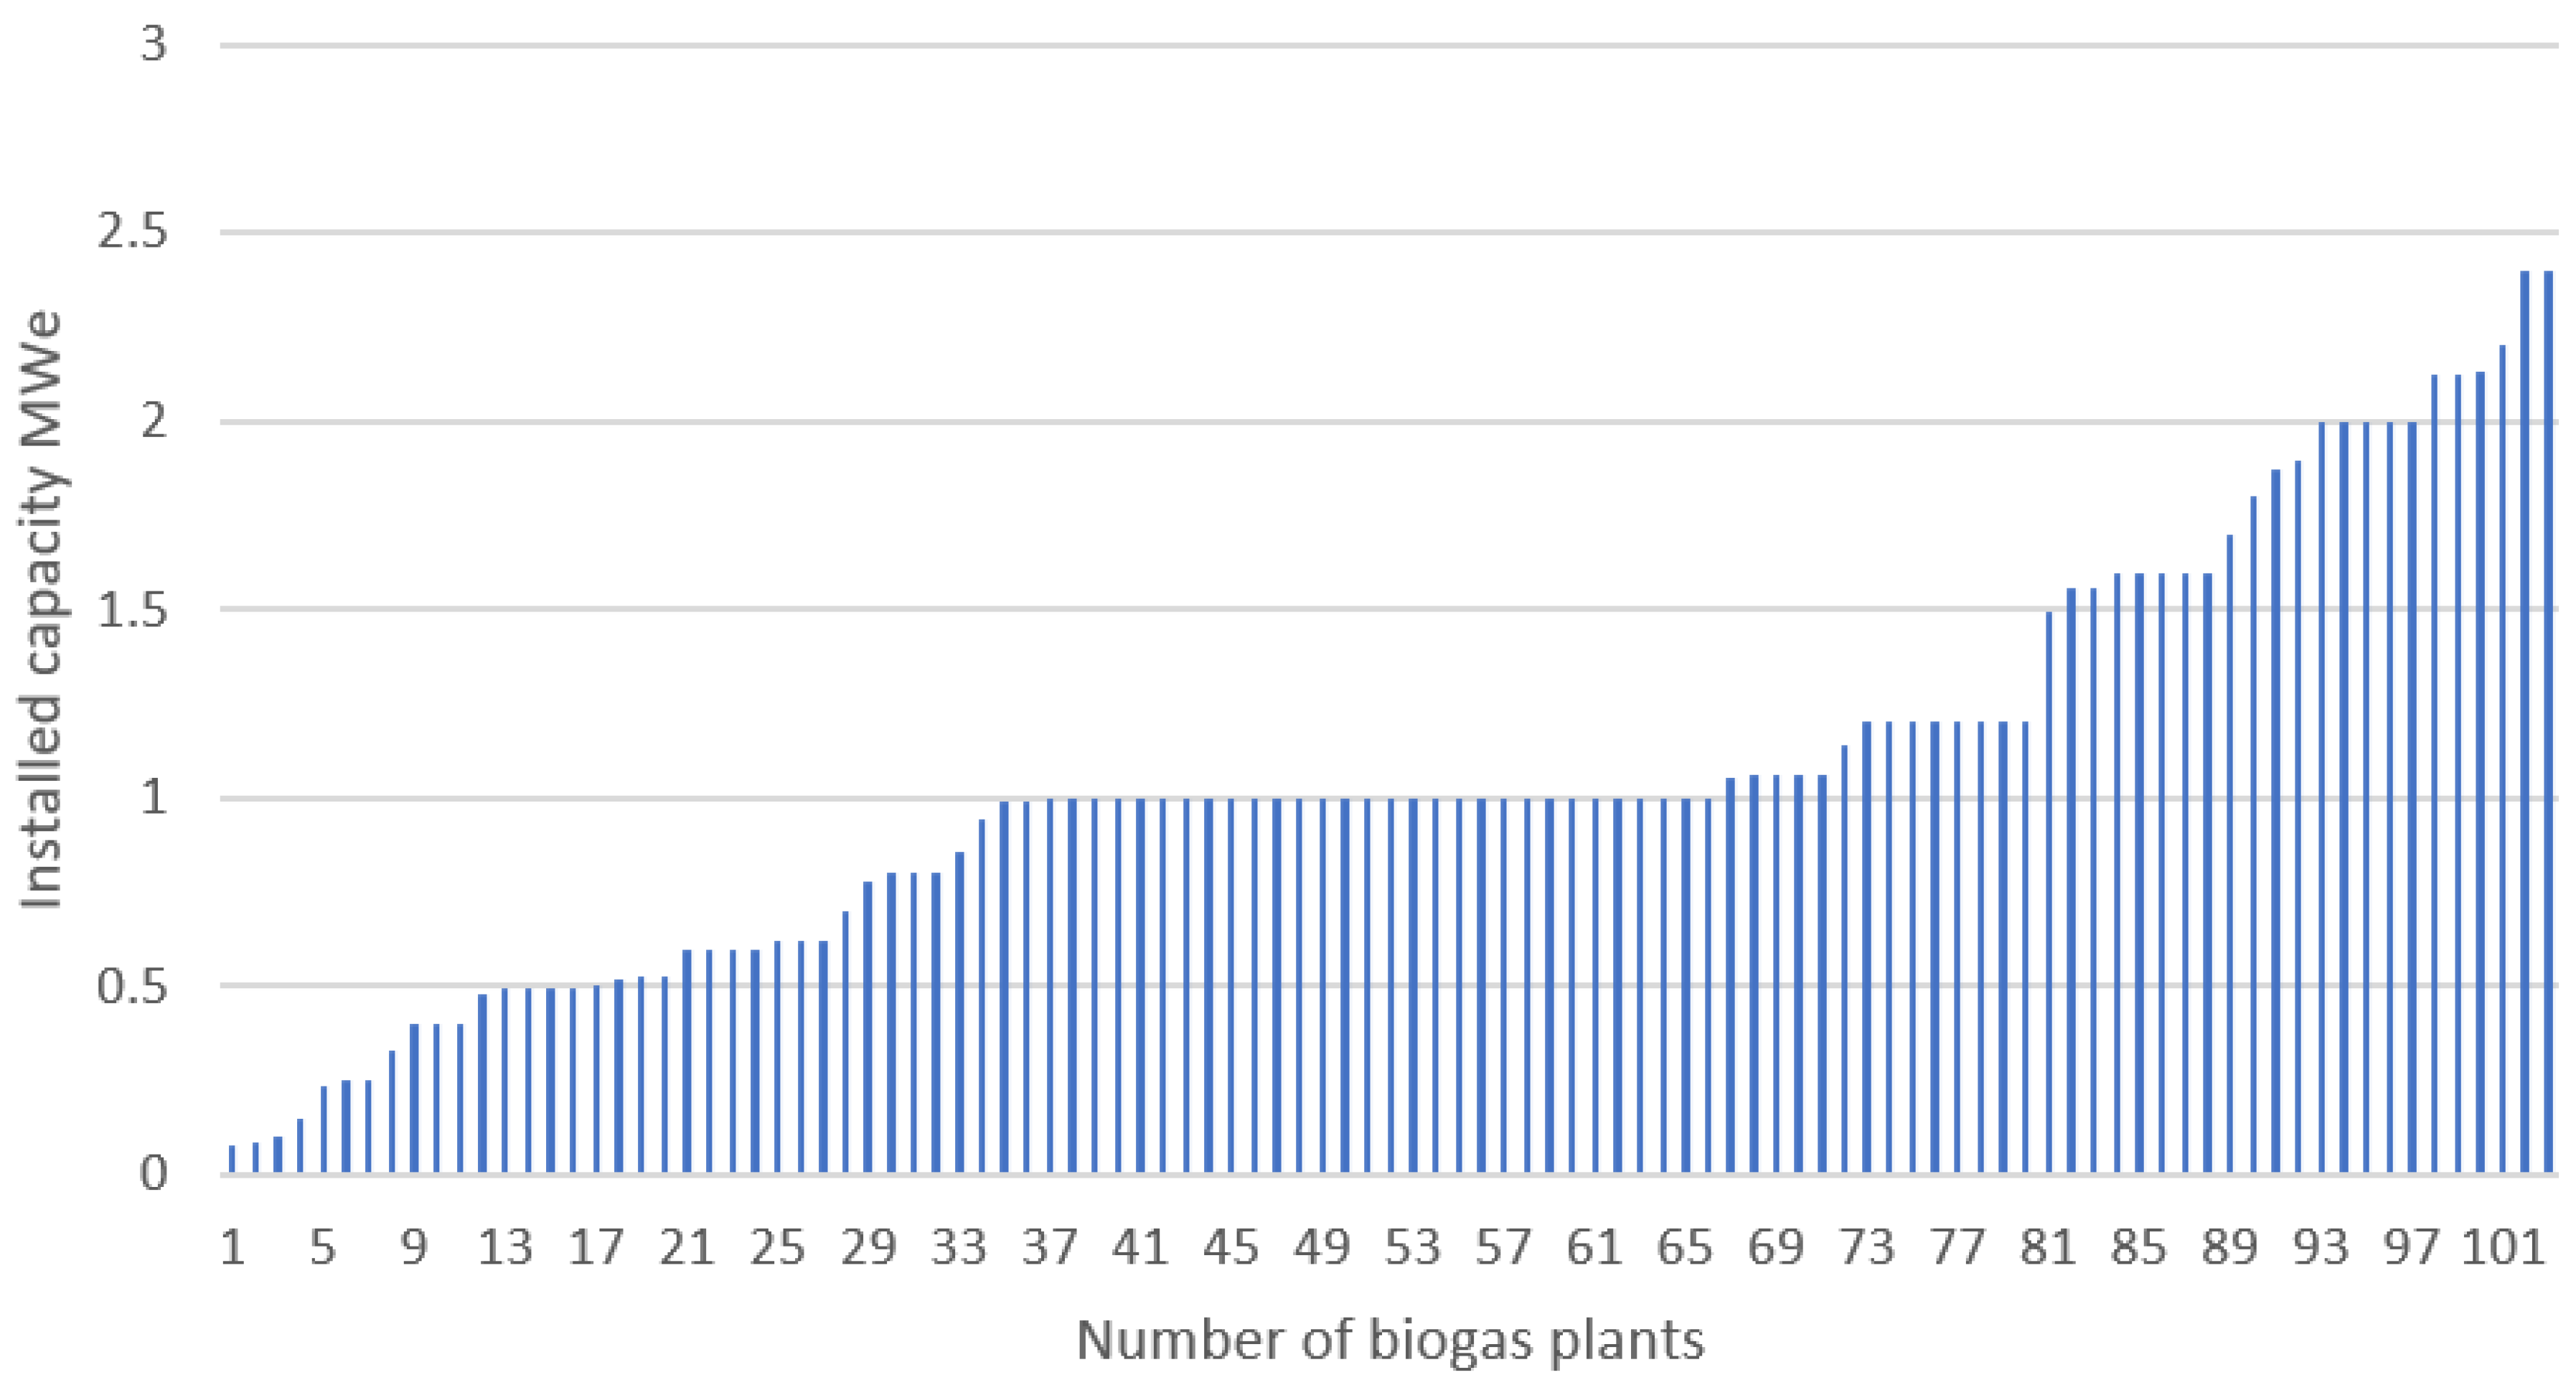
2. The Agricultural Biogas Sector in Poland

The biogas sector is subject to several regulations, of which the most important strategic document setting the policy framework is the Energy Policy of Poland until 2040 (PEP2040) [29], adopted by the Council of Ministers in February 2021. The analysis of the document in terms of adequacy, effectiveness, efficiency, utility, and sustainability and taking into account the framing theory, leads to the conclusion that it provides a solid basis for increasing the renewable energy share in the power industry and that it expands on the current policy of supporting the agricultural biogas sector [30]. Our analysis draws on the methodology proposed in a similar study conducted for Finland [31].
Poland’s new energy deal, intended to address climate change, will be very costly [32]. According to PEP2040, the share of renewable energy sources in the gross final energy consumption in 2030 is expected to reach at least 23%, whereas GHG emissions are to be reduced by ca. 30% (compared to 1990) [33]. The plan also provides for the construction of offshore wind farms with a capacity of approx. 5.9 GW (ca. 11 GW by 2040) and for the commissioning of Poland’s first nuclear power plant in 2033. Detailed provisions emphasise the use of biomass, biogas, and geothermal energy for heating purposes; however, no specific declarations are made regarding their planned share in the total electricity generation. Even though agricultural biogas plants do not have the sufficient potential to replace the energy previously obtained from coal, they can still enhance energy flexibility by becoming part of power clusters. The fully bio-based sectors, such as the food and agriculture sectors, have a higher potential to induce knock-on effects in the economy than the mixed bio-based sectors [34].
The PEP2040 also provides for the increasing of the share of bio-waste in electricity production, which reflects the tenets of a circular economy and meets the present social and economic trends. National targets are formulated in cautious and general terms, which is appropriate for this kind of document. For example, the concept of on-site (distributed) energy generation based on renewable energy sources will be developed in the coming years. To this end, it is necessary to adapt the grid infrastructure and develop the market [33]. The expansion of the gas transmission network, including the construction of biomethane facilities, has already begun. Poland’s gas production is estimated to amount to 92.8 million m3, mostly in densely populated regions, such as Silesia, Lesser Poland, Mazovia, and Greater Poland [20].
According to PEP2040, the biogas sector will be playing an important part in increasing the flexibility of the new system as a means of gas storage, thereby increasing Poland’s energy security:
In order to further increase energy security, it is advisable to expand underground gas storage facilities to a level of min. 4 billion m3 (a 1/3 capacity increase) and increase the current maximum gas offtake capacity from 53.5 million m3/day to min. 60 million m3/day (approx. a 1/6 capacity increase) by winter 2030/2031 [33].
The sustainability analysis of the energy policy, i.e., “the continuity of the effects of a given public programme in the medium and long term” [30] leads to the conclusion that PEP2040 recognises a wide range of technological and social changes to a much greater extent than before, while upholding the national targets. The clearly stated goal to expand the gas pipeline capacity by 2030 (a mix containing about 10% of gases other than natural gas) will make it possible to increase the yield and the use of agricultural biogas. Investments in biogas yield and transmission are expected to contribute to real biogas production growth, which provides an opportunity to achieve a continuity of effects in terms of support for agricultural biogas producers. The new document “The Roadmap for the Development of Poland” targets the technological and social changes concerning Poland’s development possibilities in a more relevant and flexible way [35]. It is supposed to encourage relevant solutions and take advantage of current development trends more effectively than the long-term national development strategy. These directions of change emphasise opportunities inherent in the use of renewable energy sources, which means that the legislation seems to be more relevant and provides greater chances for a more effective pro-development policy in the field of energy transition in Poland.
In 2019, the Renewable Energy Sources Act was amended to include the concept of energy cooperatives in order to decentralise the energy supply system and to better fulfil the needs of local consumers. In this respect, the Ministry of Agriculture designated agricultural biogas plants as versatile energy sources (in that they are capable of producing electricity, heat, and gaseous fuels) capable of adjusting the amount of electricity produced to meet demand on an ongoing basis. The Ministry also considers them one of the main components in planning the activities of the future energy cooperatives, with a view to reducing Poland’s energy dependence on external sources (in 2018, Poland imported 13.8 TWh and, a year later, 17.8 TWh) and improving its air quality. Poland remains one of the largest hard coal producers and the second largest lignite producer in the EU, generating about 80% of its electricity from these fossil fuels [36,37]. According to the World Energy Council, Poland needs to reduce its dependence on energy imported from Russia and on fossil fuels in general [38]. For these reasons, biogas plants should be acknowledged as a significant element of Poland’s energy transition. The typical biogas plant in the Polish system is capable of delivering approx. 1 MW of electric capacity and a similar heat capacity, which justifies the choice of these parameters for our model biogas plant (see Figure 1). At 346 TJ, the total domestic biogas consumption per capita in Poland is more than 10 times lower than in Germany (3830 TJ in 2020). Compared with other Central and Eastern European countries, biogas consumption per capita in Poland is also significantly lower than, e.g., in Latvia, where it amounts to 1768 TJ, or in Slovakia (990 TJ) and even in Hungary (388 TJ). However, it should also be noted that Poland’s total domestic biogas consumption has significantly increased in recent years compared with that of other Eastern European countries and was estimated to total 13,147 TJ in 2020, which puts Poland in third place in Europe (after Germany and the Czech Republic) [39].

3. A Biogas Plant Operation Model

The proposed model for assessing the economic performance of agricultural biogas plants takes into account all the key aspects of their operation, namely investment costs, the electricity sales system, and the estimated amounts of necessary substrates based on the available data. The issue of technology availability has been omitted owing to the existence of specialised biogas plant construction companies. The location and availability of skilled workers are not problematic in Poland, while other social aspects exceed the scope of this paper.

3.1. The National Biogas Electricity Sales Support System

The current electricity sales systems available for agricultural biogas plants take into account whether the production process actually complies with the guidelines applicable to renewable energy sources. Biogas plants built or commissioned after 2016 can use: (a) an auction system or (b) the feed-in tariff (FIT) or the feed-in premium (FIP) systems. Under the auction system, energy is sold at preferential prices for its producers, as provided by the President of the Energy Regulatory Office. The prices are different for each of the participants, and the winners are guaranteed that the energy produced by them will be collected at a fixed rate for a period of several to over a dozen years. However, the most popular solution is currently (b): the feed-in tariff (for small and micro facilities) and the feed-in premium systems, where green energy is sold under contracts with an obligated recipient, which could be a prosumer, an energy cooperative, or an obligated operator. In this system, renewable energy producers may seek to cover the negative balance when selling energy to an unobligated operator by up to 90% of the reference price. This instrument applies to renewable energy sources capable of delivering no less than 500 kWe and no more than 1 MWe and is known as the feed-in premium. This mechanism balances the selling price of energy in the competitive market with the price set under the feed-in tariff scheme. The fixed price in the FIT and FIP tariffs (pursuant to Article 70e paragraph 1 of the Renewable Energy Sources Act) is equivalent to 90% of the reference price set for a given calendar year. The entitlement to have the negative balance covered arises as of the first day on which the produced energy has been fed into the grid and remains valid for 15 years or until 31 December 2035.

3.2. The Cost and Revenue Structure of an Agricultural Biogas Plant

In order to assess the economic performance of a biogas plant and the returns on the investment, the costs and revenues recorded in a given year should be categorised as follows.

3.2.1. Operating Costs

The substrate and material costs depend on the composition of the inputs used in a given biogas plant and as such are usually difficult to calculate. All substrates usually comprise a mix of waste substances and agricultural products, such as, e.g., maize silage, bought at market prices. Waste substrates are often priced based on, among other things, transport costs, and as waste to be disposed of, it can also generate revenue for the plant. The necessary materials used are valued at their actual cost.
  • Costs of on-site energy consumption: estimated at 10% of the amount generated. Electricity can also be purchased at a lower price than the sale price of renewable energy from an external supplier. For the purposes of the analysis, a flat rate of EUR 54 (PLN 240) per 1 MWh was adopted.
  • Taxes and fees: these include property tax on land and buildings, insurance, and third-party liability for outages. After analysing the financial statements of the existing plants, the annual cost was set at EUR 22.5 thousand (PLN 100,000).
  • Payroll: 2–3 employees are needed to supervise the technological process and an extra 2 to perform maintenance duties. The average gross salary of each was assumed to be EUR 1800 (PLN 8000), which adds up to EUR 86.3–108 thousand (PLN 384,000–480,000) per year.
  • External services: these may be considered separately or together with remuneration, depending on the adopted business model. In our model, we assume that the biogas plant takes advantage of some form of outsourcing, and the external services cost EUR 225 thousand (PLN 1,000,000) annually, which is slightly less than what the empirical data suggest.
  • Financial costs: these are closely related to the financial structure of the investment and operating activities (e.g., interest due).
  • Depreciation: annual depreciation rates are set separately for each asset component in accordance with the applicable regulations. On average, for the sake of simplification, the annual depreciation rate was set at 5% for the entire biogas plant.

3.2.2. Sales Revenue

The primary source of revenue is the feed-in tariff system. According to the Ordinance of the Minister of Climate of 24 April 2020, the reference price for the energy produced by a facility with an installed capacity of over 1 Mwe, using agricultural biogas to generate electricity in high-efficiency cogeneration, was EUR 151 (as per the average exchange rate in 2020) (PLN 670) per MWh [40]. Therefore, the fixed FIP tariff was EUR 135.8 (603 PLN), unadjusted for inflation. This mechanism cannot be used for more than 20 years, which is long enough to achieve an adequate rate of return on the investment. Additional sources of revenue may include surplus heat, digestate, and waste disposal services [41]. Other non-core revenues are not considered. It was assumed that the biogas plant will consume on-site approximately 30% of the heat it produces.

3.3. Investment Costs Structure

The main investment costs include the power generating system, complete with digesters and a cogeneration unit (which accounts for approx. 40% of the total investment value), the land purchase and development, the local taxes and fees, the land use permits, and the labour. Optionally, grid adaptation costs may also be considered. According to the available information, the net investment costs of each of the four 1 MWe biogas plants under consideration, which were built in 2019–2020, were as follows: Plant 1–EUR 3355 million (PLN 14,916 million); Plant 2–EUR 3.43 million (PLN 15,253 million); Plant 3–EUR 3.34 million (PLN 14.85 million); and Plant 4–EUR 3.44 million (PLN 15,030 million) [42]. For comparison, the projects co-financed by the European Regional Development Fund estimate the costs at EUR 4 million (PLN 17.8 million) gross, whereas the calculations made for 2016 by the Institute of Renewable Energy give the amount of EUR 3.4–3.6 million (PLN 15–16 million) [18].
In our proposed model, we assumed that the net investment cost was EUR 3.6 million (PLN 16 million) at the average exchange rate [43]. The investment costs should also take into account the purchase of land necessary for the construction of the plant as well as the possible infrastructure development costs. As the calculations made by the Institute of Renewable Energy show, a biogas plant with an installed capacity of 0.86 MWe needs 4 ha of land. This reflects the fact that digestate is stored in lagoons, which cover approx. 2.3 ha [43]. A 1 MWe biogas plant needs a similar area. The land purchase cost was calculated using the average price of 1 ha of arable land in Poland, as reported by Statistics Poland, which in Q2 2020 was EUR 10.8 thousand (PLN 48,096) [37].
According to the information available on the website of the Ministry of Funds and Regional Policy, the average contribution of the Regional Operational Programmes to biogas plant investment was approx. 20–50% in the 2014–2020 perspective. It is assumed that in the upcoming financial perspective of the European Regional Development Fund, this share will be similar; hence, we applied it to our simulated biogas plant operation scenarios. For the purposes of the breakeven analysis, it was assumed that the fixed costs, i.e., those independent of production volume, include depreciation and facility maintenance and necessary repairs, whereas the variable costs include the labour, material, and electricity costs directly related to the energy production. It was assumed that the operating costs constitute a certain proportion of the investment costs. In the available financial statements of Polish biogas plants, this proportion ranges from 40 to 50%.

3.4. Biogas Potential

We used the data on the amount of biogas obtained during digestion (yi, m3) and on the amount of substrates used in the individual biogas plants (xi, tons) to estimate a classic linear regression model with normal errors. The data come from the statements submitted by these plants to the National Agricultural Support Centre. Out of 92 agricultural biogas plants operating in Poland, 41 that use only plant substrates (maize and grass silage, straw, fruit debris, pomace, etc.) and farm by-products (slurry, liquid manure, chicken manure, etc.) were chosen. The digestion process utilises a mix of substrates, often waste products, which means that it is impossible to accurately identify the individual components and thereby apply a more disaggregated model. Admittedly, subsuming all the substrates under a single variable is a simplification; however, it is justified by the uniqueness of the technological process whereby all these components are put together in digesters. The model was estimated using the Ordinary Least Squares method, which leads to the following linear regression:
y ^ i = 640,424 + 62.7 x i
One tonne of aggregated substrates yields an average of 63 m3 of biogas (with a standard error of 6.5). The coefficient of determination R2 = 70% and the parameter estimates are statistically significant at 0.05, which means that the model is highly accurate and reliable. As the model was estimated on the basis of cross-sectional data, it was tested for heteroscedasticity. Both White’s homoscedasticity test and Shapiro–Wilk’s normality test revealed that all the crucial error properties are fulfilled. The linear relationship between the substrates and the biogas yield was also confirmed. The resultant relationship can be directly used to estimate the amount of biogas to be generated as long as the amount of available substrates is known, which is an important part of a fully-fledged economic performance model. These results reflect the actual relationship between the substrates and the gas output rather than laboratory results.
As an alternative, the Cobb–Douglas model was estimated, which shows that a one percent increase in substrate quantity will increase biogas yield by approx. 0.8%. From the microeconomic point of view, this implies diminishing returns to scale; however, it should be noted that the set of production factors was restricted to the substrates. The Cobb–Douglas model fits the data slightly better, with R2 = 80%, and the parameter evaluations are statistically significant at 0.05. The biogas production and feedstock consumption data are cross-sectional; hence, it is crucial to check whether the empirical error distribution is close to normal. For this purpose, a histogram of normalised errors, along with the theoretical density function of standard normal distribution and the P-P plot, are shown in Figure 2. The figure confirms that the properties of the errors in the linear regression model justify its use in the decision-making process. In both cases, it is clear that the empirical distribution of errors is close to normal; hence, the use of this regression model for economic analyses is justified.
The regression can also be used to quantify the relationship between the substrate input and the amount of electricity generated, assuming that all biogas is used to produce it. Estimates were made for 40 observations (as one of the plants uses biogas for other purposes). The coefficient of determination is approx. 67%, and the regression parameter estimates are statistically significant. The model shows that an extra tonne of a typical substrate mix used by biogas plants produces 0.1242 MWh of electric power (standard deviation 0.014). This is slightly less than the approx. 0.15 MWh per tonne of substrates found in the theoretical studies.

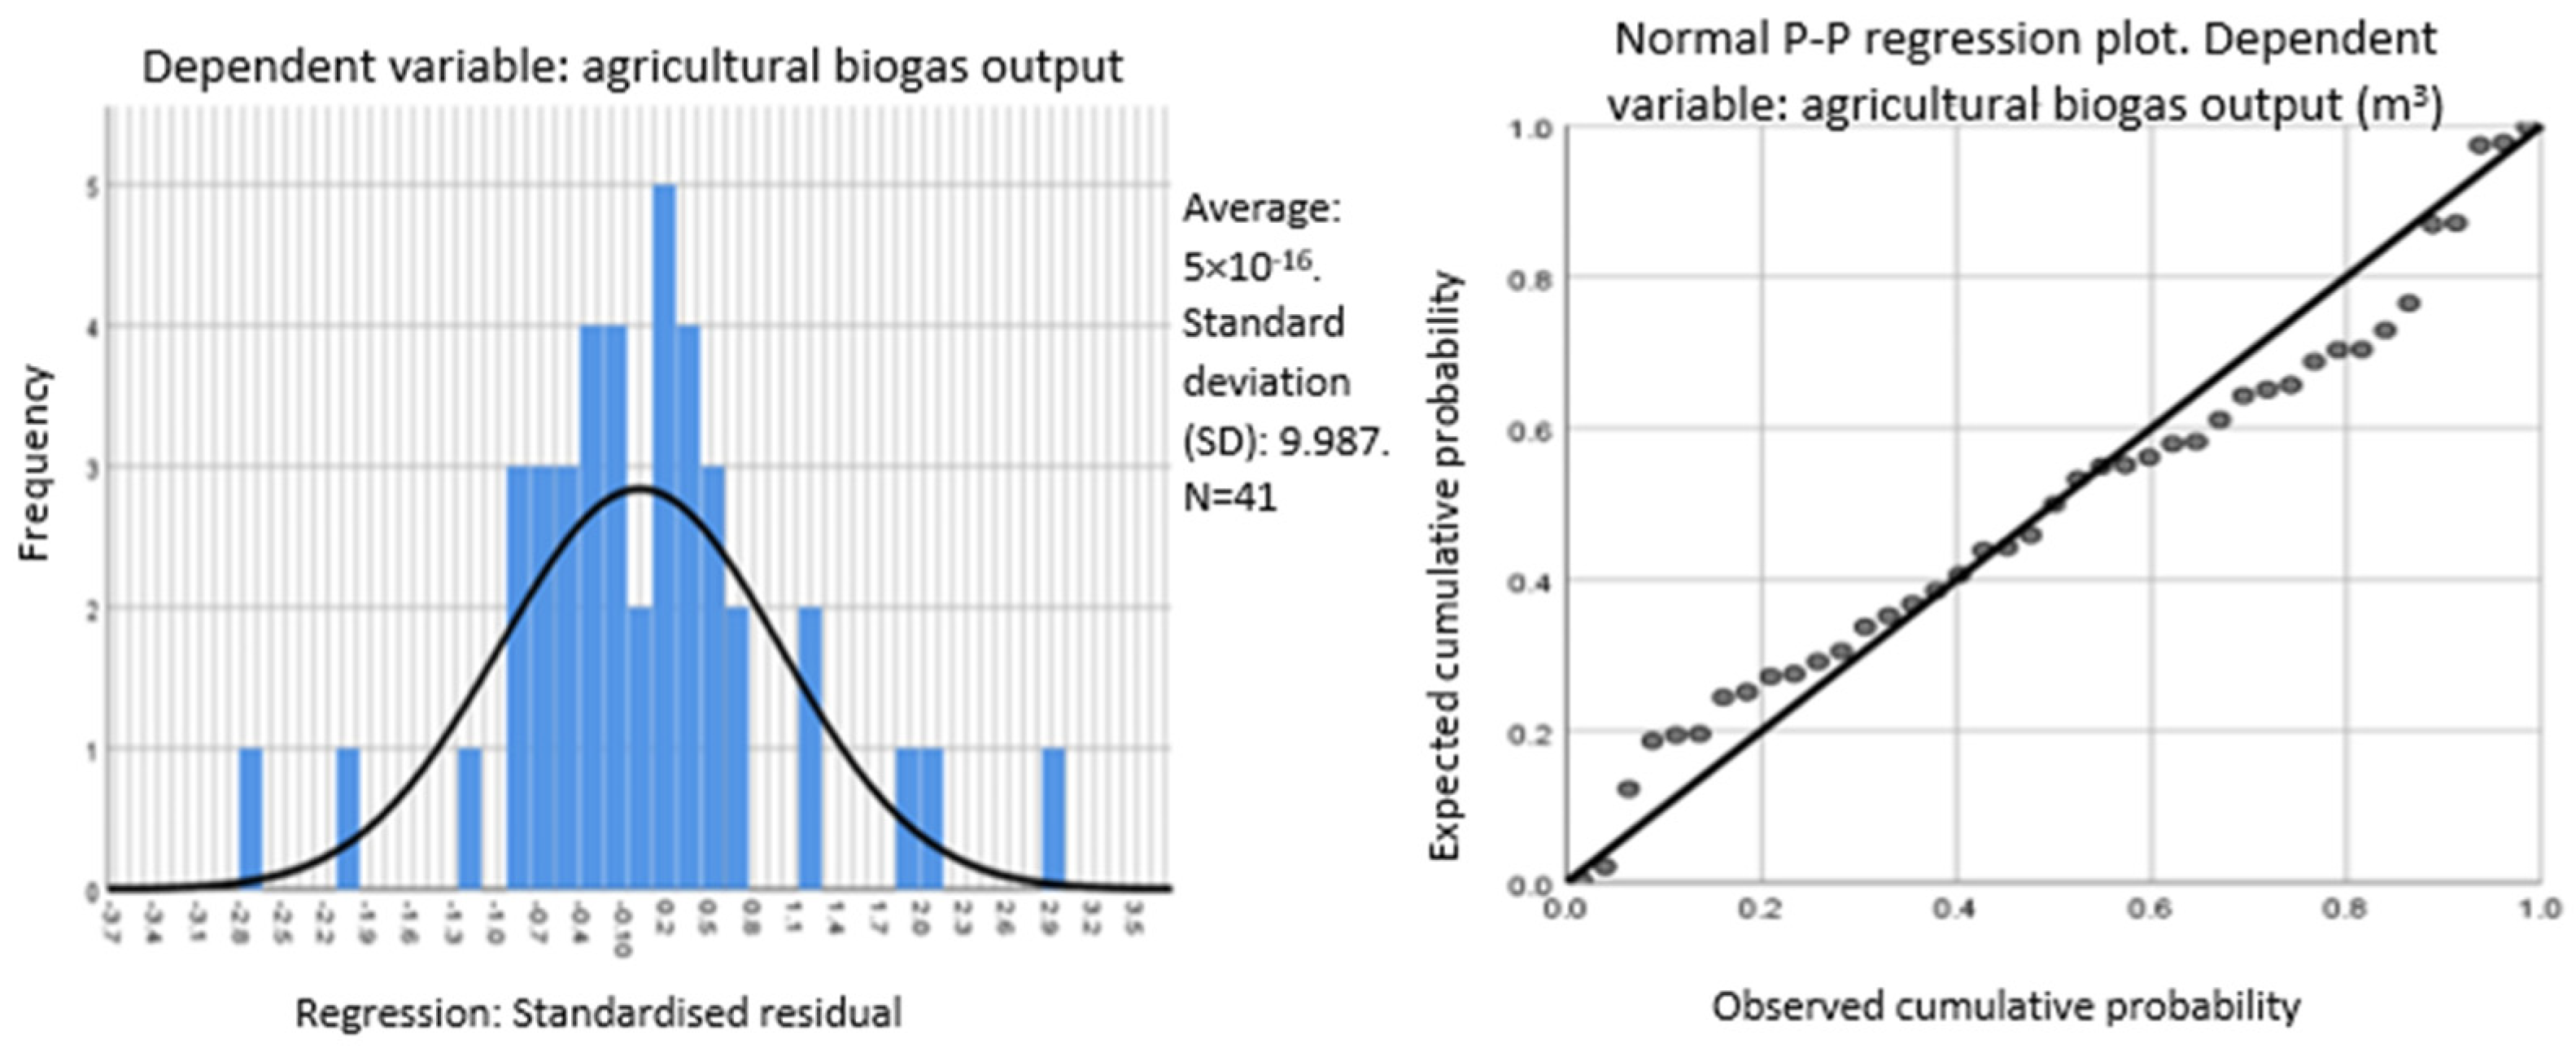
4. The Economic Efficiency Model

The economic viability of an agricultural biogas plant depends on a number of factors, which are discussed in the following groups.
A.
Technical factors and output
The annual electricity output can be calculated using the proposed econometric model if the amount of available substrates is known, or more arbitrarily, assuming that the plant operates at full capacity 24 h per day every day. Thirty days are needed for maintenance/servicing and possible downtime due to breakdowns and are usually subtracted from the annual operating time [44]. For a 1 MWe biogas plant, the annual electricity output is estimated to be approx. 8000–8030 MWh per year. The electrical efficiency of the cogenerator is assumed to be 39%, whereas its thermal efficiency is 40%. According to the literature, the annual production of cogenerated heat averages about 7800 MWh if the plant has an installed capacity of 1 MWe. It is also assumed that the annual on-site energy consumption is approx. 1380 MWh [45]. This leaves 6420 MWh available for sale per year. According to the Energy Regulatory Office, the average price of 1 GJ (0.28 MWh) of heat energy in 2020 was EUR 10 (PLN 46.46). In Poland, however, selling heat can be problematic due to the shortage of distribution networks outside densely populated cities.
B.
Substrate availability
The total cost of the substrates is usually difficult to determine. Substrates, such as maize silage, are usually bought at market prices, whereas the cost of livestock and agrifood waste often depends on transportation and preparation for fermentation. Maize silage is the highest priced substrate (approx. EUR 22-31 (100–140 PLN) per tonne d.m.).
C.
Digestate use and disposal
A 1 MWe agricultural biogas plant produces on average 20,000 tonnes of digestate per year (Siwocha 2015:33), which can be an effective substitute for mineral fertilisers on the surrounding farmland. In this case, it does not represent revenue, but reduces the purchase costs of fertilisers. Three Polish biogas plants currently sell their digestate for the following prices: Plant 1–EUR 1 (PLN 4) per 1000 litres; Plant 2–EUR 0.225 (PLN 1) per tonne (net) or EUR 0.4 (PLN 1.80) per tonne (on condition that it is collected by the purchaser); and Plant 3 sells it at EUR 1.12 (PLN 5) per tonne (including transportation costs).

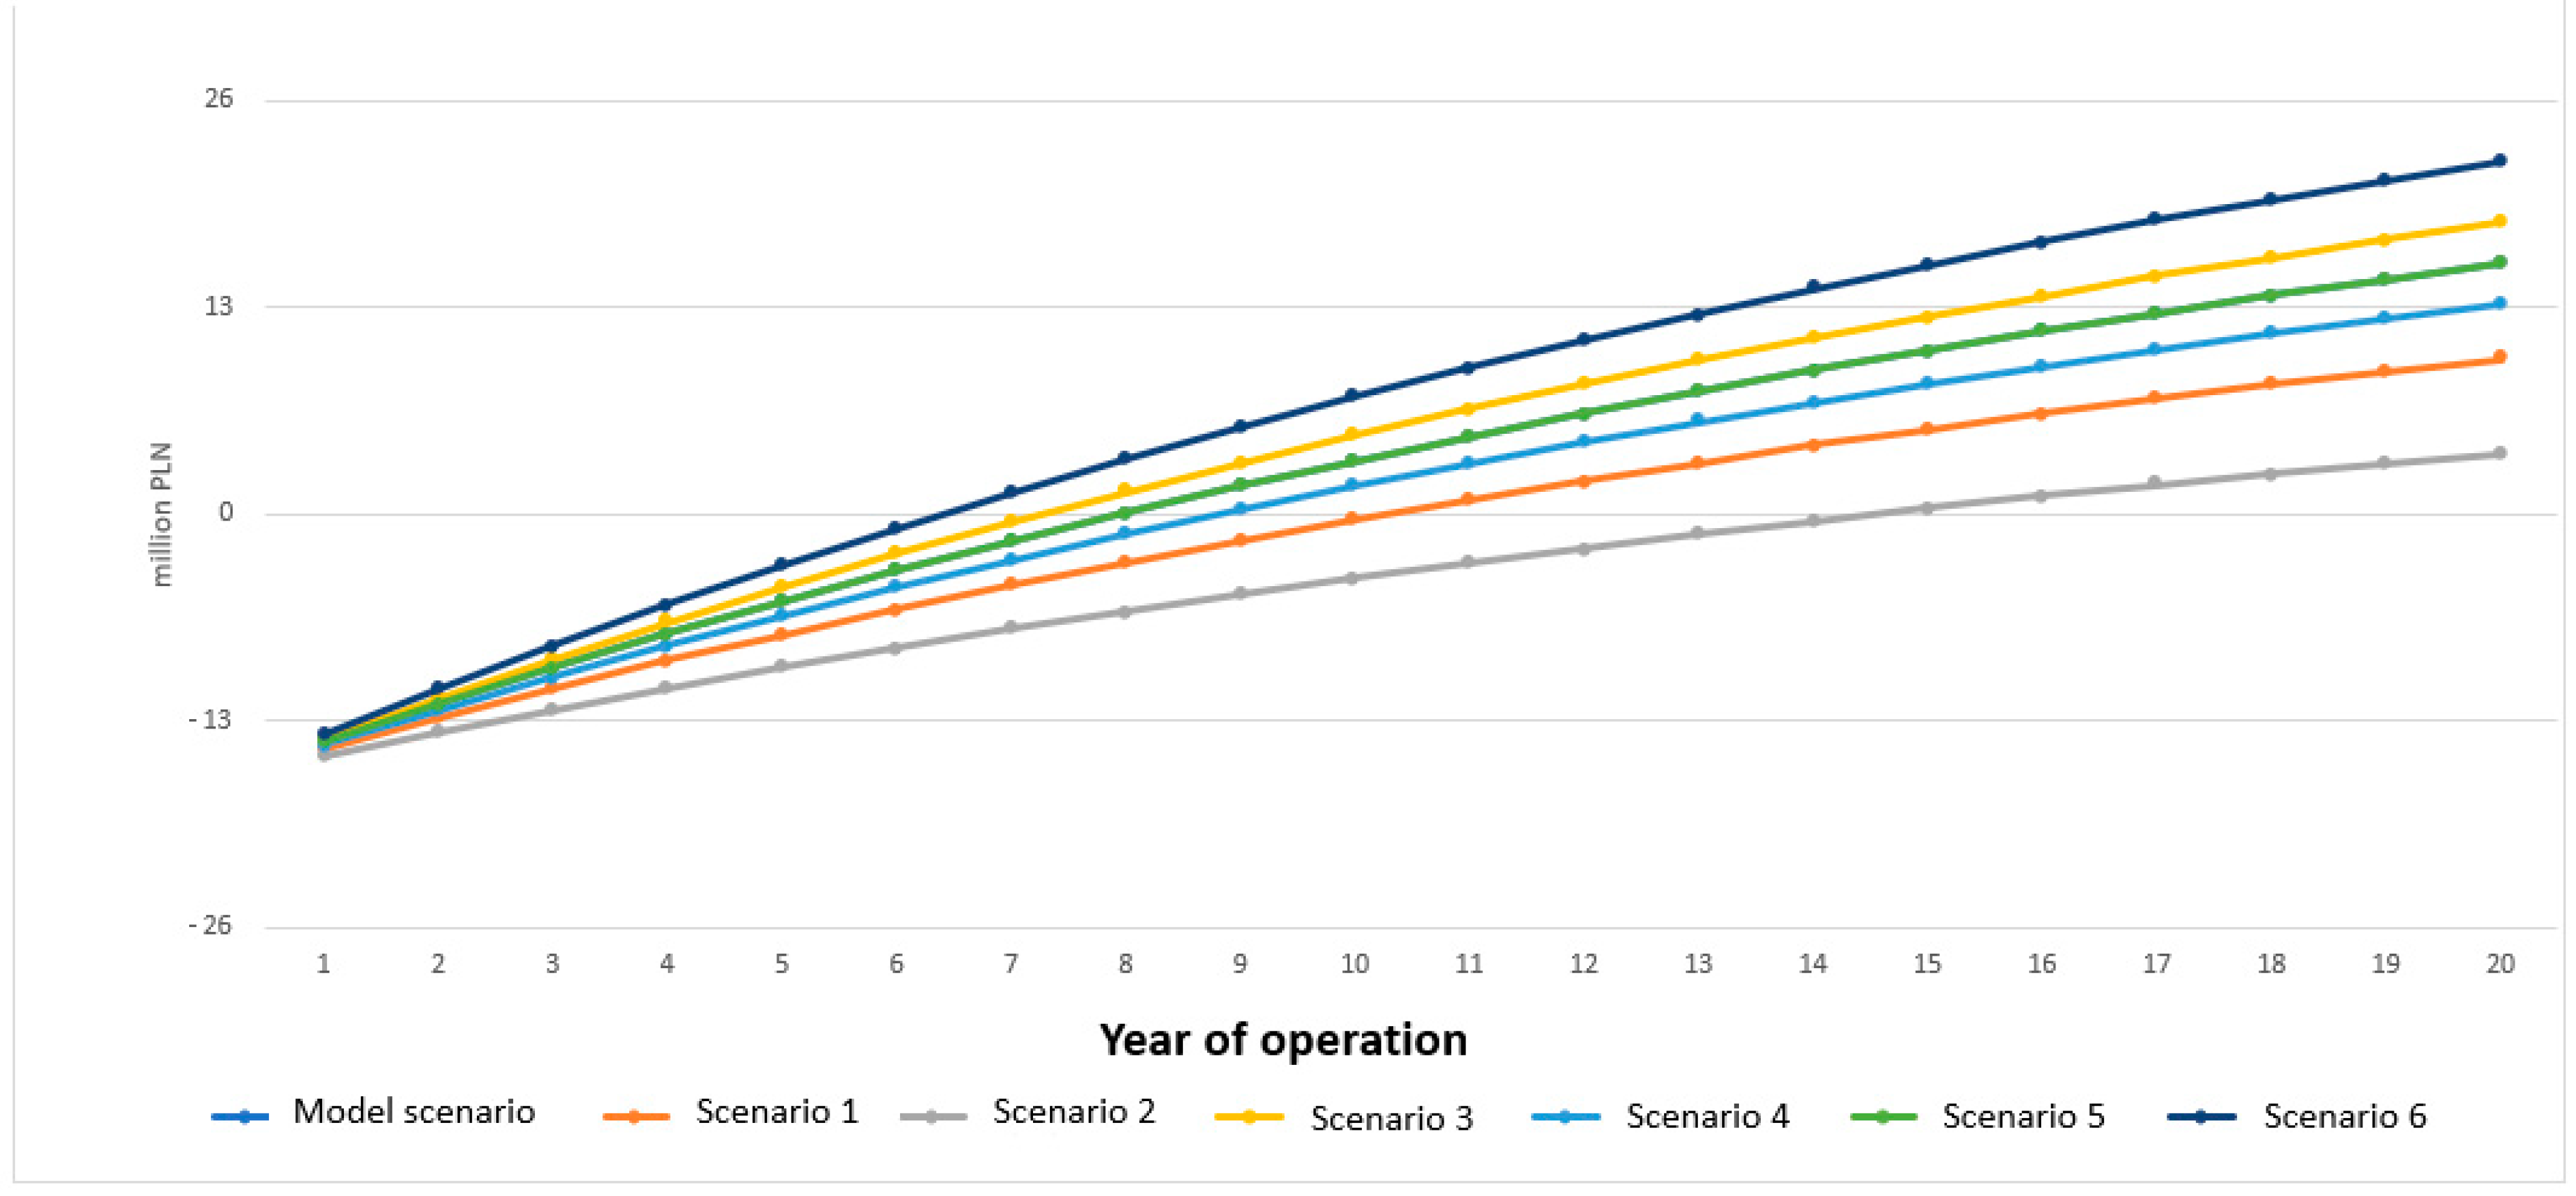
Simulations: Breakeven Analysis

The breakeven analysis was carried out for the following scenarios:
Model scenario. Substrate composition: 80% animal waste, 20% maize silage. Breakeven point: slightly below 5000 MWh (excluding financing costs) and approx. 6000 MWh (including financing costs fixed at 5% of the invested equity), which means that the plant already moves above breakeven in the first year. The difference between the installed output and the critical one is approx. 26% of the planned capacity, which constitutes a considerable security margin. The breakeven point was calculated only for the sale of electricity. Extra revenues from the sale of digestate and waste disposal were not factored in, even though they would improve the financial result. The safety zone was calculated at about 3 GWh, which means that the difference between the assumed output and zero operating profit is positive. The net present value (NPV) was calculated assuming that the plant operates for 20 years, and the discount rate is 5%. The residual value of the investment is not considered at this stage, but it should be borne in mind that the facility may have a longer operating lifetime. It is usually assumed that its replacement value at the end of the period studied is 10–30%, or over EUR 675 thousand in the model scenario. After 20 years of operation, the cumulative cash flow exceeds EUR 3373 million, provided that an investment subsidy has been granted.
Scenario 1. Substrate composition: the proportion of maize silage purchased at market prices increases from 20% to 40%. In this case, the qualitative results do not change: the breakeven point occurs below the planned output level, but the NPV decreases to EUR 2.2 million. Breakeven point: 5830 MWh (excluding profit) or 7232 MWh (including 5% return on investment).
Scenario 2. Substrate composition: the proportion of maize silage increases further from 40% to 60% with a concomitant decrease in the share of livestock waste. In this case, only the breakeven point for operations equal to 7000 MWh occurs below the planned output, whereas the others remain well above the level. The NPV is reduced to EUR 855 thousand. Breakeven point: 7066 MWh (excluding profit) or 8765 MWh (including 5% return on investment).
Scenario 3. Sixty per cent of the investment costs are covered by the subsidy, which has a positive effect on the breakeven point, as does reducing the proportion of maize silage in the substrate composition. Breakeven point: 4962 MWh (excluding profit) or 5331 MWh (including 5% return on investment).
Scenario 4. The entire investment is financed with a bank loan. Despite its high costs, all the breakeven points occur below the expected output. The NPV is approximately EUR 2924 million. Breakeven point: 4962 MWh (excluding profit) or 7569 MWh (including 5% return on investment).
Scenario 5. This differs from the model scenario in that the substrate is now 100% municipal biodegradable waste, and the plant is located close to its main source. A statistical resident of Poland produces ca. 332 kg (2019) of municipal waste annually, of which approx. 40–50% is organic (biodegradable) substances, such as food scraps, which are rarely considered recyclable. However, residents are currently required to dispose of this kind of waste separately to enable it to contribute to biogas production.
At present, this scenario poses a legal problem in that a biogas plant using municipal waste loses its ‘agricultural’ unit status. Nevertheless, it was included in our analysis due to its as yet untapped potential. Econometric models show that a 1 MWe biogas plant with an annual output of 8000 MWh produces 3.4 million m3 of biogas. To that end, it requires approx. 44,000 tonnes of a ‘typical’ substrate mix (biogas) or 53,000 tonnes (electricity), both calculated using the proposed econometric model. For the purpose of basic calculations, we assumed that only 10% of municipal waste can be used as substrate in a biogas plant, which is equivalent to approx. 33 kg of organic matter per person per year (or about 0.1 kg/person/day). Hence, the minimum population size required for a biogas plant to operate in the absence of other substrate sources ranges from 1324 to 1600. Accordingly, there are sound economic reasons to invest in the construction of medium-sized biogas plants, even in small towns. If we assume that a larger proportion of biodegradable waste could be utilised, the population size could be smaller and the investment would still be profitable as the NPV would be approx. EUR 3374 million, assuming that the price of the substrates (mostly organic waste) is set at the minimum level or that of the transportation costs. Moreover, biogas plants located close to municipal waste sources might also benefit from charging waste disposal fees. In this scenario, the breakeven point is reached at 4562 MWh or at 5659 MWh including the expected return of 5% on the investment.
Scenario 6. The same as Scenario 5, but the plant sells 70% of the cogenerated heat to the district heating operator (the remaining 30% is used on site). The plant’s location close to residential areas ensures stable access to biodegradable waste, makes it easier to connect the facility to the heating network, and increases the profitability of the operation and the energy security of the consumers. In this scenario, the NPV rises to over EUR 5 million, which is much more favourable than in Scenario 3, where 60% of the investment was covered by a subsidy (compared to 30% in Scenario 6). The PEP2040 gives priority to energy cogeneration; hence, such a scenario seems relevant, although, as was said before, legally speaking, it does not describe an agricultural biogas plant. Summary of the main scenario-projection data contains Table 1.
As shown in Figure 3, the NPV becomes positive at the earliest in Scenario 6, which stipulates the sale of cogenerated heat. The investment generates a positive cash flow approx. between its sixth and seventh year of operation. From the NPV point of view, the least interesting are Scenarios 1 and 2, where the plant uses market-priced substrates, such as maize silage. On the other hand, the most economically viable scenarios involve local organic waste utilisation.

5. Conclusions

There are currently 100 agricultural biogas plants in Poland, but the total exceeds 300 if plants operating at landfills and sewage treatment facilities are included. These figures are significantly lower than, e.g., in Germany, where the number of such plants is approx. 10,000 (or 45 times more per person). It is no wonder then that Poland produces much less biomethane per person than most developed countries. These data clearly show that biogas plants can deliver much more electricity and heat, especially given Poland’s abundant land resources and improving waste-utilisation possibilities. The present economic context favours biogas plants due to the global pressure to increase the share of renewable sources in electricity production and the rising organic waste disposal costs. The strategy for the development of renewable energy is included in the provisions of the Energy Policy of Poland; the sales support system functions efficiently, the legal framework is in place, and the biogas plants currently becoming operational will be able to benefit from preferential sales regimes until 2035. No mechanisms to support the sale of green energy have been envisaged for the subsequent years. It is worth noting, however, that in the scenarios analysed in this paper, the NPV of biogas plants becomes positive after about 10 years at the latest. Dramatic increases in energy and fossil fuel prices, combined with the instability of natural gas supplies from Russia to European countries, not only make biogas plants more profitable but also more attractive as energy system stabilisers.
The model proposed by the authors makes it possible to choose a range of economic parameters, including the analysis of sensitivity to changes in the sales mechanism, the simulation of various paths of biogas production expansion, and the evaluation of the effectiveness of investment in biogas plants and the revenues from the sale of cogenerated heat. The legal and technical conditions for direct biomethane off-take by gas grid operators are also currently being developed. The model scenario estimates that the breakeven point occurs slightly below 5000 MWh or about 5800 MWh if the financing costs are included. The difference between the assumed output and the critical one is approx. 26%, which constitutes a considerable safety margin. It means that biogas plants breakeven in their first year of operation, both in terms of operating costs and after taking financing costs into account. The amount of substrates needed to produce a given amount of biogas and electricity can be determined using an econometric model developed for the data obtained from 41 Polish agricultural biogas plants. The calculations performed using the reported data show that one extra tonne of input (expressed in tonnes of a typical substrate mix) generates an extra 63 m3 of gas or 0.1242 MWh of electric energy. These results may differ from the laboratory ones as they refer to values obtained during the actual operation of a biogas plant under specific environmental conditions.
Apart from the model scenario, the breakeven points were also calculated for other scenarios differing in substrate composition and the amount of subsidy received vs. a bank loan. In almost all the cases, investing in a biogas plant turns out to be profitable even if a 5% profit is assumed (in the latter case, the project becomes unprofitable only when the proportion of market-priced maize silage in substrate composition exceeds 60%). The last scenario analyses a biogas plant located close to a town with a population of approximately 2000, which uses organic municipal waste and sells the generated electricity and heat to local residents. This scenario is the most profitable as the investment already starts generating a positive cash flow after approx. 6 years, which makes it the most interesting of all the cases studied. Currently, about 40% of households in Poland have access to district heating, especially in densely populated cities, but thanks to the new legal framework for the biogas sector and energy cluster pilot schemes, consumers will be more actively involved in electricity generation. The biogas plant economic performance estimation presented in this paper may constitute part of a larger energy cluster model by providing tools for analyses involving a range of economic and technical factors. The capacity to build and evaluate the economic performance of energy clusters is an issue to be addressed by further research.
The expansion of the biogas system, accompanied by geographically dispersed economic growth as a substitute for the transfer of resources to imported fuels, also contributes to national energy security. The investment incentives for new biogas plants mean that the economic and social gains, including the creation of dispersed and stable jobs, the health benefits of reducing low emissions from coal combustion, and combating climate change far outweigh the disadvantages. However, even without taking into account these non-neutral externalities, in purely economic terms the study discussed here shows that investing in biogas plants in Poland is profitable.
The present study has shown that agricultural biogas plants can become a significant component of Poland’s new energy deal, provided that a favourable electricity sales system is maintained, the transmission and sale of cogenerated heat is expanded, and the new facilities are located in places with easier access to substrates, including all kinds of usable waste. Moreover, an analysis of the socio-economic environment suggests that it is necessary to standardise regulations and create long-term support mechanisms for the sale of energy generated from agricultural biogas to encourage potential investors. Finally, in order to make Poland’s biogas system more effective, it is recommended to increase the use of thermal energy in biogas production. Based on consultations with representatives of this sector, efforts should be made to better adjust the regulations and support systems to their needs. Locating agricultural biogas plants in energy cluster systems should be promoted to a greater extent as a way of ensuring energy flexibility in the event of shortages of wind or solar power.

Author Contributions

Conceptualization, Ł.M., M.M.-B. and R.W.-R.; methodology, R.W.-R.; software, R.W.-R.; formal analysis, Ł.M., M.M.-B. and R.W.-R.; investigation, Ł.M., M.M.-B. and R.W.-R.; writing—original draft preparation, Ł.M., M.M.-B. and R.W.-R.; project administration, Ł.M. All authors have read and agreed to the published version of the manuscript.

Funding

This project has been financed by the Minister of Education and Science within the “Regional Initiative of Excellence” Programme for 2019–2022. Project no.: 021/RID/2018/19. Total financing: 11 897 131,40 PLN.

Data Availability Statement

Conflicts of Interest

The authors declare no conflict of interest.

References

  1. Herran, D.S.; Tachiiri, K.; Matsumoto, K. Global energy system transformations in mitigation scenarios considering climate uncertainties. Appl. Energy 2019, 243, 119–131. [Google Scholar] [CrossRef]
  2. EIA. International Energy Outlook 2019; The U.S. Energy Information Administration: Washington, DC, USA, 2019.
  3. Rozakis, S.; Bartoli, A.; Dach, J.; Jędrejek, A.; Kowalczyk-Juśko, A.; Mamica, Ł.; Pochwatka, P.; Pudelko, R.; Shu, K. Policy Impact on Regional Biogas Using a Modular Modeling Tool. Energies 2021, 14, 3738. [Google Scholar] [CrossRef]
  4. Claeys, G.; Tagliapietra, S.; Zachmann, G. How to make the European Green Deal work. Bruegel Policy Contrib. 2019, 13, 17. [Google Scholar]
  5. Cegielska, K.; Noszczyk, T.; Kukulska, A.; Szylar, M.; Hernik, J.; Dixon-Gough, R.; Jombach, S.; Valánszki, I.; Kovács, K.F. Land use and land cover changes in post-socialist countries: Some observations from Hungary and Poland. Land Use Policy 2018, 78, 1–18. [Google Scholar] [CrossRef]
  6. Kampas, A.; Rozakis, S.; Faber, A.; Mamica, Ł. Assessing the Green Growth Trajectory through Resource and Impact Decoupling Indices: The Case of Poland. Polish J. Environ. Stud. 2021, 30, 2573–2587. [Google Scholar] [CrossRef]
  7. Pirelli, T.; Chiumenti, A.; Morese, M.M.; Bonati, G.; Fabiani, S.; Pulighe, G. Environmental sustainability of the biogas pathway in Italy through the methodology of the Global Bioenergy Partnership. J. Clean. Prod. 2021, 318, 128483. [Google Scholar] [CrossRef]
  8. Li, Y.; Zhang, H.; Kang, Y. Will Poland fulfill its coal commitment by 2030? An answer based on a novel time series prediction method. Energy Rep. 2020, 6, 1760–1767. [Google Scholar] [CrossRef]
  9. Yaqoob, H.; Teoh, Y.H.; Din, Z.U.; Sabah, N.U.; Jamil, M.A.; Mujtaba, M.; Abid, A. The potential of sustainable biogas production from biomass waste for power generation in Pakistan. J. Clean. Prod. 2021, 307, 127250. [Google Scholar] [CrossRef]
  10. Dobslaw, D.; Engesser, K.-H.; Störk, H.; Gerl, T. Low-cost process for emission abatement of biogas internal combustion engines. J. Clean. Prod. 2019, 227, 1079–1092. [Google Scholar] [CrossRef]
  11. Czekała, W. Biogas as a Sustainable and Renewable Energy Source. In Clean Fuels for Mobility; Di Blasio, G., Agarwal, A.K., Belgiorno, G., Shukla, P.C., Eds.; Springer: Singapore, 2022; pp. 201–214. [Google Scholar]
  12. Pilarski, G.; Kyncl, M.; Stegenta, S.; Piechota, G. Emission of Biogas from Sewage Sludge in Psychrophilic Conditions. Waste Biomass-Valorization 2019, 11, 3579–3592. [Google Scholar] [CrossRef]
  13. Igliński, B.; Kiełkowska, U.; Piechota, G.; Skrzatek, M.; Cichosz, M.; Iwański, P. Can energy self-sufficiency be achieved? Case study of Warmińsko-Mazurskie Voivodeship (Poland). Clean Technol. Environ. Policy 2021, 23, 2061–2081. [Google Scholar] [CrossRef]
  14. Igliński, B.; Buczkowski, R.; Iglińska, A.; Cichosz, M.; Piechota, G.; Kujawski, W. Agricultural biogas plants in Poland: Investment process, economical and environmental aspects, biogas potential. Renew. Sustain. Energy Rev. 2012, 16, 4890–4900. [Google Scholar] [CrossRef]
  15. Budzianowski, W.M. Sustainable biogas energy in Poland: Prospects and challenges. Renew. Sustain. Energy Rev. 2012, 16, 342–349. [Google Scholar] [CrossRef]
  16. Chodkowska-Miszczuk, J.; Szymańska, D. Agricultural biogas plants—A chance for diversification of agriculture in Poland. Renew. Sustain. Energy Rev. 2013, 20, 514–518. [Google Scholar] [CrossRef]
  17. Szymańska, D.; Chodkowska-Miszczuk, J. Endogenous resources utilization of rural areas in shaping sustainable development in Poland. Renew. Sustain. Energy Rev. 2011, 15, 1497–1501. [Google Scholar] [CrossRef]
  18. Przesmycka, A.; Podstawska, M. Ekonomiczna efektywność inwestycji w biogazownie rolnicze (Economic efficiency of investments in agricultural biogas plants). Rocz. Nauk. Stowarzyszenia Ekon. Rol. I Agrobiz. 2016, XVIII, 176–182. [Google Scholar]
  19. Kowalczyk-Juśko, A.; Listosz, A.; Flisiak, M. Spatial and social conditions for the location of agricultural biogas plants in Poland (case study). E3S Web Conf. 2019, 86, 00036. [Google Scholar] [CrossRef] [Green Version]
  20. Piechota, G.; Igliński, B. Biomethane in Poland—Current Status, Potential, Perspective and Development. Energies 2021, 14, 1517. Available online: https://www.mdpi.com/1996-1073/14/6/1517/htm#B1-energies-14-01517 (accessed on 20 December 2021). [CrossRef]
  21. Rzeznik, W.; Mielcarek, P. Agricultural biogas plants in Poland. In Proceedings of the 17th International Scientific Conference Engineering for Rural Development, Jelgava, Latvia, 23–25 May 2018; pp. 1760–1765. [Google Scholar]
  22. Koryś, K.A.; Latawiec, A.E.; Grotkiewicz, K.; Kuboń, M. The Review of Biomass Potential for Agricultural Biogas Production in Poland. Sustainability 2019, 11, 6515. [Google Scholar] [CrossRef] [Green Version]
  23. Dandikas, V.; Heuwinkel, H.; Lichti, F.; Drewes, J.E.; Koch, K. Predicting methane yield by linear regression models: A validation study for grassland biomass. Bioresour. Technol. 2018, 265, 372–379. [Google Scholar] [CrossRef]
  24. Zabolotnyy, S.; Melnyk, M. The Financial Efficiency of Biogas Stations in Poland. In Renewable Energy Sources: Engineering, Technology, Innovation: ICORES 2017; Werle, S., Mudryk, K., Eds.; Springer Proceedings in Energy; Springer: Cham, Germany, 2018; pp. 83–93. [Google Scholar]
  25. Igliński, B.; Piechota, G.; Iwański, P.; Skarzatek, M.; Pilarski, G. 15 Years of the Polish agricultural biogas plants: Their history, current status, biogas potential and perspectives. Clean Technol. Environ. Policy 2020, 22, 281–307. [Google Scholar] [CrossRef]
  26. Sławiński, K.; Piskier, T.; Bujaczek, R. Ocena przydatności kalkulatorów biogazowni przy planowaniu budowy biogazowni rolniczej (Assessment of the usefulness of biogas calculators in planning the construction of an agricultural biogas plant). Inżynieria Rolnicza 2012, 4, 369–375. [Google Scholar]
  27. Chomczyńska, M.; Pawłowska, M.; Szczepaniak, O.; Duma, E. Biogas Generation from Maize and Cocksfoot Growing in Degraded Soil Enriched with New Zeolite Substrate. Energies 2022, 15, 377. [Google Scholar] [CrossRef]
  28. Szymańska, D.; Lewandowska, A. Biogas Power Plants in Poland—Structure, Capacity, and Spatial Distribution. Sustainability 2015, 7, 16801–16819. [Google Scholar] [CrossRef] [Green Version]
  29. Polish Council of Ministers. Energy Policy of Poland Until 2040/ 2021. Available online: https://webcache.googleusercontent.com/search?q=cache:mhkuiUHjbAMJ:https://www.gov.pl/attachment/62a054de-0a3d-444d-a969-90a89502df94+&cd=4&hl=pl&ct=clnk&gl=pl (accessed on 20 December 2021).
  30. Olejniczak, K. Monitoring i ewaluacja. Zarządzanie strategiczne rozwojem. In Monitoring i ewaluacja. we współpracy z Karol Olejniczak; Ministerstwo Rozwoju Regionalnego: Warsaw, Poland, 2012. [Google Scholar]
  31. Winquist, E.; Rikkonen, P.; Pyysiäinen, J.; Varho, V. Is biogas an energy or a sustainability product?-Business opportunities in the Finnish biogas branch. J. Clean. Prod. 2019, 233, 1344–1354. [Google Scholar] [CrossRef]
  32. Wiśniewski, G.; Curkowski, A.; Pejas, B. Scenariusz Średnich Kosztów Energii Elektrycznej do Roku 2050 Oraz Cen W Taryfach Za Energię Elektryczną Dla Wybranych Grup Odbiorców Do Roku 2030 (Scenario of Average Costs of Electricity until 2050 and Prices in Electricity Tariffs for Selected Groups of Consumers until 2030). Energetyka–Społeczeństwo–Polityka 2017, 6, 53–80. Available online: https://www.ceeol.com/search/article-detail?id=731496 (accessed on 17 December 2021).
  33. Energy Policy of Poland until 2040: Warsaw; Ministry of Climate and Environment: Warsaw, Poland, 2021.
  34. Loizou, E.; Jurga, P.; Rozakis, S.; Faber, A. Assessing the Potentials of Bioeconomy Sectors in Poland Employing Input-Output Modeling. Sustainability 2019, 11, 594. [Google Scholar] [CrossRef] [Green Version]
  35. Sejm, R.P. Nowelizacja Ustawy o Zasadach Prowadzenia Polityki Rozwoju (Amendment of the Act on the Principles of Development Policy), Ustawa Dz.U. 2021 poz. 1057. 2021. Available online: http://www.glogow.pl/investin_en/index.php/biezace-wydarzenia-ciekawostki/155-the-amendment-to-the-act-on-the-principles-of-development-policy-is-waiting-for-the-president-s-signature (accessed on 17 December 2021).
  36. Brauers, H.; Oei, P.-Y. The political economy of coal in Poland: Drivers and barriers for a shift away from fossil fuels. Energy Policy 2020, 144, 111621. [Google Scholar] [CrossRef]
  37. GUS-Bank Danych Lokalnych. Cena Zakupu/Sprzedaży Użytków Rolnych Za 1 Ha w Obrocie Prywatnym (Purchase/Sale Price of Agricultural Land Per 1 Ha in Private Trade: Quarterly Data): Dane Kwartalne. Available online: https://bdl.stat.gov.pl/BDL/dane/podgrup/temat (accessed on 20 December 2021).
  38. World Energy Council. Poland. Available online: https://www.worldenergy.org/impact-communities/members/entry/poland (accessed on 20 December 2021).
  39. Eurostat. Supply, Transformation and Consumption of Renewables and Wastes. 2021. Available online: https://data.europa.eu/data/datasets/g1jpiyeuj4xmijqu6eq?locale=en (accessed on 20 December 2021).
  40. Ministerstwo Klimatu. Rozporządzenie Ministra Klimatu Z Dnia 24 Czerwca 2020 R. W Sprawie Zawartości Biokomponentów Powstałych W Wyniku Współuwodornienia (Regulation of the Minister of Climate of 24 June 2020 on the Content of Biocomponents Resulting from Co-Hydrogenation). Available online: https://isap.sejm.gov.pl/isap.nsf/DocDetails.xsp?id=WDU20200001141 (accessed on 29 January 2021).
  41. Muradin, M.; Foltynowicz, Z. Potential for Producing Biogas from Agricultural Waste in Rural Plants in Poland. Sustainability 2014, 6, 5065–5074. [Google Scholar] [CrossRef] [Green Version]
  42. GRAMwZIELONE.pl. MDI Z Umowami Na Budowę Biogazowni Na Niemal 30 mln zł (MDI with Contracts for the Construction of a Biogas Plant for Almost PLN 30 Million). Available online: https://www.gramwzielone.pl/bioenergia/102062/mdi-z-umowami-na-budowe-biogazowni-za-niemal-30-mln-zl (accessed on 29 January 2021).
  43. Przykłady Obliczeniowe Biogaz Inwest (Calculation Examples Biogaz Inwest. IEO Institute of Renewable Energy); IEO: Warsaw, Poland, 2020.
  44. Zapałkowska, A.; Gacek, T. Ekonomiczne aspekty pozyskiwania i wykorzystywania biogazu (Economic aspects of obtaining and using biogas). Pol. J. Sustain. Dev. 2019, 23. [Google Scholar]
  45. Kajdan, T. Ciepło Z Biogazu W Lokalnych Instalacjach Suszarniczych (Heat from Biogas in Local Drying Installations). Magazyn Biomasa. 2016. Available online: https://magazynbiomasa.pl/cieplo-z-biogazowni/ (accessed on 15 December 2021).
Figure 1. Number of agricultural biogas plants in Poland by installed capacity (MWe). Source: own study based on the Register of Agricultural Biogas Producers, KOWR, December 2020.
Sustainability 14 01614 g001
Figure 2. Analysis of error properties from the linear model. Source: own study.
Sustainability 14 01614 g002
Figure 3. NPV of a biogas plant depending on financing structure and substrate composition. Source: own study.
Sustainability 14 01614 g003
Table 1. Summary of the main scenario-projection data.
Animal Waste/Maize SilageInvestment FundingSale of HeatBreakeven Point MWhNPV (EUR Thousand)
Model scenario80%/20%100% own capitalNo49623373
Scenario 160%/40%100% own capitalNo58302200
Scenario 240%/60%100% own capitalNo7066855
Scenario 380%/20%60% subsidyNo49624152
Scenario 480%/20%100% bank creditNo49622924
Scenario 5100% waste100% own capitalNo45623374
Scenario 6100% waste100% own capitalYes45623396
Source: own study.
Publisher’s Note: MDPI stays neutral with regard to jurisdictional claims in published maps and institutional affiliations.

