
Flood Hazard and Risk Zonation in North Bihar Using Satellite-Derived Historical Flood Events and Socio-Economic Data


Abstract
:1. Introduction
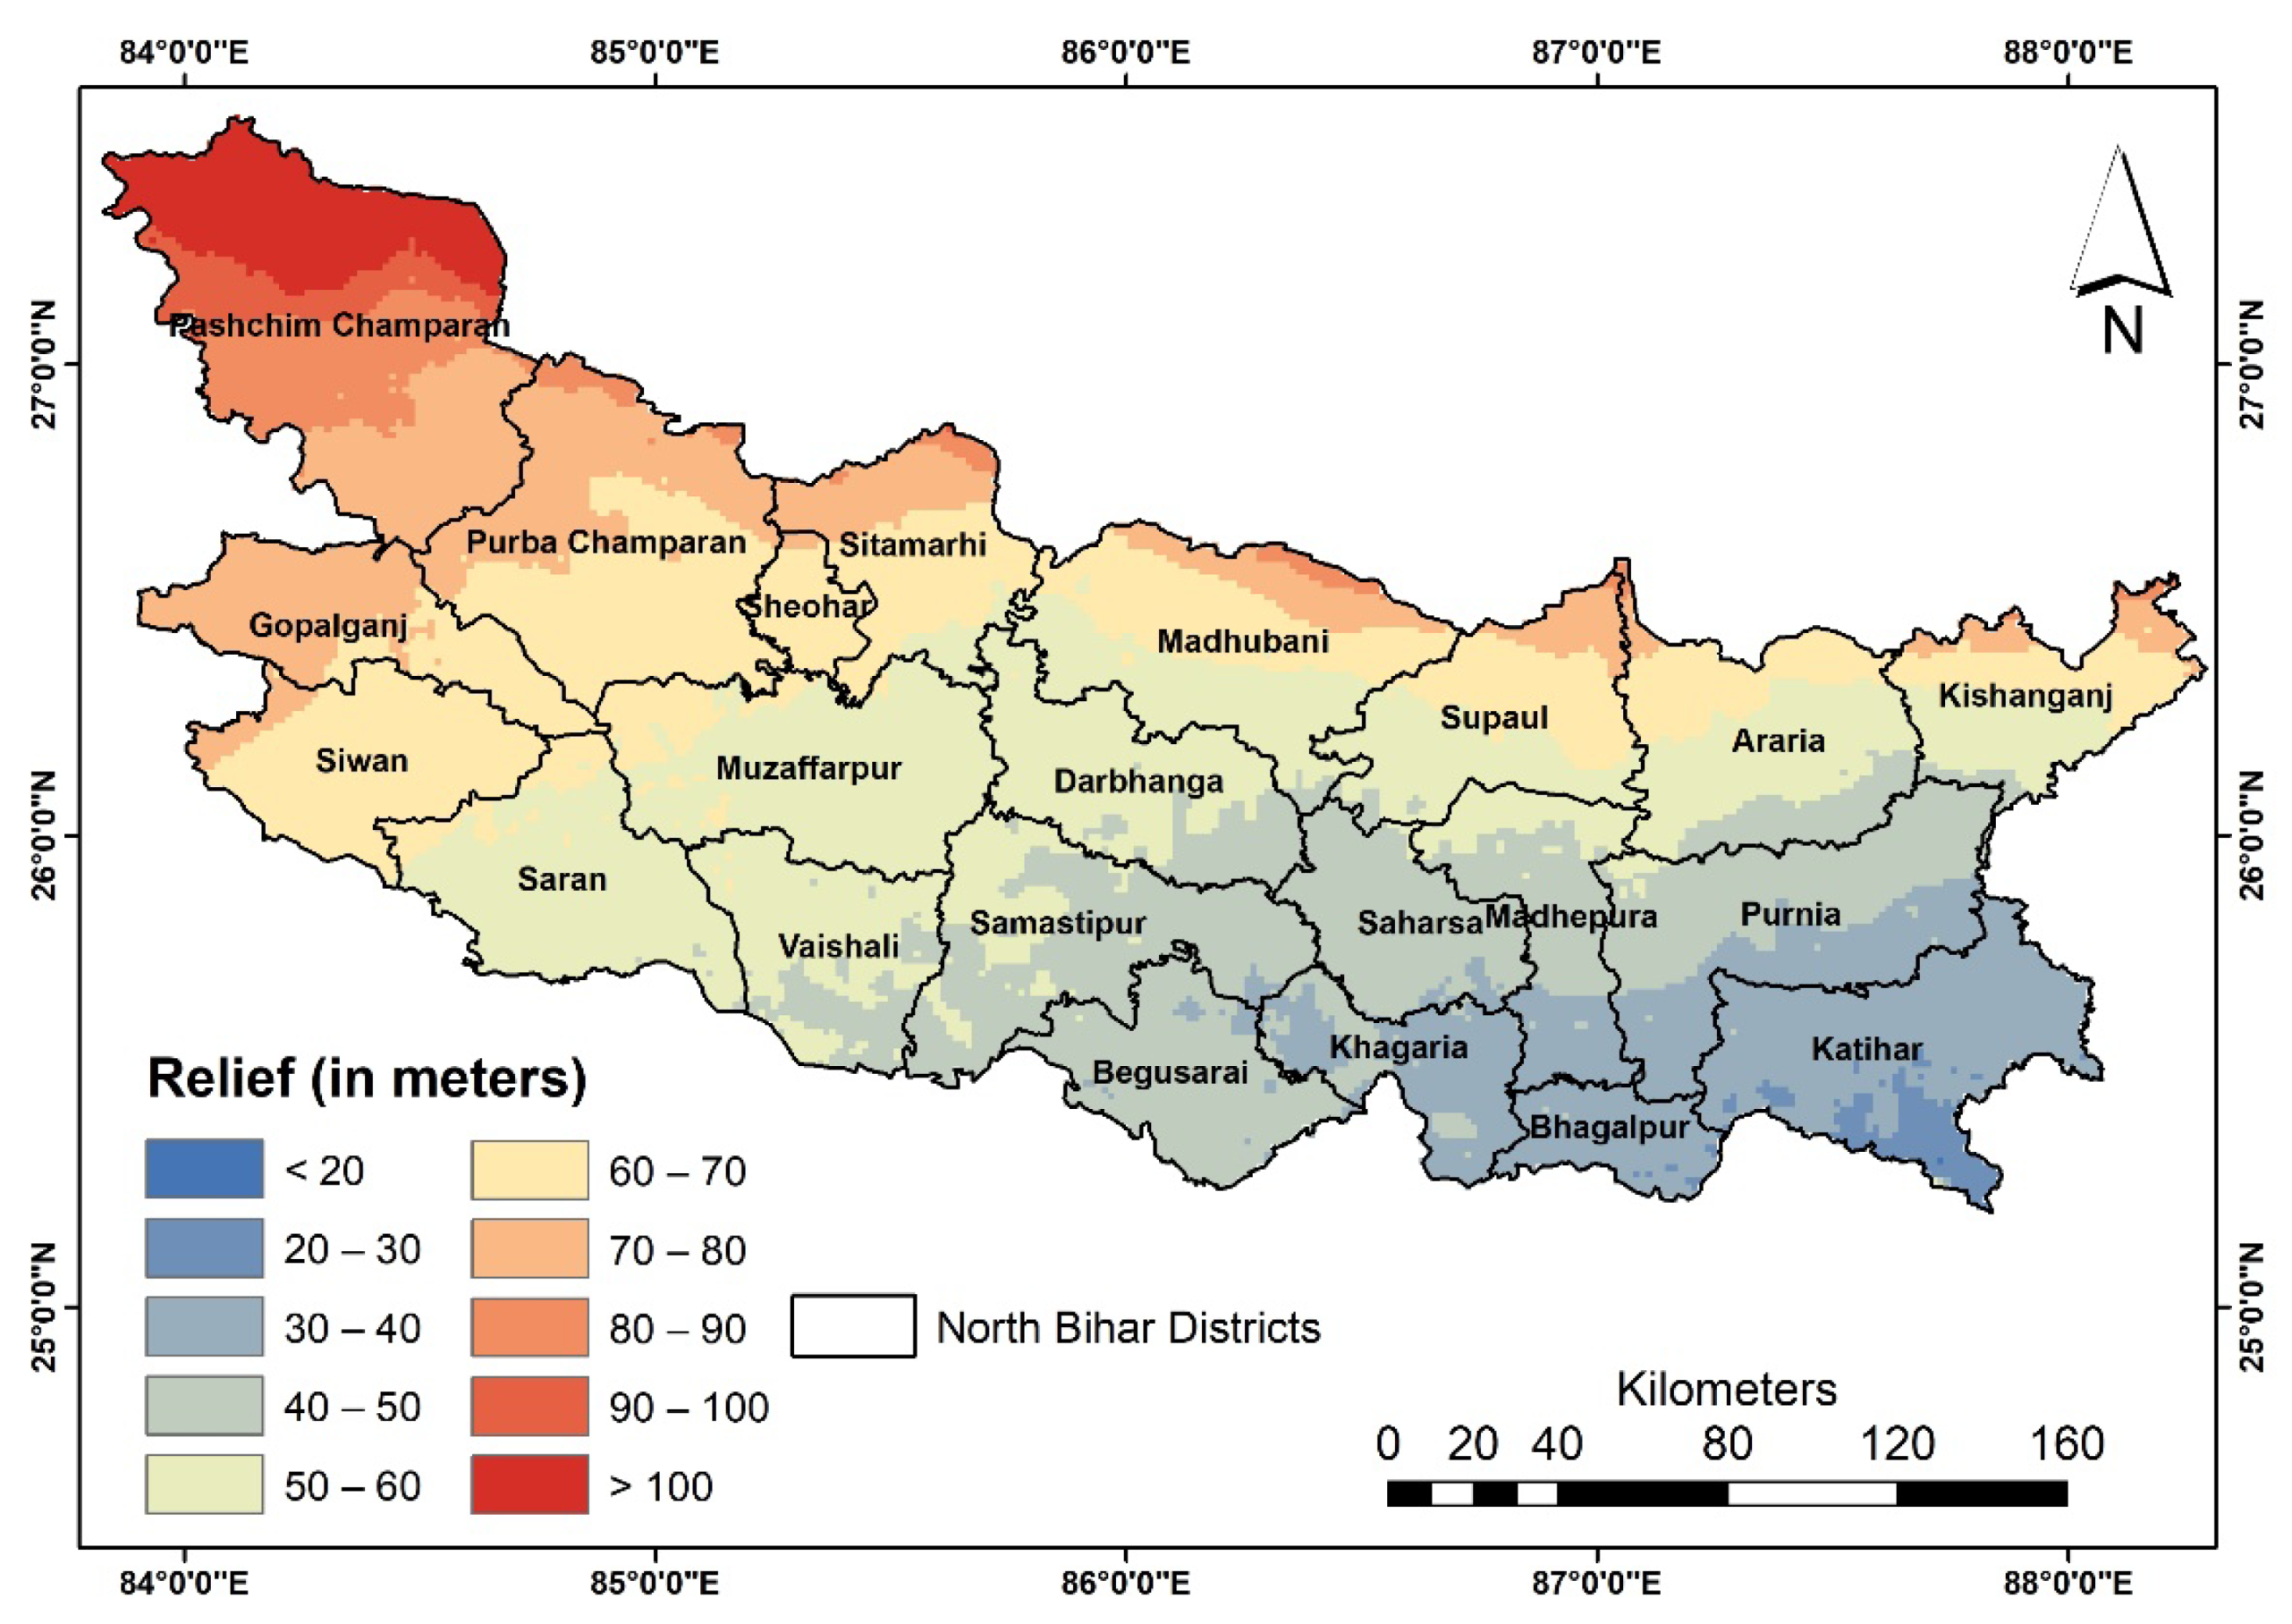
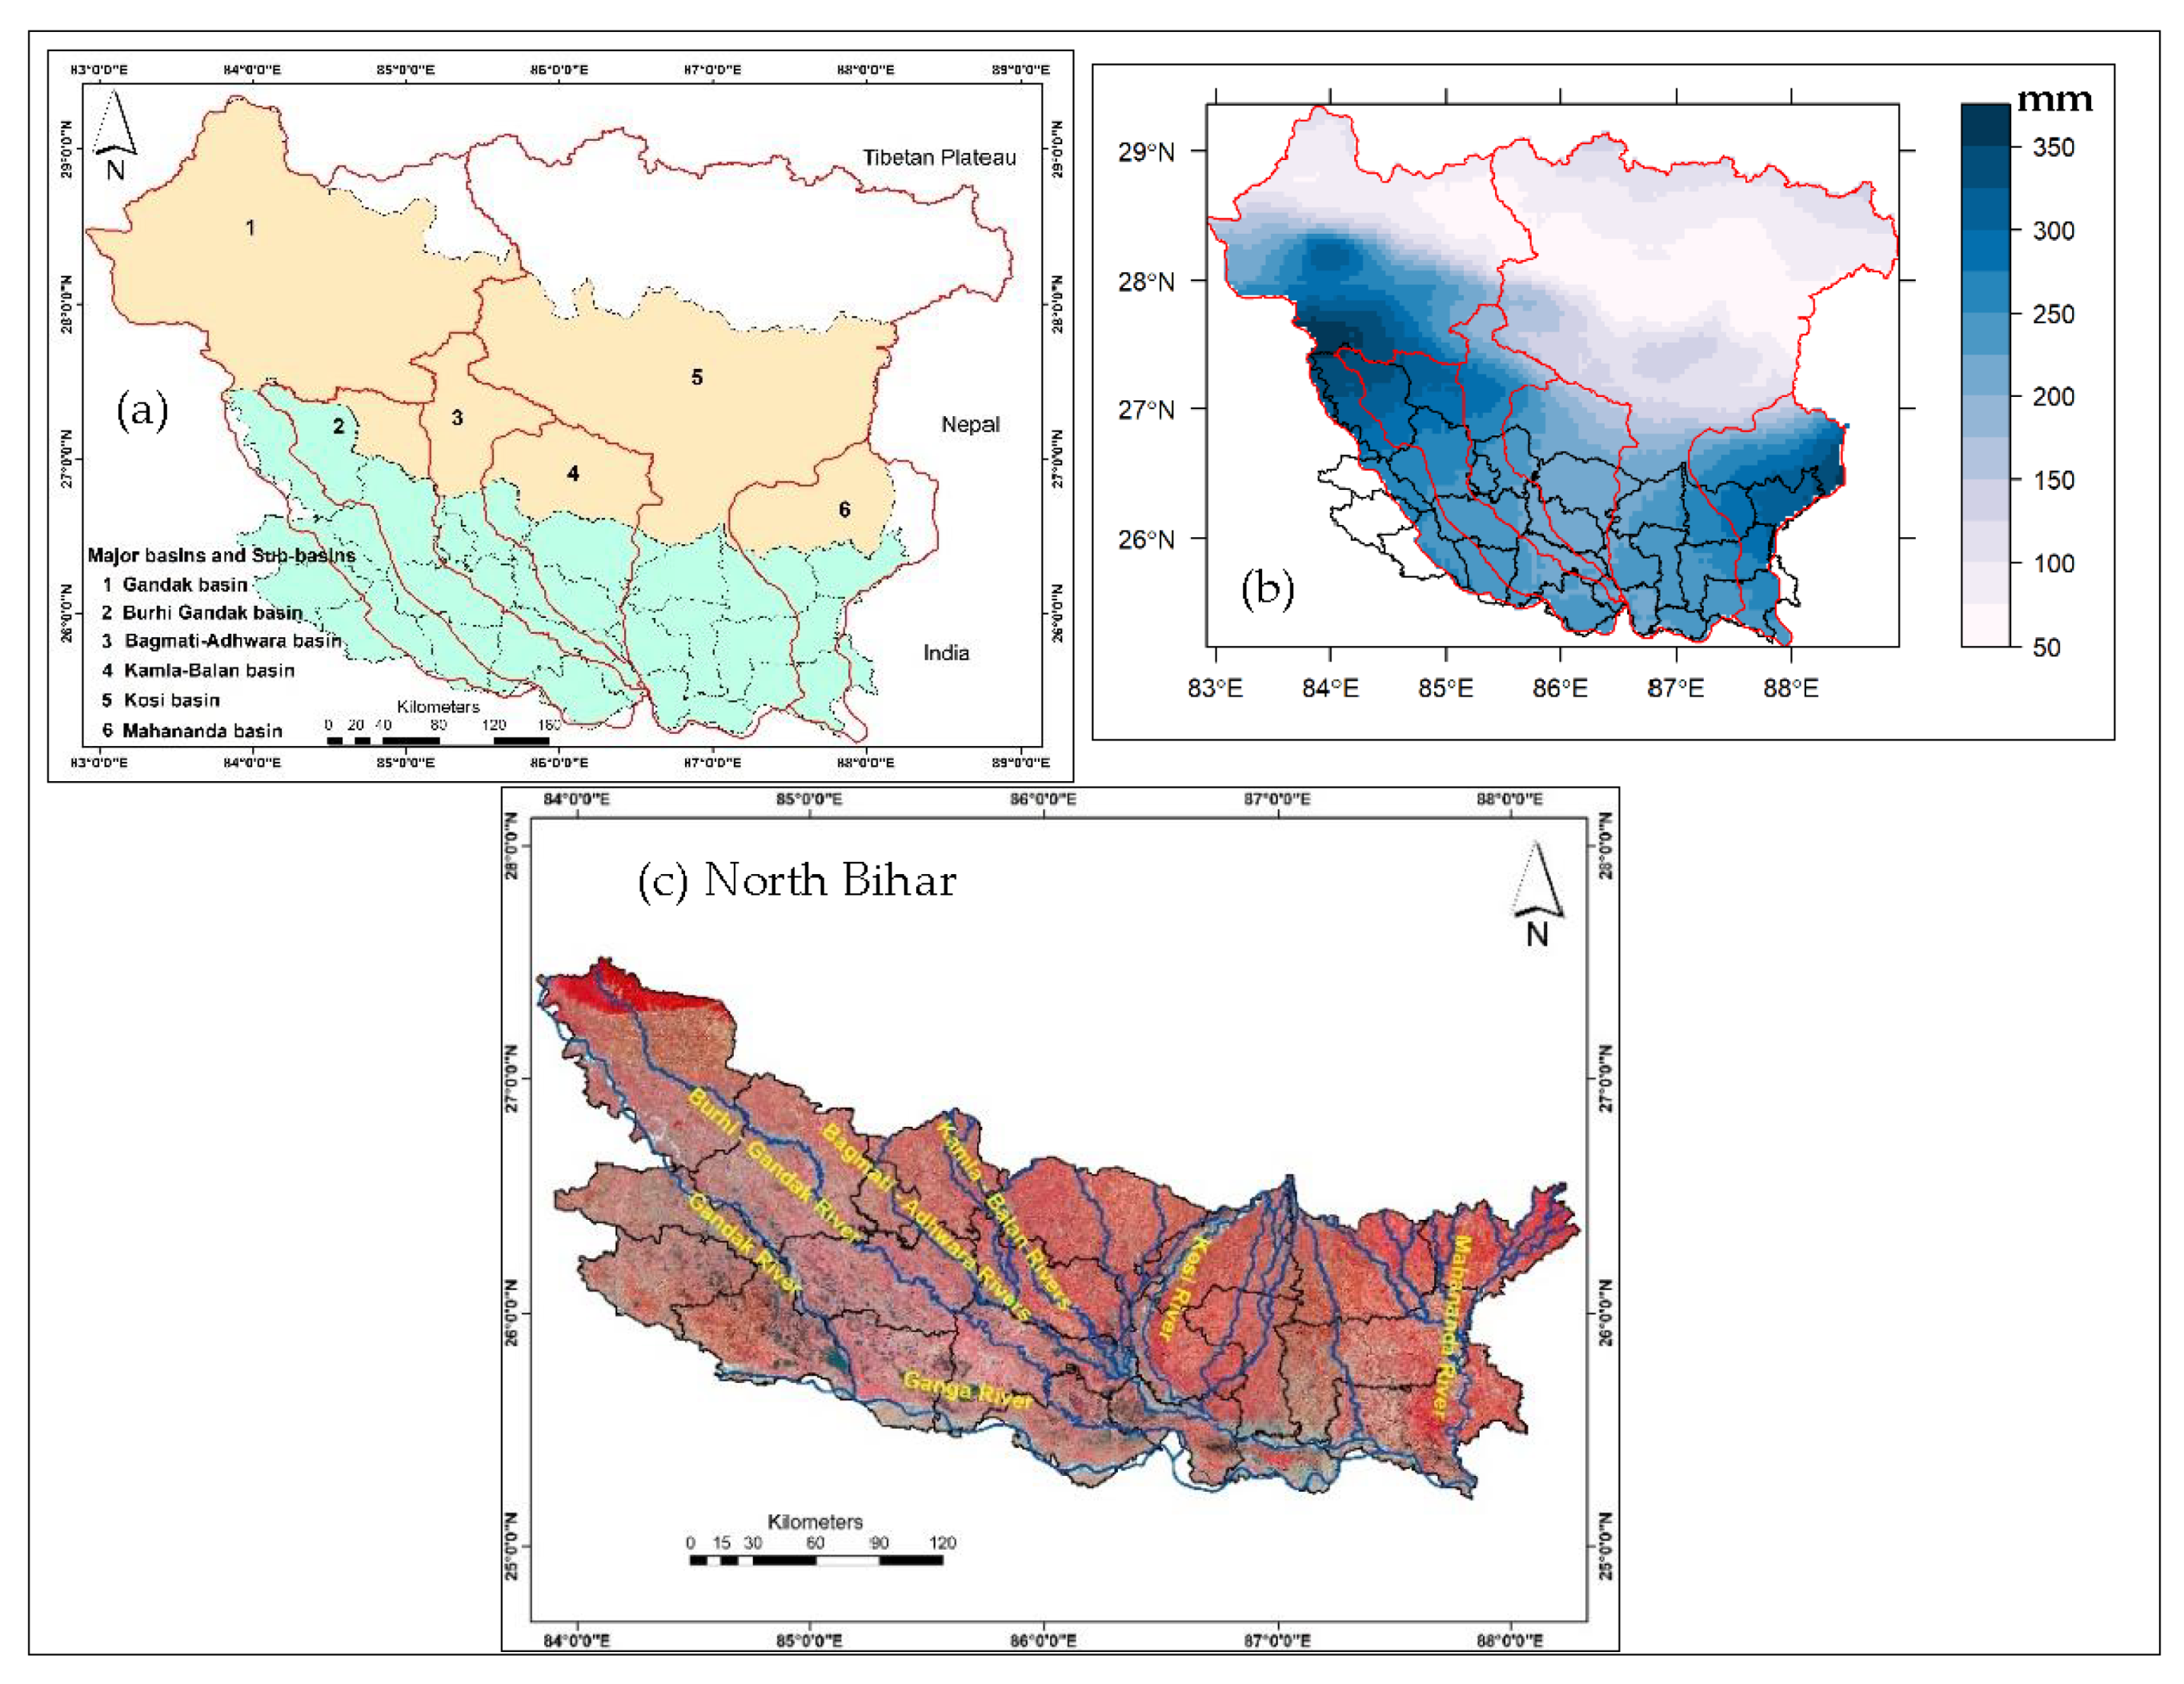
2. Study Area
3. Materials and Methods
3.1. Data Descriptions
3.1.1. MOD09A1 Based Reflectance Product
3.1.2. Sentinel–2 Optical Satellite Data
3.1.3. PDIR-Now Based Precipitation
3.1.4. Copernicus Land Use Land Cover
3.1.5. ALOS PALSAR Based DEM
3.1.6. Census Data
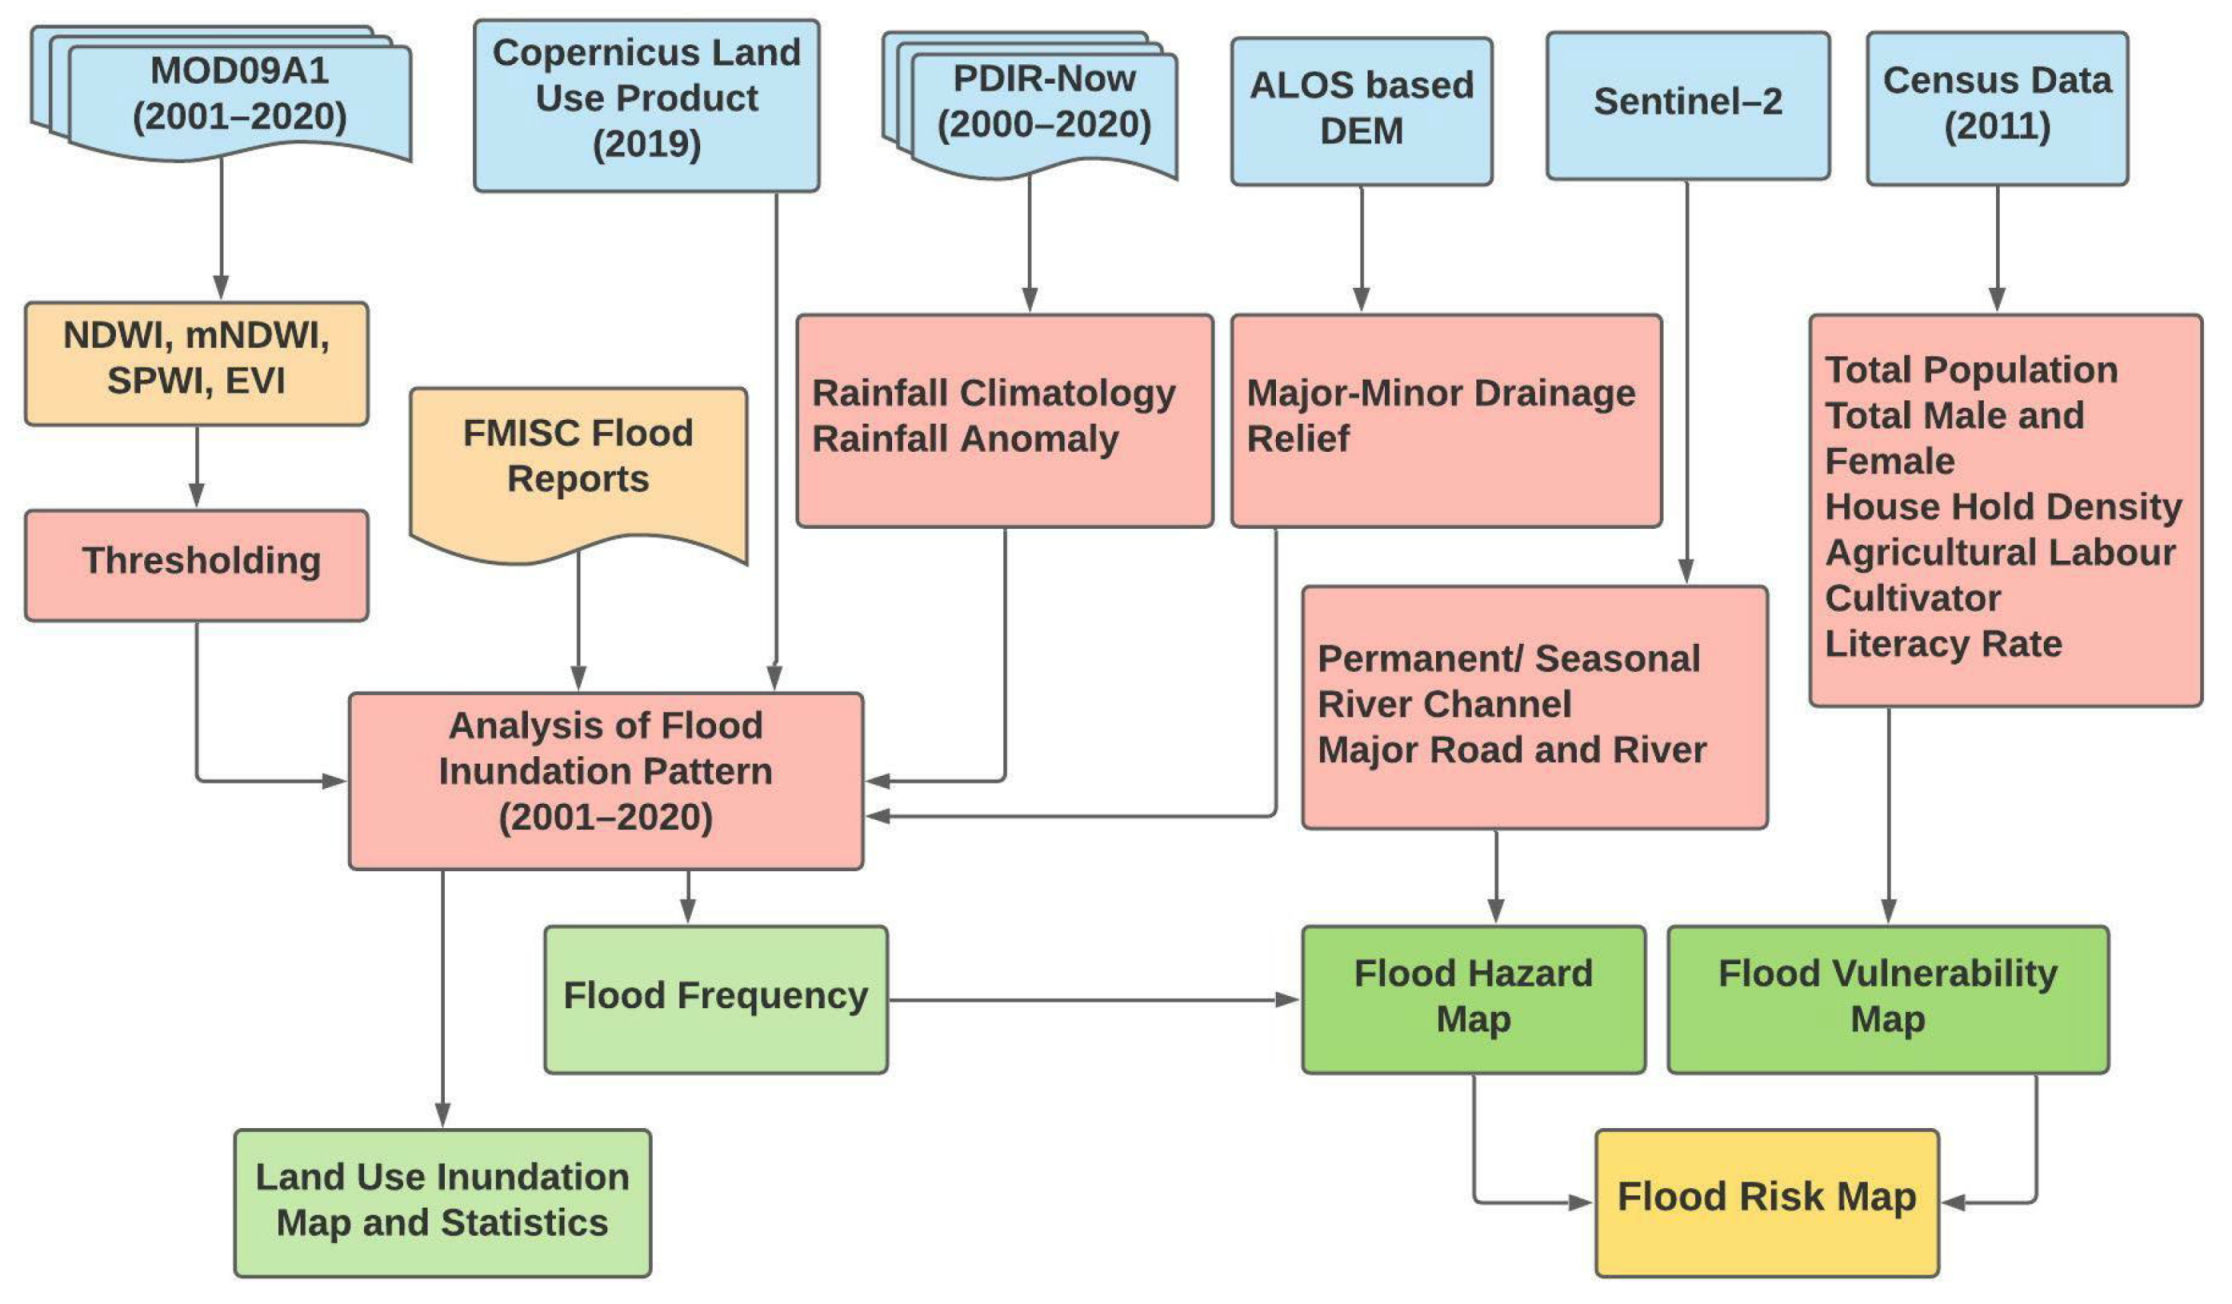
3.2. Methods
3.2.1. Flood Extent Mapping during 2001–2020 and Flood Hazard Estimation
- Non-flood pixel (EVI > 0.3)
- Permanent water bodies (EVI < 0.05)
- Water-related pixel (EVI < 0.1)
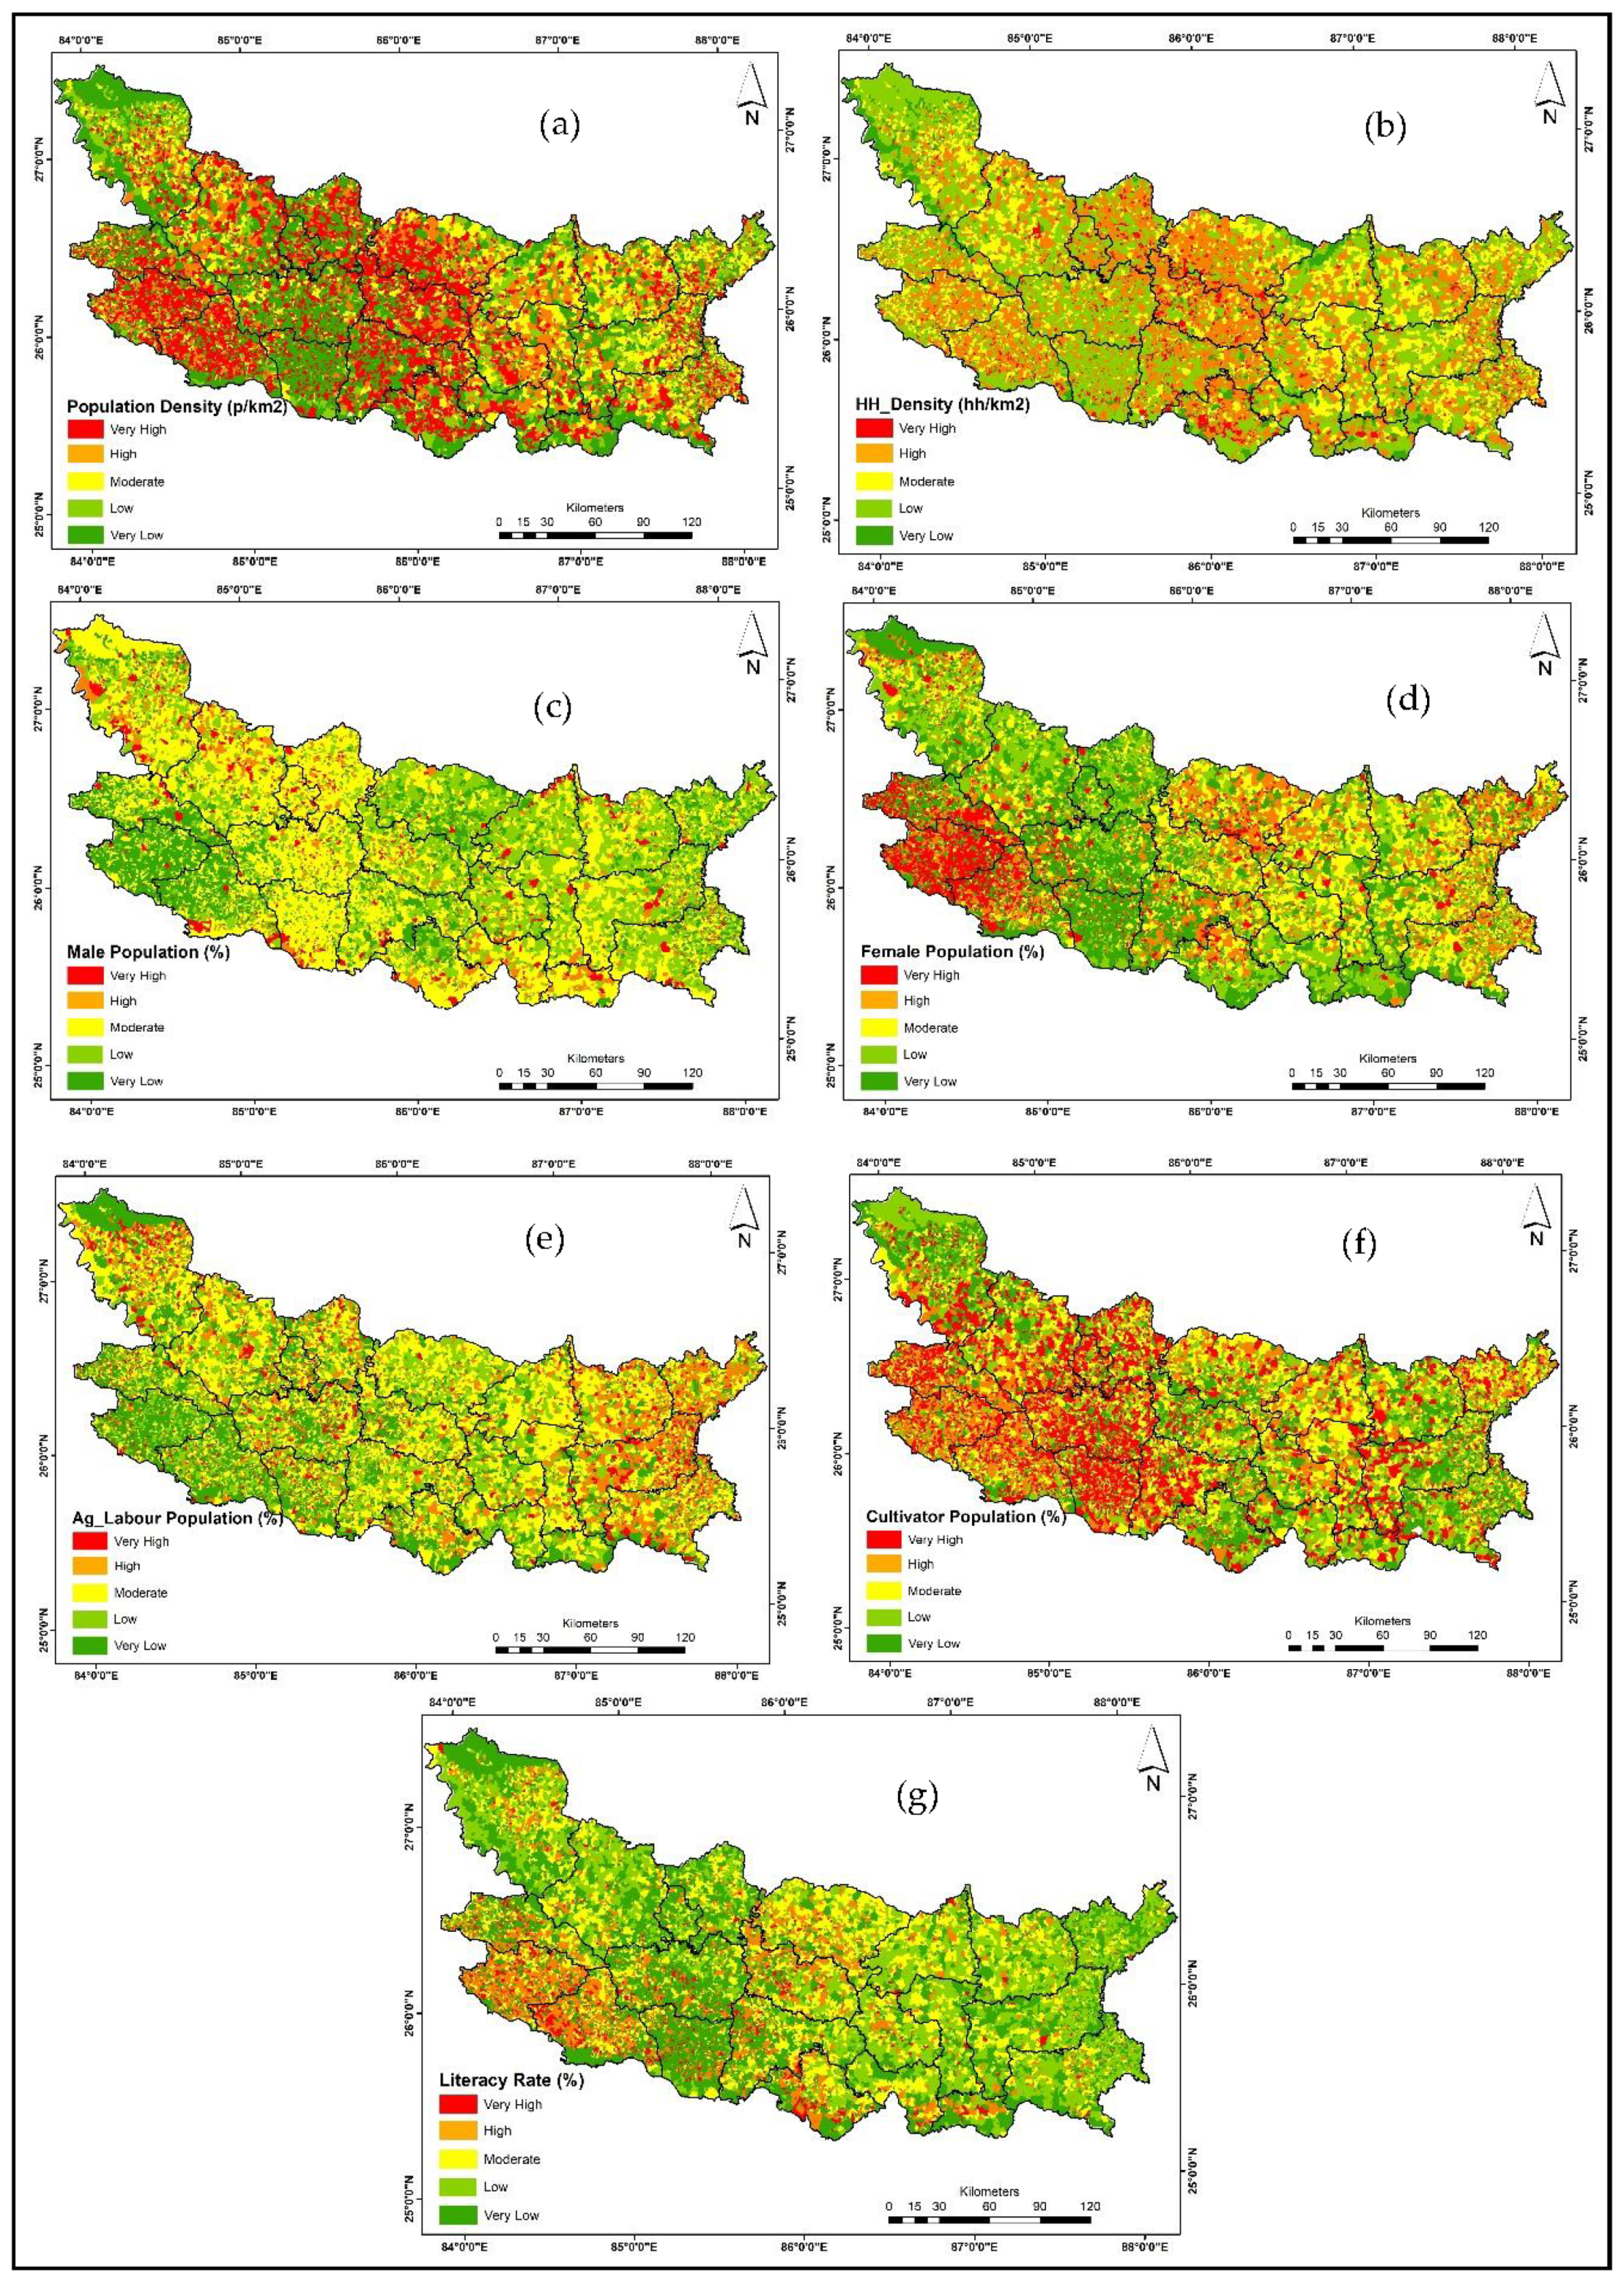
3.2.2. Village Wise Socio-Economic Vulnerability (SEV) Mapping
- PD = population density;
- HH = number house-hold;
- FM = female ratio;
- M = percentage wise male ratio;
- AL = percentage wise population of agricultural labourers;
- CL = percentage wise population of cultivators;
- LR = percentage population of literates.

| Indicators | Very High | High | Moderate | Low | Very Low |
|---|---|---|---|---|---|
| Population density per km2 (p/km2) | ≥4000 | 3000–4000 | 2000–3000 | 1000–2000 | ≤1000 |
| House hold density (house/km2) | ≥2000 | 1500–2000 | 1000–1500 | 500–1000 | ≤500 |
| Male Population (%) | 36.1–45 | 27.1–36 | 18.1–27 | 9.1–18 | ≤9 |
| Female Population (%) | 44.1–55 | 33.1–44 | 22.1–33 | 11.1–22 | ≤11 |
| Agriculture Labour (%) | ≥56.1 | 42.1–56 | 28.1–42 | 14.1–28 | ≤14 |
| Cultivator (%) | ≥44.1 | 33.1–44 | 22.1–33 | 11.1–22 | ≤11 |
| Literacy Rate (%) | ≥24.1 | 18.1–24 | 12.1–18 | 6.1–12 | ≤6 |
3.2.3. Flood Risk Mapping
4. Results
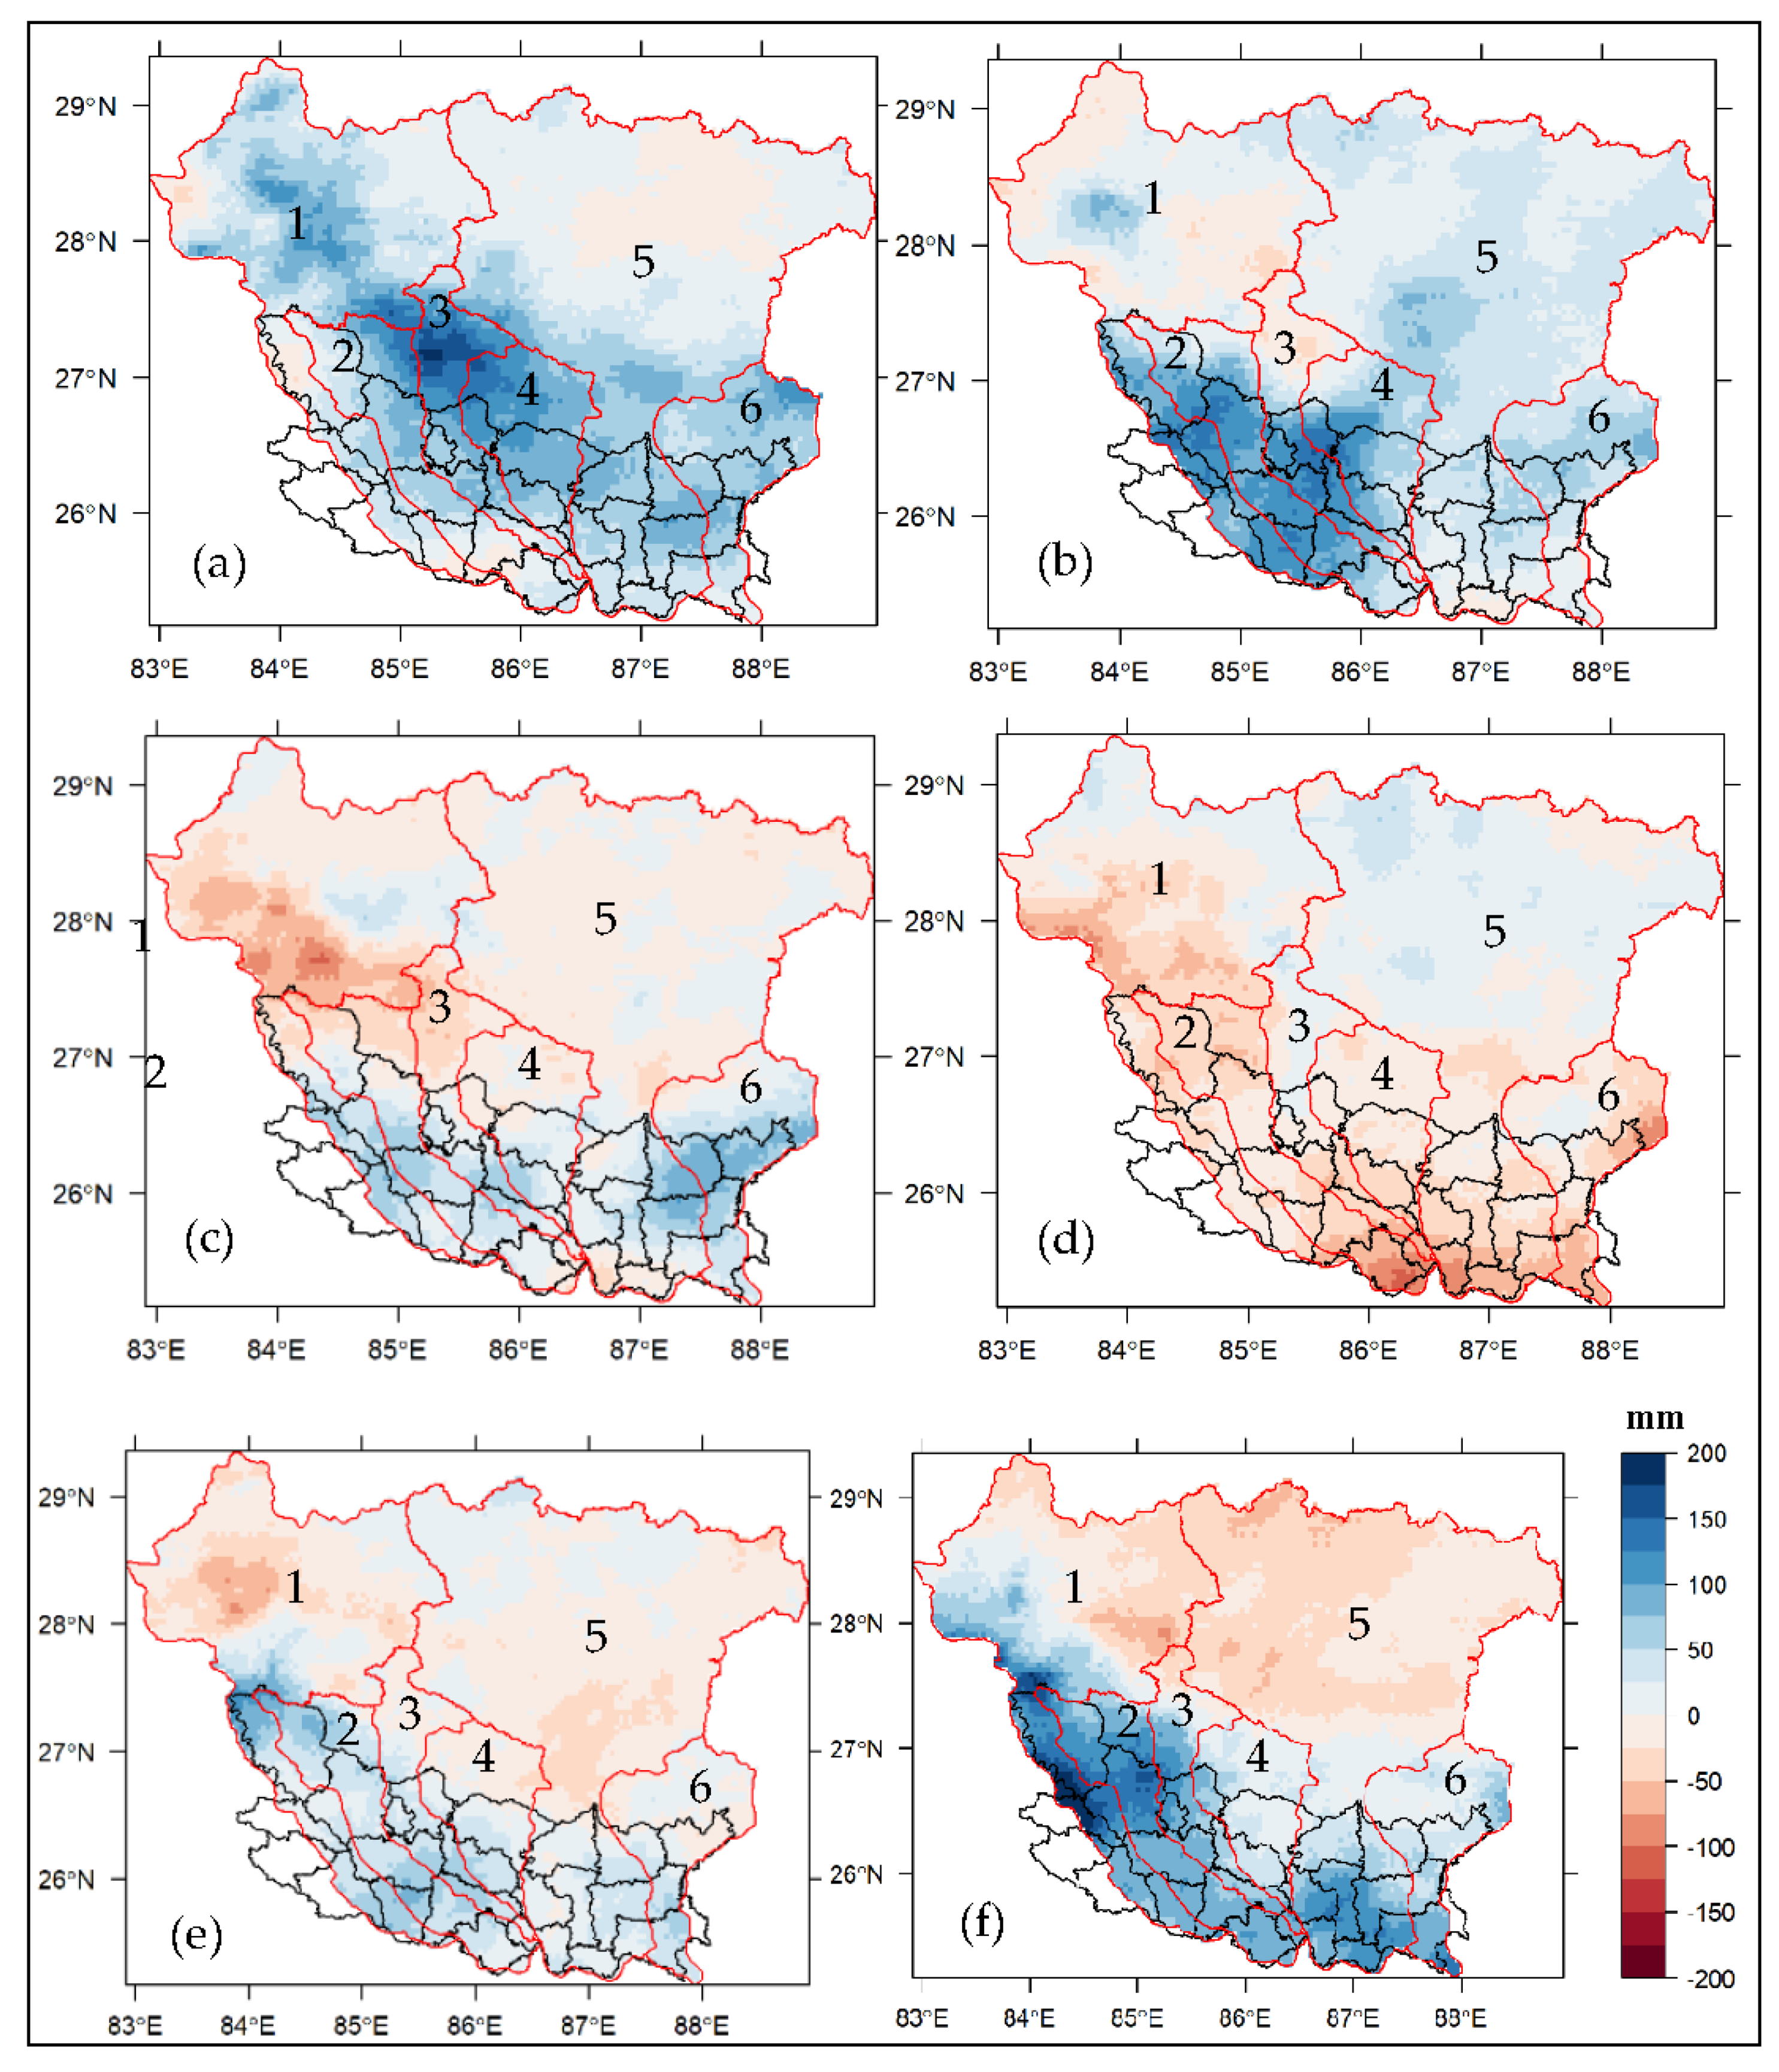
4.1. Spatio-Temporal Precipitation Maps during 2000–2020
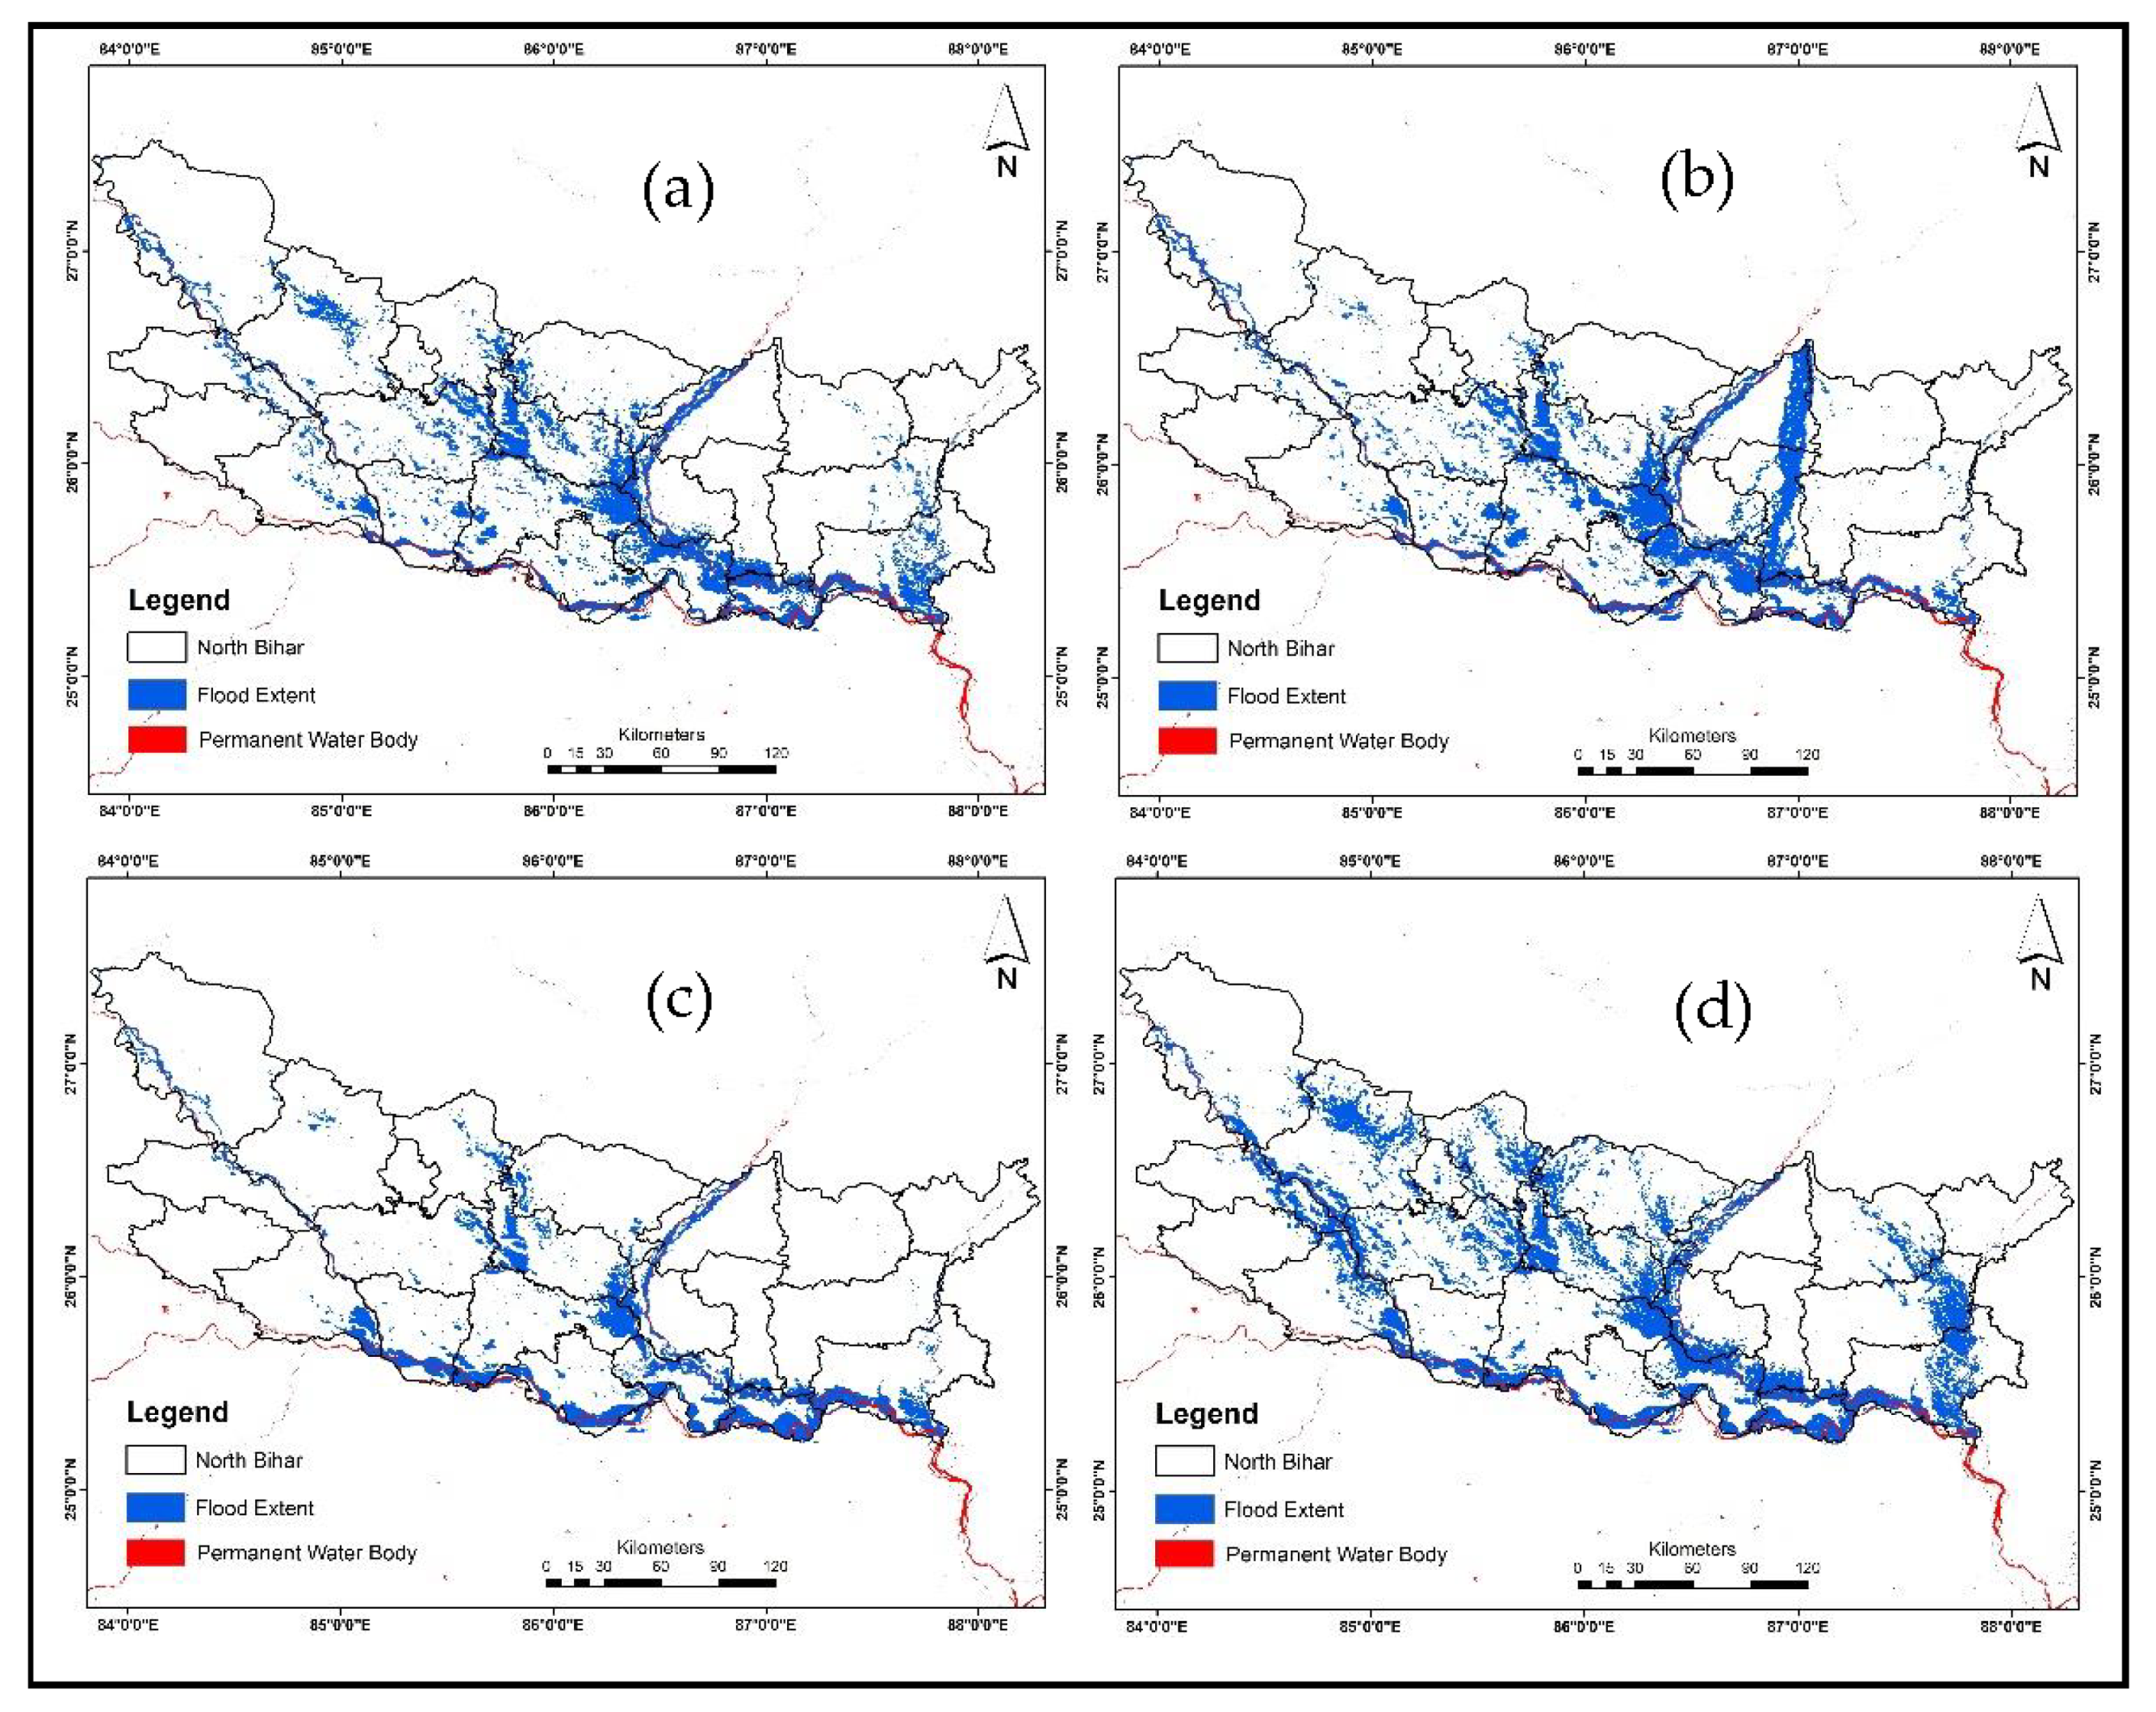
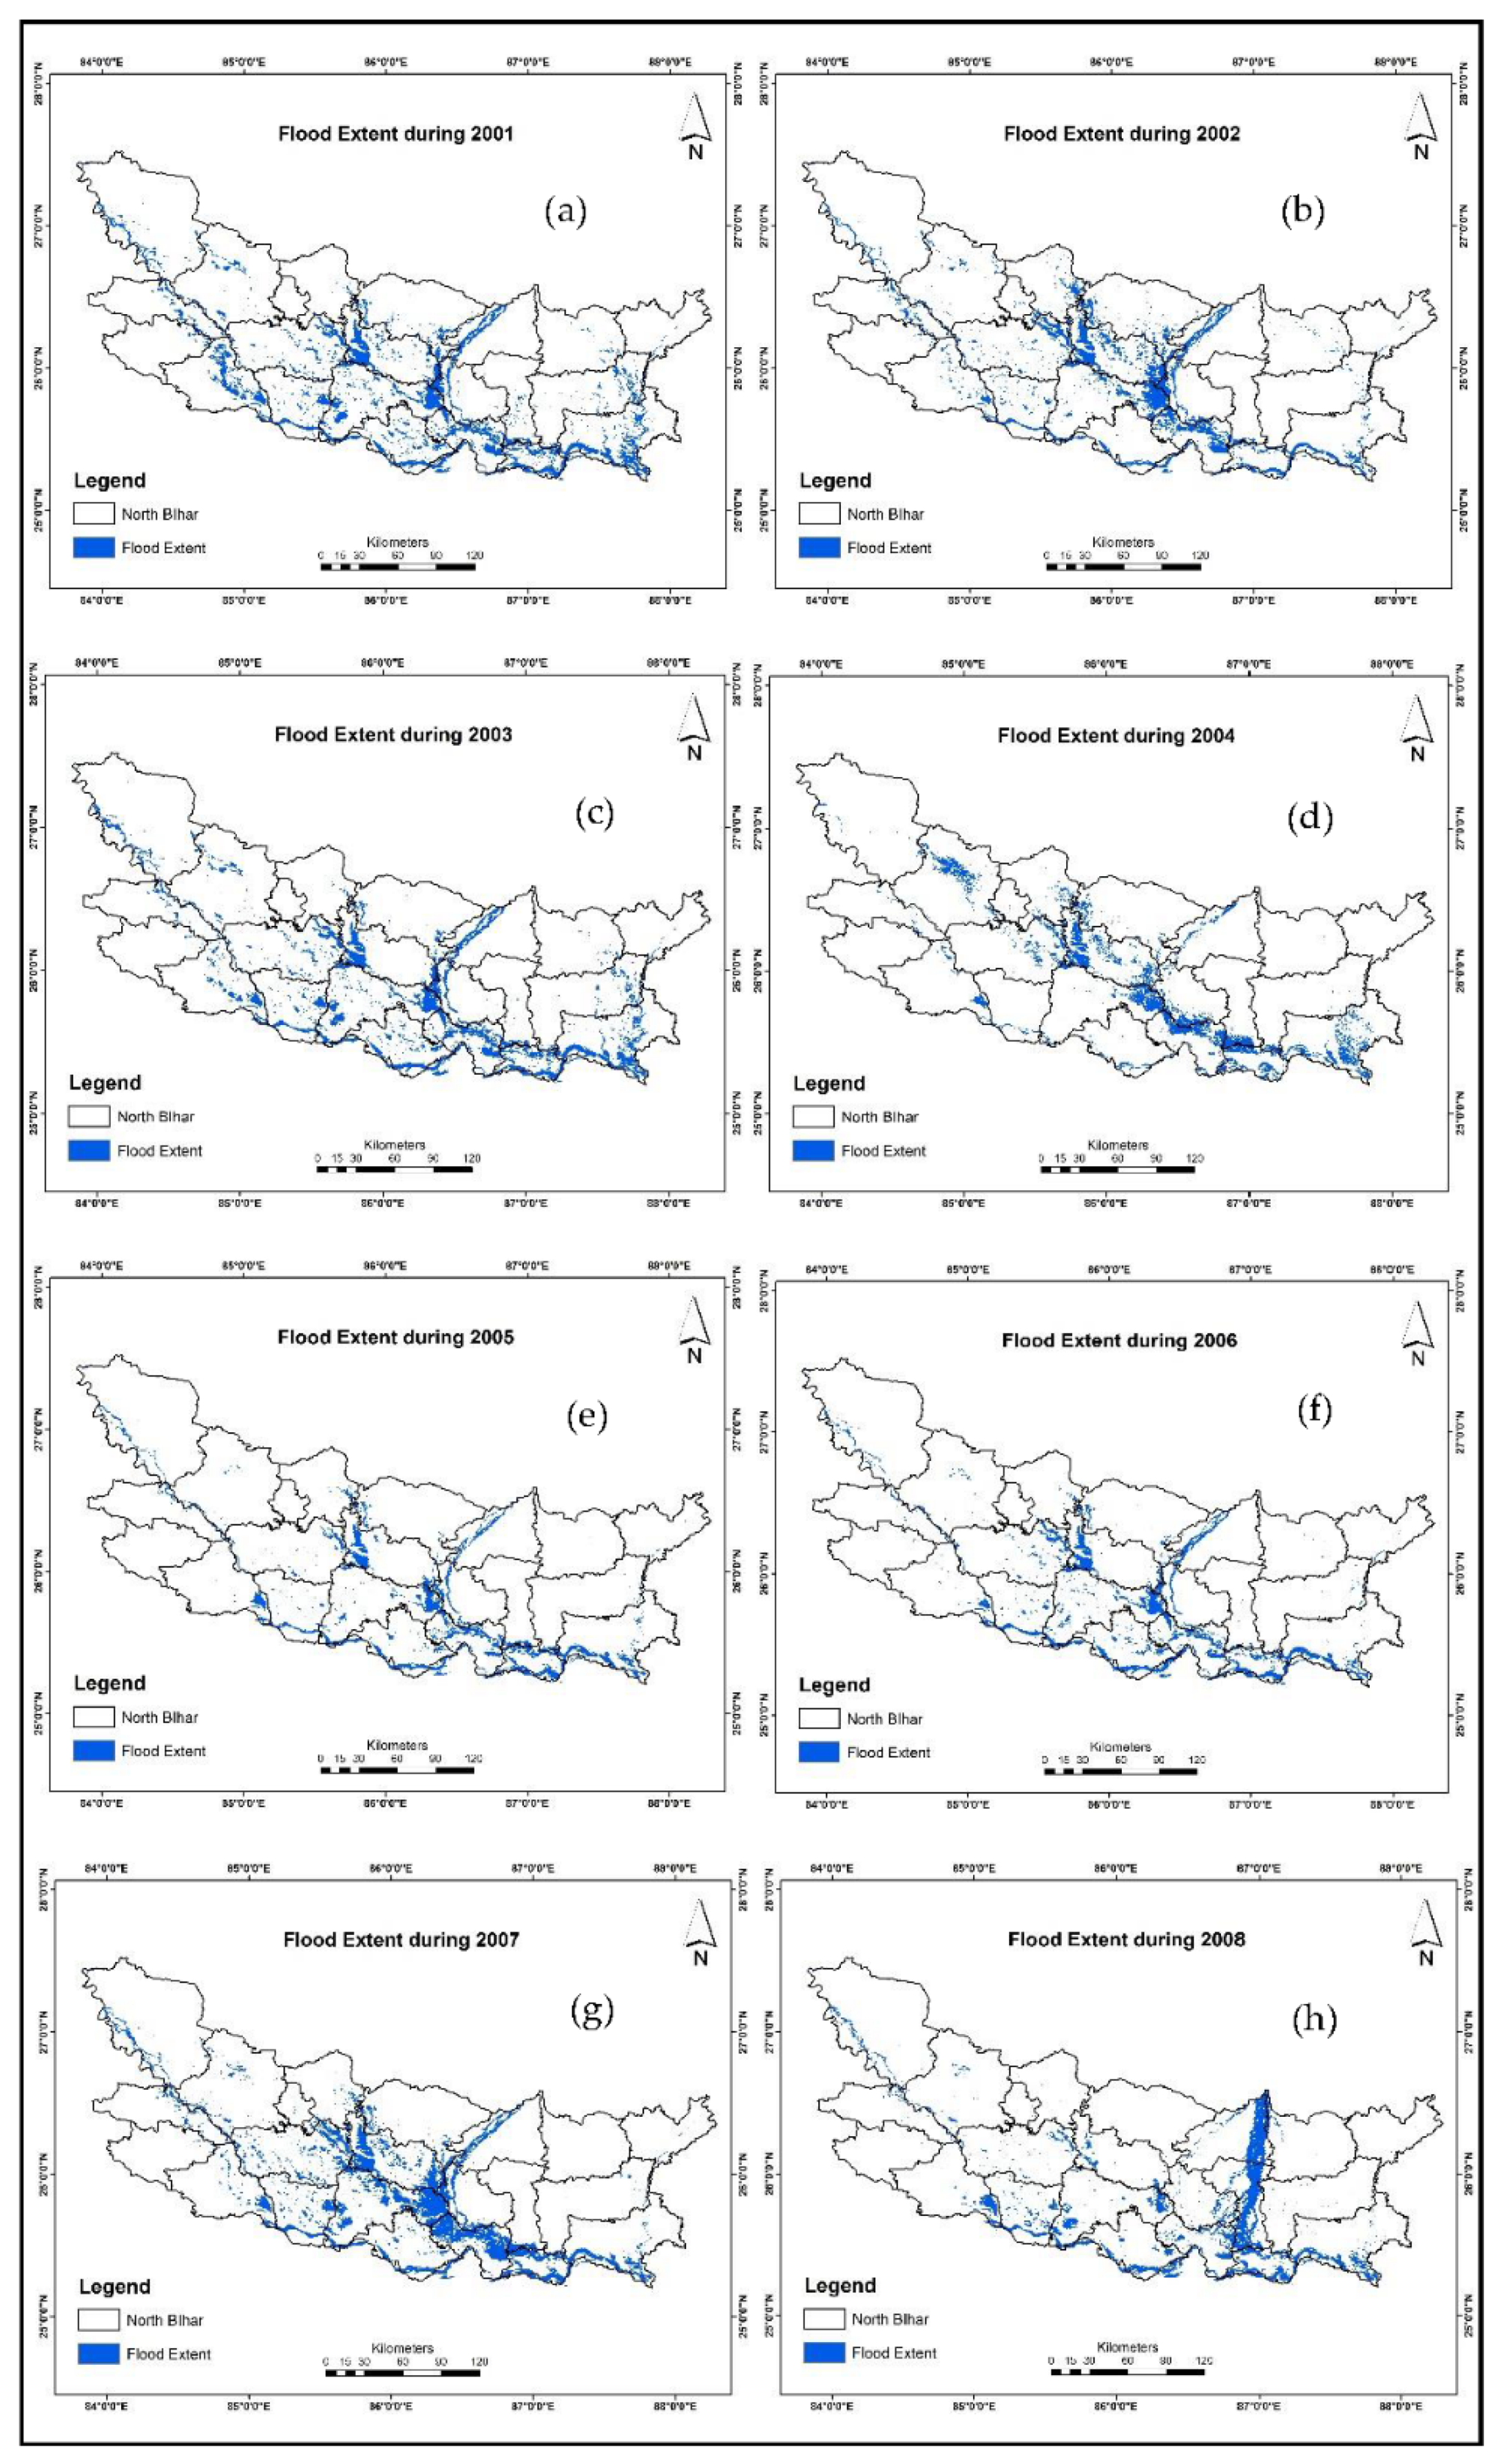
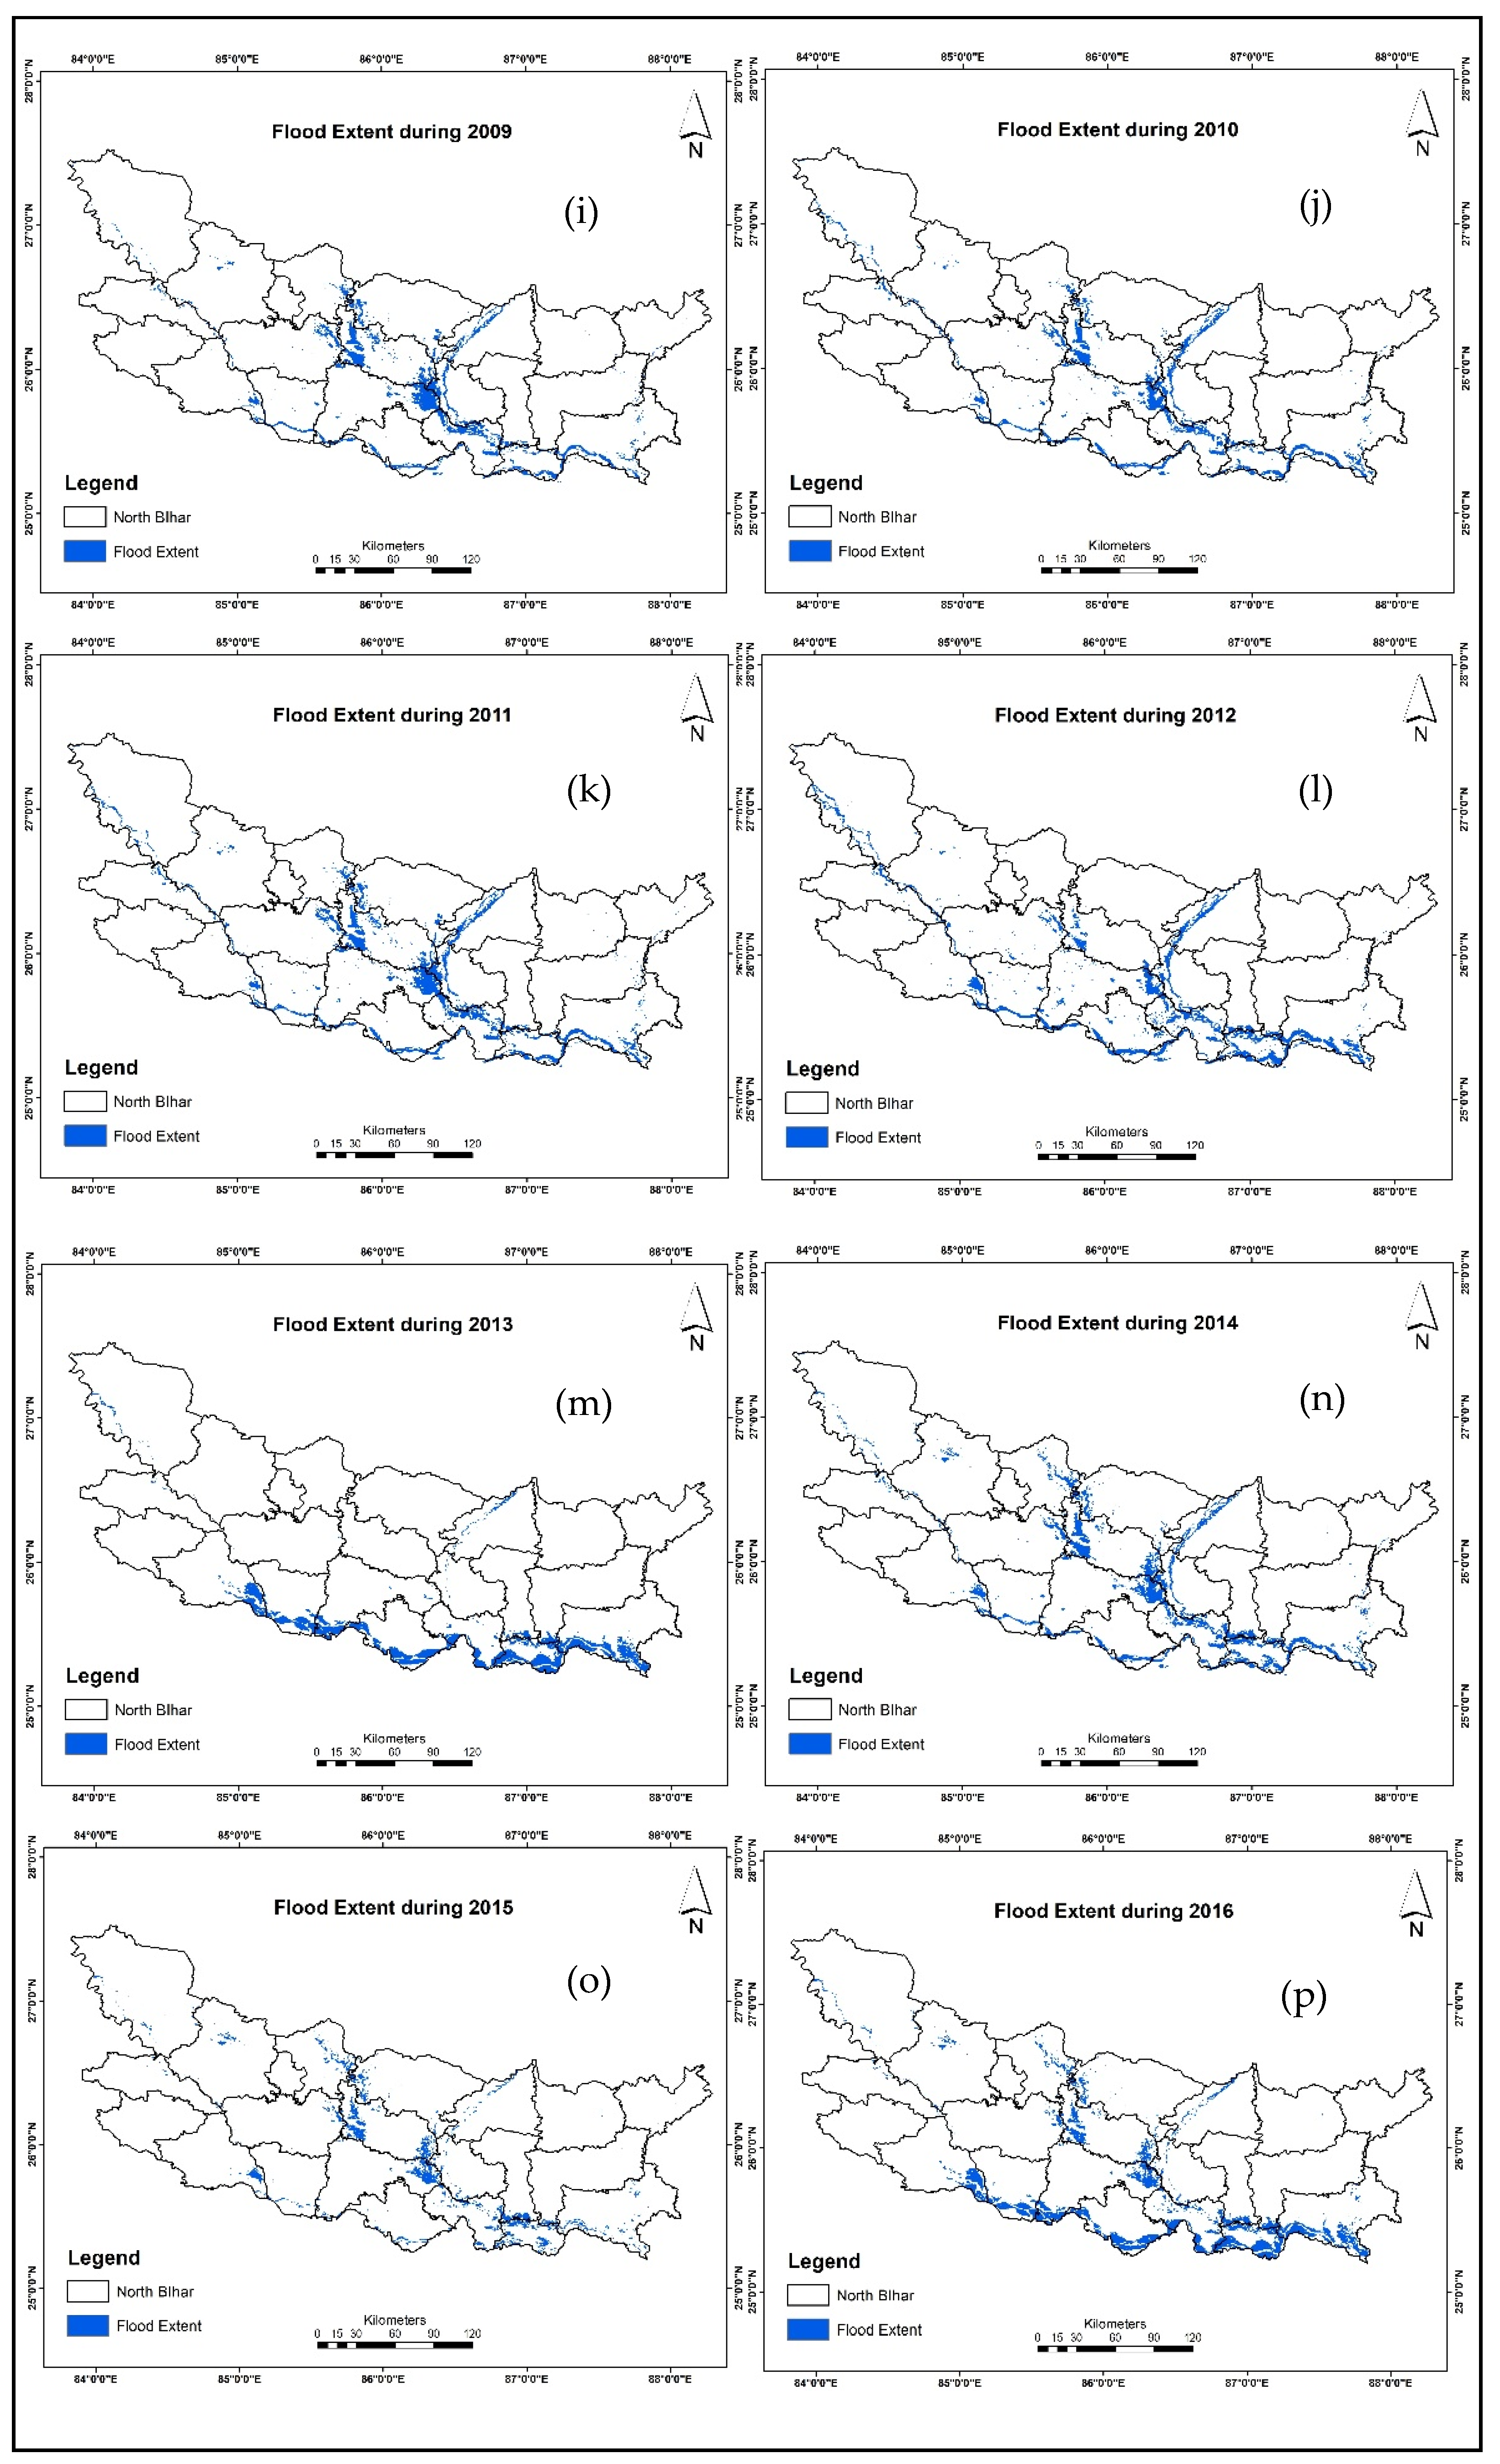
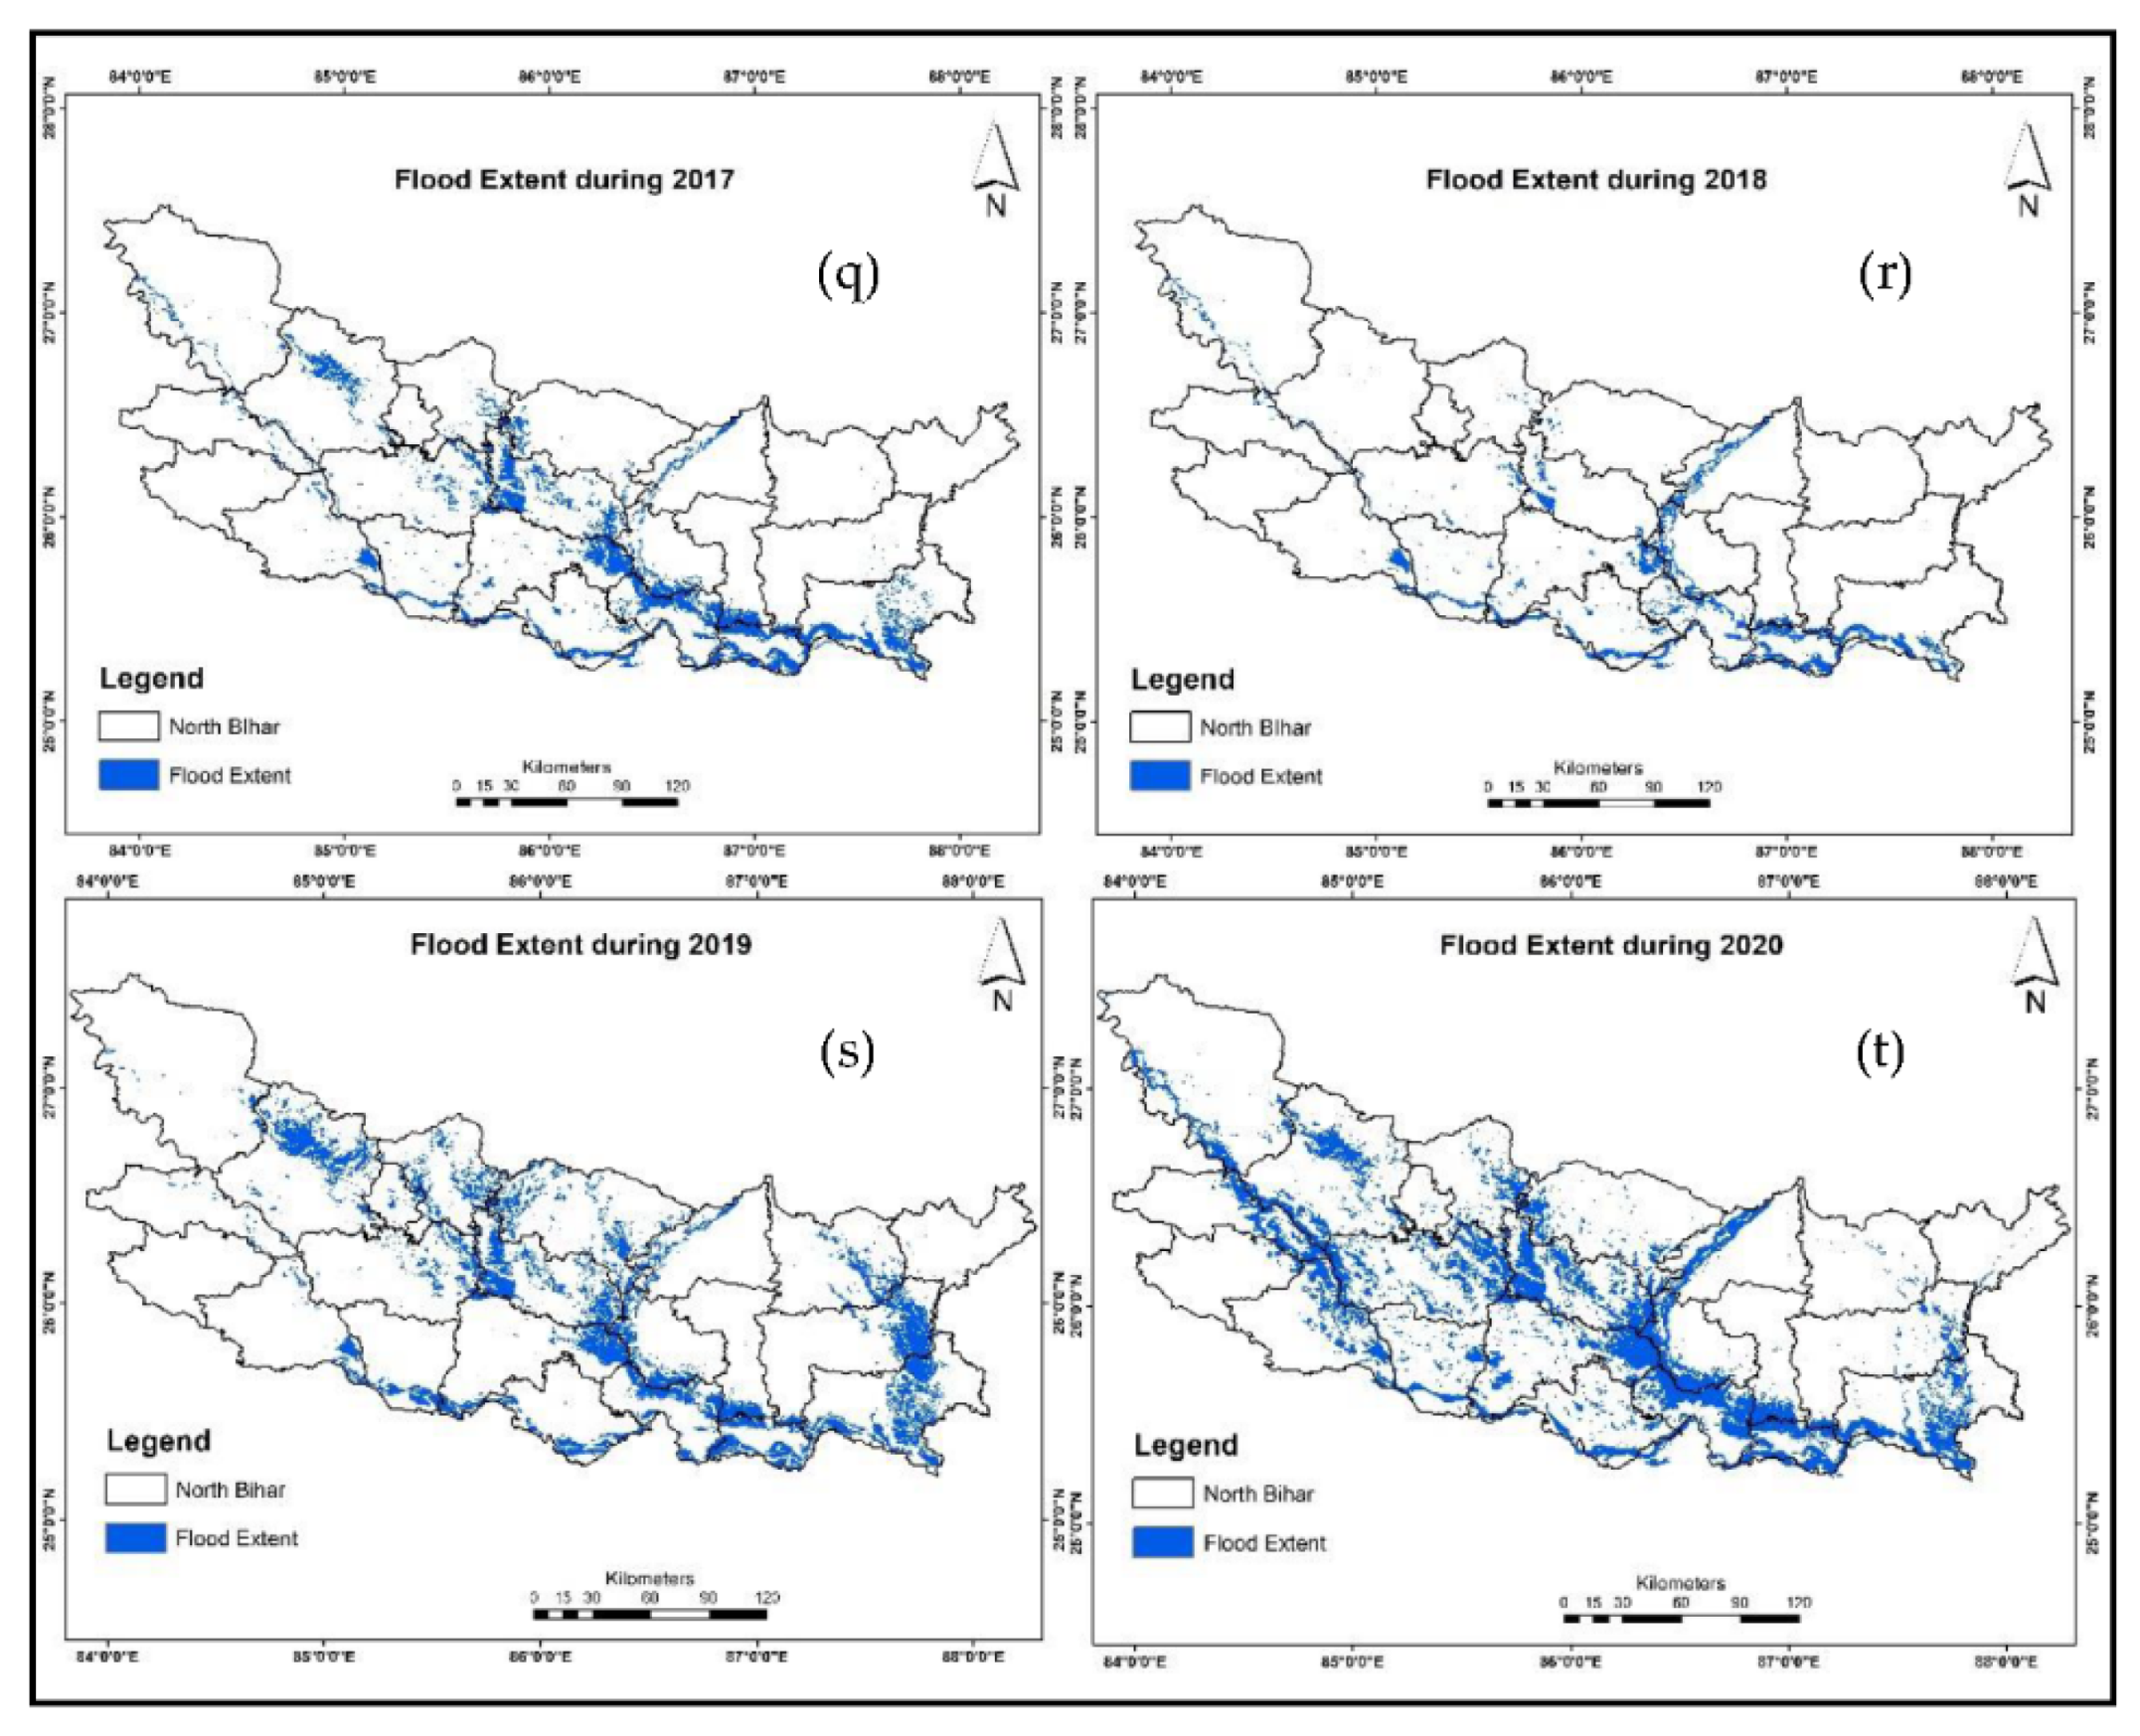
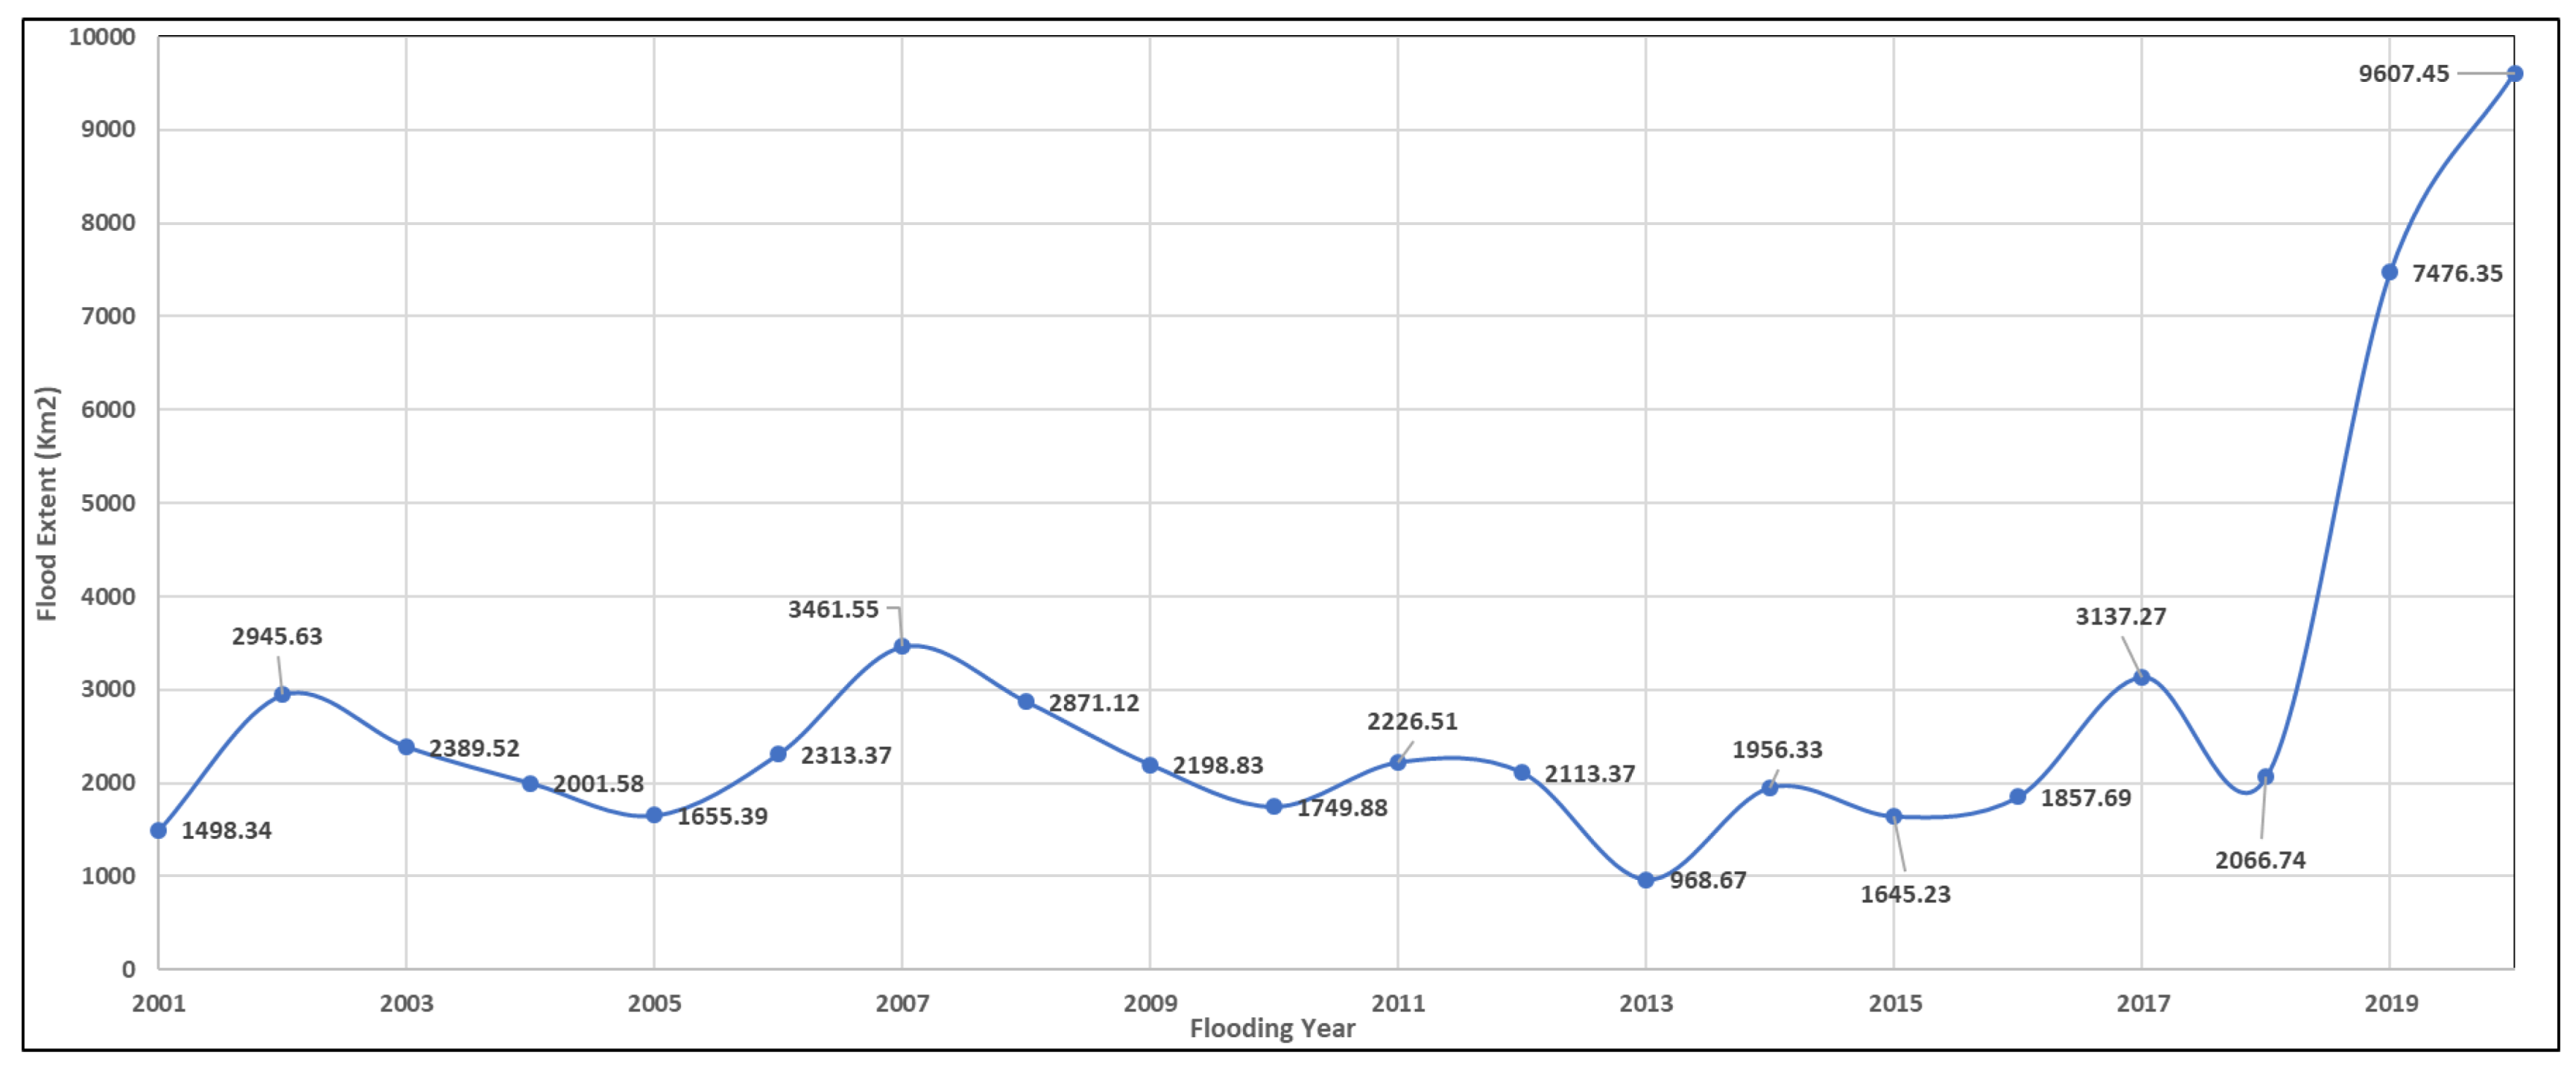
4.2. Spatio-Temporal Annual Flood Extent Map during 2001–2020
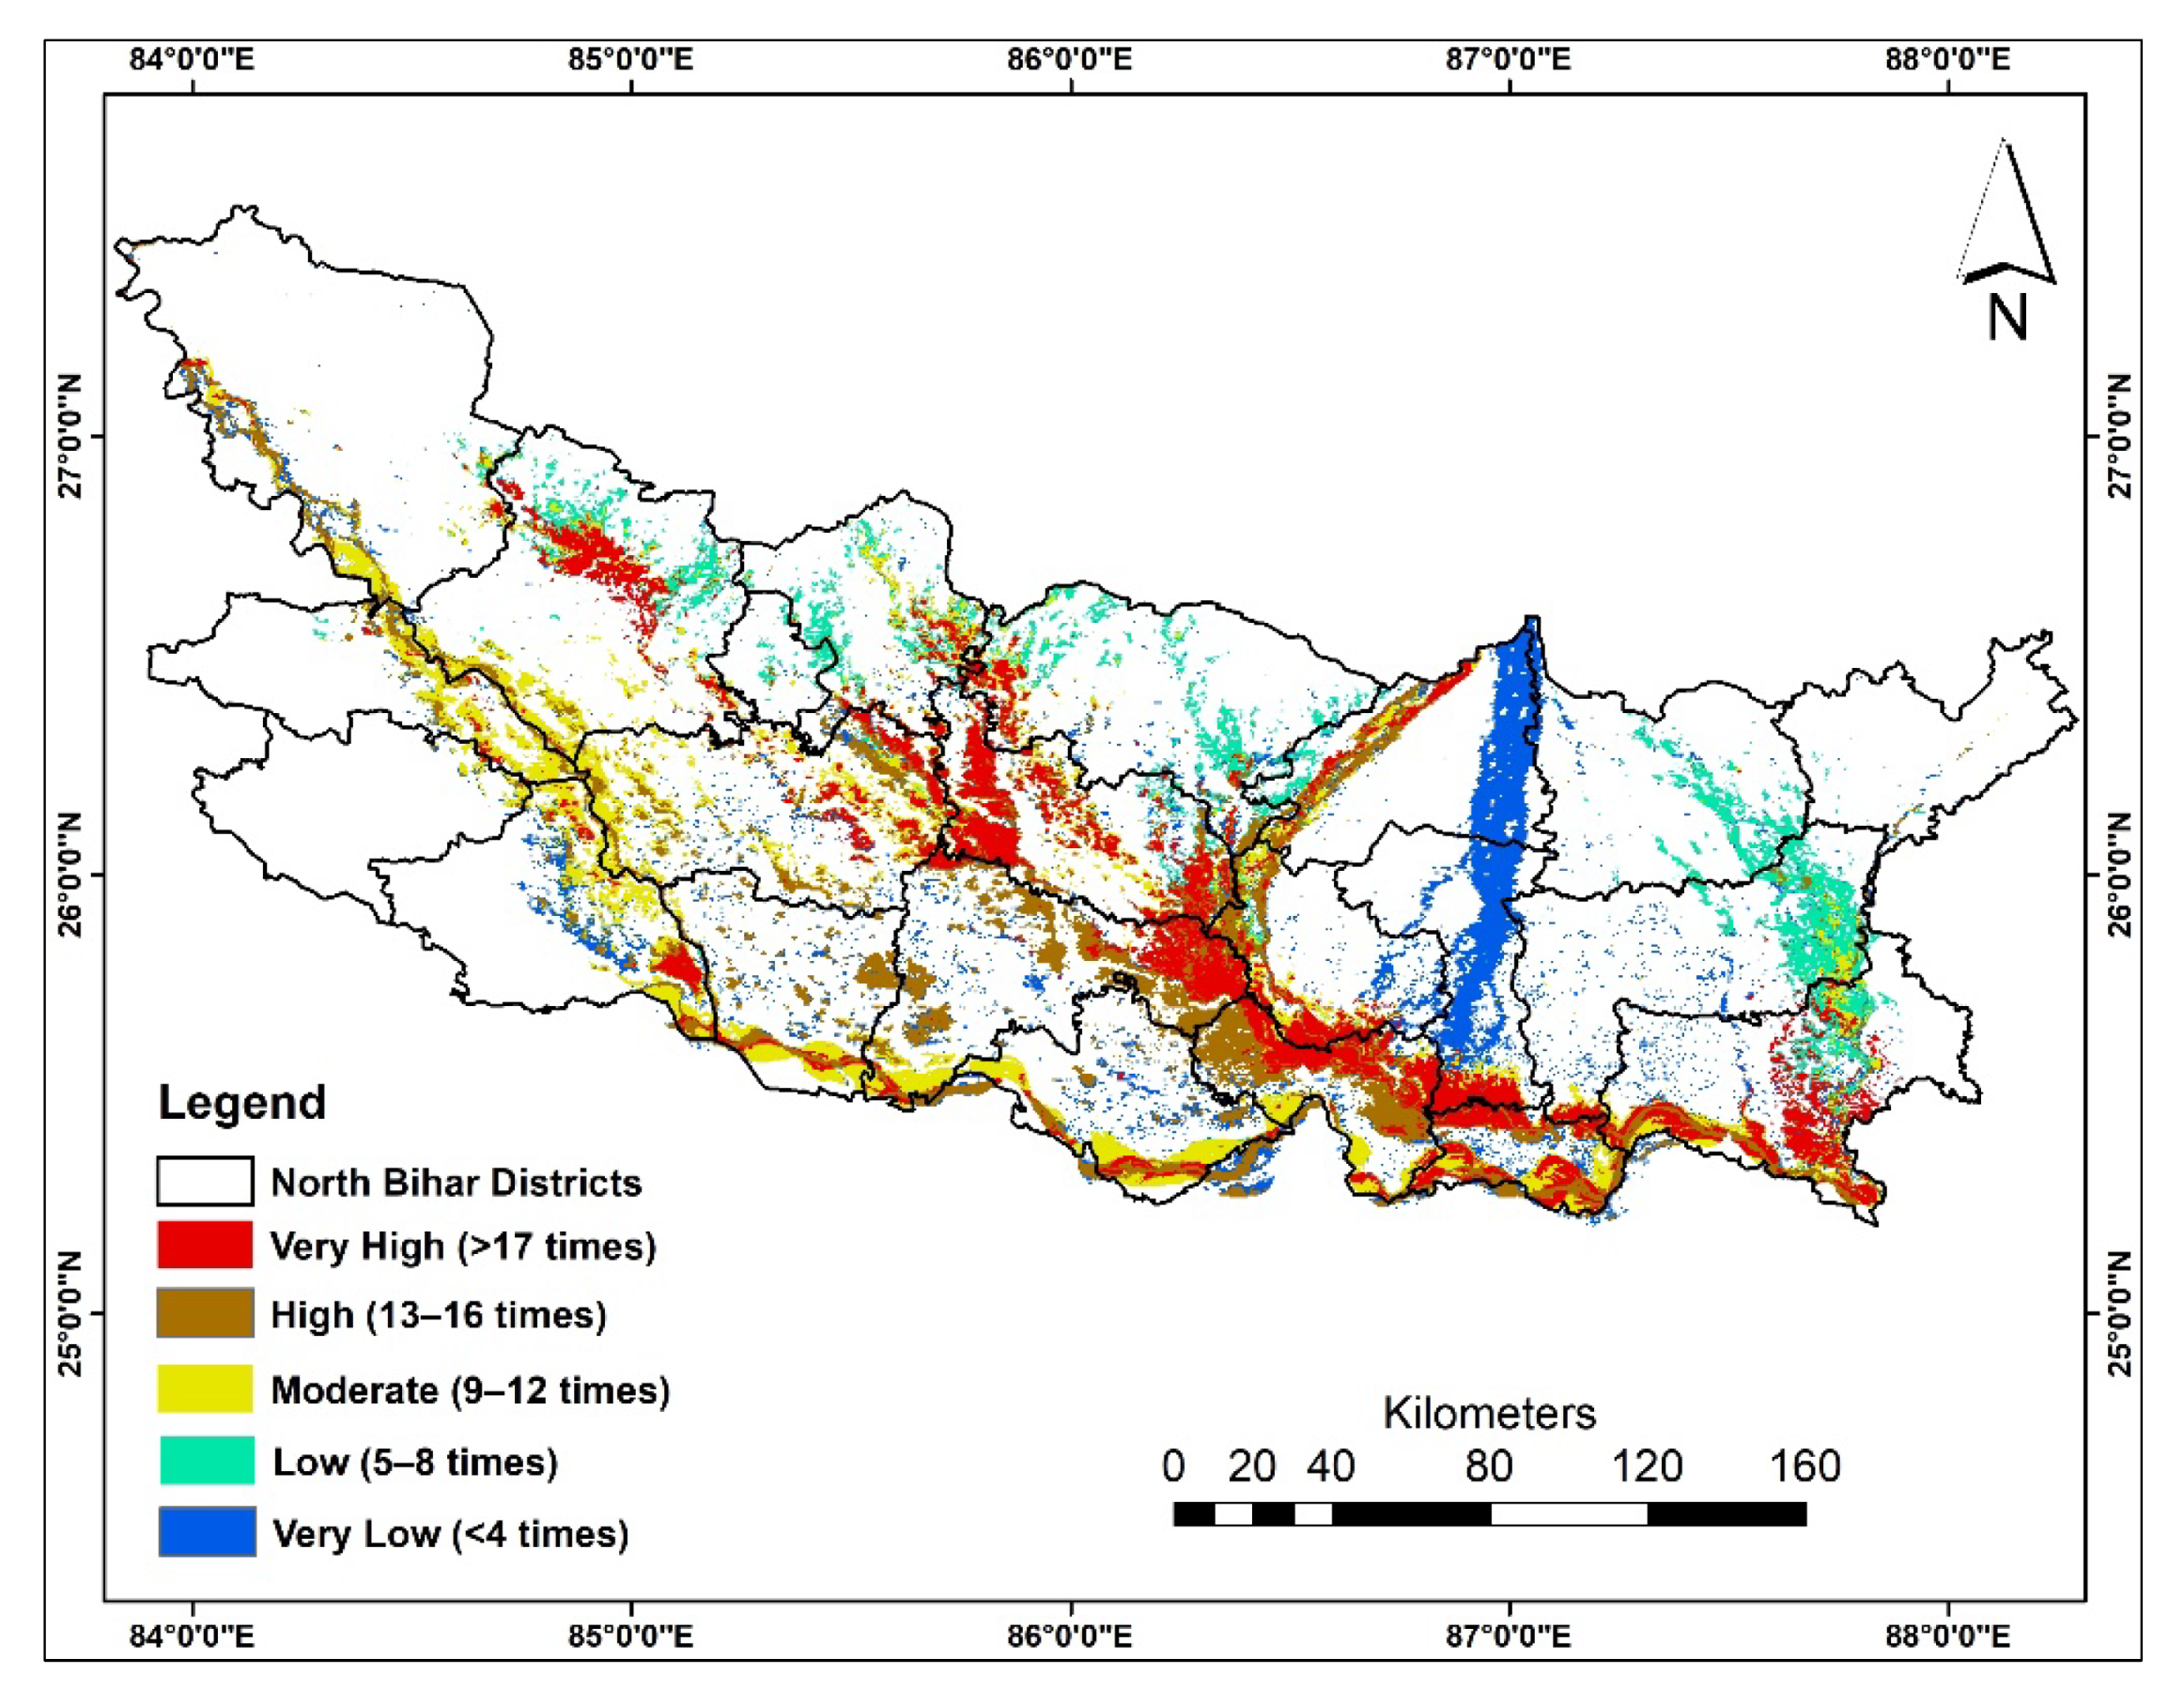
4.3. Flood Hazard Assessment Based on Annual Flood Extent Map during 2001–2020
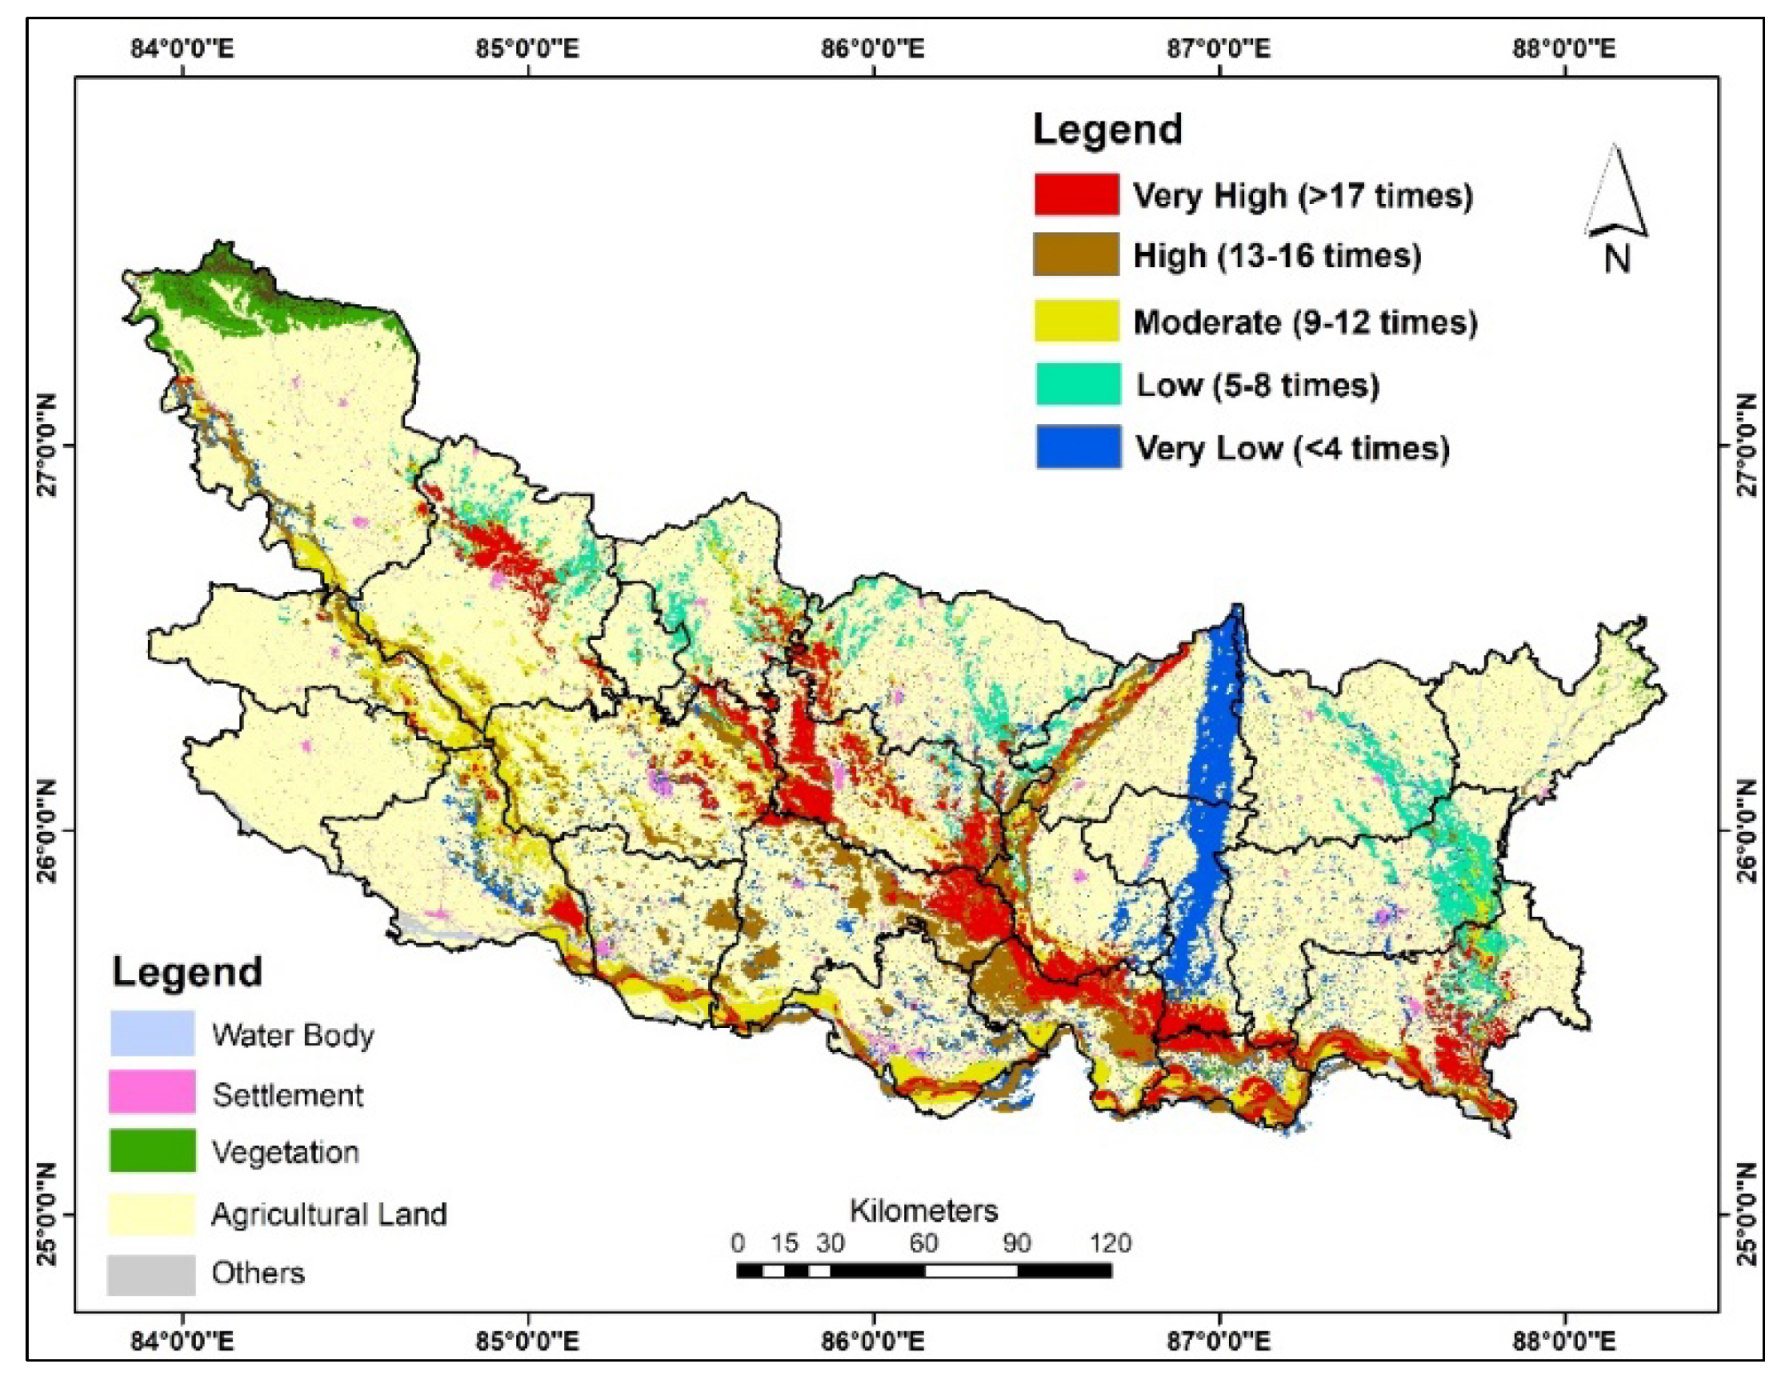
4.4. Flood Impact Assessment on LULC
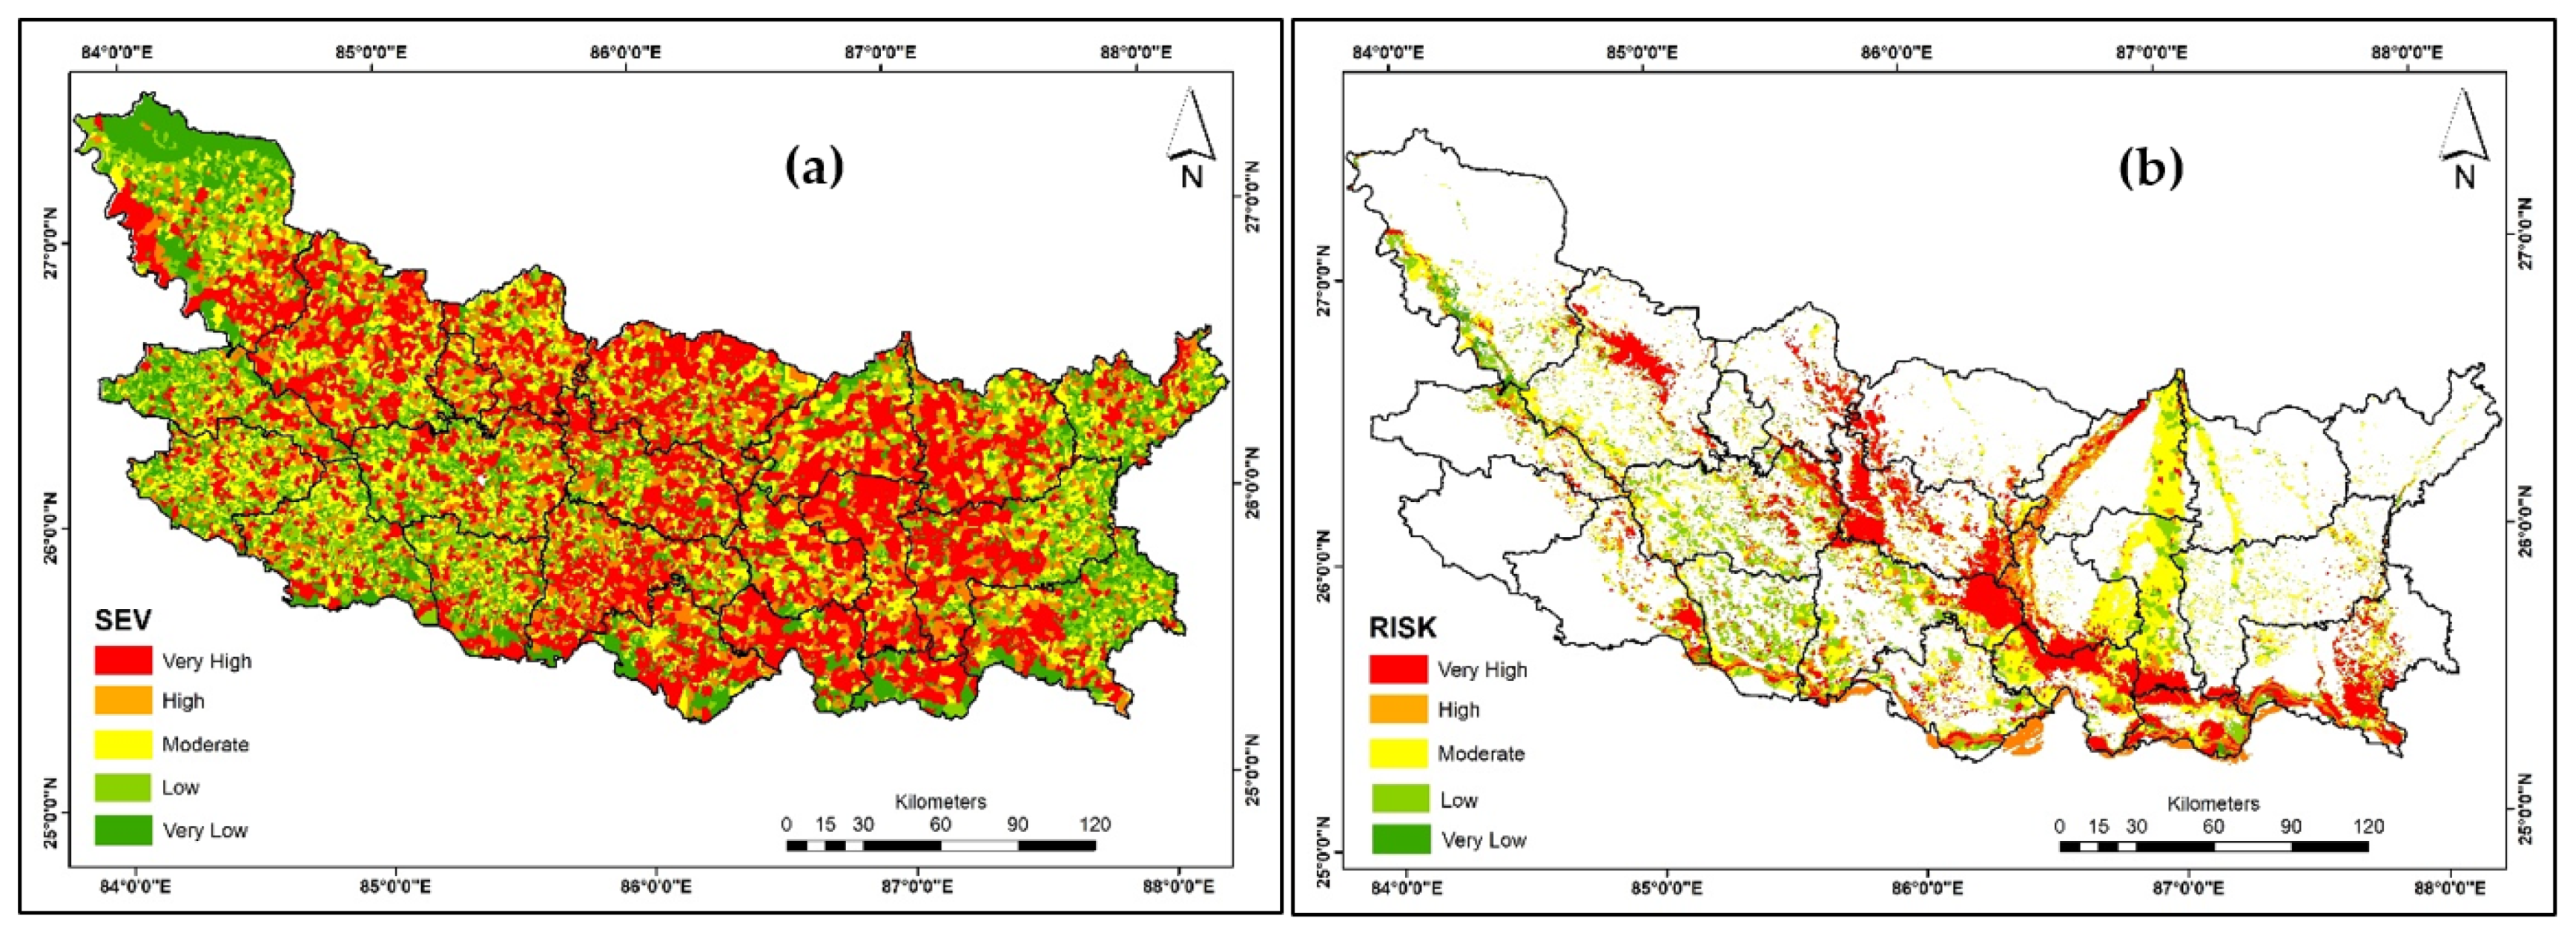
4.5. Socio-Economic Vulnerability (SEV) and Flood Risk Map
5. Discussion
6. Conclusions
Author Contributions
Funding
Institutional Review Board Statement
Informed Consent Statement
Data Availability Statement
Acknowledgments
Conflicts of Interest
Appendix A

References
- Samela, C.; Manfreda, S.; Troy, T.J. Dataset of 100-Year Flood Susceptibility Maps for the Continental U.S. Derived with a Geomorphic Method. Data Brief 2017, 12, 203–207. [Google Scholar] [CrossRef]
- Tripathi, G.; Parida, B.R.; Pandey, A.C. Spatio-Temporal Rainfall Variability and Flood Prognosis Analysis Using Satellite Data over North Bihar during the August 2017 Flood Event. Hydrology 2019, 6, 38. [Google Scholar] [CrossRef] [Green Version]
- Blöschl, G.; Hall, J.; Viglione, A.; Perdigão, R.A.P.; Parajka, J.; Merz, B.; Lun, D.; Arheimer, B.; Aronica, G.T.; Bilibashi, A.; et al. Changing Climate Both Increases and Decreases European River Floods. Nature 2019, 573, 108–111. [Google Scholar] [CrossRef]
- Loukas, A.; Garrote, L.; Vasiliades, L. Hydrological and Hydro-Meteorological Extremes and Related Risk and Uncertainty. Water 2021, 13, 377. [Google Scholar] [CrossRef]
- Haltas, I.; Demir, I.; Yildirim, E.; Oztas, F. A Comprehensive Flood Event Specification and Inventory: 1930–2020 Turkey Case Study. Int. J. Disaster Risk Reduct. 2021, 56, 102086. [Google Scholar] [CrossRef]
- Kulp, S.A.; Strauss, B.H. New Elevation Data Triple Estimates of Global Vulnerability to Sea-Level Rise and Coastal Flooding. Nat. Commun. 2019, 10, 4844. [Google Scholar] [CrossRef] [Green Version]
- Shivaprasad Sharma, S.V.; Sharma, S.; Roy, P.S. Extraction of Detailed Level Flood Hazard Zones Using Multi-Temporal Historical Satellite Data-Sets—A Case Study of Kopili River Basin, Assam, India. Geomat. Nat. Hazards Risk 2017, 8, 792–802. [Google Scholar] [CrossRef] [Green Version]
- IPCC, 2021: Climate Change 2021: The Physical Science Basis. Contribution of Working Group I to the Sixth Assessment Report of the Intergovernmental Panel on Climate Change; Cambridge University Press: Cambridge, UK, 2021.
- Boyaj, A.; Ashok, K.; Ghosh, S.; Devanand, A.; Dandu, G. The Chennai Extreme Rainfall Event in 2015: The Bay of Bengal Connection. Clim. Dyn. 2018, 50, 2867–2879. [Google Scholar] [CrossRef]
- Chandrababu, D. Record Rainfall Wreaks Havoc in Chennai. Hindustan Times New Delhi. 8 November 2021. Available online: https://www.hindustantimes.com/india-news/record-rainfall-wreaks-havoc-in-chennai-101636310510384.html (accessed on 25 November 2021).
- Bisht, D.S.; Chatterjee, C.; Kalakoti, S.; Upadhyay, P.; Sahoo, M.; Panda, A. Modeling Urban Floods and Drainage Using SWMM and MIKE URBAN: A Case Study. Nat. Hazards 2016, 84, 749–776. [Google Scholar] [CrossRef]
- Alahacoon, N.; Matheswaran, K.; Pani, P.; Amarnath, G. A Decadal Historical Satellite Data and Rainfall Trend Analysis (2001–2016) for Flood Hazard Mapping in Sri Lanka. Remote Sens. 2018, 10, 448. [Google Scholar] [CrossRef] [Green Version]
- .Belabid, N.; Zhao, F.; Brocca, L.; Huang, Y.; Tan, Y. Near-Real-Time Flood Forecasting Based on Satellite Precipitation Products. Remote Sens. 2019, 11, 252. [Google Scholar] [CrossRef] [Green Version]
- Rai, P.K.; Singh, P.; Mishra, V.N.; Kumar, J.; Sahoo, S. Monitoring North Bihar Flood of 2020 Using Geospatial Technologies. In It Is Correct Recent Technologies for Disaster Management and Risk Reduction; Earth and Environmental Sciences Library; Springer International Publishing: New York, NY, USA, 2021; pp. 135–155. ISBN 978-3-030-76115-8. [Google Scholar]
- Matheswaran, K.; Alahacoon, N.; Pandey, R.; Amarnath, G. Flood Risk Assessment in South Asia to Prioritize Flood Index Insurance Applications in Bihar, India. Geomat. Nat. Hazards Risk 2019, 10, 26–48. [Google Scholar] [CrossRef] [Green Version]
- Parida, B.R.; Tripathi, G.; Pandey, A.C.; Kumar, A. Estimating Floodwater Depth Using SAR-Derived Flood Inundation Maps and Geomorphic Model in Kosi River Basin (India). Geocarto Int. 2021, 1–26. [Google Scholar] [CrossRef]
- McFeeters, S.K. The Use of the Normalized Difference Water Index (NDWI) in the Delineation of Open Water Features. Int. J. Remote Sens. 1996, 17, 1425–1432. [Google Scholar] [CrossRef]
- Guerschman, J.P.; Warren, G.; Byrne, G.; Lymburner, L.; Mueller, N.; Van Dijk, A.I.J.M. MODIS-Based Standing Water Detection for Flood and Large Reservoir Mapping: Algorithm Development and Applications for the Australian Continent. CSIRO 2011. [Google Scholar] [CrossRef]
- Singh, K.V.; Setia, R.; Sahoo, S.; Prasad, A.; Pateriya, B. Evaluation of NDWI and MNDWI for Assessment of Waterlogging by Integrating Digital Elevation Model and Groundwater Level. Geocarto Int. 2015, 30, 650–661. [Google Scholar] [CrossRef]
- Patel, N.R.; Mukund, A.; Parida, B.R. Satellite-Derived Vegetation Temperature Condition Index to Infer Root Zone Soil Moisture in Semi-Arid Province of Rajasthan, India. Geocarto Int. 2022, 37, 179–195. [Google Scholar] [CrossRef]
- Sakamoto, T.; Van Nguyen, N.; Kotera, A.; Ohno, H.; Ishitsuka, N.; Yokozawa, M. Detecting Temporal Changes in the Extent of Annual Flooding within the Cambodia and the Vietnamese Mekong Delta from MODIS Time-Series Imagery. Remote Sens. Environ. 2007, 109, 295–313. [Google Scholar] [CrossRef]
- Zhou, S.L.; Zhang, W.C. Flood Monitoring and Damage Assessment in Thailand Using Multi-Temporal HJ-1A/1B and MODIS Images. IOP Conf. Ser. Earth Environ. Sci. 2017, 57, 012016. [Google Scholar] [CrossRef]
- Sajjad, A.; Lu, J.; Chen, X.; Saleem, N. Rapid Riverine Flood Mapping with Different Water Indexes Using Flood Instances Landsat-8 Images. In Proceedings of the 5th International Electronic Conference on Water Sciences, Online, 16–30 November 2020; MDPI: Basel, Switzerland, 2020; p. 8049. Available online: http://sciforum.net/conference/ECWS-5/paper/8049 (accessed on 13 November 2020).
- Jain, S.K.; Singh, R.D.; Jain, M.K.; Lohani, A.K. Delineation of Flood-Prone Areas Using Remote Sensing Techniques. Water Resour. Manag. 2005, 19, 333–347. [Google Scholar] [CrossRef]
- Kumar, R.; Singh, R.; Gautam, H.; Pandey, M.K. Flood Hazard Assessment of August 20, 2016 Floods in Satna District, Madhya Pradesh, India. Remote Sens. Appl. Soc. Environ. 2018, 11, 104–118. [Google Scholar] [CrossRef]
- Shakya, A.; Biswas, M.; Pal, M. CNN-Based Fusion and Classification of SAR and Optical Data. Int. J. Remote Sens. 2020, 41, 8839–8861. [Google Scholar] [CrossRef]
- Haque, M.M.; Seidou, O.; Mohammadian, A.; Gado Djibo, A. Development of a Time-Varying MODIS/2D Hydrodynamic Model Relationship between Water Levels and Flooded Areas in the Inner Niger Delta, Mali, West Africa. J. Hydrol. Reg. Stud. 2020, 30, 100703. [Google Scholar] [CrossRef]
- Mekanik, F.; Imteaz, M.A.; Gato-Trinidad, S.; Elmahdi, A. Multiple Regression and Artificial Neural Network for Long-Term Rainfall Forecasting Using Large Scale Climate Modes. J. Hydrol. 2013, 503, 11–21. [Google Scholar] [CrossRef]
- Xu, Z.X.; Li, J.Y. Short-Term Inflow Forecasting Using an Artificial Neural Network Model. Hydrol. Process. 2002, 16, 2423–2439. [Google Scholar] [CrossRef]
- Abbot, J.; Marohasy, J. Input Selection and Optimisation for Monthly Rainfall Forecasting in Queensland, Australia, Using Artificial Neural Networks. Atmos. Res. 2014, 138, 166–178. [Google Scholar] [CrossRef]
- Gizaw, M.S.; Gan, T.Y. Regional Flood Frequency Analysis Using Support Vector Regression under Historical and Future Climate. J. Hydrol. 2016, 538, 387–398. [Google Scholar] [CrossRef]
- Mosavi, A.; Ozturk, P.; Chau, K. Flood Prediction Using Machine Learning Models: Literature Review. Water 2018, 10, 1536. [Google Scholar] [CrossRef] [Green Version]
- Shakya, A.; Biswas, M.; Pal, M. Parametric Study of Convolutional Neural Network Based Remote Sensing Image Classification. Int. J. Remote Sens. 2021, 42, 2663–2685. [Google Scholar] [CrossRef]
- Sinha, R.; Bapalu, G.V.; Singh, L.K.; Rath, B. Flood Risk Analysis in the Kosi River Basin, North Bihar Using Multi-Parametric Approach of Analytical Hierarchy Process (AHP). J. Indian Soc. Remote Sens. 2008, 36, 335–349. [Google Scholar] [CrossRef]
- Mishra, K.; Sinha, R. Flood Risk Assessment in the Kosi Megafan Using Multi-Criteria Decision Analysis: A Hydro-Geomorphic Approach. Geomorphology 2020, 350, 106861. [Google Scholar] [CrossRef]
- Baky, M.A.A.; Islam, M.; Paul, S. Flood Hazard, Vulnerability and Risk Assessment for Different Land Use Classes Using a Flow Model. Earth Syst. Environ. 2020, 4, 225–244. [Google Scholar] [CrossRef] [Green Version]
- Islam, M.M.; Sado, K. Development of Flood Hazard Maps of Bangladesh Using NOAA-AVHRR Images with GIS. Hydrol. Sci. J. 2000, 45, 337–355. [Google Scholar] [CrossRef]
- Jha, R.K.; Gundimeda, H. An Integrated Assessment of Vulnerability to Floods Using Composite Index—A District Level Analysis for Bihar, India. Int. J. Disaster Risk Reduct. 2019, 35, 101074. [Google Scholar] [CrossRef]
- Basheer Ahammed, K.K.; Pandey, A.C. Coastal Social Vulnerability and Risk Analysis for Cyclone Hazard Along the Andhra Pradesh, East Coast of India. KN J. Cartogr. Geogr. Inf. 2019, 69, 285–303. [Google Scholar] [CrossRef] [Green Version]
- Phongsapan, K.; Chishtie, F.; Poortinga, A.; Bhandari, B.; Meechaiya, C.; Kunlamai, T.; Aung, K.S.; Saah, D.; Anderson, E.; Markert, K.; et al. Operational Flood Risk Index Mapping for Disaster Risk Reduction Using Earth Observations and Cloud Computing Technologies: A Case Study on Myanmar. Front. Environ. Sci. 2019, 7, 191. [Google Scholar] [CrossRef] [Green Version]
- Deepak, S.; Rajan, G.; Jairaj, P.G. Geospatial Approach for Assessment of Vulnerability to Flood in Local Self Governments. Geoenviron. Disasters 2020, 7, 35. [Google Scholar] [CrossRef]
- Hazarika, N.; Barman, D.; Das, A.K.; Sarma, A.K.; Borah, S.B. Assessing and Mapping Flood Hazard, Vulnerability and Risk in the Upper Brahmaputra River Valley Using Stakeholders’ Knowledge and Multicriteria Evaluation (MCE): Assessing and Mapping Flood Hazard. J. Flood Risk Manag. 2018, 11, S700–S716. [Google Scholar] [CrossRef]
- Shadmehri Toosi, A.; Calbimonte, G.H.; Nouri, H.; Alaghmand, S. River Basin-Scale Flood Hazard Assessment Using a Modified Multi-Criteria Decision Analysis Approach: A Case Study. J. Hydrol. 2019, 574, 660–671. [Google Scholar] [CrossRef]
- Burn, D.H.; Goel, N.K. The Formation of Groups for Regional Flood Frequency Analysis. Hydrol. Sci. J. 2000, 45, 97–112. [Google Scholar] [CrossRef]
- Roder, G.; Hudson, P.; Tarolli, P. Flood Risk Perceptions and the Willingness to Pay for Flood Insurance in the Veneto Region of Italy. Int. J. Disaster Risk Reduct. 2019, 37, 101172. [Google Scholar] [CrossRef]
- Hudson, P.; Botzen, W.J.W.; Aerts, J.C.J.H. Flood Insurance Arrangements in the European Union for Future Flood Risk under Climate and Socioeconomic Change. Glob. Environ. Chang. 2019, 58, 101966. [Google Scholar] [CrossRef] [Green Version]
- Masood, M.; Takeuchi, K. Assessment of Flood Hazard, Vulnerability and Risk of Mid-Eastern Dhaka Using DEM and 1D Hydrodynamic Model. Nat. Hazards 2012, 61, 757–770. [Google Scholar] [CrossRef]
- Hoque, M.A.-A.; Ahmed, N.; Pradhan, B.; Roy, S. Assessment of Coastal Vulnerability to Multi-Hazardous Events Using Geospatial Techniques along the Eastern Coast of Bangladesh. Ocean. Coast. Manag. 2019, 181, 104898. [Google Scholar] [CrossRef]
- Bhatt, C.M.; Gupta, A.; Roy, A.; Dalal, P.; Chauhan, P. Geospatial Analysis of September, 2019 Floods in the Lower Gangetic Plains of Bihar Using Multi-Temporal Satellites and River Gauge Data. Geomat. Nat. Hazards Risk 2021, 12, 84–102. [Google Scholar] [CrossRef]
- Manjusree, P.; Bhatt, C.M.; Begum, A.; Rao, G.S.; Bhanumurthy, V. A Decadal Historical Satellite Data Analysis for Flood Hazard Evaluation: A Case Study of Bihar (North India). Singap. J. Trop. Geogr. 2015, 36, 308–323. [Google Scholar] [CrossRef]
- Tripathi, G.; Pandey, A.C.; Parida, B.R.; Shakya, A. Comparative Flood Inundation Mapping Utilizing Multi-Temporal Optical and SAR Satellite Data Over North Bihar Region: A Case Study of 2019 Flooding Event Over North Bihar. In Spatial Information Science for Natural Resource Management; Advances in Environmental Engineering and Green Technologies; IGI Publisher: Hershey, PA, USA, 2020; p. 20. ISBN 978-1-79985-027-4. [Google Scholar]
- Pandey, A.C.; Singh, S.K.; Nathawat, M.S. Waterlogging and Flood Hazards Vulnerability and Risk Assessment in Indo Gangetic Plain. Nat. Hazards 2010, 55, 273–289. [Google Scholar] [CrossRef]
- Gaurav, K.; Métivier, F.; Devauchelle, O.; Sinha, R.; Chauvet, H.; Houssais, M.; Bouquerel, H. Morphology of the Kosi Megafan Channels. Earth Surf. Dyn. 2015, 3, 321–331. [Google Scholar] [CrossRef] [Green Version]
- Tripathi, G.; Pandey, A.C.; Parida, B.R.; Kumar, A. Flood Inundation Mapping and Impact Assessment Using Multi-Temporal Optical and SAR Satellite Data: A Case Study of 2017 Flood in Darbhanga District, Bihar, India. Water Resour. Manag. 2020, 34, 1871–1892. [Google Scholar] [CrossRef]
- Xu, H. Modification of Normalised Difference Water Index (NDWI) to Enhance Open Water Features in Remotely Sensed Imagery. Int. J. Remote Sens. 2006, 27, 3025–3033. [Google Scholar] [CrossRef]
- Jiang, Z.; Huete, A.; Didan, K.; Miura, T. Development of a Two-Band Enhanced Vegetation Index without a Blue Band. Remote Sens. Environ. 2008, 112, 3833–3845. [Google Scholar] [CrossRef]
- Parida, B.R.; Kumari, A. Mapping and Modeling Mangrove Biophysical and Biochemical Parameters Using Sentinel-2A Satellite Data in Bhitarkanika National Park, Odisha. Model. Earth Syst. Environ. 2021, 7, 2463–2474. [Google Scholar] [CrossRef]
- Cutter, S.L. The Vulnerability of Science and the Science of Vulnerability. Ann. Assoc. Am. Geogr. 2003, 93, 1–12. [Google Scholar] [CrossRef]
- Sarkar, D.; Saha, S.; Mondal, P. GIS-Based Frequency Ratio and Shannon’s Entropy Techniques for Flood Vulnerability Assessment in Patna District, Central Bihar, India. Int. J. Environ. Sci. Technol. 2021, 1–22. [Google Scholar] [CrossRef]
- Singh, S.K.; Pandey, A.C. Geomorphology and the Controls of Geohydrology on Waterlogging in Gangetic Plains, North Bihar, India. Environ. Earth Sci. 2014, 71, 1561–1579. [Google Scholar] [CrossRef]
- Gaurav, K.; Tandon, S.K.; Devauchelle, O.; Sinha, R.; Métivier, F. A Single Width–Discharge Regime Relationship for Individual Threads of Braided and Meandering Rivers from the Himalayan Foreland. Geomorphology 2017, 295, 126–133. [Google Scholar] [CrossRef] [Green Version]
- Amarnath, G.; Matheswaran, K.; Pandey, P.; Alahacoon, N.; Yoshimoto, S. Flood mapping tools for disaster preparedness and emergency response using satellite data and hydrodynamic models: A case study of Bagmathi Basin, India. Proc. Natl. Acad. Sci. India Sect. A Phys. Sci. 2017, 4, 941–950. [Google Scholar] [CrossRef]


| Name of Dataset | Temporal Resolution | Spatial Resolution | Acquisition Date | Purpose | Source |
|---|---|---|---|---|---|
| MOD09A1 | 8 days | 500 × 500 m | July–October (2000–2020) | Flood delineation | LP DAAC |
| Sentinel–2A/B | 12 days | 10 × 10 m | March–June (2020) | PWB and major/minor River channel, lineaments, and road | ASF |
| PDIR-Now | 3–hourly | 4 × 4 km | July–Sept (2000–2020) | Rainfall and anomaly maps | CHRS Data Portal |
| Copernicus LULC | Composite | 100 × 100 m | – | LULC map | Copernicus |
| ALOS PALSAR DEM | Composite | 12.5 × 12.5 m | – | Relief map | ASF |
| Census data | 10 years | – | – | Socio-economic vulnerability mapping | Census of India |
| FMISC Flood Reports | – | – | July–October (2000–2020) | To validate flooding for the respective years | FMISC, Patna |
| Sl. No. | Equations | Reference/Source | |
|---|---|---|---|
| 1. | NDWI = (Green − NIR)/(Green + NIR) | (1) | [17] |
| 2. | mNDWI = (Green − SWIR)/(Green + SWIR) | (2) | [55] |
| 3. | SPWI = (B1 + B4) − (B2 − B6) Where, B1, B2, B4, B6 are the reflectance of band Red, NIR, Green, and MIR respectively | (3) | [22] |
| 4. | EVI = 2.5* ((NIR − R)/(NIR + (6*RED) − (7.5*BLUE) + 1)) | (4) | [56] |
| Flood Hazard Category | Flood Frequency |
|---|---|
| Very High | ≥17 times |
| High | 13–16 times |
| Moderate | 09–12 times |
| Low | 05–08 times |
| Very Low | ≤04 times |
| Sl. No. | Hazard Category | Flood Hazard Area (in km2) | % Inundation (with Respect to the Geographical Area) | % Inundation (with Respect to the Total Inundation) |
|---|---|---|---|---|
| 1. | Very High (>17) | 3687.13 | 6.8 | 19.8 |
| 2. | High (13–16) | 4328.67 | 8 | 23.2 |
| 3. | Moderate (9–12) | 3188.36 | 5.9 | 17.1 |
| 4. | Low (5–8) | 4169.11 | 7.7 | 22.4 |
| 5. | Very Low (<4) | 3266.97 | 6.03 | 17.5 |
| Hazard Category | Water Body | Settlement | Vegetation | Agriculture | Others |
|---|---|---|---|---|---|
| Vey High | 322.8 (8.9%) | 122.4 (2.2%) | 402.1 (3.7%) | 2366.9 (8.6%) | 473.1 (7.2%) |
| High | 371.6 (10.2%) | 137 (2.5%) | 587.3 (5.5%) | 2746.4 (9.9%) | 486.4 (7.4%) |
| Moderate | 298.6 (8.2%) | 98.1 (1.8%) | 428.7 (4%) | 2126.4 (7.7%) | 236.6 (3.6%) |
| Low | 227.3 (6.2%) | 108.5 (1.9%) | 536.3 (5%) | 2837.5 (10.3%) | 459.5 (7%) |
| Very Low | 267.3 (7.3%) | 95.4 (1.7%) | 356.1 (3.3%) | 2331.4 (8.4%) | 216.9 (3.3%) |
| Category | SEV | Flood Risk |
|---|---|---|
| Vey High | 4719 | 2770 |
| High | 3571 | 3535 |
| Moderate | 6391 | 5094 |
| Low | 4218 | 1297 |
| Very Low | 4733 | 896 |
Publisher’s Note: MDPI stays neutral with regard to jurisdictional claims in published maps and institutional affiliations. |
© 2022 by the authors. Licensee MDPI, Basel, Switzerland. This article is an open access article distributed under the terms and conditions of the Creative Commons Attribution (CC BY) license (https://creativecommons.org/licenses/by/4.0/).
Share and Cite
Tripathi, G.; Pandey, A.C.; Parida, B.R. Flood Hazard and Risk Zonation in North Bihar Using Satellite-Derived Historical Flood Events and Socio-Economic Data. Sustainability 2022, 14, 1472. https://doi.org/10.3390/su14031472
Tripathi G, Pandey AC, Parida BR. Flood Hazard and Risk Zonation in North Bihar Using Satellite-Derived Historical Flood Events and Socio-Economic Data. Sustainability. 2022; 14(3):1472. https://doi.org/10.3390/su14031472
Chicago/Turabian StyleTripathi, Gaurav, Arvind Chandra Pandey, and Bikash Ranjan Parida. 2022. "Flood Hazard and Risk Zonation in North Bihar Using Satellite-Derived Historical Flood Events and Socio-Economic Data" Sustainability 14, no. 3: 1472. https://doi.org/10.3390/su14031472
APA StyleTripathi, G., Pandey, A. C., & Parida, B. R. (2022). Flood Hazard and Risk Zonation in North Bihar Using Satellite-Derived Historical Flood Events and Socio-Economic Data. Sustainability, 14(3), 1472. https://doi.org/10.3390/su14031472