
Google Earth Engine for Large-Scale Flood Mapping Using SAR Data and Impact Assessment on Agriculture and Population of Ganga-Brahmaputra Basin


Abstract
1. Introduction
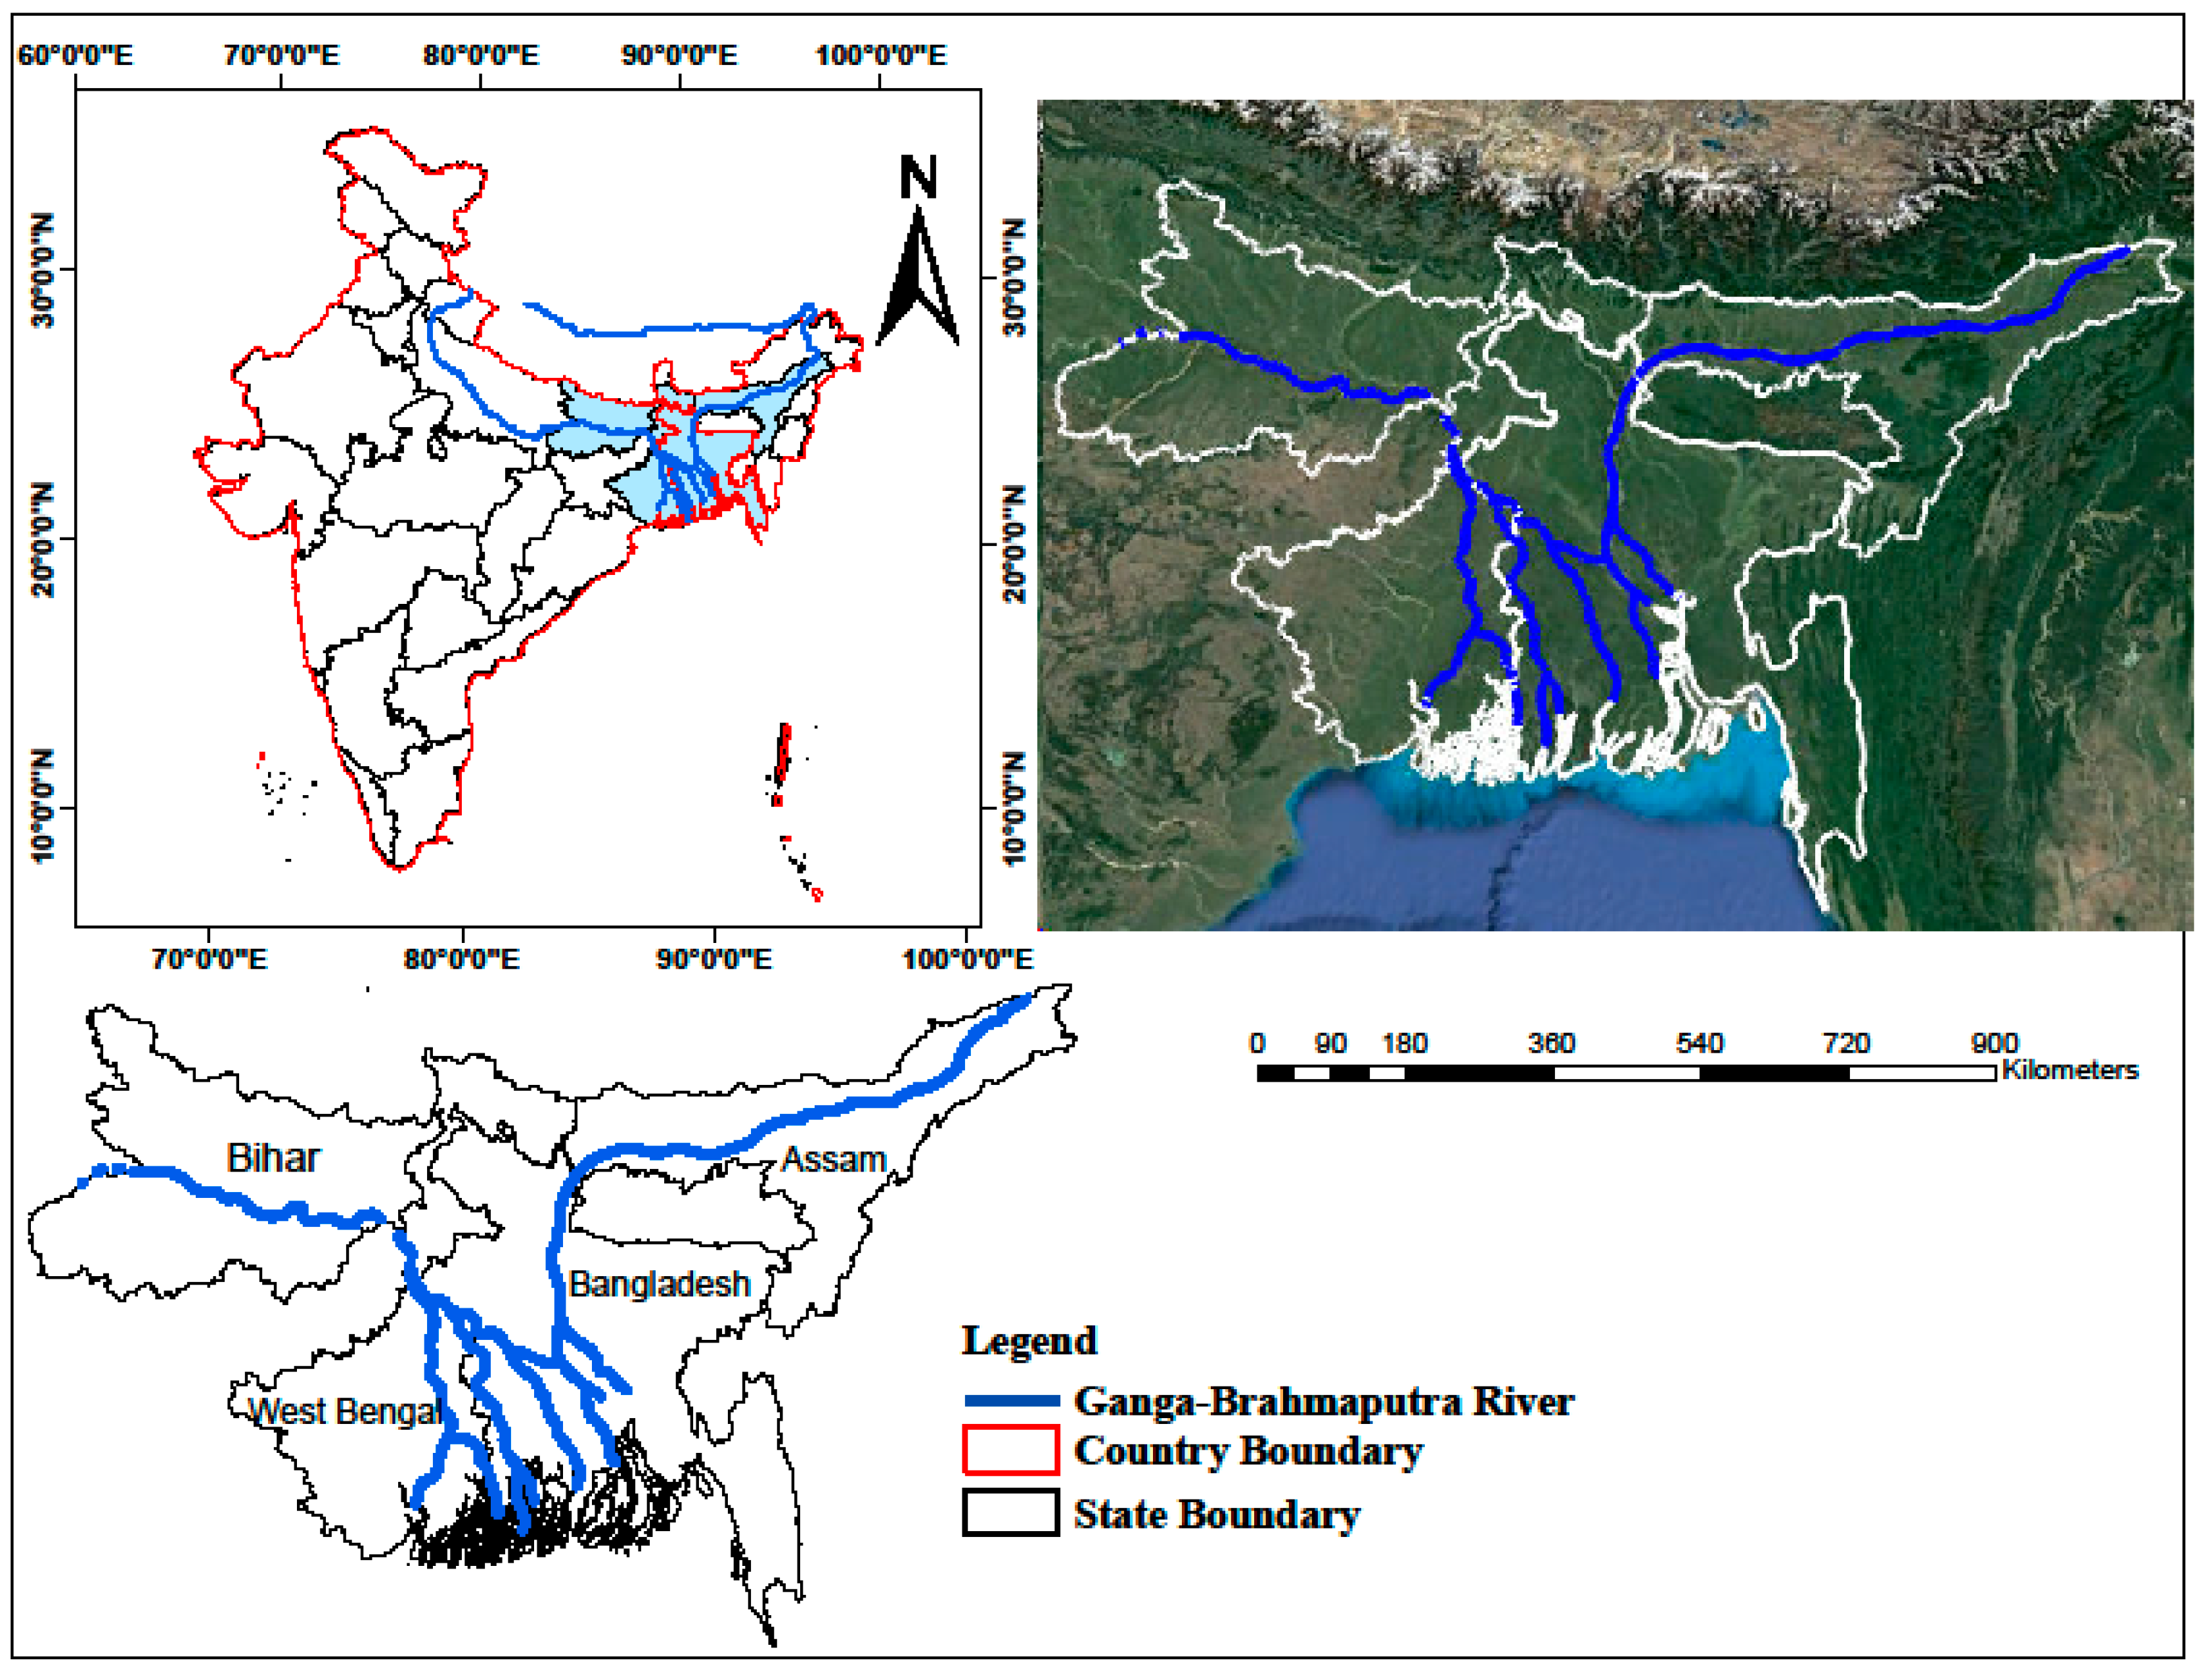
2. Study Area
3. Materials and Methods
Data Used
4. Methodology
5. Results
5.1. Rainfall Distribution and Anomaly during 2020 Flood Event (July to September)
5.2. Flood Extent in 2020 as Derived from SAR Data
5.3. Flood Inundation Impact on Cropland and Settlement
5.4. Flood Inundation Impact on Population
6. Discussion
7. Conclusions
Author Contributions
Funding
Institutional Review Board Statement
Informed Consent Statement
Data Availability Statement
Conflicts of Interest
Appendix A


References
- Mirza, M.M.Q. Climate change, flooding in South Asia and implications. Reg. Environ. Change 2010, 11, 95–107. [Google Scholar] [CrossRef]
- Gangopadhyay, P.K.; Sharma, B.R.; Pavelic, P. Co-solving Groundwater Depletion and Seasonal Flooding Through an Innovative Managed Aquifer Recharge Approach: Converting Pilot to a Regional Solution in the Ram Ganga Sub-basin. In Clean and Sustainable Groundwater in India; Springer: Berlin/Heidelberg, Germany, 2017; pp. 173–189. [Google Scholar]
- Garg, P.K.; Garg, R.D. Geospatial techniques for flood inundation mapping. In Proceedings of the 2016 IEEE International Geoscience and Remote Sensing Symposium (IGARSS), Beijing, China, 10–15 July 2016; Institute of Electrical and Electronics Engineers (IEEE): Piscataway, NJ, USA, 2016; pp. 4387–4390. [Google Scholar]
- Sahoo, S.N.; Sreeja, P. Development of Flood Inundation Maps and Quantification of Flood Risk in an Urban Catchment of Brahmaputra River. ASCE-ASME J. Risk Uncertain. Eng. Syst. Part A Civ. Eng. 2017, 3. [Google Scholar] [CrossRef]
- Cohen, S.; Brakenridge, G.R.; Kettner, A.; Bates, B.; Nelson, J.; McDonald, R.; Huang, Y.-F.; Munasinghe, D.; Zhang, J. Estimating Floodwater Depths from Flood Inundation Maps and Topography. JAWRA J. Am. Water Resour. Assoc. 2017, 54, 847–858. [Google Scholar] [CrossRef]
- Chutiya, D.; Hazarika, N.; Das, P. Adjusting to Floods on the Brahmaputra Plains, Assam, India; International Centre for Integrated Mountain Development (ICIMOD): Kathmandu, Nepal, 2009. [Google Scholar]
- Wallemacq, P.; McClean, D. The Human Cost of Weather-Related Disasters 1995–2015. Technical Note 2015, 1–30. Available online: https://www.unisdr.org/files/46796_cop21weatherdisastersreport2015.pdf (accessed on 4 January 2022).
- Luo, T.; Maddocks, A.; Iceland, C.; Ward, P.; Winsemius, H. World’s 15 Countries with the Most People Exposed to River Floods. US-Based World Resources Institute (WRI). 2015. Available online: https://www.wri.org/insights/worlds-15-countries-most-people-exposed-river-floods (accessed on 21 December 2021).
- Khan, S.; Sinha, R.; Whitehead, P.; Sarkar, S.; Jin, L.; Futter, M.N. Flows and sediment dynamics in the Ganga River under present and future climate scenarios. Hydrol. Sci. J. 2018, 63, 763–782. [Google Scholar] [CrossRef]
- Rudra, K. Changing river courses in the western part of the Ganga–Brahmaputra delta. Geomorphology 2014, 227, 87–100. [Google Scholar] [CrossRef]
- Milliman, J.D.; Farnsworth, K.L. River Discharge to the Coastal Ocean; Cambridge University Press: New York, NY, USA, 2011. [Google Scholar]
- Kundzewicz, Z.; Kanae, S.; Seneviratne, S.; Handmer, J.; Nicholls, N.; Peduzzi, P.; Mechler, R.; Bouwer, L.M.; Arnell, N.; Mach, K.; et al. Flood risk and climate change: Global and regional perspectives. Hydrol. Sci. J. 2013, 59, 1–28. [Google Scholar] [CrossRef]
- Immerzeel, W. Historical trends and future predictions of climate variability in the Brahmaputra basin. Int. J. Clim. 2007, 28, 243–254. [Google Scholar] [CrossRef]
- Baruah, U.D.; Saikia, A.; Robeson, S.M.; Mili, N.; Chand, P. Perceptions and adaptation behavior of farmers to climate change in the upper Brahmaputra Valley, India. Environ. Dev. Sustain. 2021, 23, 15529–15549. [Google Scholar] [CrossRef]
- Patel, A.; Goswami, A.; Dharpure, J.K.; Thamban, M. Rainfall variability over the Indus, Ganga, and Brahmaputra river basins: A spatio-temporal characterisation. Quat. Int. 2020, 575–576, 280–294. [Google Scholar] [CrossRef]
- Khalequzzaman Recent floods in Bangladesh: Possible causes and solutions. Nat. Hazards 1994, 9, 65–80. [CrossRef]
- Kale, V.S. Geomorphic Effects of Monsoon Floods on Indian Rivers. Nat. Hazards 2003, 28, 65–84. [Google Scholar] [CrossRef]
- Mirza, M.M.Q. Floods in Bangladesh: History, Dynamics and Rethinking the Role of the Himalayas. Environ. Conserv. 2007, 34, 348. [Google Scholar] [CrossRef]
- Johnson, F.A.; Hutton, C.W. Dependence on agriculture and ecosystem services for livelihood in Northeast India and Bhutan: Vulnerability to climate change in the Tropical River Basins of the Upper Brahmaputra. Clim. Chang. 2012, 127, 107–121. [Google Scholar] [CrossRef]
- Lal, P.; Prakash, A.; Kumar, A. Google Earth Engine for concurrent flood monitoring in the lower basin of Indo-Gangetic-Brahmaputra plains. Nat. Hazards 2020, 104, 1947–1952. [Google Scholar] [CrossRef]
- Deka Rajib, L. Climate Change in the Brahmaputra Valley and Impact on Rice and Tea Productivity. Ph.D. Thesis, Centre for the Environment, Indian Institute of Technology, Guwahati, India, 2013. [Google Scholar]
- Singh, R.B.; Pandey, B.W.; Prasad, A.S. Adaptation Strategies for Flood Risk Mitigation in Lower Brahmaputra River Basin, Assam through Integrated River Basin Management. Trans. Inst. Indian Geogr. 2014, 36, 159–170. [Google Scholar]
- Ives, J.D. Deforestation in the Himalayas: The cause of increased flooding in Bangladesh and Northern India? Land Use Policy 1989, 6, 187–193. [Google Scholar] [CrossRef]
- Islam, M.; Parvin, S.; Farukh, M. Impacts of riverbank erosion hazards in the Brahmaputra floodplain areas of Mymensingh in Bangladesh. Progress. Agric. 2017, 28, 73–83. [Google Scholar] [CrossRef]
- Demir, V.; Kisi, O. Flood Hazard Mapping by Using Geographic Information System and Hydraulic Model: Mert River, Samsun, Turkey. Adv. Meteorol. 2016, 2016, 4891015. [Google Scholar] [CrossRef]
- Jeyaseelan, A.T. Droughts & Floods Assessment and Monitoring Using Remote Sensing and GIS. In Satellite Remote Sensing and GIS Applications in Agricultural Meteorology; World Meteorological Organisation: Geneva, Switzerland, 2003; Available online: http://www.wamis.org/agm/pubs/agm8/Paper-14.pdf (accessed on 23 December 2021).
- Amarnath, G. An algorithm for rapid flood inundation mapping from optical data using a reflectance differencing technique. J. Flood Risk Manag. 2013, 7, 239–250. [Google Scholar] [CrossRef]
- Tiwari, V.; Kumar, V.; Matin, M.A.; Thapa, A.; Ellenburg, W.L.; Gupta, N.; Thapa, S. Flood inundation mapping- Kerala 2018; Harnessing the power of SAR, automatic threshold detection method and Google Earth Engine. PLoS ONE 2020, 15, e0237324. [Google Scholar] [CrossRef]
- Cohen, S.; Raney, A.; Munasinghe, D.; Loftis, J.D.; Molthan, A.; Bell, J.; Rogers, L.; Galantowicz, J.; Brakenridge, G.R.; Kettner, A.J.; et al. The Floodwater Depth Estimation Tool (FwDET v2.0) for improved remote sensing analysis of coastal flooding. Nat. Hazards Earth Syst. Sci. 2019, 19, 2053–2065. [Google Scholar] [CrossRef]
- Islam, A.S.; Bala, S.; Haque, M. Flood inundation map of Bangladesh using MODIS time-series images. J. Flood Risk Manag. 2010, 3, 210–222. [Google Scholar] [CrossRef]
- Tripathi, G.; Pandey, A.C.; Parida, B.R.; Kumar, A. Flood Inundation Mapping and Impact Assessment Using Multi-Temporal Optical and SAR Satellite Data: A Case Study of 2017 Flood in Darbhanga District, Bihar, India. Water Resour. Manag. 2020, 34, 1871–1892. [Google Scholar] [CrossRef]
- Huang, M.; Jin, S. Rapid Flood Mapping and Evaluation with a Supervised Classifier and Change Detection in Shouguang Using Sentinel-1 SAR and Sentinel-2 Optical Data. Remote Sens. 2020, 12, 2073. [Google Scholar] [CrossRef]
- Patcoava, M.C.; Stancalie, G.; Raducanu, D. The Using of Satellite Image Data from Optic and Microwaves Data for Development of a Methodology for Identification and Extraction of Flooded Area. Int. Arch. Photogramm. Remote Sens. 2000, XXXIII, 1185–1190. [Google Scholar]
- Khan, S.I.; Hong, Y.; Wang, J.; Yilmaz, K.K.; Gourley, J.J.; Adler, R.F.; Brakenridge, G.R.; Policelli, F.; Habib, S.; Irwin, D. Satellite Remote Sensing and Hydrologic Modeling for Flood Inundation Mapping in Lake Victoria Basin: Implications for Hydrologic Prediction in Ungauged Basins. IEEE Trans. Geosci. Remote Sens. 2011, 49, 85–95. [Google Scholar] [CrossRef]
- Matgen, P.; Hostache, R.; Schumann, G.; Pfister, L.; Hoffmann, L.; Savenije, H. Towards an automated SAR-based flood monitoring system: Lessons learned from two case studies. Phys. Chem. Earth Parts A/B/C 2011, 36, 241–252. [Google Scholar] [CrossRef]
- Anusha, N.; Bharathi, B. Flood detection and flood mapping using multi-temporal synthetic aperture radar and optical data. Egypt. J. Remote Sens. Space Sci. 2019, 23, 207–219. [Google Scholar] [CrossRef]
- Agnihotri, A.K.; Ohri, A.; Gaur, S.; Shivam; Das, N.; Mishra, S. Flood inundation mapping and monitoring using SAR data and its impact on Ramganga River in Ganga basin. Environ. Monit. Assess. 2019, 191, 760. [Google Scholar] [CrossRef]
- Joyce, K.E.; Belliss, S.E.; Samsonov, S.V.; McNeill, S.J.; Glassey, P.J. A review of the status of satellite remote sensing and image processing techniques for mapping natural hazards and disasters. Prog. Phys. Geogr. Earth Environ. 2009, 33, 183–207. [Google Scholar] [CrossRef]
- Parida, B.R.; Tripathi, G.; Pandey, A.C.; Kumar, A. Estimating floodwater depth using SAR-derived flood inundation maps and geomorphic model in kosi river basin (India). Geocarto Int. 2021, 1–26. [Google Scholar] [CrossRef]
- Tripathi, G.; Pandey, A.C.; Parida, B.R.; Shakya, A. Comparative Flood Inundation Mapping Utilizing Multi-Temporal Optical and SAR Satellite Data Over North Bihar Region: A Case Study of 2019 Flooding Event Over North Bihar. In Spatial Information Science for Natural Resource Management; IGI Global: Hershey, PA, USA, 2020; pp. 149–168. ISBN 978-1-79985-028-1. [Google Scholar]
- Uddin, K.; Matin, M.A.; Meyer, F.J. Operational Flood Mapping Using Multi-Temporal Sentinel-1 SAR Images: A Case Study from Bangladesh. Remote Sens. 2019, 11, 1581. [Google Scholar] [CrossRef]
- Gorelick, N.; Hancher, M.; Dixon, M.; Ilyushchenko, S.; Thau, D.; Moore, R. Google Earth Engine: Planetary-scale geospatial analysis for everyone. Remote Sens. Environ. 2017, 202, 18–27. [Google Scholar] [CrossRef]
- ASDMA Assam State Disaster Management Plan. 2010, 1–195. Available online: http://asdma.gov.in/pdf/asdmp.pdf (accessed on 24 November 2021).
- Water Resources by Government of Assam, India. Available online: https://waterresources.assam.gov.in/ (accessed on 5 December 2021).
- Samal, N.R.; Roy, P.K.; Majumadar, M.; Bhattacharya, S.; Biswasroy, M. Six Years Major Historical Urban Floods in West Bengal State in India: Comparative Analysis Using Neuro-Genetic Model. Am. J. Water Resour. 2014, 2, 41–53. [Google Scholar] [CrossRef][Green Version]
- Dewan, T.H. Societal impacts and vulnerability to floods in Bangladesh and Nepal. Weather Clim. Extremes 2014, 7, 36–42. [Google Scholar] [CrossRef]
- Abatzoglou, J.T.; Dobrowski, S.; Parks, S.A.; Hegewisch, K.C. TerraClimate, a high-resolution global dataset of monthly climate and climatic water balance from 1958–2015. Sci. Data 2018, 5, 170191. [Google Scholar] [CrossRef]
- Schiavina, M.; Freire, S.; MacManus, K. GHS-POP R2019A - GHS Population Grid Multitemporal (1975-1990-2000-2015). Eur. Comm. Jt. Res. Cent. 2019. [Google Scholar] [CrossRef]
- UN WPP-Adjusted Population Density, v4.11: Gridded Population of the World (GPW), v4; Center for International Earth Science Information Network—CIESIN—Columbia University: New York, NY, USA, 2018. [CrossRef]
- Buchhorn, M.; Smets, B.; Bertels, L.; De Roo, B.; Lesiv, M.; Tsendbazar, N.-E.; Herold, M.; Fritz, S. Copernicus Global Land Service: Land Cover 100m: Collection 3: Epoch 2019: Globe. OpenAIRE 2020. [Google Scholar] [CrossRef]
- Conde, F.C.; Muñoz, M.D.M. Flood Monitoring Based on the Study of Sentinel-1 SAR Images: The Ebro River Case Study. Water 2019, 11, 2454. [Google Scholar] [CrossRef]
- Martinis, S.; Rieke, C. Backscatter Analysis Using Multi-Temporal and Multi-Frequency SAR Data in the Context of Flood Mapping at River Saale, Germany. Remote Sens. 2015, 7, 7732–7752. [Google Scholar] [CrossRef]
- Fan, J.; Sun, W.; Zhao, Y.; Xue, B.; Zuo, D.; Xu, Z. Trend Analyses of Extreme Precipitation Events in the Yarlung Zangbo River Basin, China Using a High-Resolution Precipitation Product. Sustainability 2018, 10, 1396. [Google Scholar] [CrossRef]
- Loukas, A.; Garrote, L.; Vasiliades, L. Hydrological and Hydro-Meteorological Extremes and Related Risk and Uncertainty. Water 2021, 13, 377. [Google Scholar] [CrossRef]
- Janes, T.; McGrath, F.; Macadam, I.; Jones, R. High-resolution climate projections for South Asia to inform climate impacts and adaptation studies in the Ganges-Brahmaputra-Meghna and Mahanadi deltas. Sci. Total Environ. 2018, 650, 1499–1520. [Google Scholar] [CrossRef] [PubMed]
- Arshad, M.; Ma, X.; Yin, J.; Ullah, W.; Liu, M.; Ullah, I. Performance evaluation of ERA-5, JRA-55, MERRA-2, and CFS-2 reanalysis datasets, over diverse climate regions of Pakistan. Weather Clim. Extremes 2021, 33, 100373. [Google Scholar] [CrossRef]
- Barman, S.; Bhattacharjya, R.K. Change in snow cover area of Brahmaputra river basin and its sensitivity to temperature. Environ. Syst. Res. 2015, 4, 16. [Google Scholar] [CrossRef]
- Zhang, Y.; Xu, C.-Y.; Hao, Z.; Zhang, L.; Ju, Q.; Lai, X. Variation of Melt Water and Rainfall Runoff and Their Impacts on Streamflow Changes during Recent Decades in Two Tibetan Plateau Basins. Water 2020, 12, 3112. [Google Scholar] [CrossRef]
- Yi, S.; Song, C.; Heki, K.; Kang, S.; Wang, Q.; Chang, L. Substantial Meltwater Contribution to the Brahmaputra Revealed by Satellite Gravimetry. Cryosphere Discuss. 2019, 2, 1–23. [Google Scholar] [CrossRef]
- Tripathi, G.; Parida, B.R.; Pandey, A.C. Spatio-Temporal Rainfall Variability and Flood Prognosis Analysis Using Satellite Data over North Bihar during the August 2017 Flood Event. Hydrology 2019, 6, 38. [Google Scholar] [CrossRef]
- Amarnath, G.; Matheswaran, K.; Pandey, P.; Alahacoon, N.; Yoshimoto, S. Flood Mapping Tools for Disaster Preparedness and Emergency Response Using Satellite Data and Hydrodynamic Models: A Case Study of Bagmathi Basin, India. Proc. Natl. Acad. Sci. India Sect. A Phys. Sci. 2017, 87, 941–950. [Google Scholar] [CrossRef]
- Tripathi, G.; Pandey, A.C.; Parida, B.R. Flood Hazard and Risk Zonation in North Bihar Using Satellite-Derived Historical Flood Events and Socio-Economic Data. Sustainability 2022, 14, 1472. [Google Scholar] [CrossRef]
- Devrani, R.; Srivastava, P.; Kumar, R.; Kasana, P. Characterization and assessment of flood inundated areas of lower Brahmaputra River Basin using multitemporal Synthetic Aperture Radar data: A case study from NE India. Geol. J. 2021, 57, 622–646. [Google Scholar] [CrossRef]
- Ghosh, S.; Dutta, S. Impact of climate change on flood characteristics in Brahmaputra basin using a macro-scale distributed hydrological model. J. Earth Syst. Sci. 2012, 121, 637–657. [Google Scholar] [CrossRef]
- Modeling, F.; Sensing, R.; Images, S. Application of Remote Sensing and Gis for Flood Risk Analysis: A Case Study at Kalu- Ganga River, Sri Lanka. Int. Arch. Photogramm. Remote Sens. Spat. Inf. Sci. 2010, XXXVIII, 110–115. [Google Scholar]
- Freire, S.; MacManus, K.; Pesaresi, M.; Doxsey-Whitfield, E.; Mills, J. Development of New Open and Free Multi-Temporal Global Population Grids at 250 m Resolution. In Proceedings of the The 19th AGILE conference on Geographic Information Science, Helsinki, Finland, 14–17 June 2016. [Google Scholar]
- Cutter, S.L.; Schumann, R.L.; Emrich, C.T. Exposure, Social Vulnerability and Recovery Disparities in New Jersey after Hurricane Sandy. J. Extreme Events 2014, 1, 1450002. [Google Scholar] [CrossRef]
- Tate, E.; Rahman, A.; Emrich, C.T.; Sampson, C.C. Flood exposure and social vulnerability in the United States. Nat. Hazards 2021, 106, 435–457. [Google Scholar] [CrossRef]


| States/Country | Flood Events | Source |
|---|---|---|
| Assam | 1954, 1962, 1966, 1972, 1974, 1977, 1978, 1983, 1984, 1988, 1998, 2000, 2002, 2004, 2012, 2013, 2015, 2016, 2017, 2018, 2019, 2020, 2021 | [44] |
| Bihar | 1987, 1995, 1998, 2000, 2001, 2003, 2004, 2008, 2010, 2013, 2016, 2017, 2018, 2019, 2020, 2021 | [31,40] |
| West Bengal | 1913, 1942, 1954, 1965, 1956, 1959, 1978, 1993, 1995, 1999, 2000, 2001, 2002, 2005, 2006, 2010, 2012, 2013, 2014, 2016, 2018, 2019, 2020, 2021 | [45] |
| Bangladesh | 1842, 1858, 1871, 1875, 1885, 1892, 1948, 1953, 1954, 1955, 1956, 1962, 1963, 1968, 1970, 1971, 1974, 1984, 1987, 1988, 1993, 1995, 1998, 1999, 2004, 2006, 2007, 2010, 2011, 2014, 2015, 2017, 2019, 2020, 2021 | [46] |
| Dataset Used | Spatial/Temporal Resolution | Acquisition Date | Purpose | Source |
|---|---|---|---|---|
| Sentinel-1A (SAR) | 10 m, 12 days | July–September (2020) March 2020 | Flood extent mapping Pre-flood images | ESA |
| Landsat-8 (OLI) | 30 m, 16 days | March 2020 July–September (2020) | Pre-flood images during-flood images for validation | Earth Explorer |
| TerraClimate: Rainfall | 4 km, monthly | July–September (1990–2020) | Rainfall distribution Rainfall anomaly | [47] |
| GHSLs: population | 9 arcsec | 2015 | Affected population | [48] |
| GPW v4: population density | 1 km | 2020 | Population density | [49] |
| Copernicus global Land Cover | 100 m | 2019 | Affected LULC extraction | [50] |
| Study Area | Total Area (km2) | Inundated Area (km2) | Composite Area (km2) (%) | ||
|---|---|---|---|---|---|
| July | August | September | |||
| Assam | 78,431.2 | 12,173.5 | 4215.54 | 3007.10 | 13,460.1 (17.16%) |
| Bihar | 94,234.6 | 18,424.8 | 8679.91 | 5025.71 | 20,837 (22.11%) |
| West Bengal | 85,194.9 | 12,917.5 | 9368.75 | 1439.34 | 17,307 (20.31%) |
| Bangladesh | 139,846 | 30,734.47 | 21,569.4 | 15,615.42 | 25,889 (18.51%) |
| Total | 397,706.7 | 74,250.27 (18.67%) | 43,833.6 (11%) | 25,087.57 (6.3%) | 77,493.1 (19.48%) |
| States | Total Cropland (km2) | Affected Cropland (km2) (%) | Total Built-Up (km2) | Affected Built-Up (km2) (%) | Affected under Others (km2) |
|---|---|---|---|---|---|
| Assam | 43,678.78 | 12,439.56 (28.47%) | 8213.44 | 751.86 (9.15%) | 268.68 |
| Bihar | 81,112.49 | 19,911.18 (24.54%) | 10,908.93 | 796.01 (7.29%) | 129.81 |
| West Bengal | 64,823.88 | 15,969.33 (24.63%) | 15,049.51 | 852.1 (5.66%) | 485.57 |
| Bangladesh | 95,468.85 | 22,614 (23.68%) | 27,734.92 | 1610.75 (5.80%) | 1664.25 |
| Study Area | Total Population | Affected Population |
|---|---|---|
| Assam | 33.50 million | 3.2 million |
| Bihar | 115.92 million | 11.79 million |
| West Bengal | 97.13 million | 1.4 million |
| Bangladesh | 160.10 million | 6.9 million |
Publisher’s Note: MDPI stays neutral with regard to jurisdictional claims in published maps and institutional affiliations. |
© 2022 by the authors. Licensee MDPI, Basel, Switzerland. This article is an open access article distributed under the terms and conditions of the Creative Commons Attribution (CC BY) license (https://creativecommons.org/licenses/by/4.0/).
Share and Cite
Pandey, A.C.; Kaushik, K.; Parida, B.R. Google Earth Engine for Large-Scale Flood Mapping Using SAR Data and Impact Assessment on Agriculture and Population of Ganga-Brahmaputra Basin. Sustainability 2022, 14, 4210. https://doi.org/10.3390/su14074210
Pandey AC, Kaushik K, Parida BR. Google Earth Engine for Large-Scale Flood Mapping Using SAR Data and Impact Assessment on Agriculture and Population of Ganga-Brahmaputra Basin. Sustainability. 2022; 14(7):4210. https://doi.org/10.3390/su14074210
Chicago/Turabian StylePandey, Arvind Chandra, Kavita Kaushik, and Bikash Ranjan Parida. 2022. "Google Earth Engine for Large-Scale Flood Mapping Using SAR Data and Impact Assessment on Agriculture and Population of Ganga-Brahmaputra Basin" Sustainability 14, no. 7: 4210. https://doi.org/10.3390/su14074210
APA StylePandey, A. C., Kaushik, K., & Parida, B. R. (2022). Google Earth Engine for Large-Scale Flood Mapping Using SAR Data and Impact Assessment on Agriculture and Population of Ganga-Brahmaputra Basin. Sustainability, 14(7), 4210. https://doi.org/10.3390/su14074210