
Clogging Risk Early Warning for Slurry Shield Tunneling in Mixed Mudstone–Gravel Ground: A Real-Time Self-Updating Machine Learning Approach


Abstract
:1. Introduction
2. Literature Review
2.1. Clogging Judgment Criterion and Tunneling Parameter Variation Due to Clogging
2.2. Application of RF-Based Prediction Model
3. Methodology and Material
3.1. Methodology
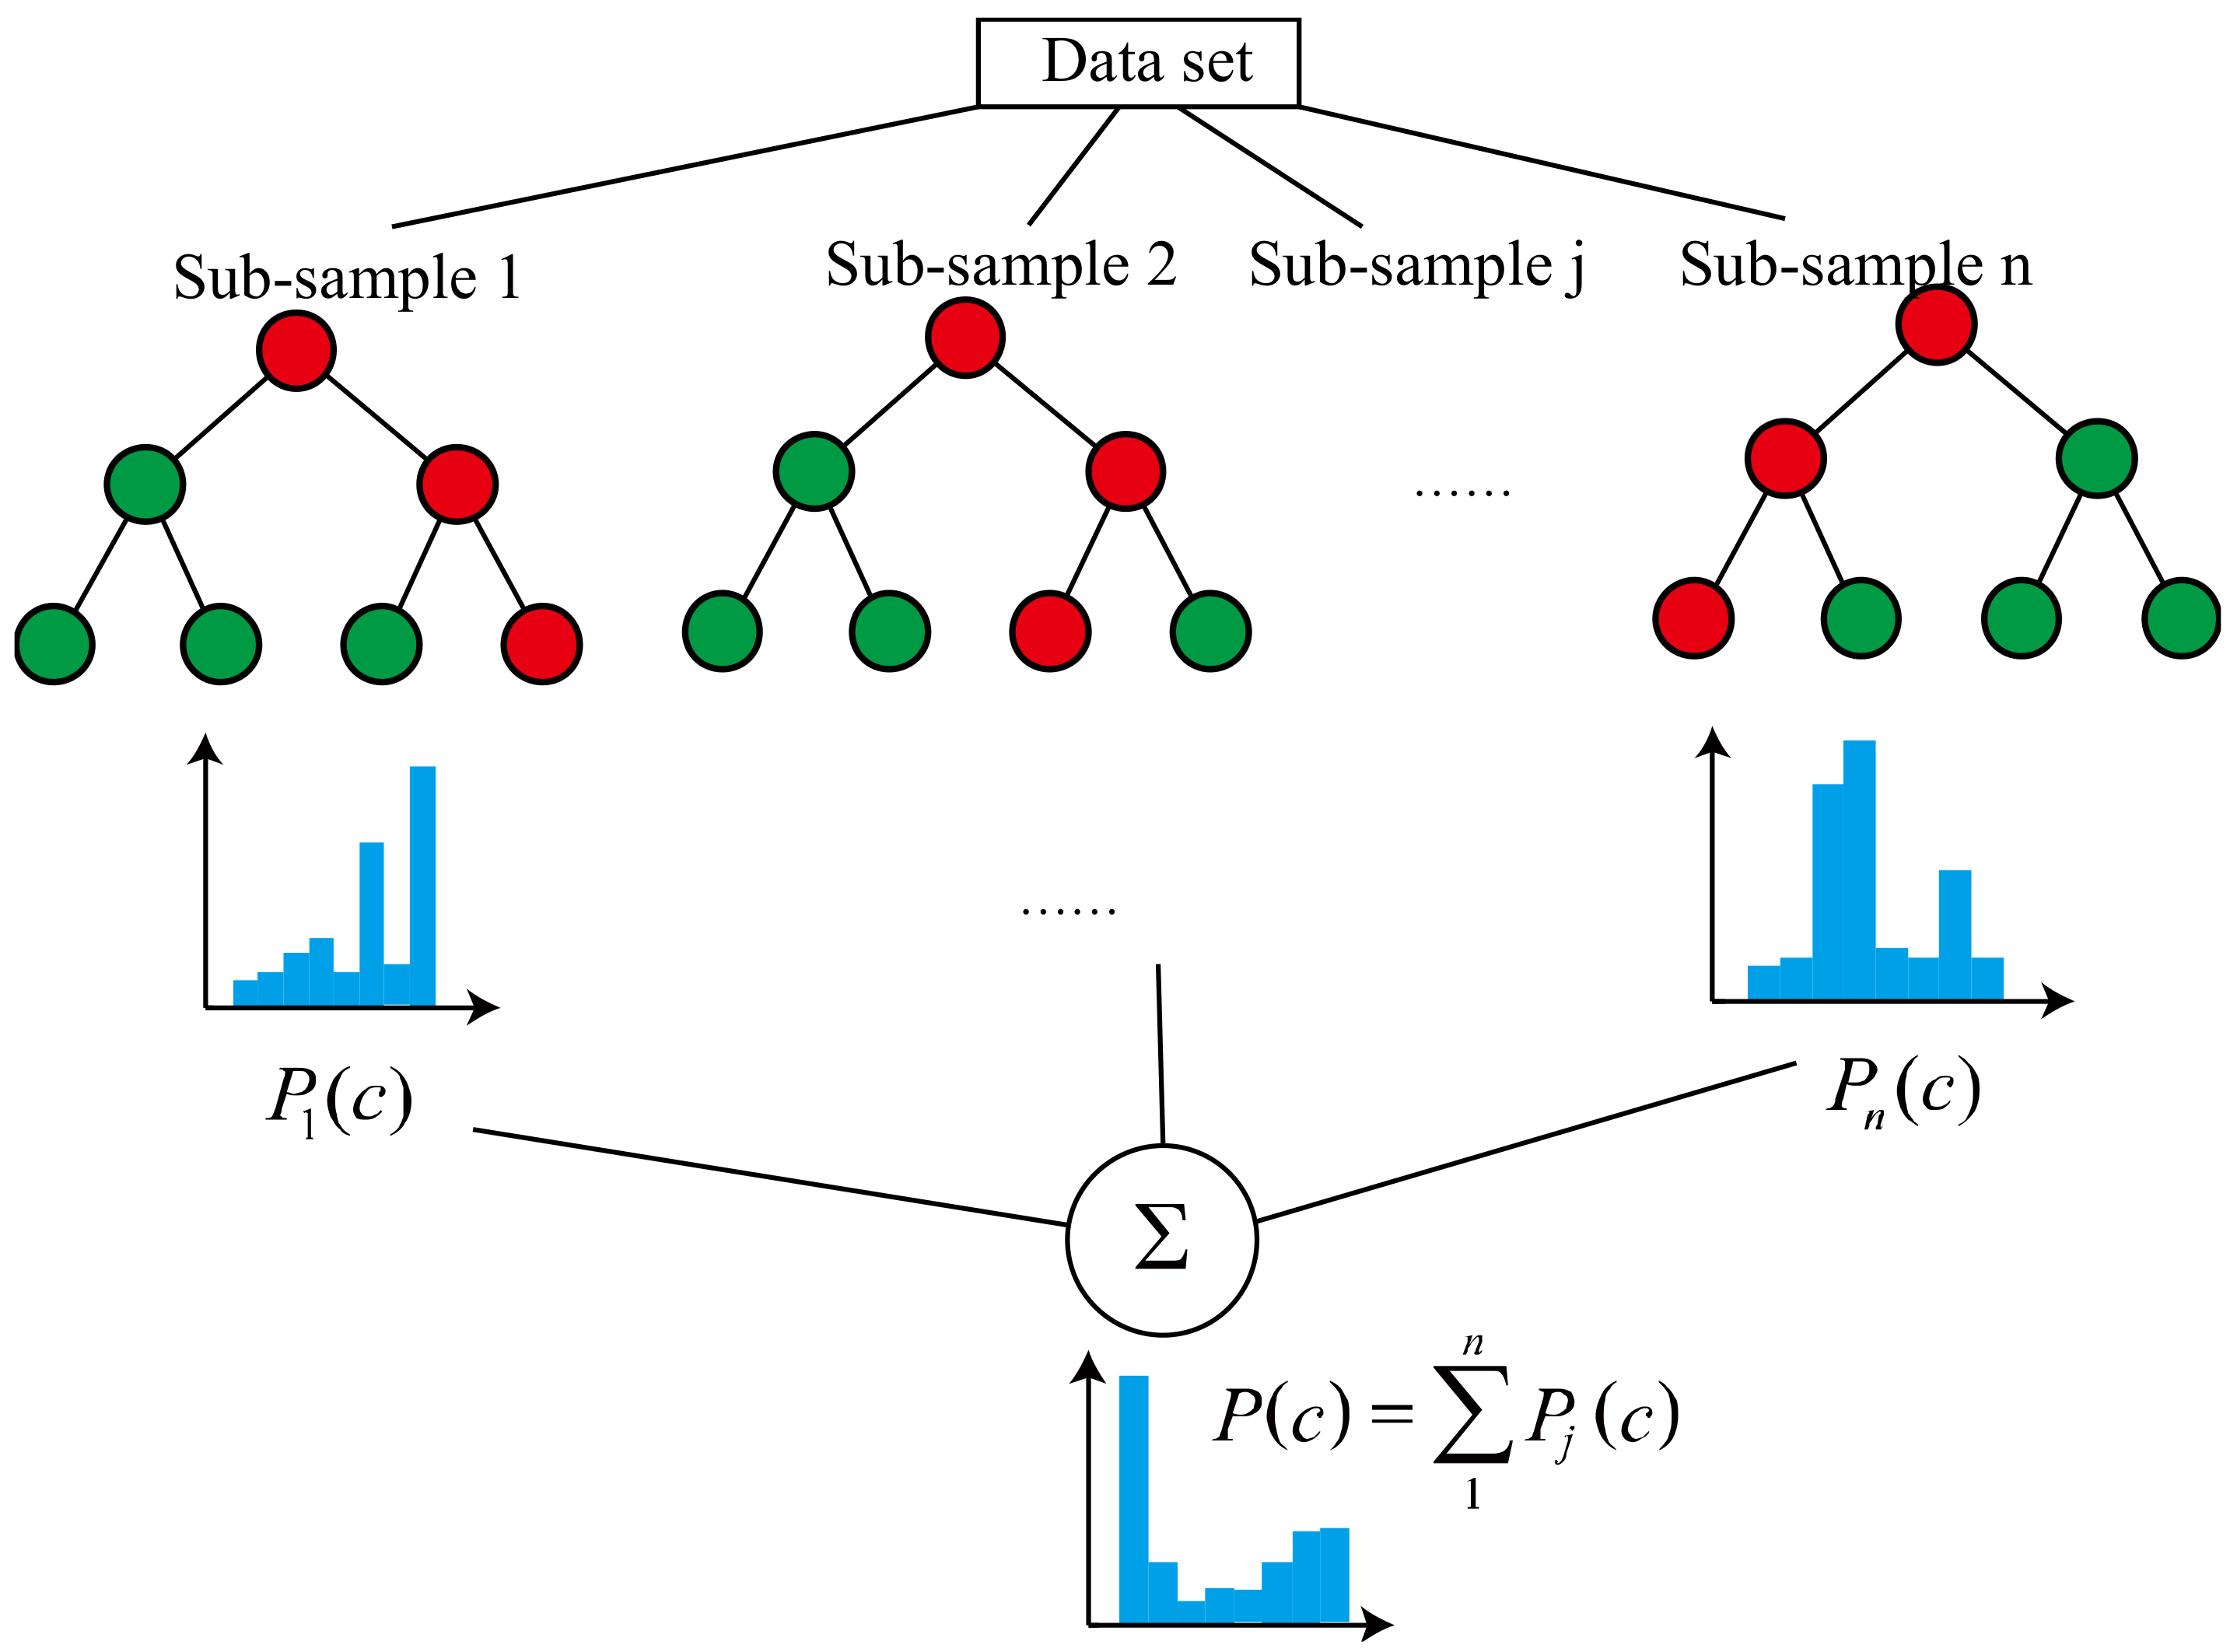
3.1.1. Random Forest (RF) Classifier
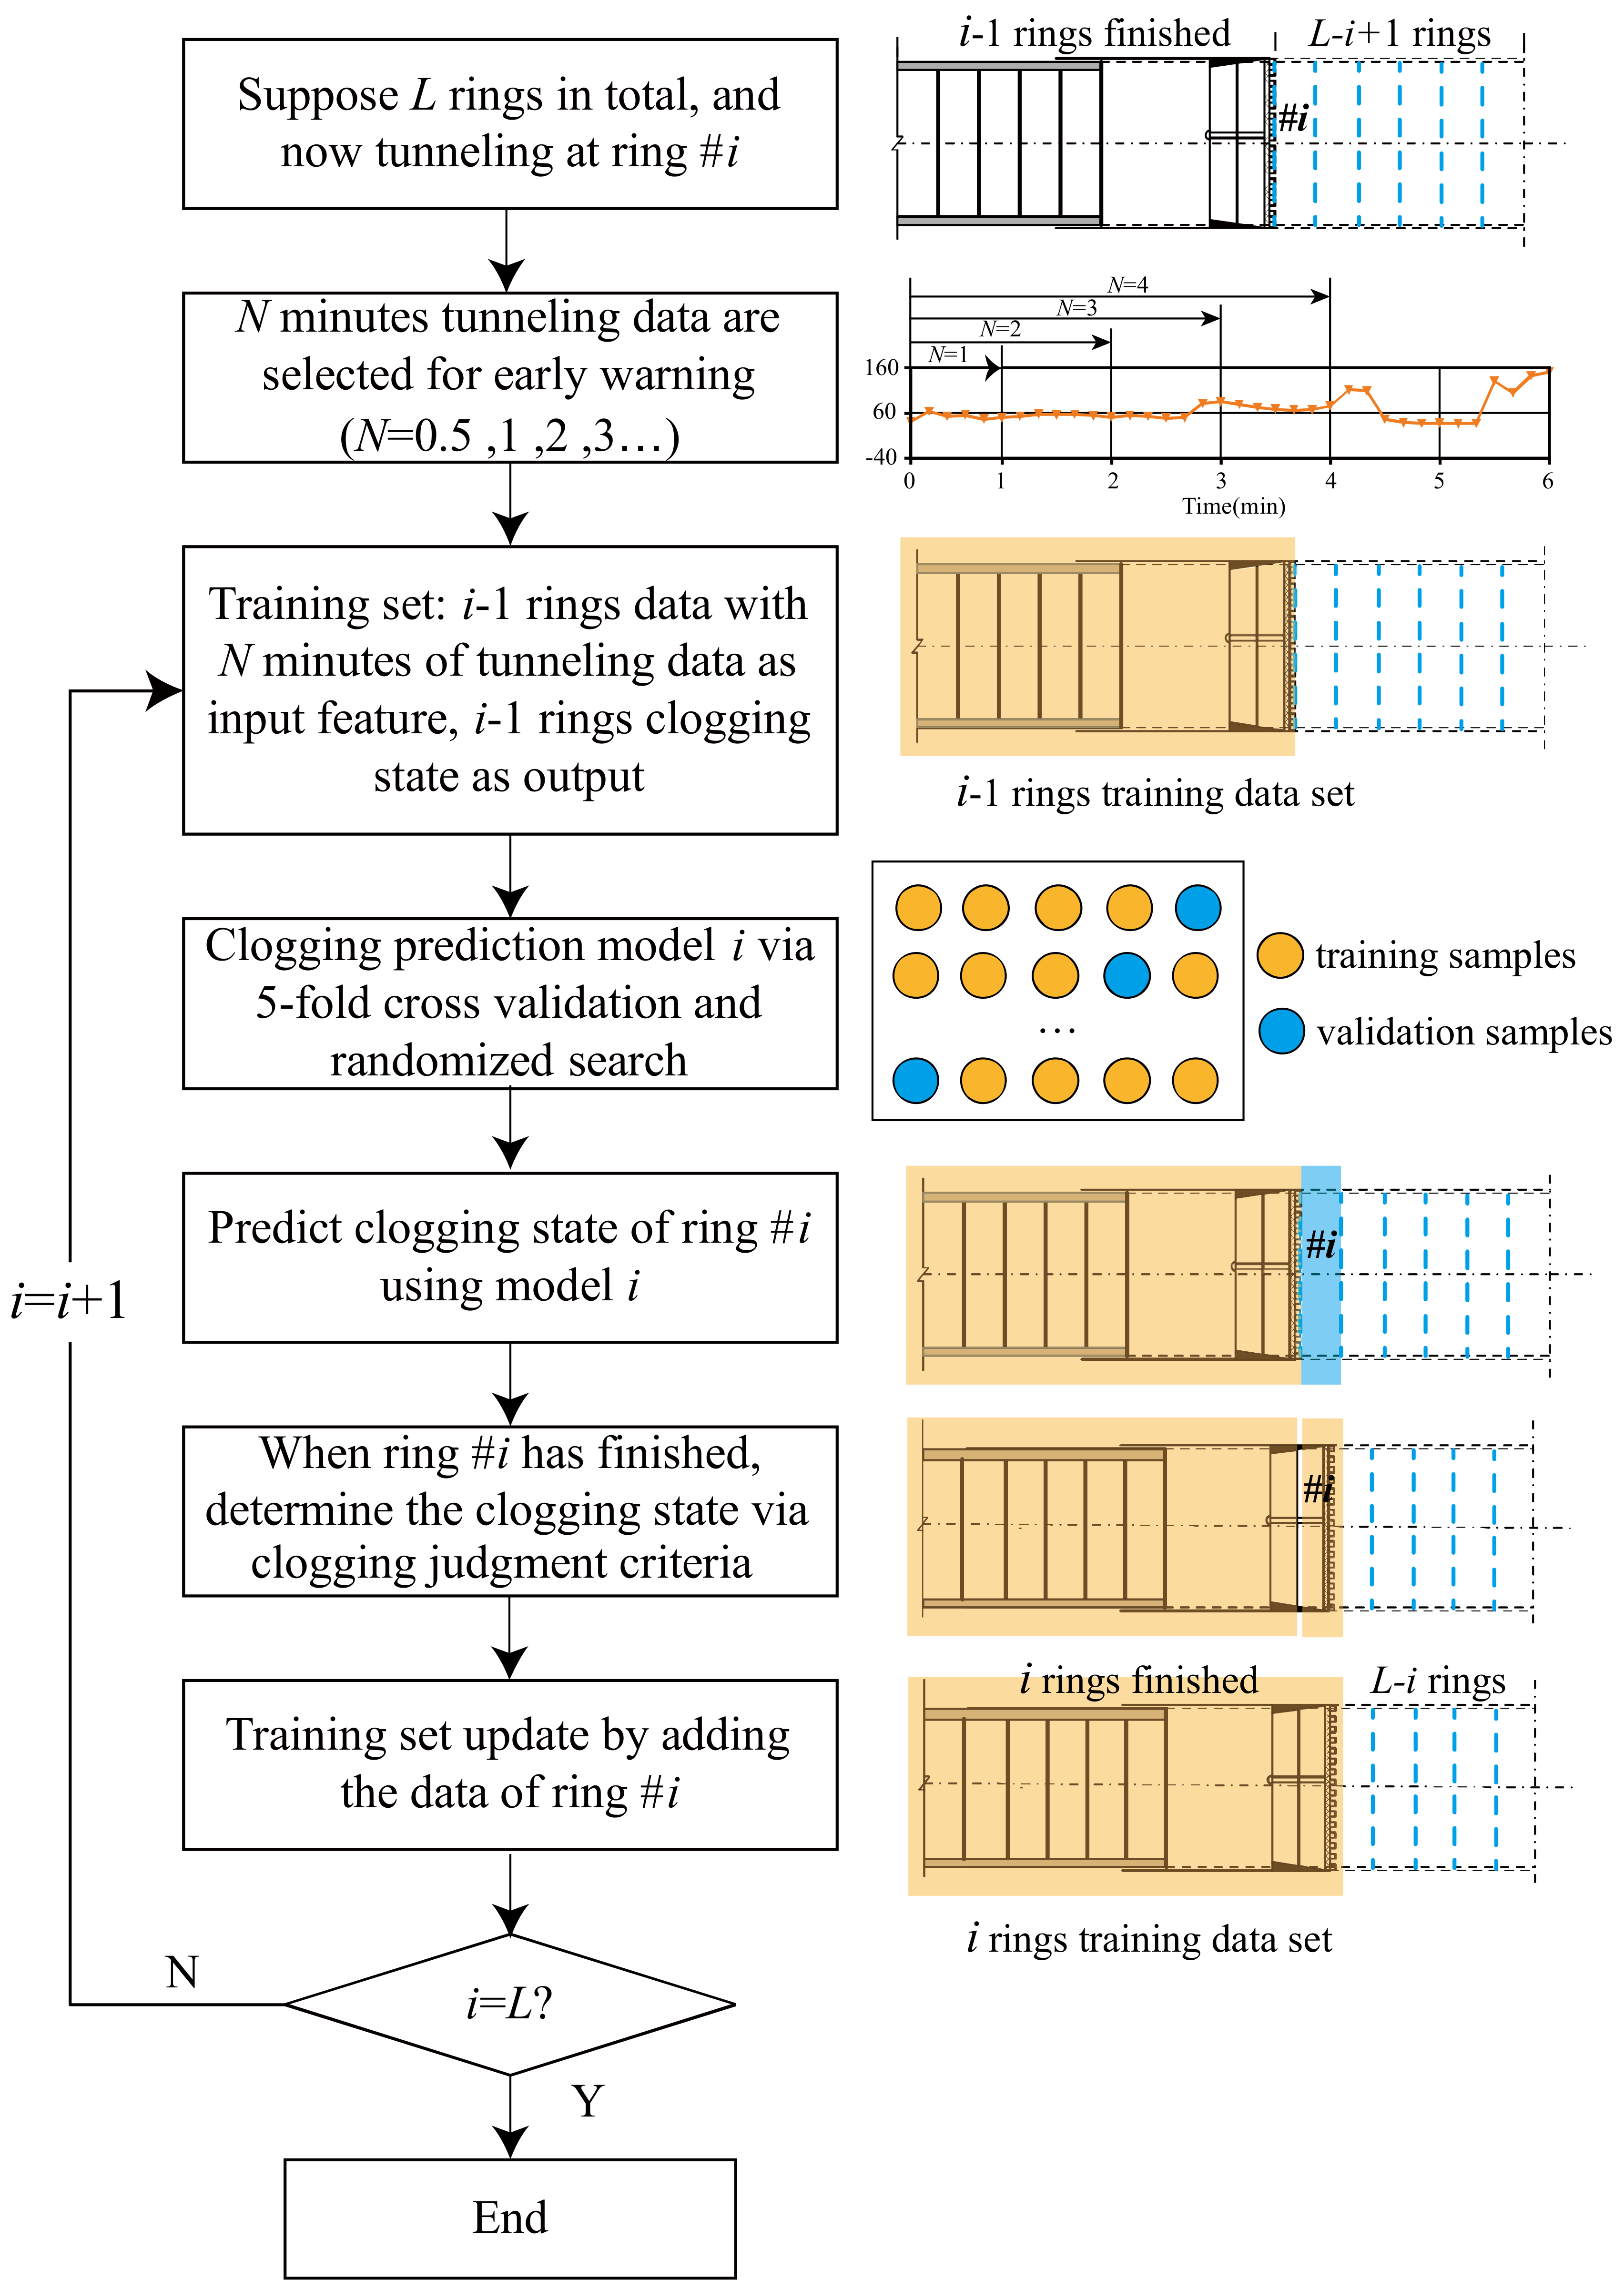
3.1.2. Real-Time Clogging Early Warning Process
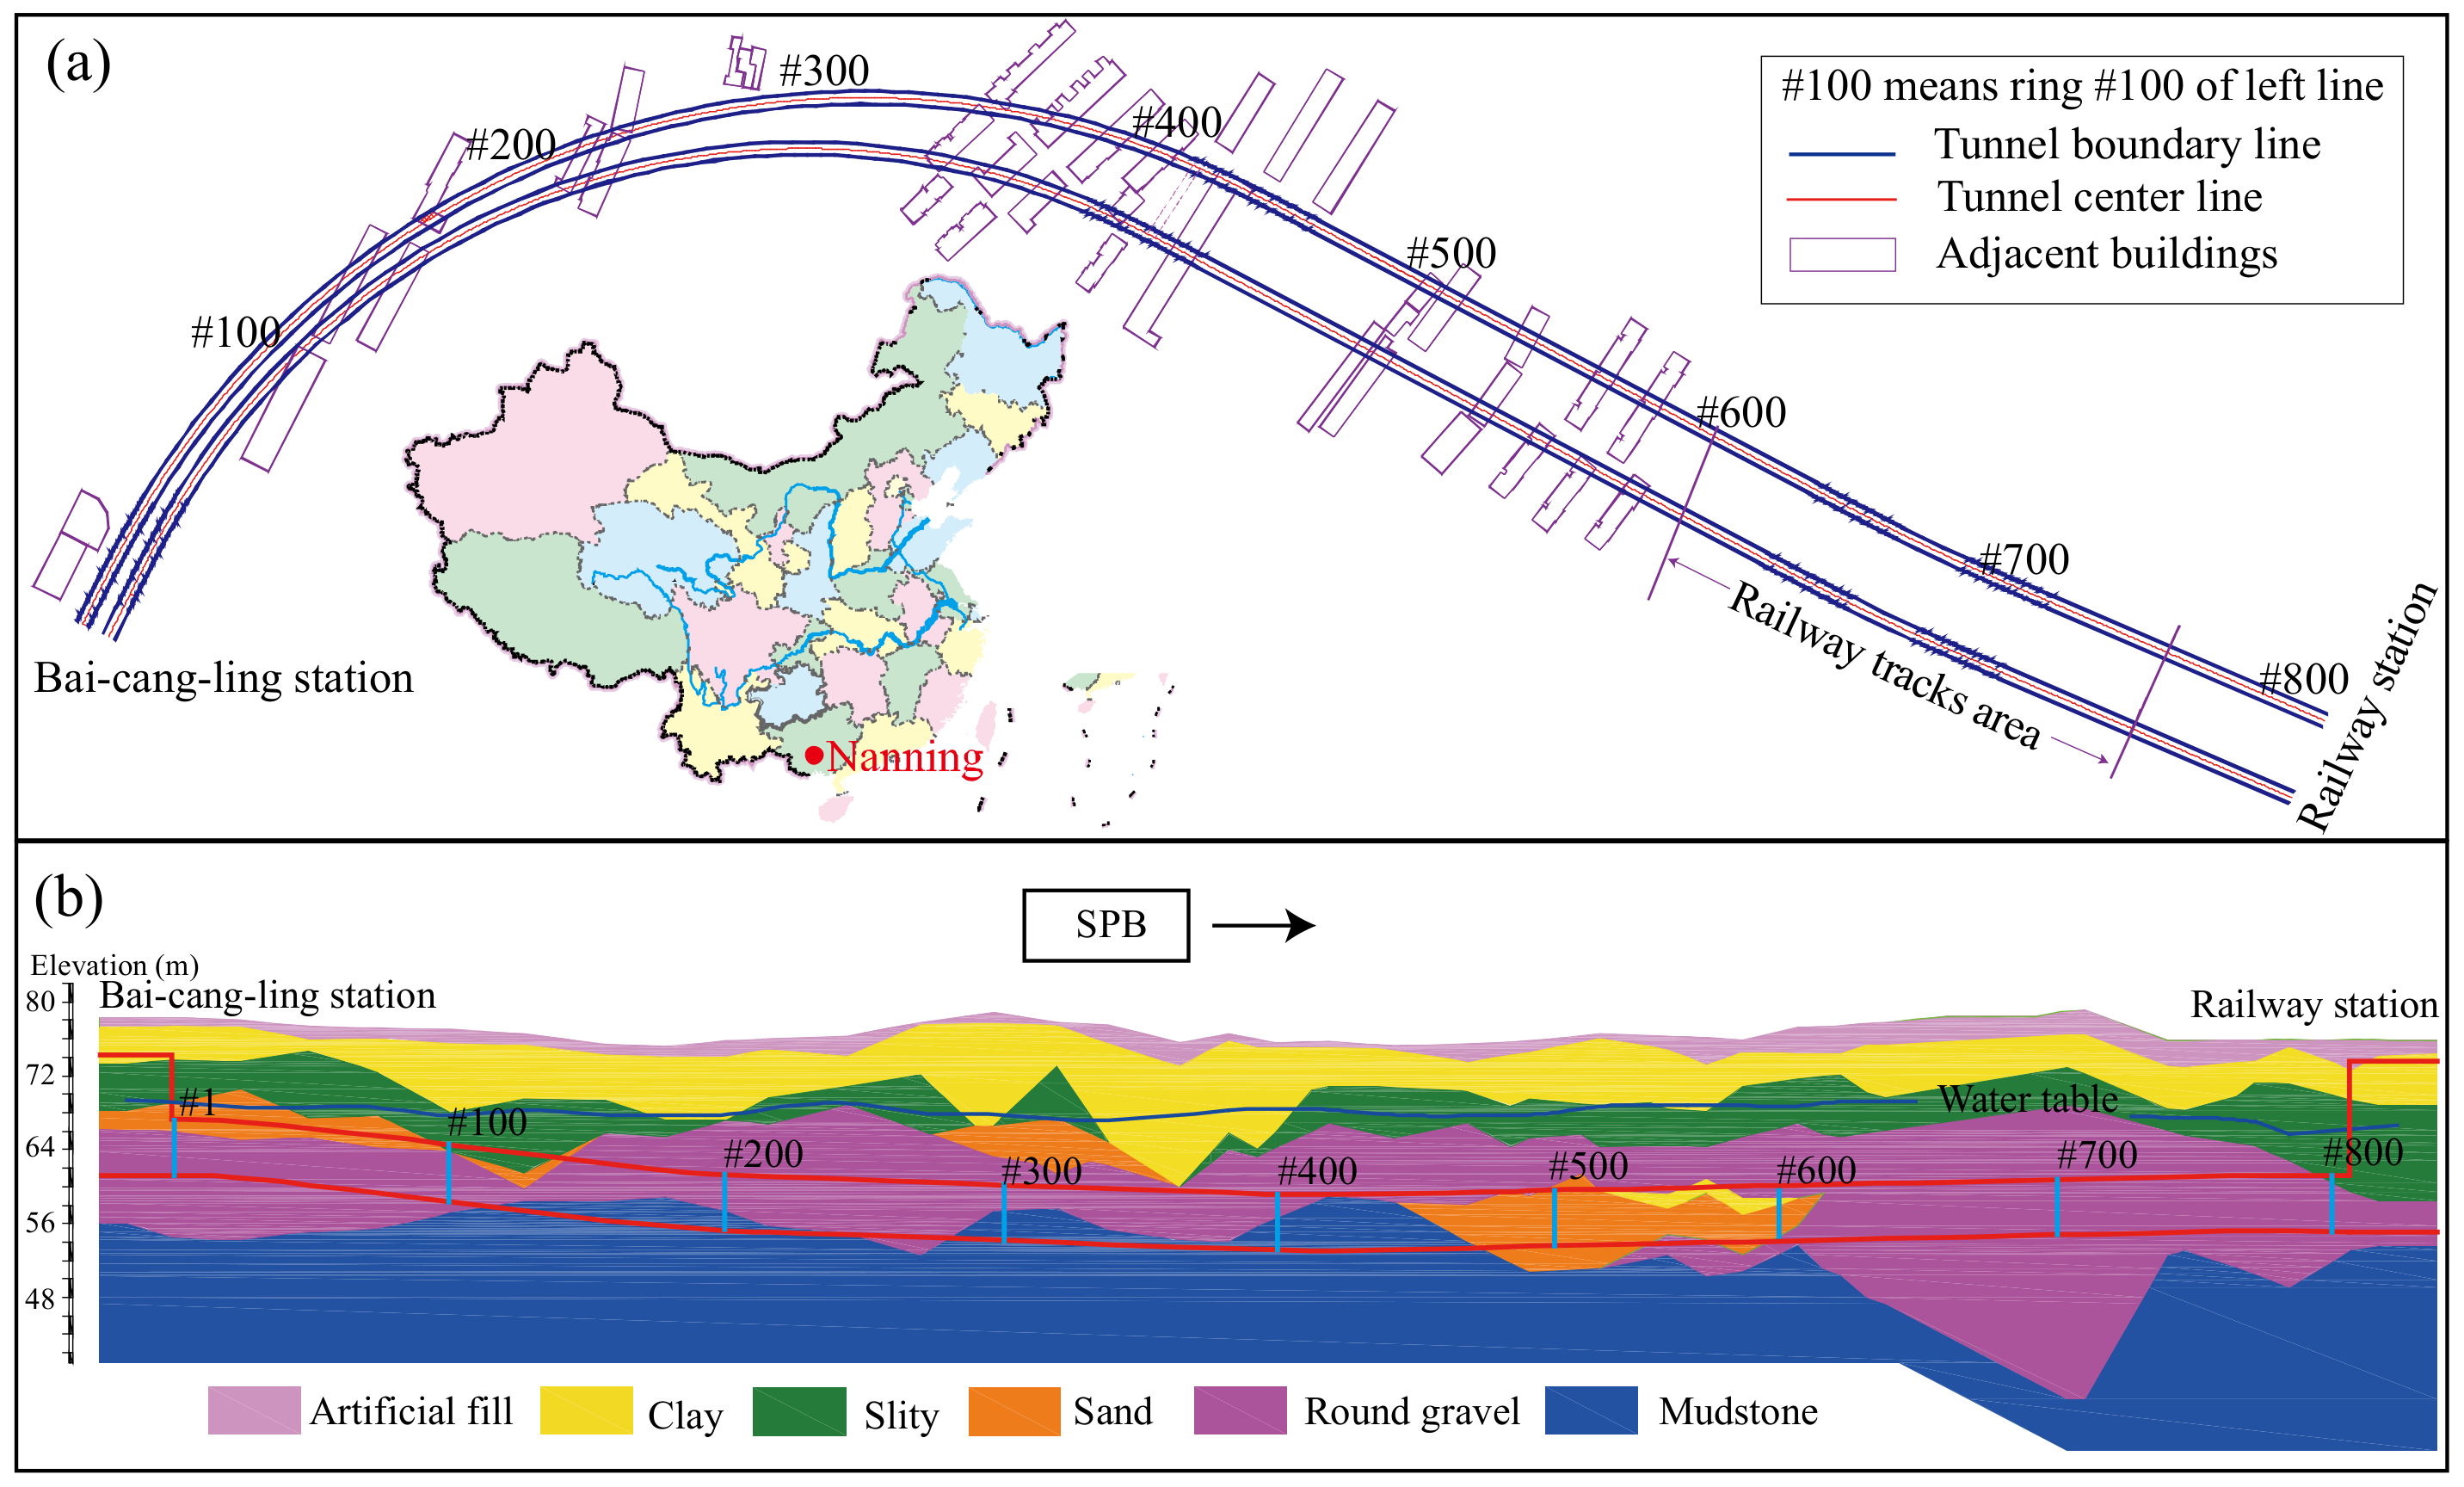
3.2. Data Collection—Nanning Metro Line 1 Project
4. Statistical Analysis of The Tunneling Parameters in The BR Section
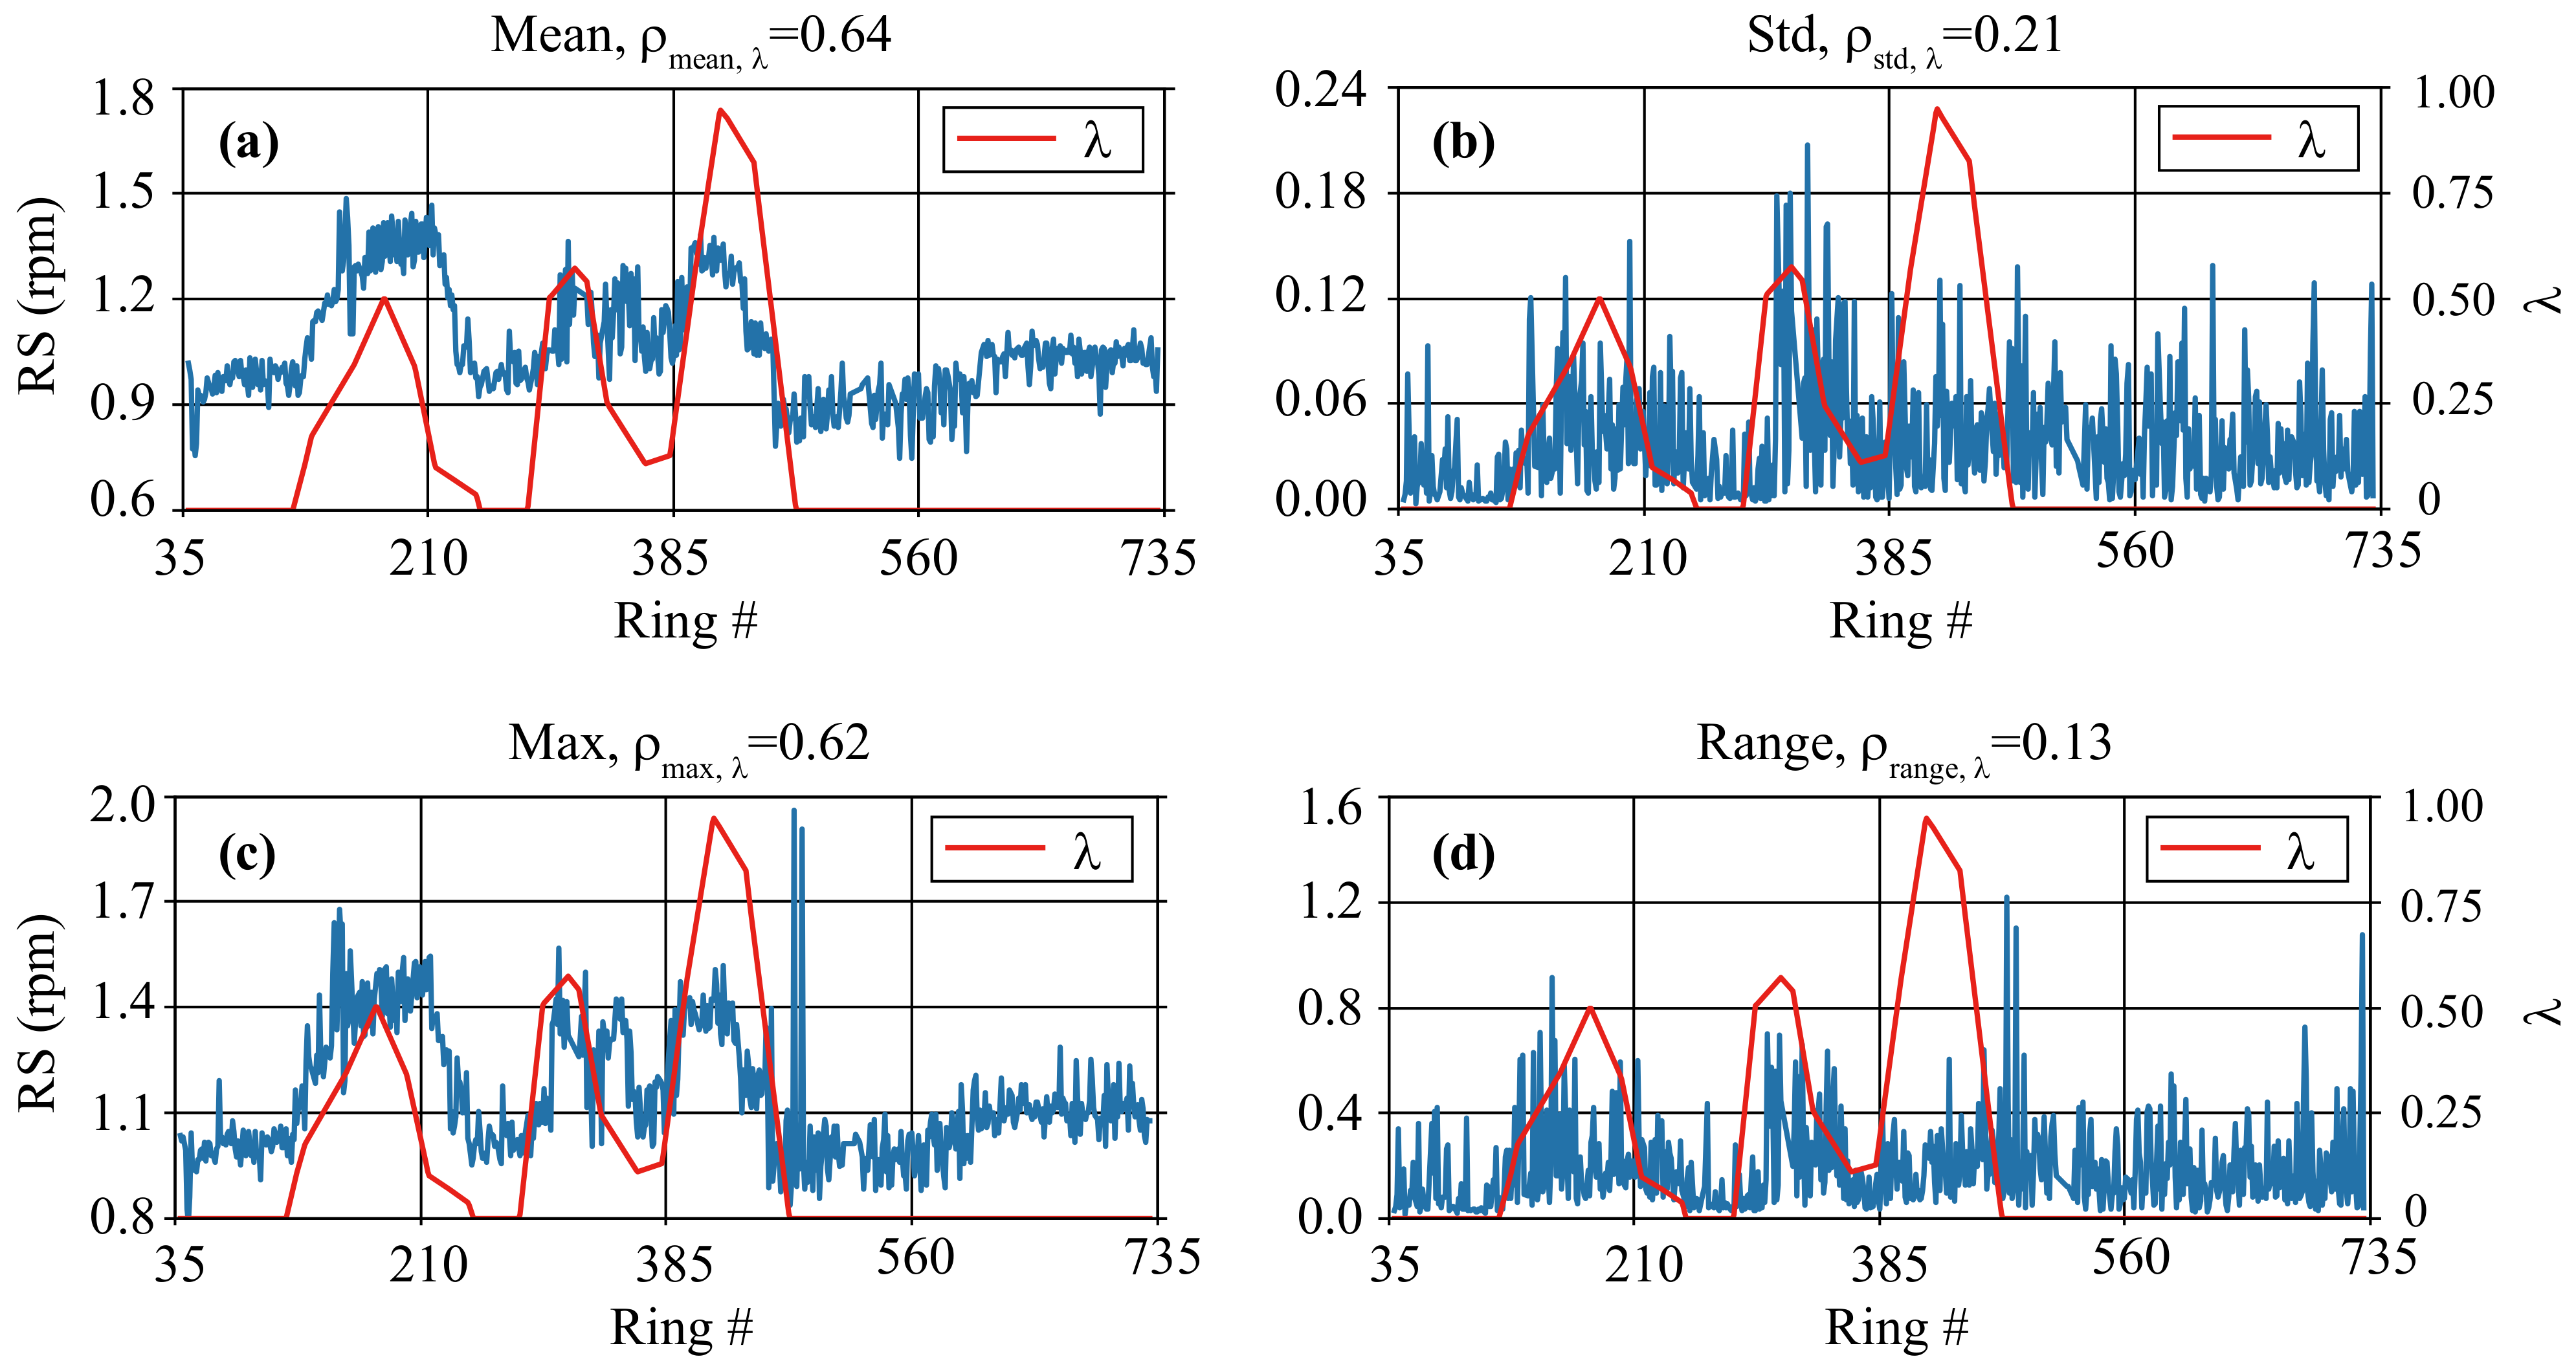
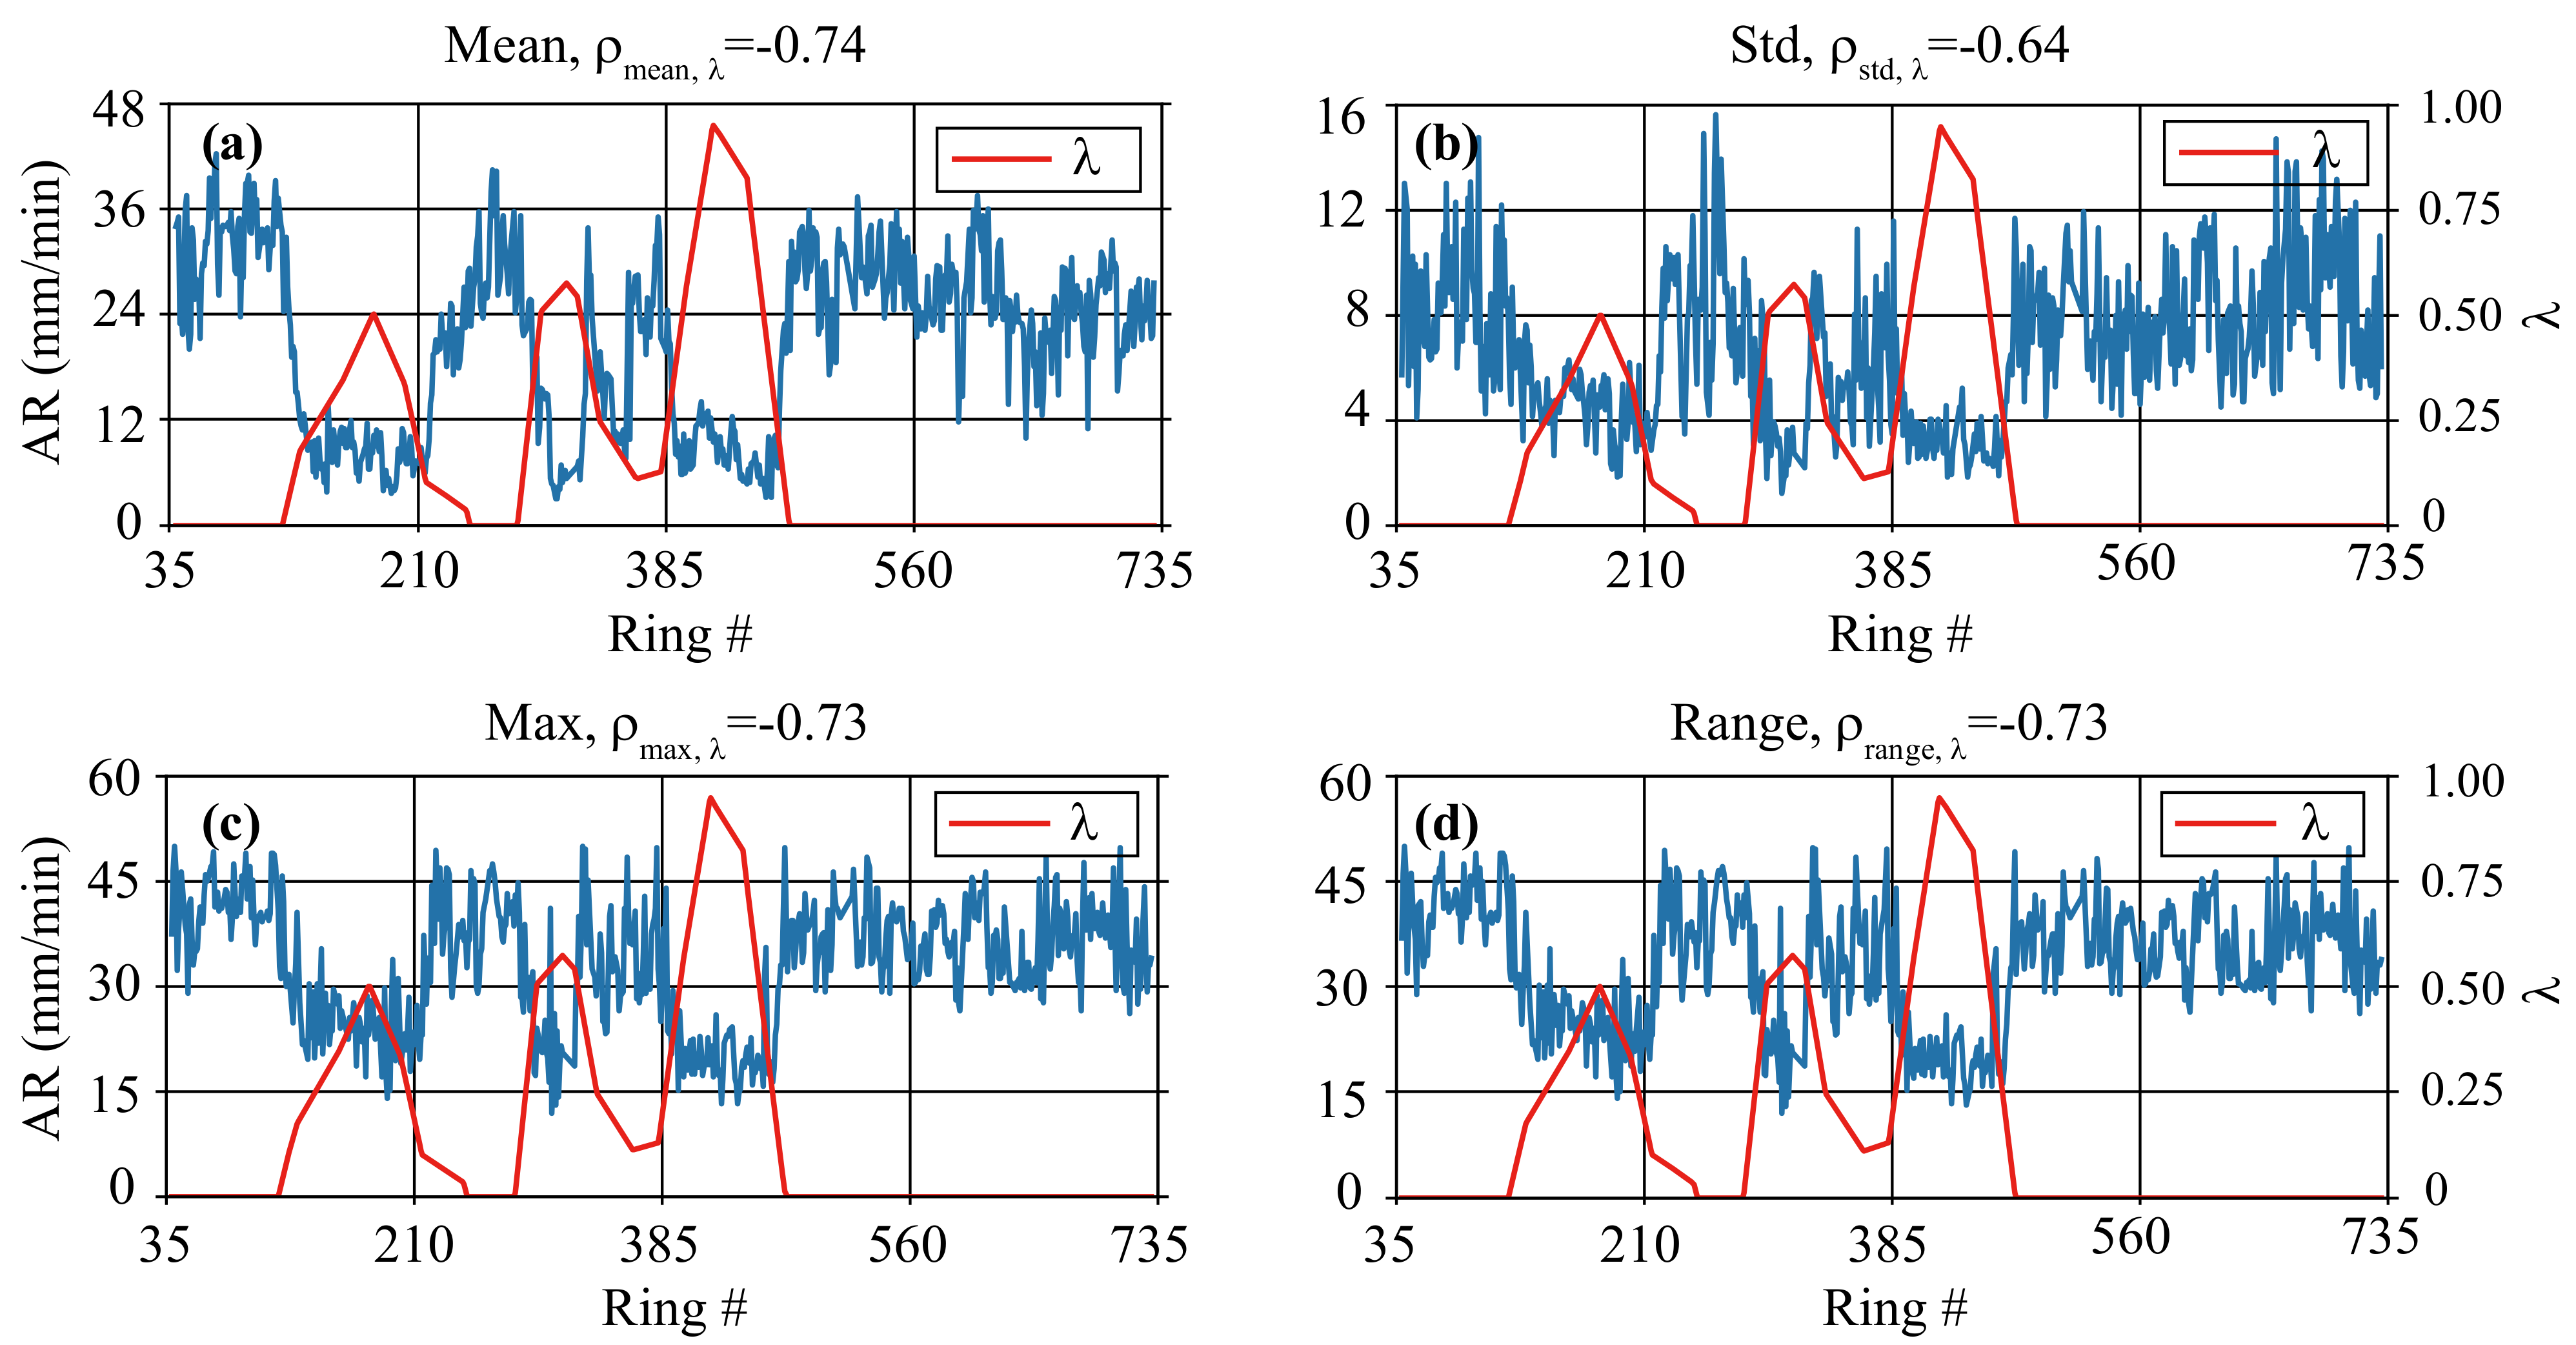
4.1. Statistical Analysis of Tunneling Parameters
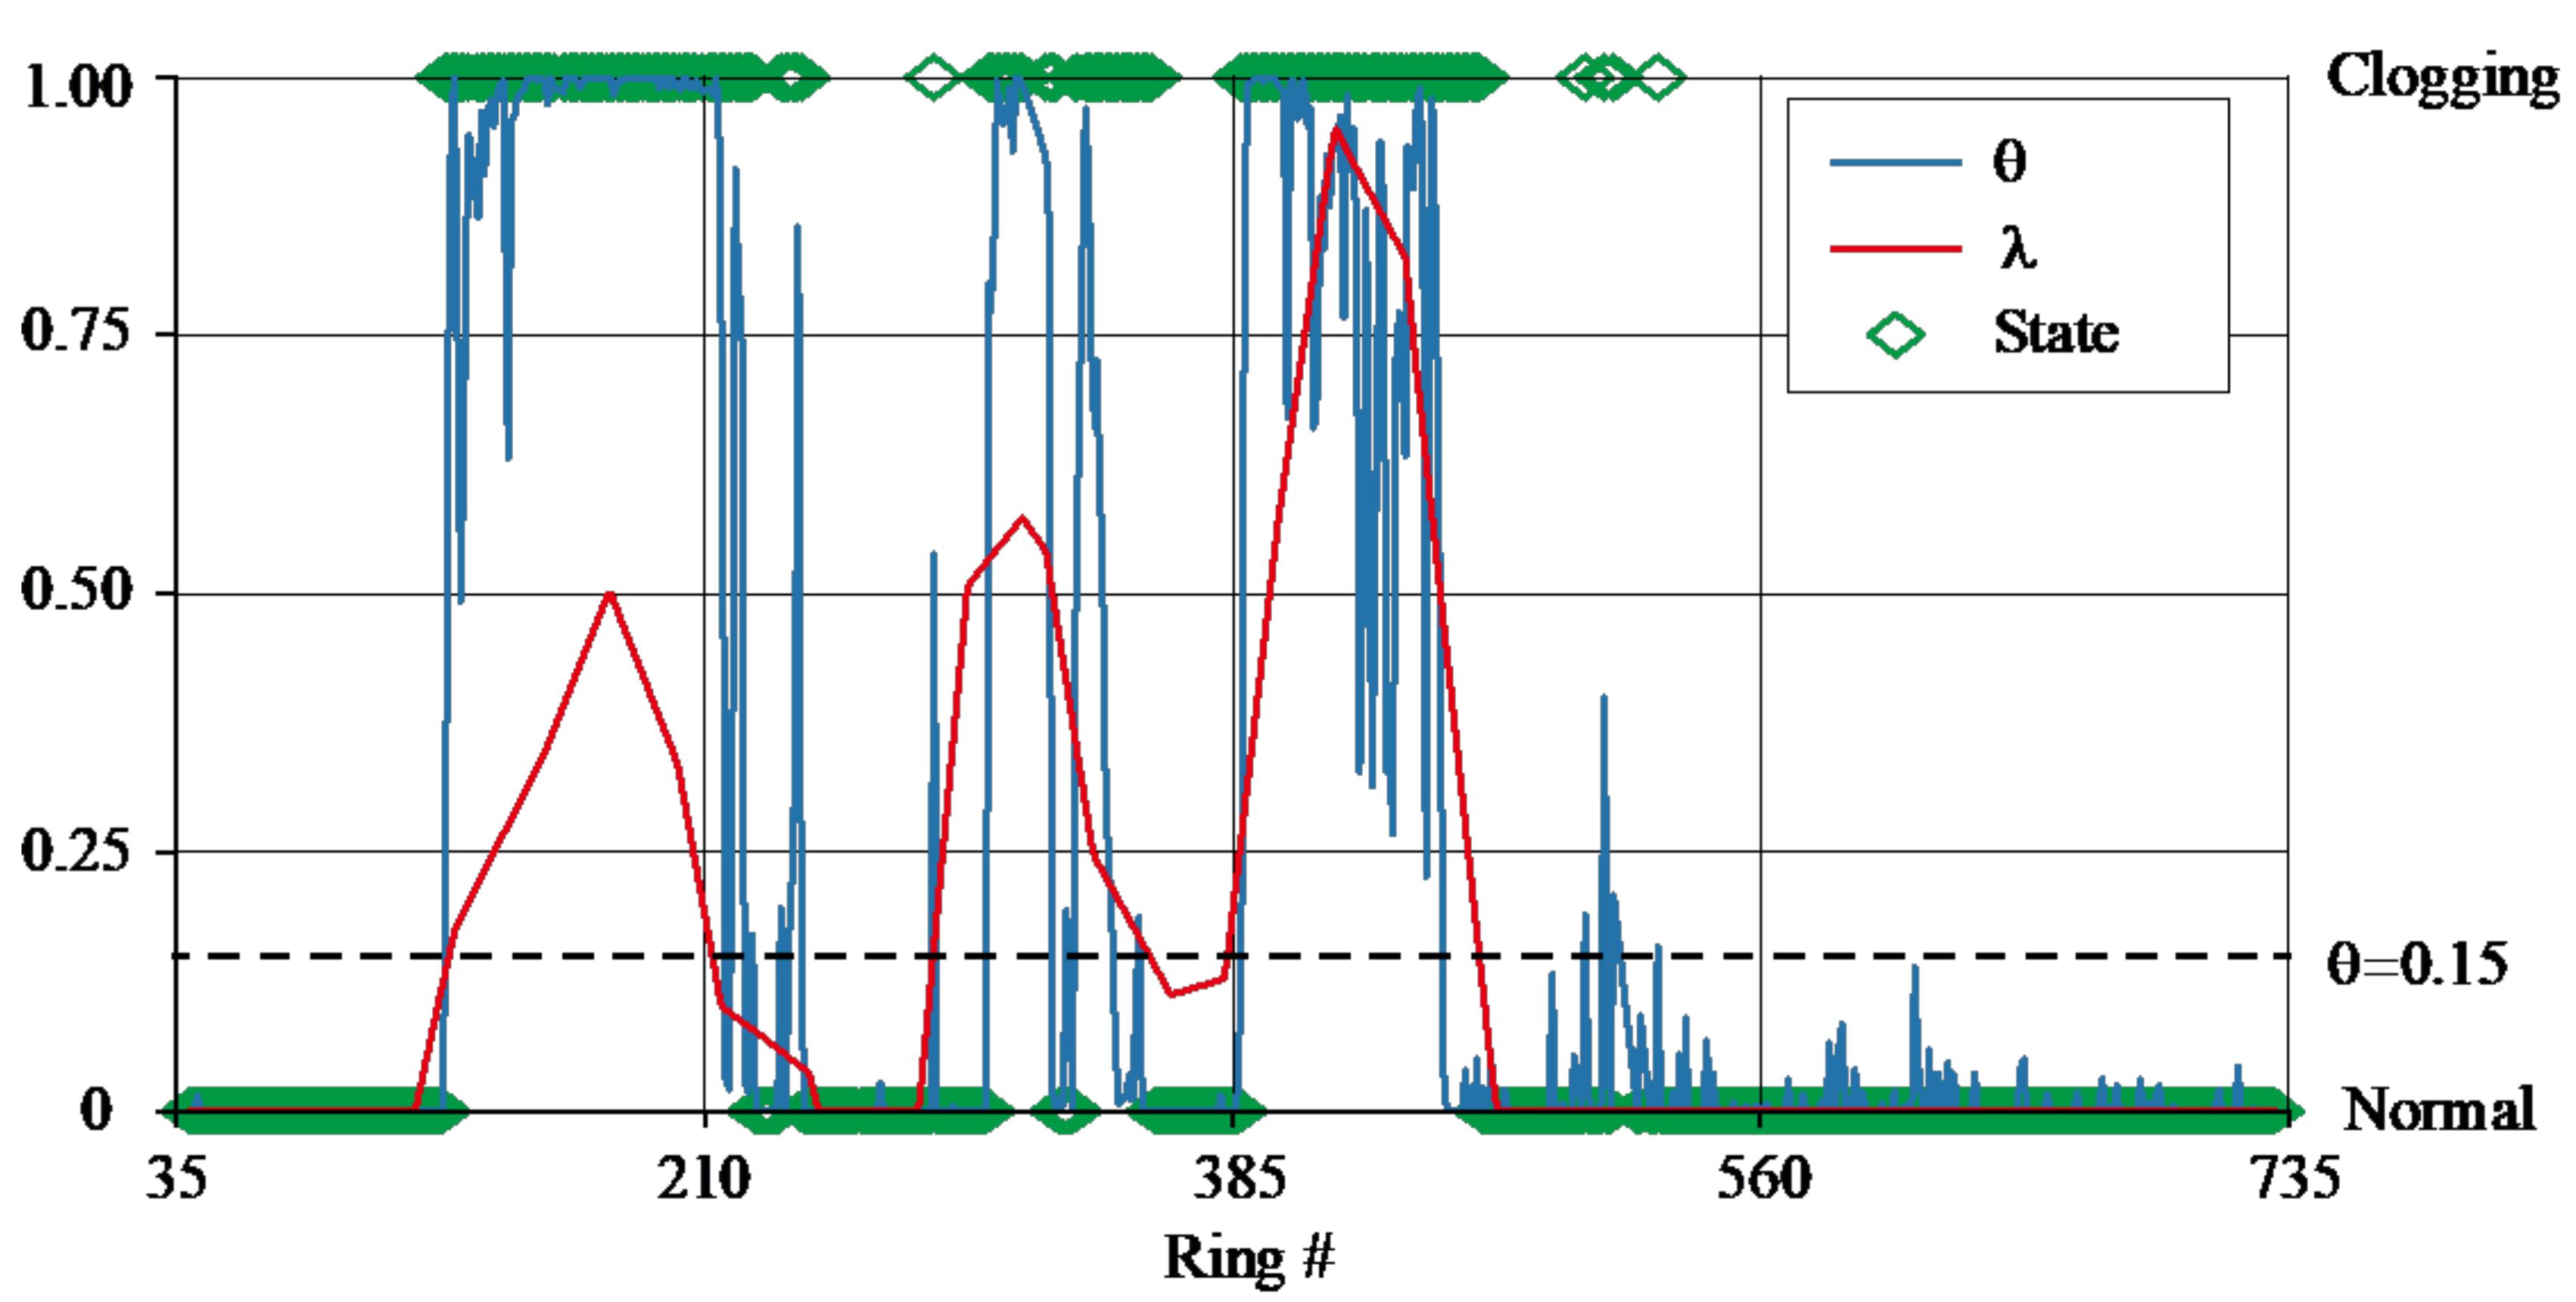
4.2. Determination of Clogging Based on Tunneling Parameters
- The SPFI of the whole ring was larger than 0.15;
- The average value of the TOR was larger than 1 MN·m;
- The average value of the AR was smaller than 15 mm/min.
5. Clogging Prediction Results in the BR Section
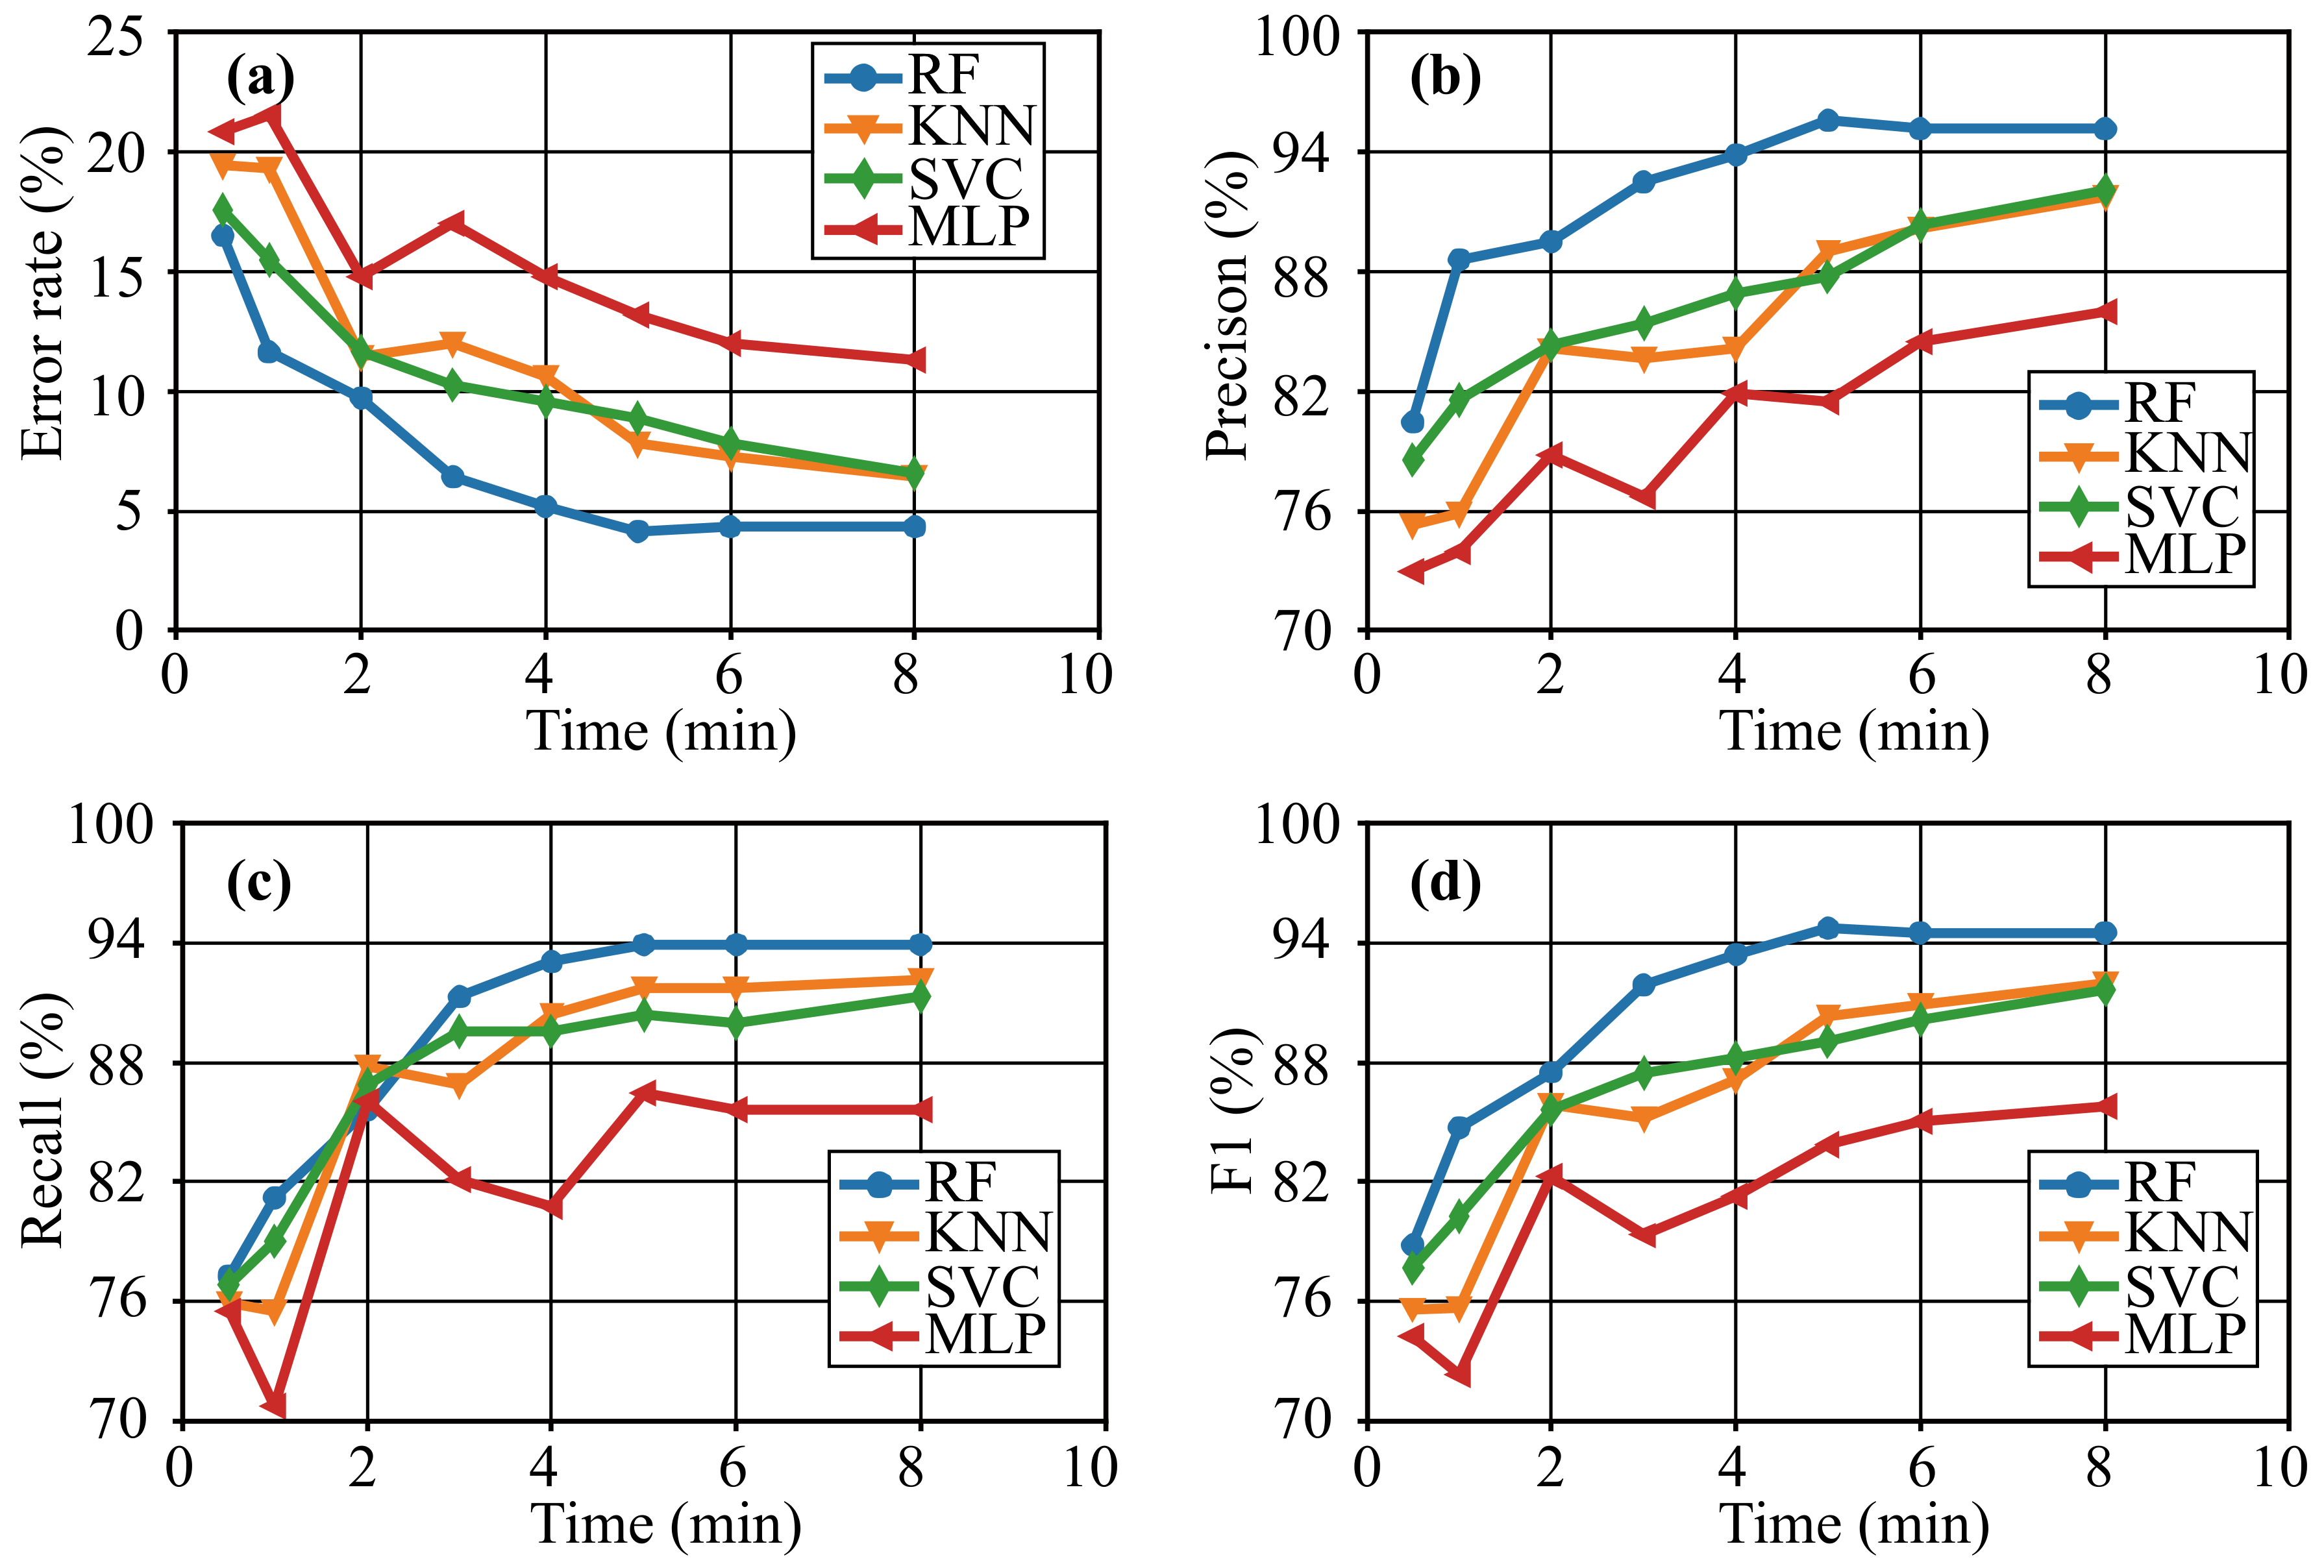
5.1. Prediction Results
5.2. Discussion
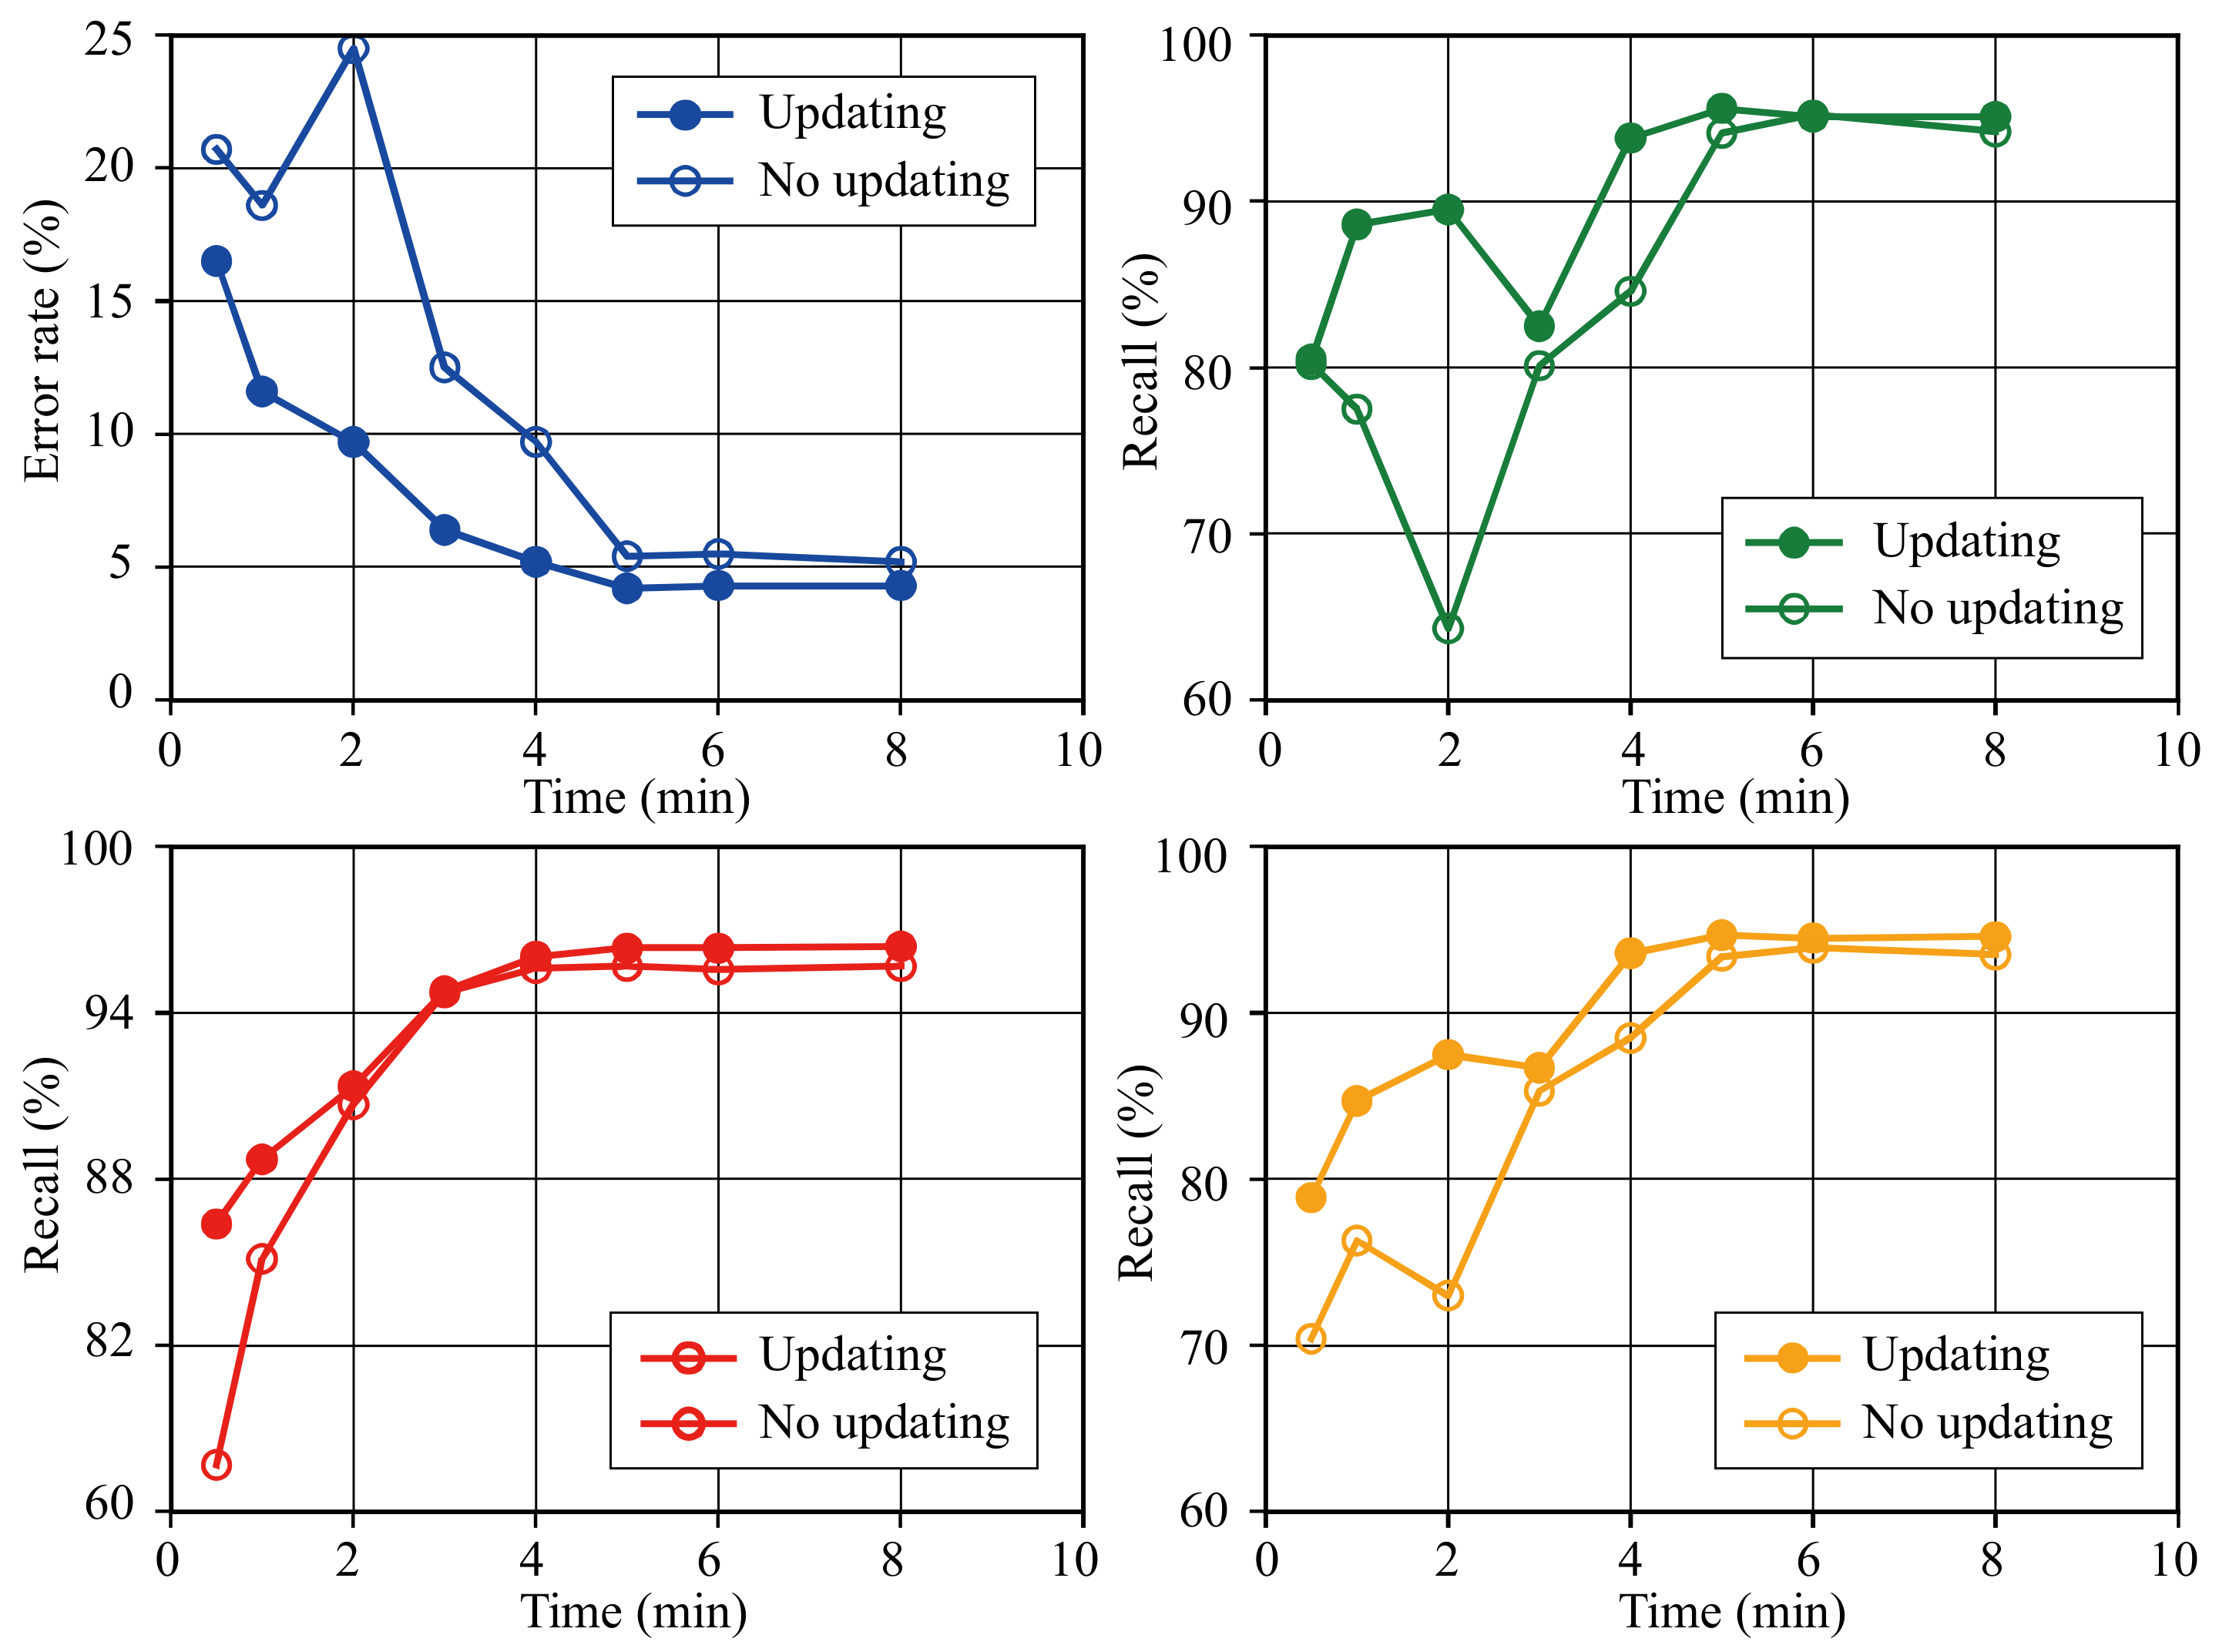
5.2.1. Model Performance without Training Data Updating
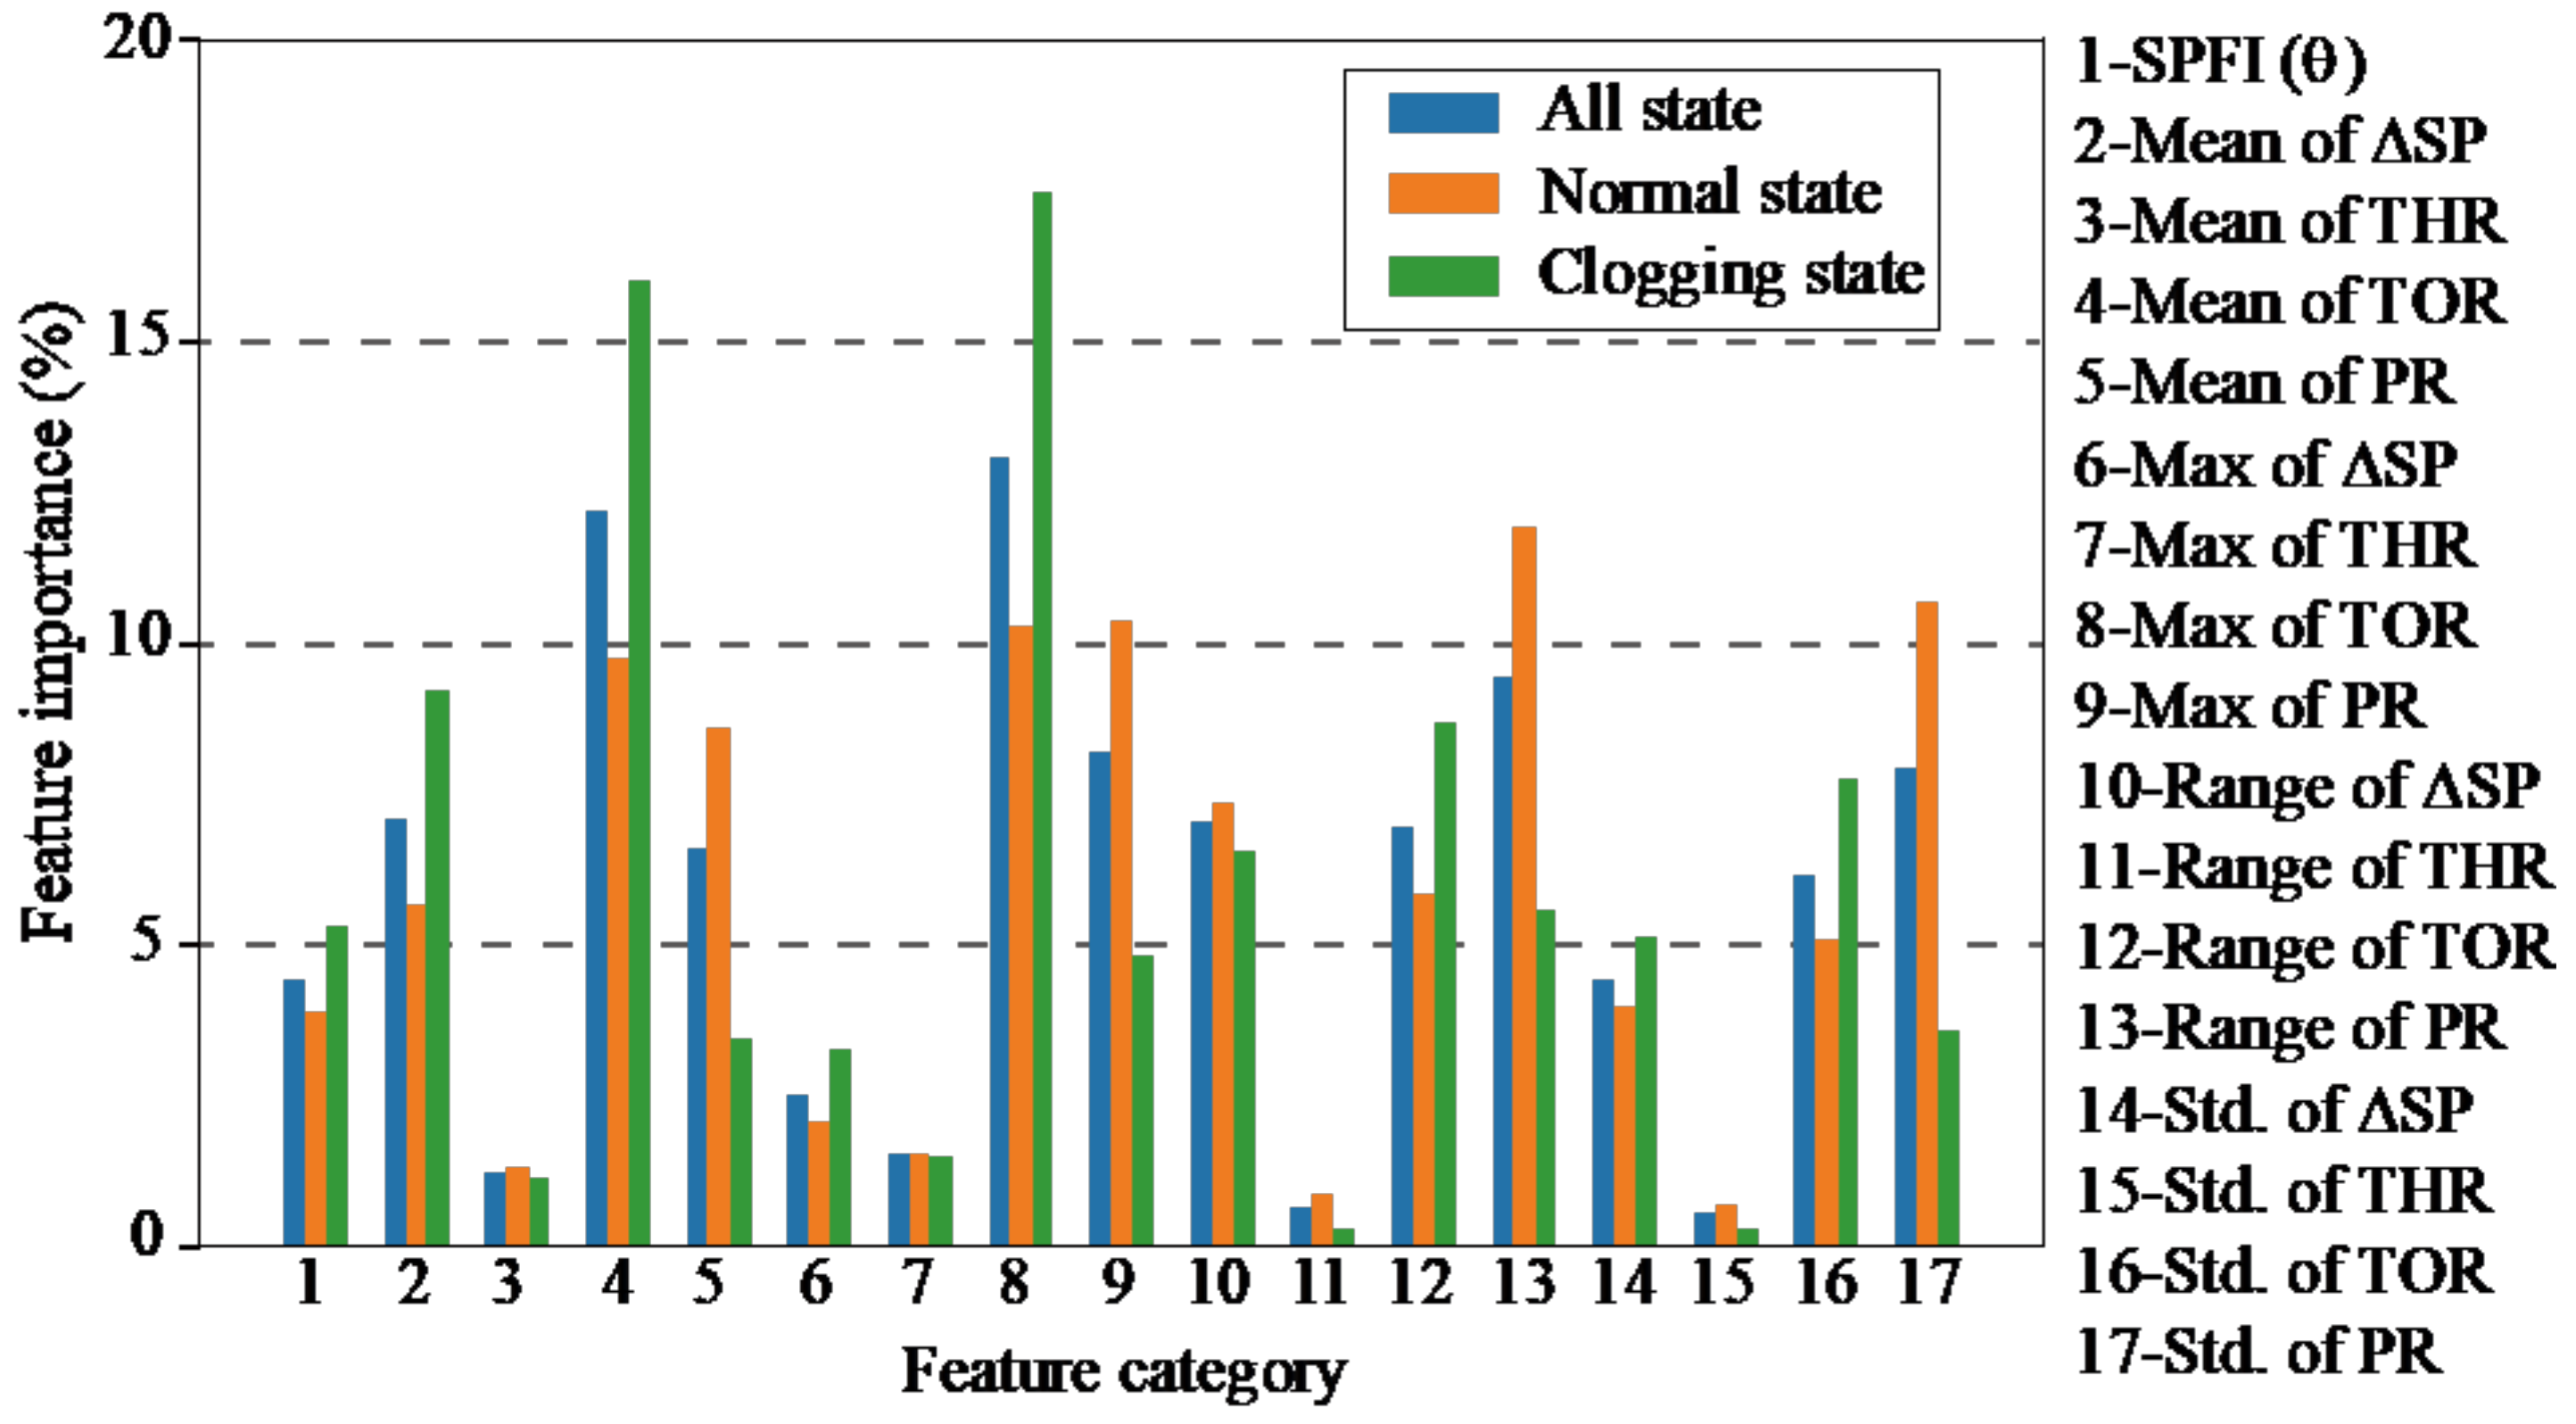
5.2.2. Influence of Input Features on Clogging Prediction
6. Conclusions and Future Work
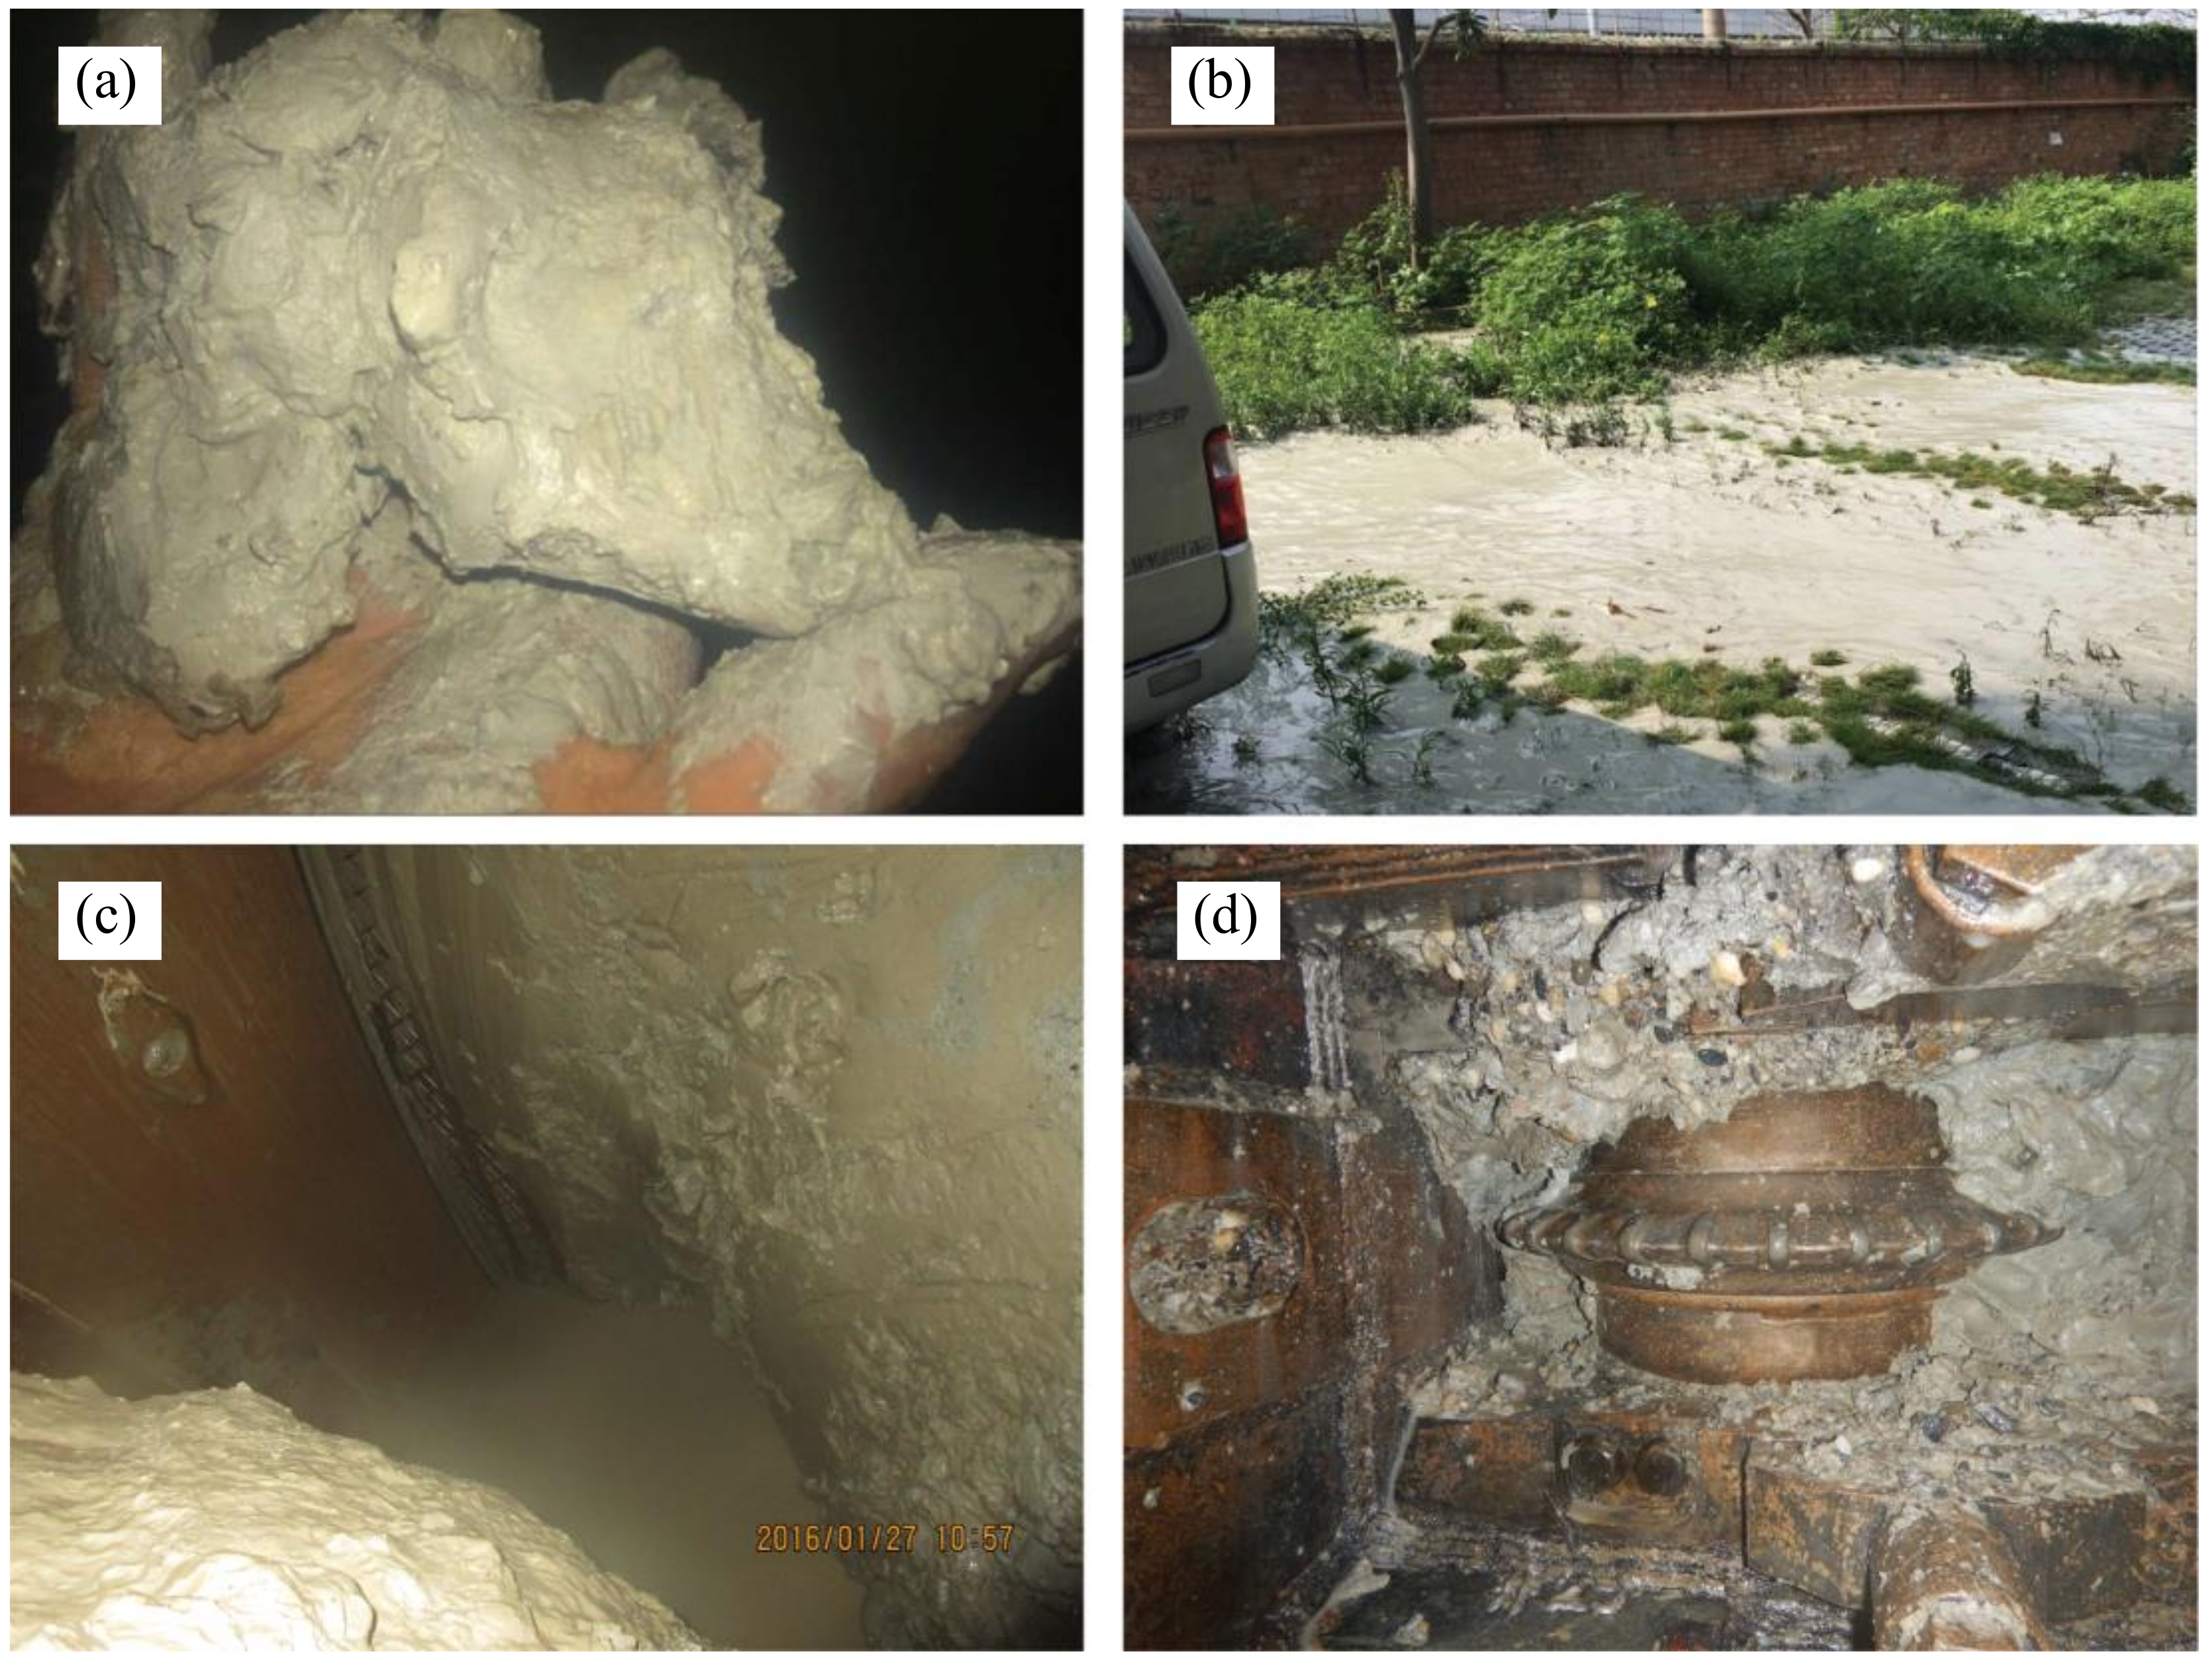
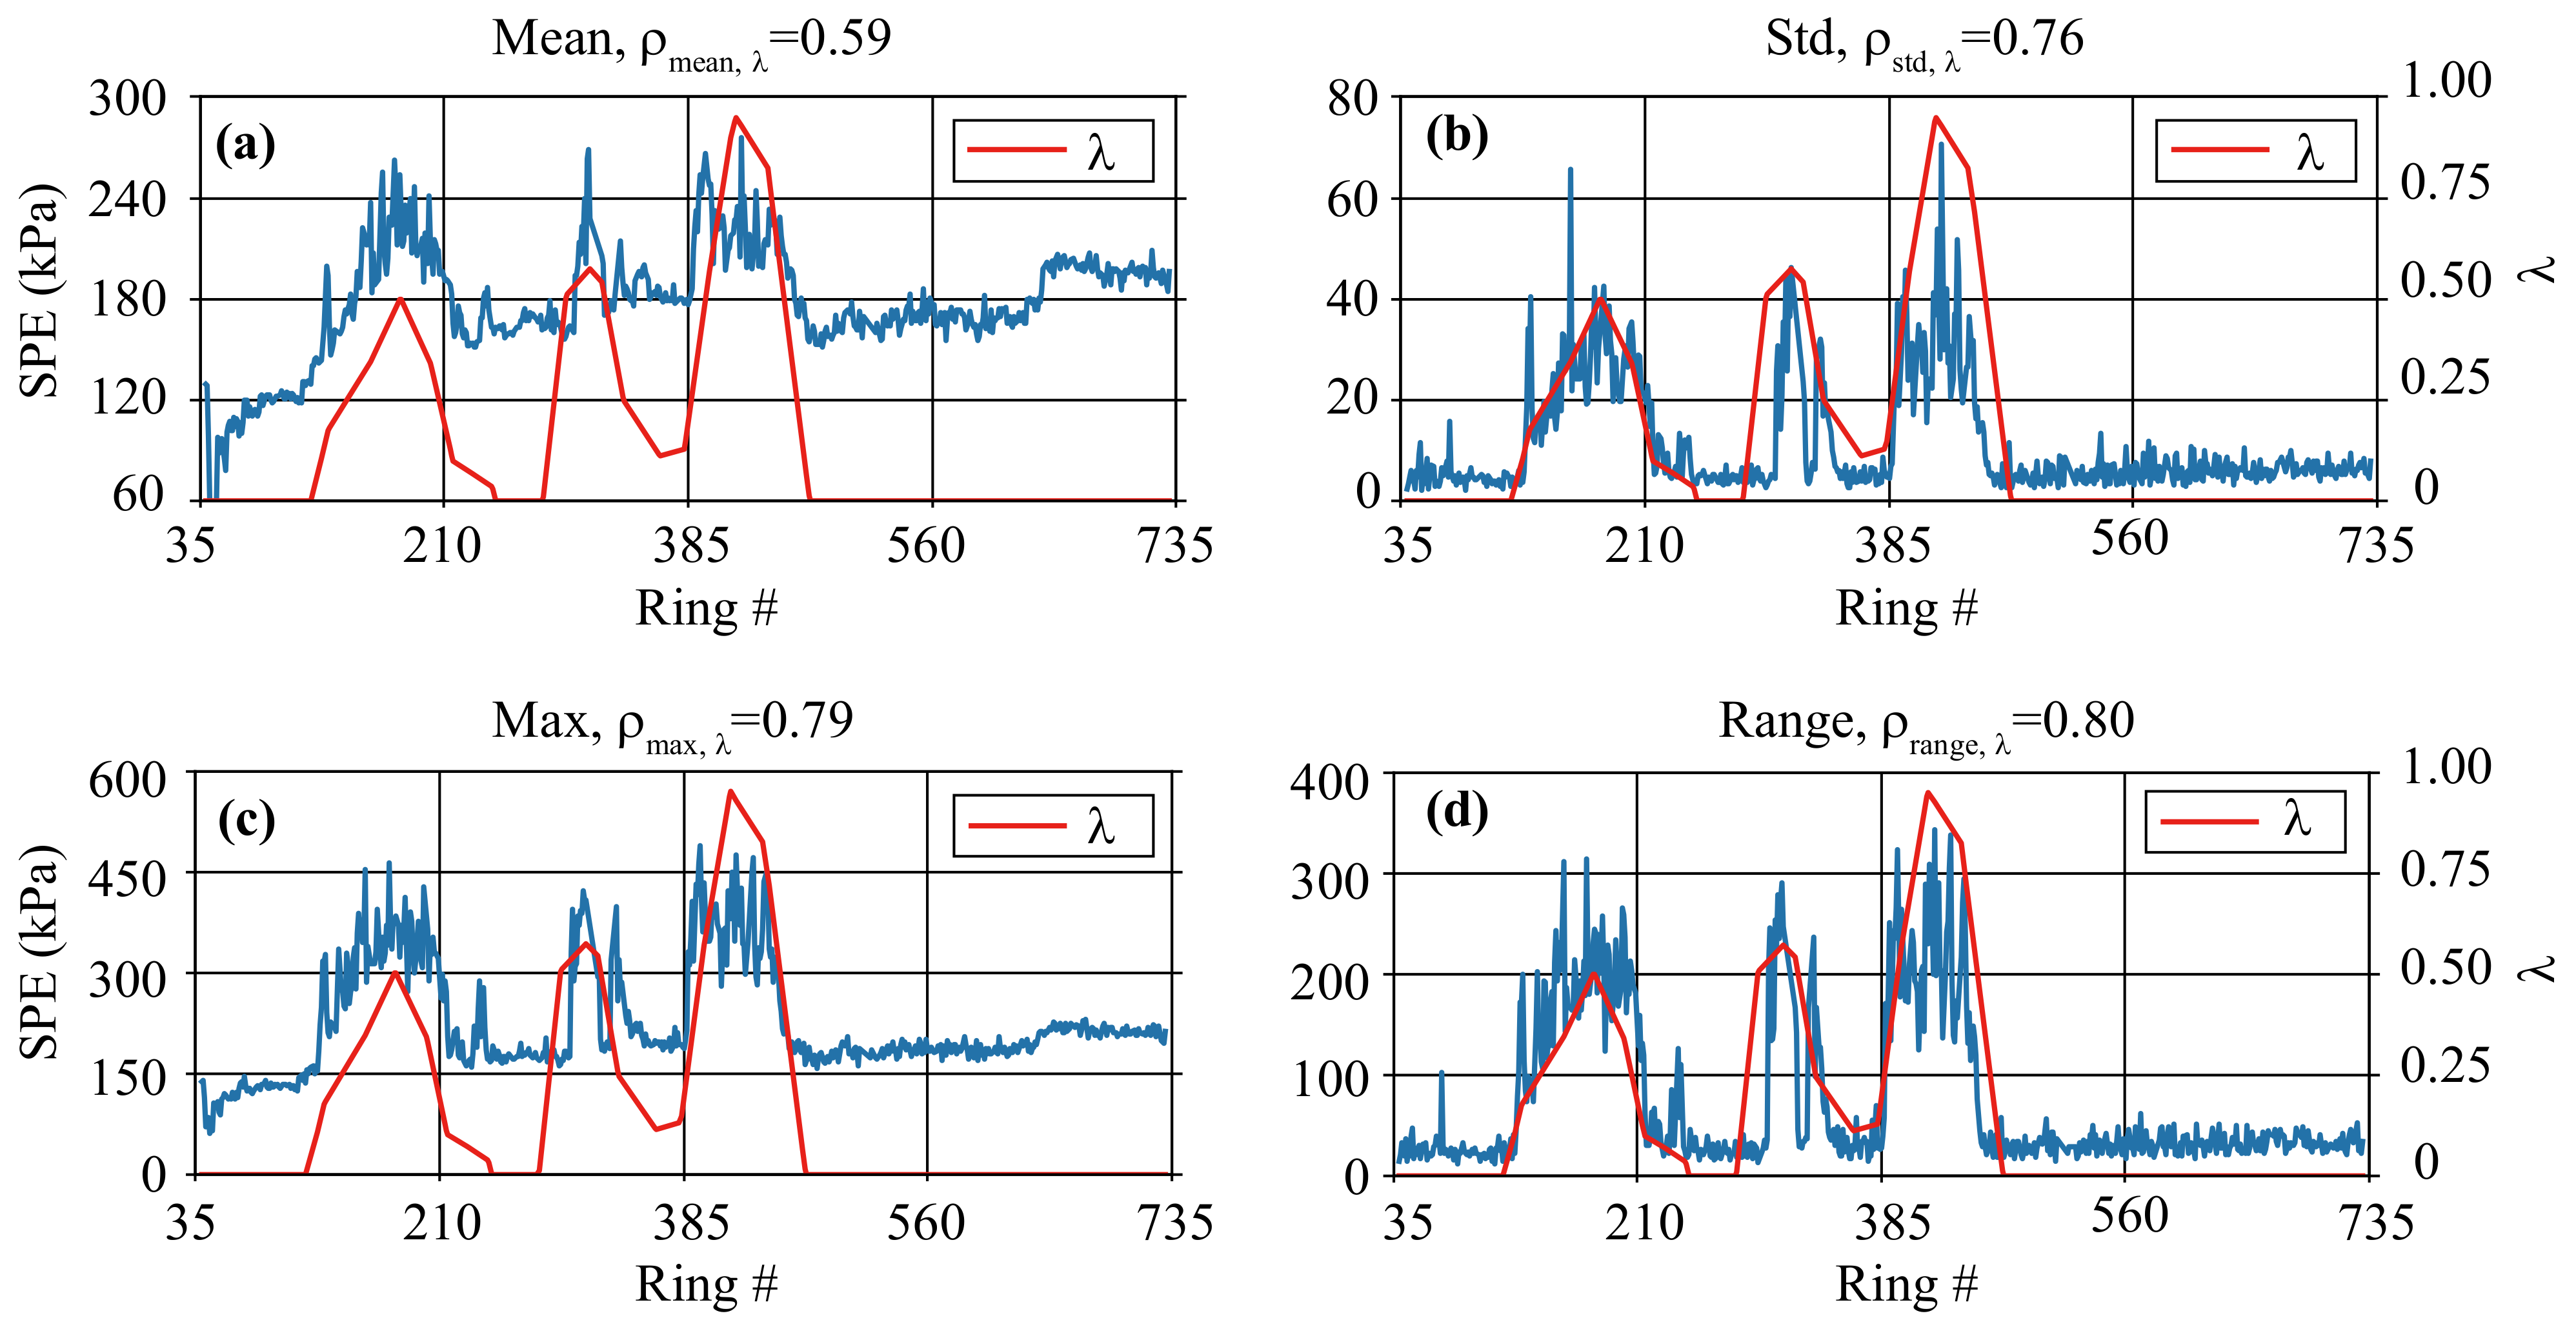
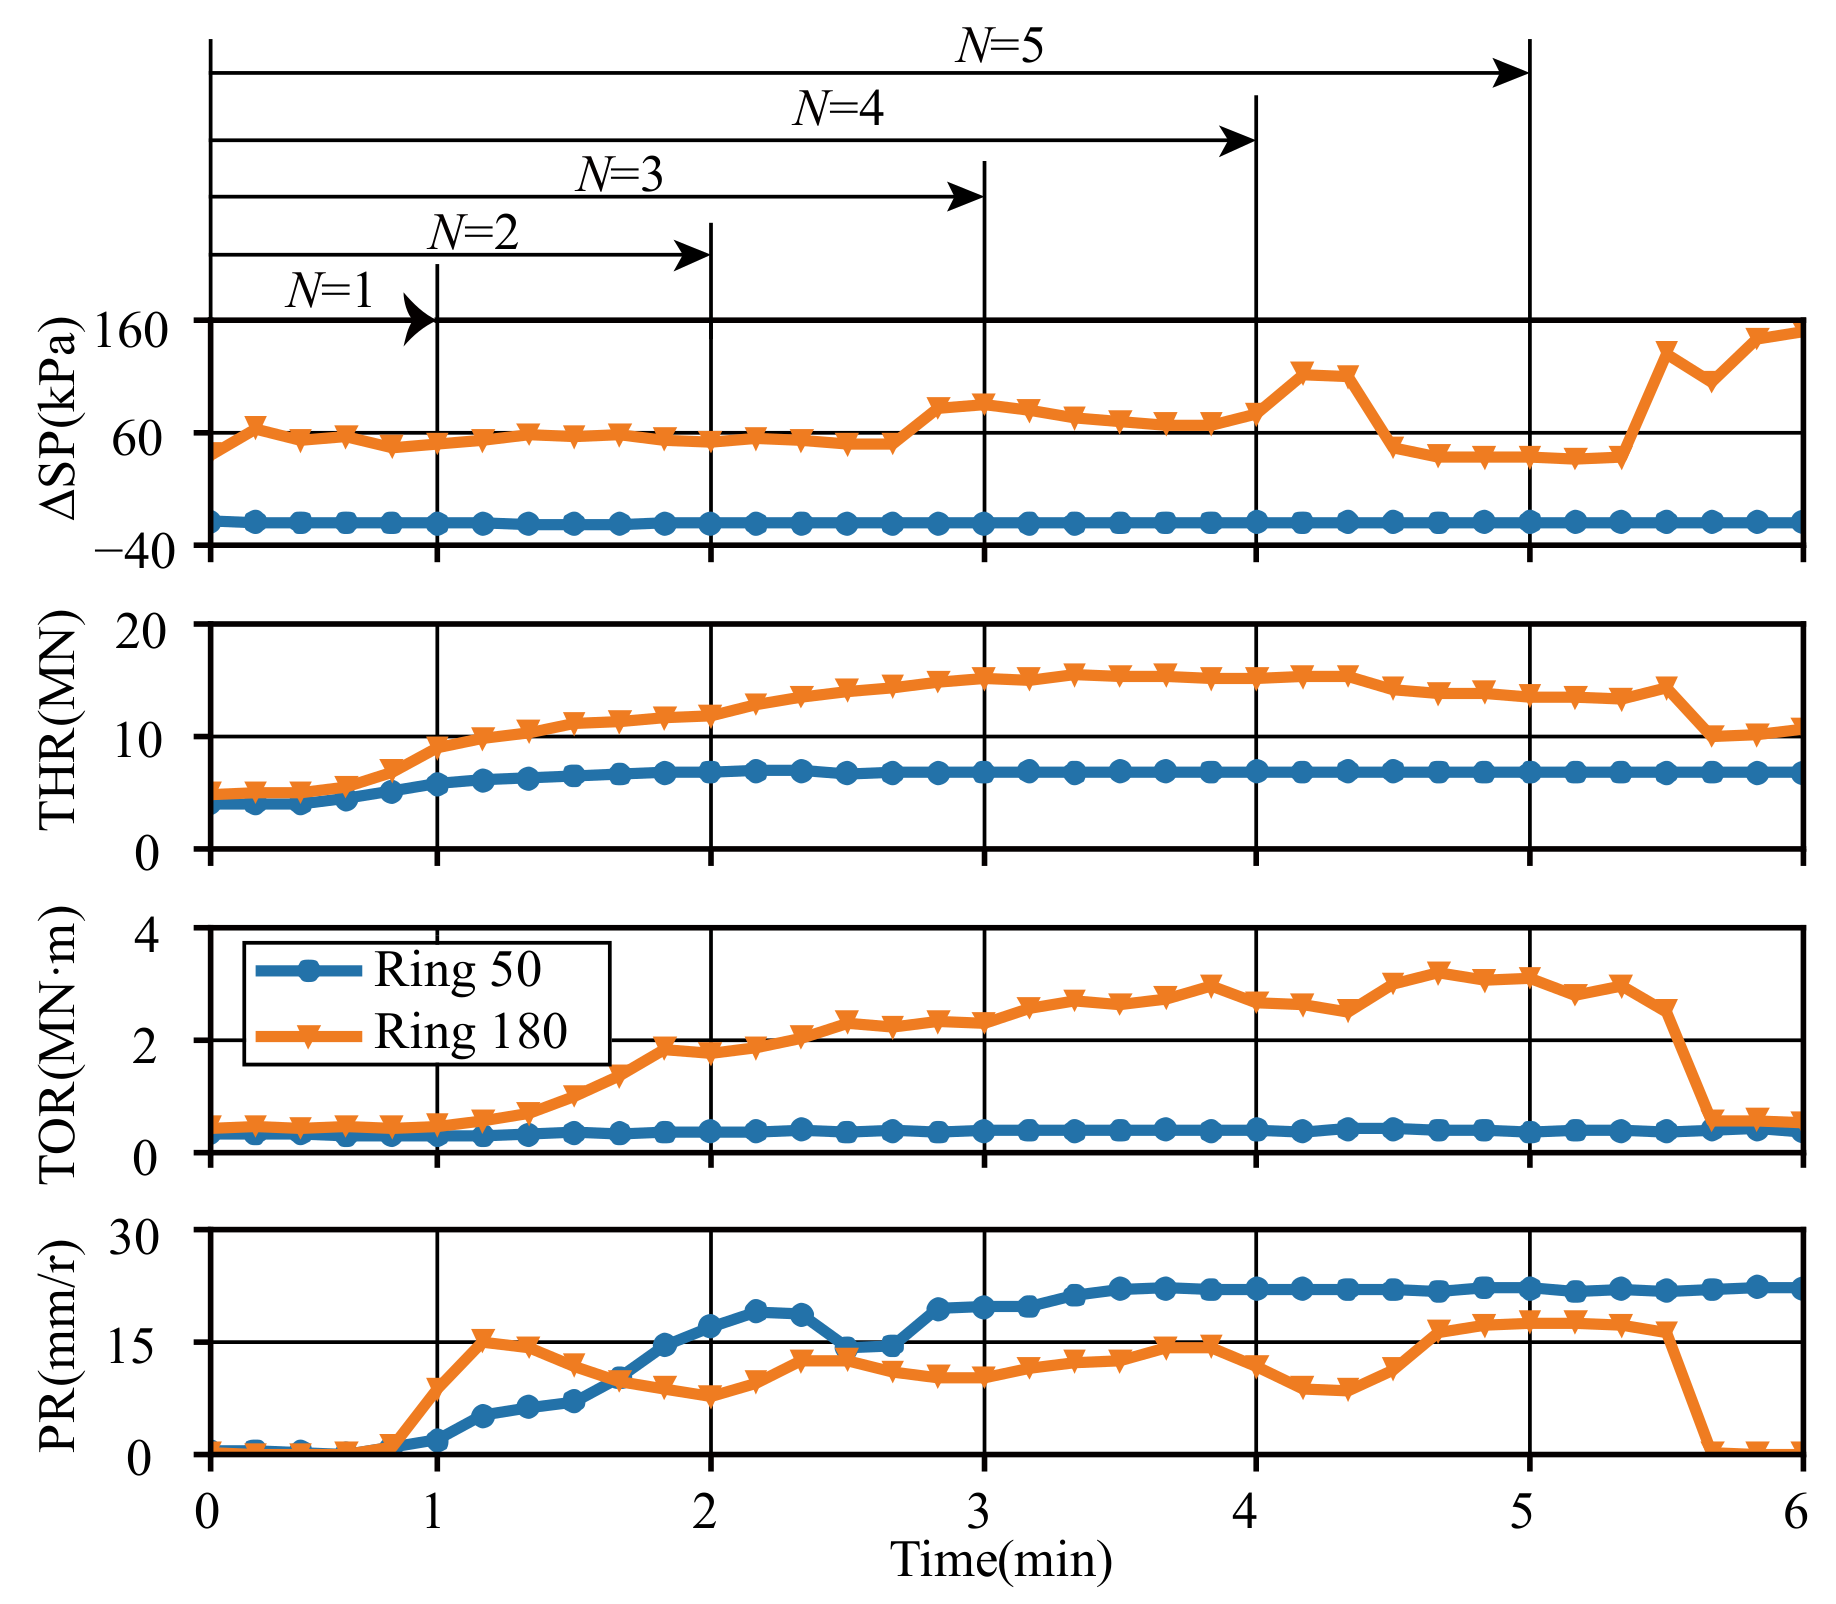
- The SPB shield tunneling in the mudstone-rich area was frequently subjected to clogging, making the statistical characteristics of the tunneling parameters quite different from the normal conditions. Furthermore, clogging was generally accompanied by high fluctuations of SPE and TOR, and low values of AR, which was harmful to tunneling safety and efficiency;
- Data allowed us to establish the following three clogging criteria for tunnels constructed in mixed ground of round gravel and mudstone: (i) SPFI of the whole ring larger than 0.15 (); (ii) average value of the TOR higher than 1 MN·m; and (iii) an average value of the AR smaller than 15 mm/min. Clogging occurred when two of these conditions were satisfied;
- The RF model provided a good prediction for the early warning of clogging using four minutes of tunneling data with an accuracy of 95%. In addition, the RF model yielded the best performance compared with the KNN model, the SVC model, and the MLP model;
- Feature importance analysis showed the crucial role of the TOR and PR in clogging. Furthermore, with the self-updating mechanism, the RF model can make a good prediction of clogging from the early beginning of one ring, which is beneficial for clogging early warnings.
Author Contributions
Funding
Institutional Review Board Statement
Informed Consent Statement
Data Availability Statement
Acknowledgments
Conflicts of Interest
References
- Thewes, M.; Hollmann, F. Assessment of clay soils and clay-rich rock for clogging of TBMs. Tunn. Undergr. Space Technol. 2016, 57, 122–128. [Google Scholar] [CrossRef]
- De Oliveira, D.G.G.; Thewes, M.; Diederichs, M.S. Clogging and flow assessment of cohesive soils for EPB tunnelling: Proposed laboratory tests for soil characterisation. Tunn. Undergr. Space Technol. 2019, 94, 103110. [Google Scholar] [CrossRef]
- Xie, X.; Wang, Q.; Huang, Z.; Qi, Y. Parametric analysis of mixshield tunnelling in mixed ground containing mudstone and protection of adjacent buildings: Case study in Nanning metro. Eur. J. Environ. Civ. Eng. 2018, 22, s130–s148. [Google Scholar] [CrossRef]
- Zhao, J.; Gong, Q.M.; Eisensten, Z. Tunnelling through a frequently changing and mixed ground: A case history in Singapore. Tunn. Undergr. Space Technol. 2007, 22, 388–400. [Google Scholar] [CrossRef]
- Tokgöz, N.; Serkan Binen, I.; Avunduk, E. An evaluation of fine grained sedimentary materials in terms of geotechnical parameters which define and control excavation performance of EPB TBM’s. Tunn. Undergr. Space Technol. 2015, 47, 211–221. [Google Scholar] [CrossRef]
- Wang, Q.; Xie, X.; Shahrour, I. Deep Learning Model for Shield Tunneling Advance Rate Prediction in Mixed Ground Condition Considering Past Operations. IEEE Access 2020, 8, 215310–215326. [Google Scholar] [CrossRef]
- Wang, Q.; Xie, X.; Yu, H.; Mooney, M.A. Predicting Slurry Pressure Balance with a Long Short-Term Memory Recurrent Neural Network in Difficult Ground Condition. Comput. Intell. Neurosci. 2021, 2021, 1–18. [Google Scholar] [CrossRef]
- Bo, L.; Qin, B. Key Techniques for Construction of Sanyang Road Cross-river Tunnel of Wuhan Rail Transit Line 7. Tunn. Constr. 2019, 39, 820–831. [Google Scholar]
- Wang, Q.; Xie, X.; Huang, Z.; Qi, Y. Protection of Adjacent Buildings Due to Mixshield Tunnelling in Mixed Ground with Round Gravel and Mudstone. In Proceedings of the World Tunnel Congress 2017—Surface Challenges—Underground Solutions, Bergen, Norway, 9–15 June 2017. [Google Scholar]
- Ye, X.; Wang, S.; Yang, J.; Sheng, D.; Xiao, C. Soil conditioning for EPB shield tunneling in argillaceous siltstone with high content of clay minerals: Case study. Int. J. Geomech. 2017, 17, 1–8. [Google Scholar] [CrossRef]
- Min, F.; Zhu, W.; Lin, C.; Guo, X. Opening the excavation chamber of the large-diameter size slurry shield: A case study in Nanjing Yangtze River Tunnel in China. Tunn. Undergr. Space Technol. 2015, 46, 18–27. [Google Scholar] [CrossRef]
- Zumsteg, R.; Puzrin, A.M.; Anagnostou, G. Effects of slurry on stickiness of excavated clays and clogging of equipment in fluid supported excavations. Tunn. Undergr. Space Technol. 2016, 58, 197–208. [Google Scholar] [CrossRef]
- Hollmann, F.S.; Thewes, M. Assessment method for clay clogging and disintegration of fines in mechanised tunnelling. Tunn. Undergr. Space Technol. Inc. Trenchless Technol. Res. 2013, 37, 96–106. [Google Scholar] [CrossRef]
- Feinendegen, M.; Ziegler, M.; Spagnoli, G.; Fernandez-Steeger, T.; Stanjek, H. A new laboratory test to evaluate the problem of clogging in mechanical tunnel driving with EPB-shields. In Proceedings of the ISRM International Symposium-EUROCK 2010, Lausanne, Switzerland, 15–18 June 2010; Taylor & Francis Group: Lausanne, Switzerland, 2010; pp. 429–432. [Google Scholar]
- Spagnoli, G.; Fernandez-Steeger, T.M. Evaluation of the clogging potential in mechanical tunnel driving with evaluation of the clogging potential in mechanical tunnel driving with EPB-shields. In Proceedings of the 15th European Conference on Soil Mechanics and Geotechnical Engineering; Anagnostopoulos, A., Pachakis, M., Tsatsanifos, C., Eds.; IOS PRESS: Athens, Greece, 2011; pp. 1633–1638. [Google Scholar]
- Zumsteg, R.; Puzrin, A.M. Stickiness and adhesion of conditioned clay pastes. Tunn. Undergr. Space Technol. 2012, 31, 86–96. [Google Scholar] [CrossRef]
- Shirlaw, J.N. Pressurised TBM tunnelling in mixed face conditions resulting from tropical weathering of igneous rock. Tunn. Undergr. Space Technol. 2016, 57, 225–240. [Google Scholar] [CrossRef]
- Avunduk, E.; Copur, H. Empirical modeling for predicting excavation performance of EPB TBM based on soil properties. Tunn. Undergr. Space Technol. 2018, 71, 340–353. [Google Scholar] [CrossRef]
- Zhang, P. A novel feature selection method based on global sensitivity analysis with application in machine learning-based prediction model. Appl. Soft Comput. J. 2019, 85, 105859. [Google Scholar] [CrossRef]
- Shivashankar, M.; Pandey, M.; Zakwan, M. Estimation of settling velocity using generalized reduced gradient (GRG) and hybrid generalized reduced gradient–genetic algorithm (hybrid GRG-GA). Acta Geophys. 2022, SI, 1–11. [Google Scholar] [CrossRef]
- Yu, H.; Tao, J.; Qin, C.; Liu, M.; Xiao, D.; Sun, H.; Liu, C. A novel constrained dense convolutional autoencoder and DNN-based semi-supervised method for shield machine tunnel geological formation recognition. Mech. Syst. Signal Process. 2022, 165, 108353. [Google Scholar] [CrossRef]
- Pandey, M.; Jamei, M.; Ahmadianfar, I.; Karbasi, M.; Lodhi, A.S.; Chu, X. Assessment of scouring around submerged spur dike in cohesive sediment mixtures: A comparative study on three rigorous machine learning models. J. Hydrol. 2021, 606, 127330. [Google Scholar] [CrossRef]
- Liu, Y.; Chen, H.; Zhang, L.; Wang, X. Risk prediction and diagnosis of water seepage in operational shield tunnels based on random forest. J. Civ. Eng. Manag. 2021, 27, 539–552. [Google Scholar] [CrossRef]
- Seker, S.E.; Ocak, I. Performance prediction of roadheaders using ensemble machine learning techniques. Neural Comput. Appl. 2019, 31, 1103–1116. [Google Scholar] [CrossRef]
- Zhang, P.; Chen, R.P.; Wu, H.N. Real-time analysis and regulation of EPB shield steering using Random Forest. Autom. Constr. 2019, 106, 102860. [Google Scholar] [CrossRef]
- Nitsche, P.; Stütz, R.; Kammer, M.; Maurer, P. Comparison of machine learning methods for evaluating pavement roughness based on vehicle response. J. Comput. Civ. Eng. 2014, 28, 1–8. [Google Scholar] [CrossRef]
- Kohestani, V.R.; Hassanlourad, M.; Ardakani, A. Evaluation of liquefaction potential based on CPT data using random forest. Nat. Hazards 2015, 79, 1079–1089. [Google Scholar] [CrossRef]
- Zhou, J.; Feng, K.; Pei, Z.; Lu, M. Pollution assessment and spatial variation of soil heavy metals in Lixia River Region of Eastern China. J. Soils Sediments 2016, 16, 748–755. [Google Scholar] [CrossRef]
- Alipour, M.; Harris, D.K.; Barnes, L.E.; Ozbulut, O.E.; Carroll, J. Load-Capacity Rating of Bridge Populations through Machine Learning: Application of Decision Trees and Random Forests. J. Bridg. Eng. 2017, 22, 1–12. [Google Scholar] [CrossRef]
- Shaikhina, T.; Lowe, D.; Daga, S.; Briggs, D.; Higgins, R.; Khovanova, N. Decision tree and random forest models for outcome prediction in antibody incompatible kidney transplantation. Biomed. Signal Process. Control 2019, 52, 456–462. [Google Scholar] [CrossRef]
- Zhang, P.; Chen, R.P.; Wu, H.N.; Liu, Y. Ground settlement induced by tunneling crossing interface of water-bearing mixed ground: A lesson from Changsha, China. Tunn. Undergr. Space Technol. 2020, 96, 103224. [Google Scholar] [CrossRef]
- Zhang, P.; Wu, H.N.; Chen, R.P.; Dai, T.; Meng, F.Y.; Wang, H.B. A critical evaluation of machine learning and deep learning in shield-ground interaction prediction. Tunn. Undergr. Space Technol. 2020, 106, 103593. [Google Scholar] [CrossRef]
- Zhou, J.; Shi, X.; Du, K.; Qiu, X.; Li, X.; Mitri, H.S. Feasibility of Random-Forest Approach for Prediction of Ground Settlements Induced by the Construction of a Shield-Driven Tunnel. Int. J. Geomech. 2017, 17, 04016129. [Google Scholar] [CrossRef]
- Luo, W.; Yuan, D.; Jin, D.; Lu, P.; Chen, J. Optimal control of slurry pressure during shield tunnelling based on random forest and particle swarm optimization. Comput. Model. Eng. Sci. 2021, 128, 109–127. [Google Scholar] [CrossRef]
- Zhu, M.; Zhu, H.; Guo, F.; Chen, X.; Ju, J.W. Tunnel condition assessment via cloud model-based random forests and self-training approach. Comput. Civ. Infrastruct. Eng. 2021, 36, 164–179. [Google Scholar] [CrossRef]
- Breiman, L. Random forests. Mach. Learn. 2001, 45, 5–32. [Google Scholar] [CrossRef] [Green Version]
- Bergstra, J.; Bengio, Y. Random search for hyper-parameter optimization. J. Mach. Learn. Res. 2012, 13, 281–305. [Google Scholar]
- Akhavian, R.; Behzadan, A.H. Smartphone-based construction workers’ activity recognition and classification. Autom. Constr. 2016, 71, 198–209. [Google Scholar] [CrossRef]
- Zhang, Q.; Liu, Z.; Tan, J. Prediction of geological conditions for a tunnel boring machine using big operational data. Autom. Constr. 2019, 100, 73–83. [Google Scholar] [CrossRef]
- Sakar, C.O.; Polat, S.O.; Katircioglu, M.; Kastro, Y. Real-time prediction of online shoppers’ purchasing intention using multilayer perceptron and LSTM recurrent neural networks. Neural Comput. Appl. 2019, 31, 6893–6908. [Google Scholar] [CrossRef]
- Fisher, A.; Rudin, C.; Dominici, F. All models are wrong, but many are useful: Learning a variable’s importance by studying an entire class of prediction models simultaneously. J. Mach. Learn. Res. 2019, 20, 1–81. [Google Scholar]


| Soil | |||||||
|---|---|---|---|---|---|---|---|
| g/cm3 | kPa | ° | MPa | m/d | |||
| Round gravel | 2.05 | 0.27 | 0.0 | 35.0 | 25.0 | 90 | 0.37 |
| Mudstone | 2.15 | 0.20 | 90.0 | 21.0 | 30.0 | 0.01 | 0.25 |
| Sample | |||||||
|---|---|---|---|---|---|---|---|
| % | % | % | % | % | % | % | |
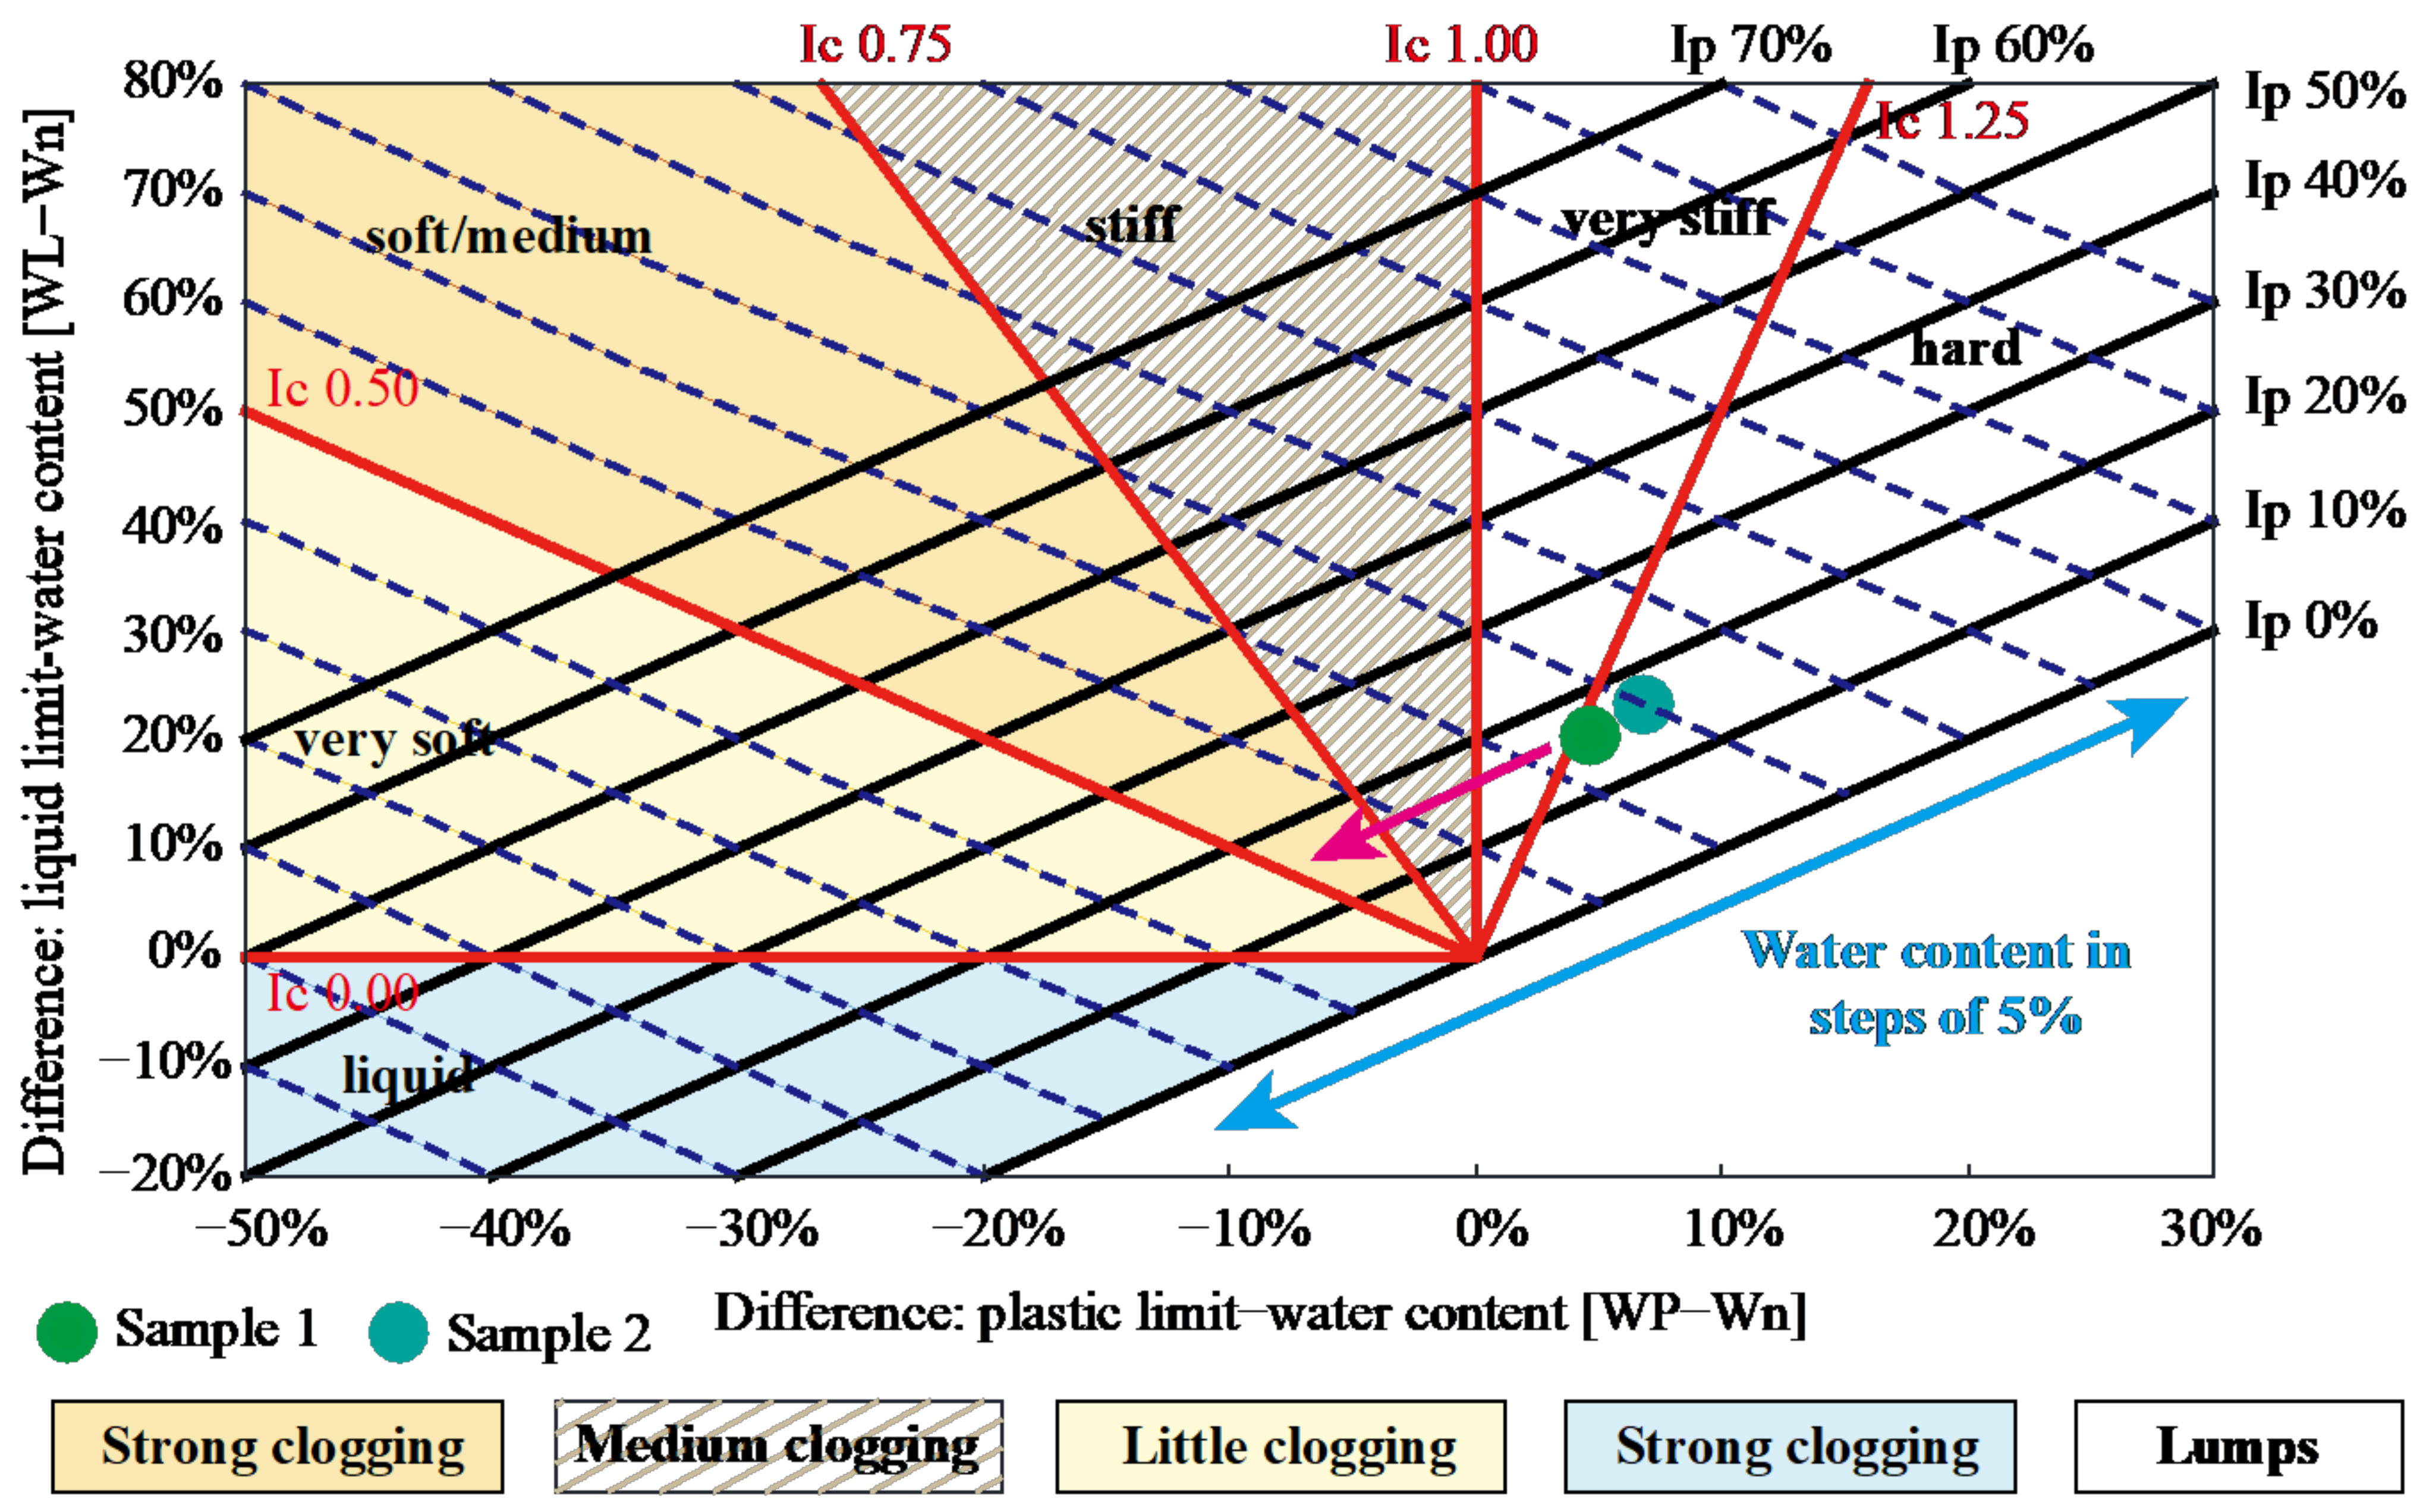
| Sample 1 | 14.9 | 35.6 | 19.6 | 16.0 | 20.7 | 4.7 | 1.29 |
| Sample 2 | 15.2 | 38.4 | 22.0 | 16.4 | 23.2 | 6.8 | 1.41 |
| Parameters\Indexes | Mean | Std | Max | Range | ||||
|---|---|---|---|---|---|---|---|---|
| Normal | Clogging | Normal | Clogging | Normal | Clogging | Normal | Clogging | |
| SPE (kPa) | 163.7 | 203.5 | 5.4 | 22.2 | 179.1 | 310.9 | 30.0 | 160.0 |
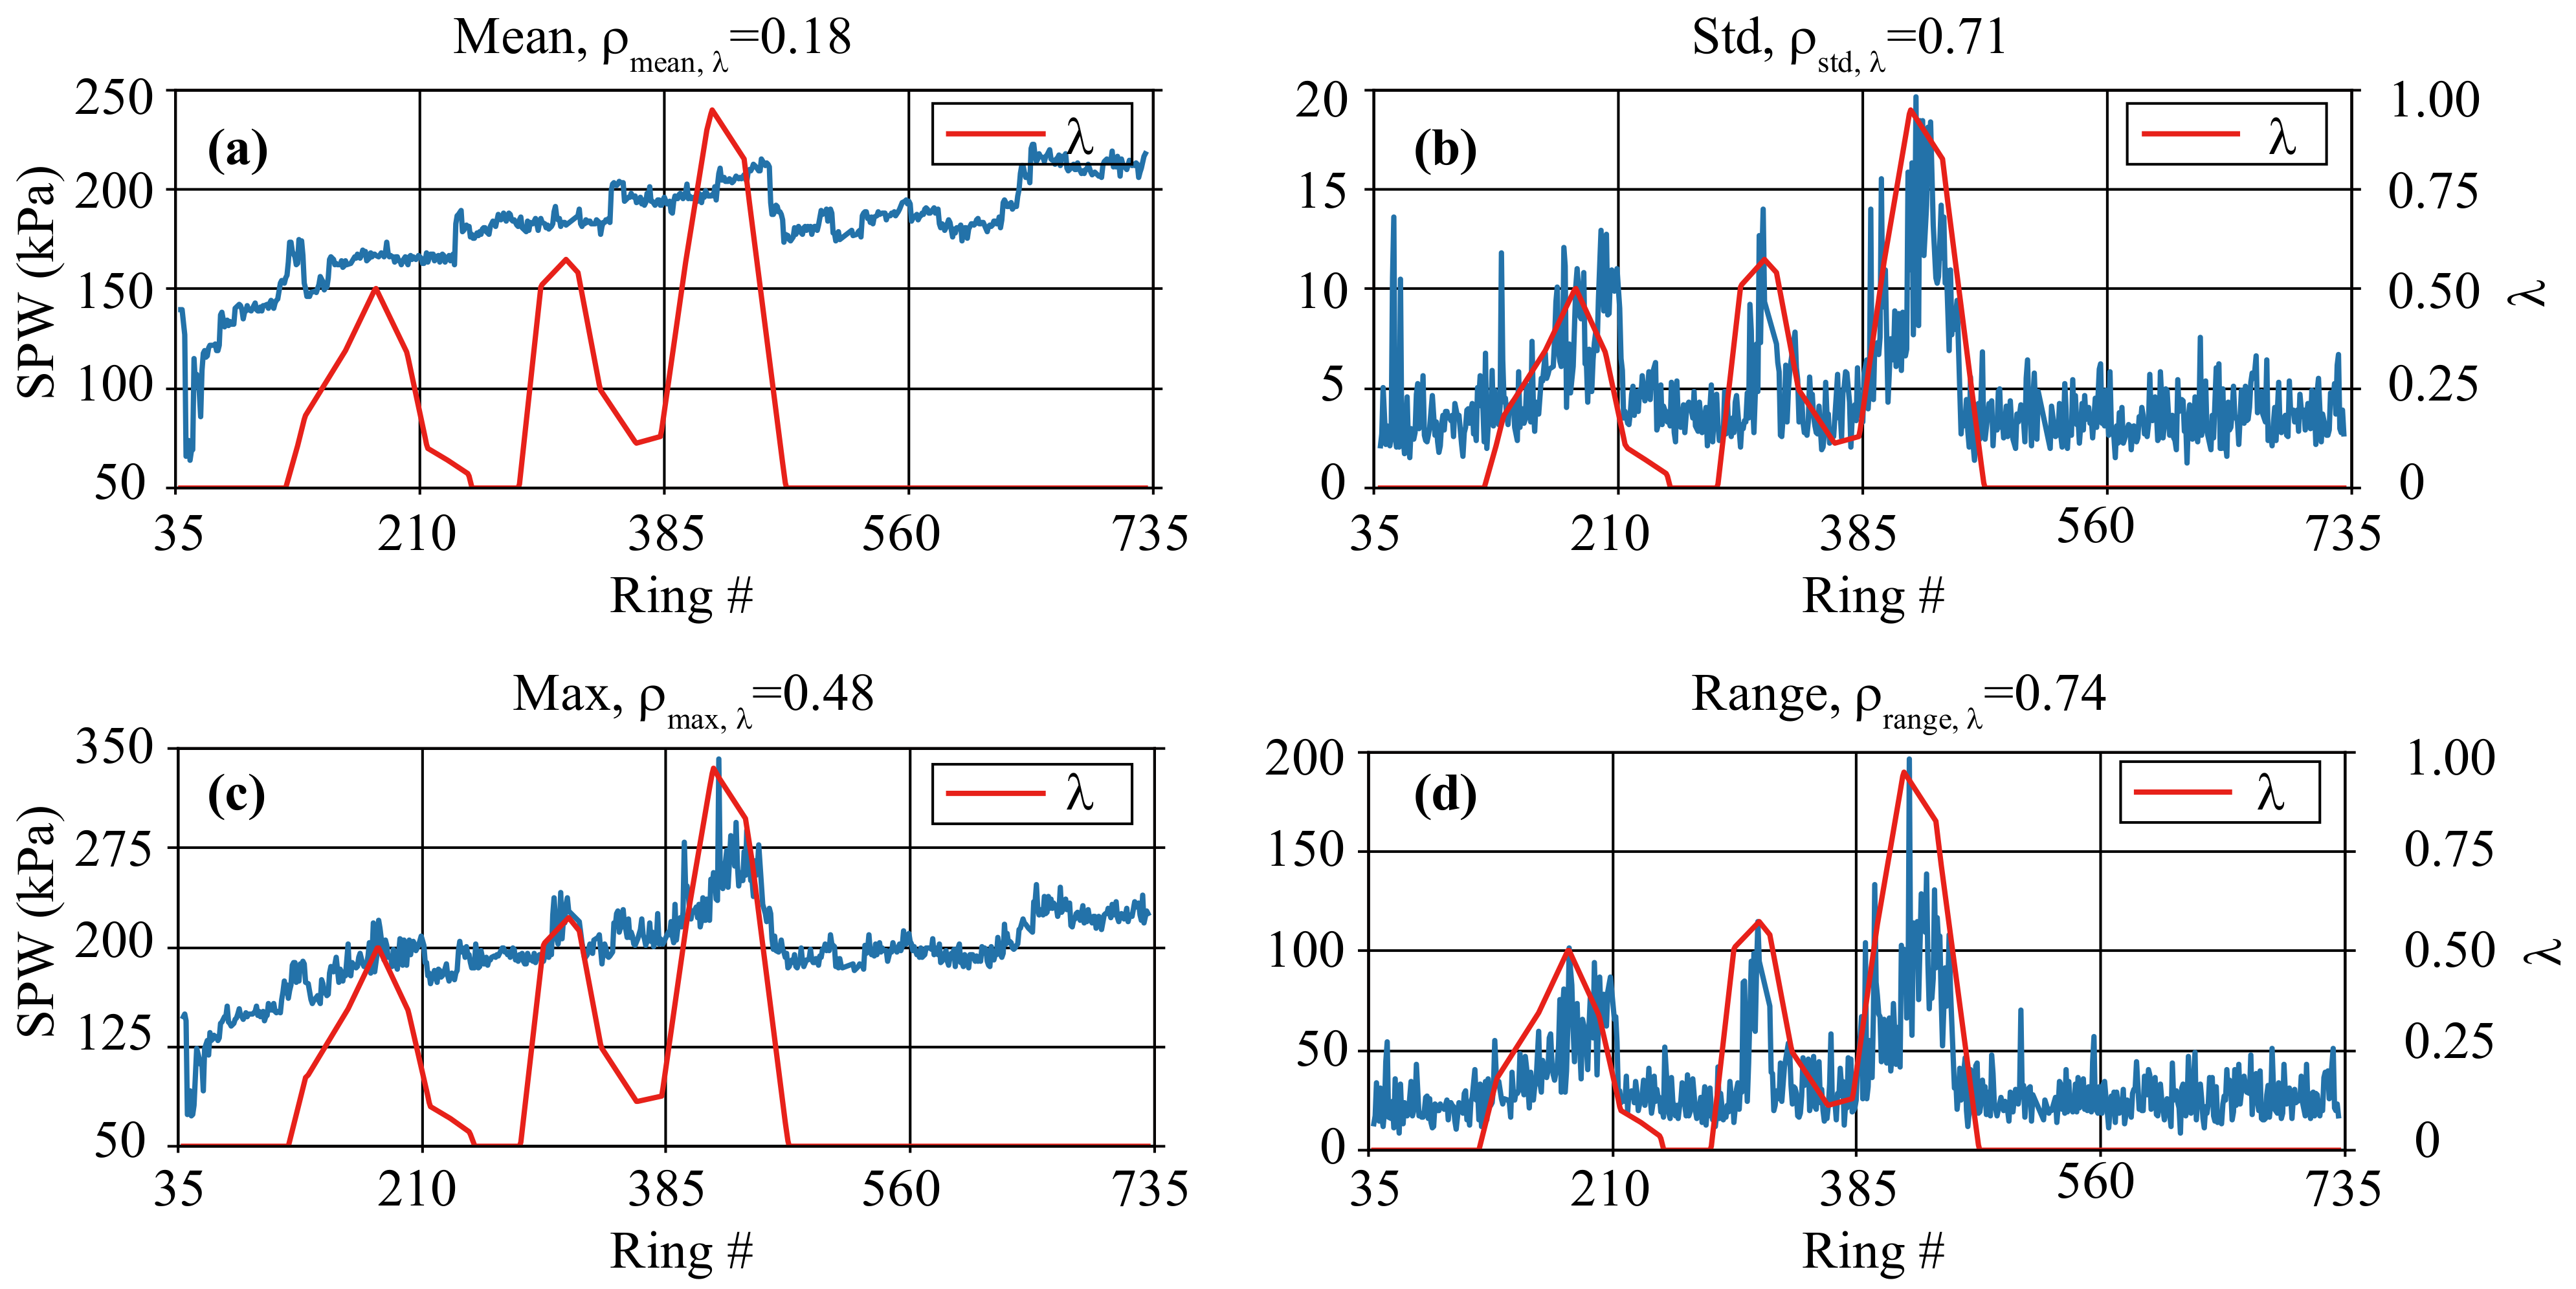
| SPW (kPa) | 180.2 | 181.7 | 3.6 | 7.0 | 191.9 | 210.2 | 25.1 | 53.9 |
| TOR (MN·m) | 0.9 | 2.2 | 0.2 | 0.5 | 1.3 | 3.5 | 1.1 | 3.1 |
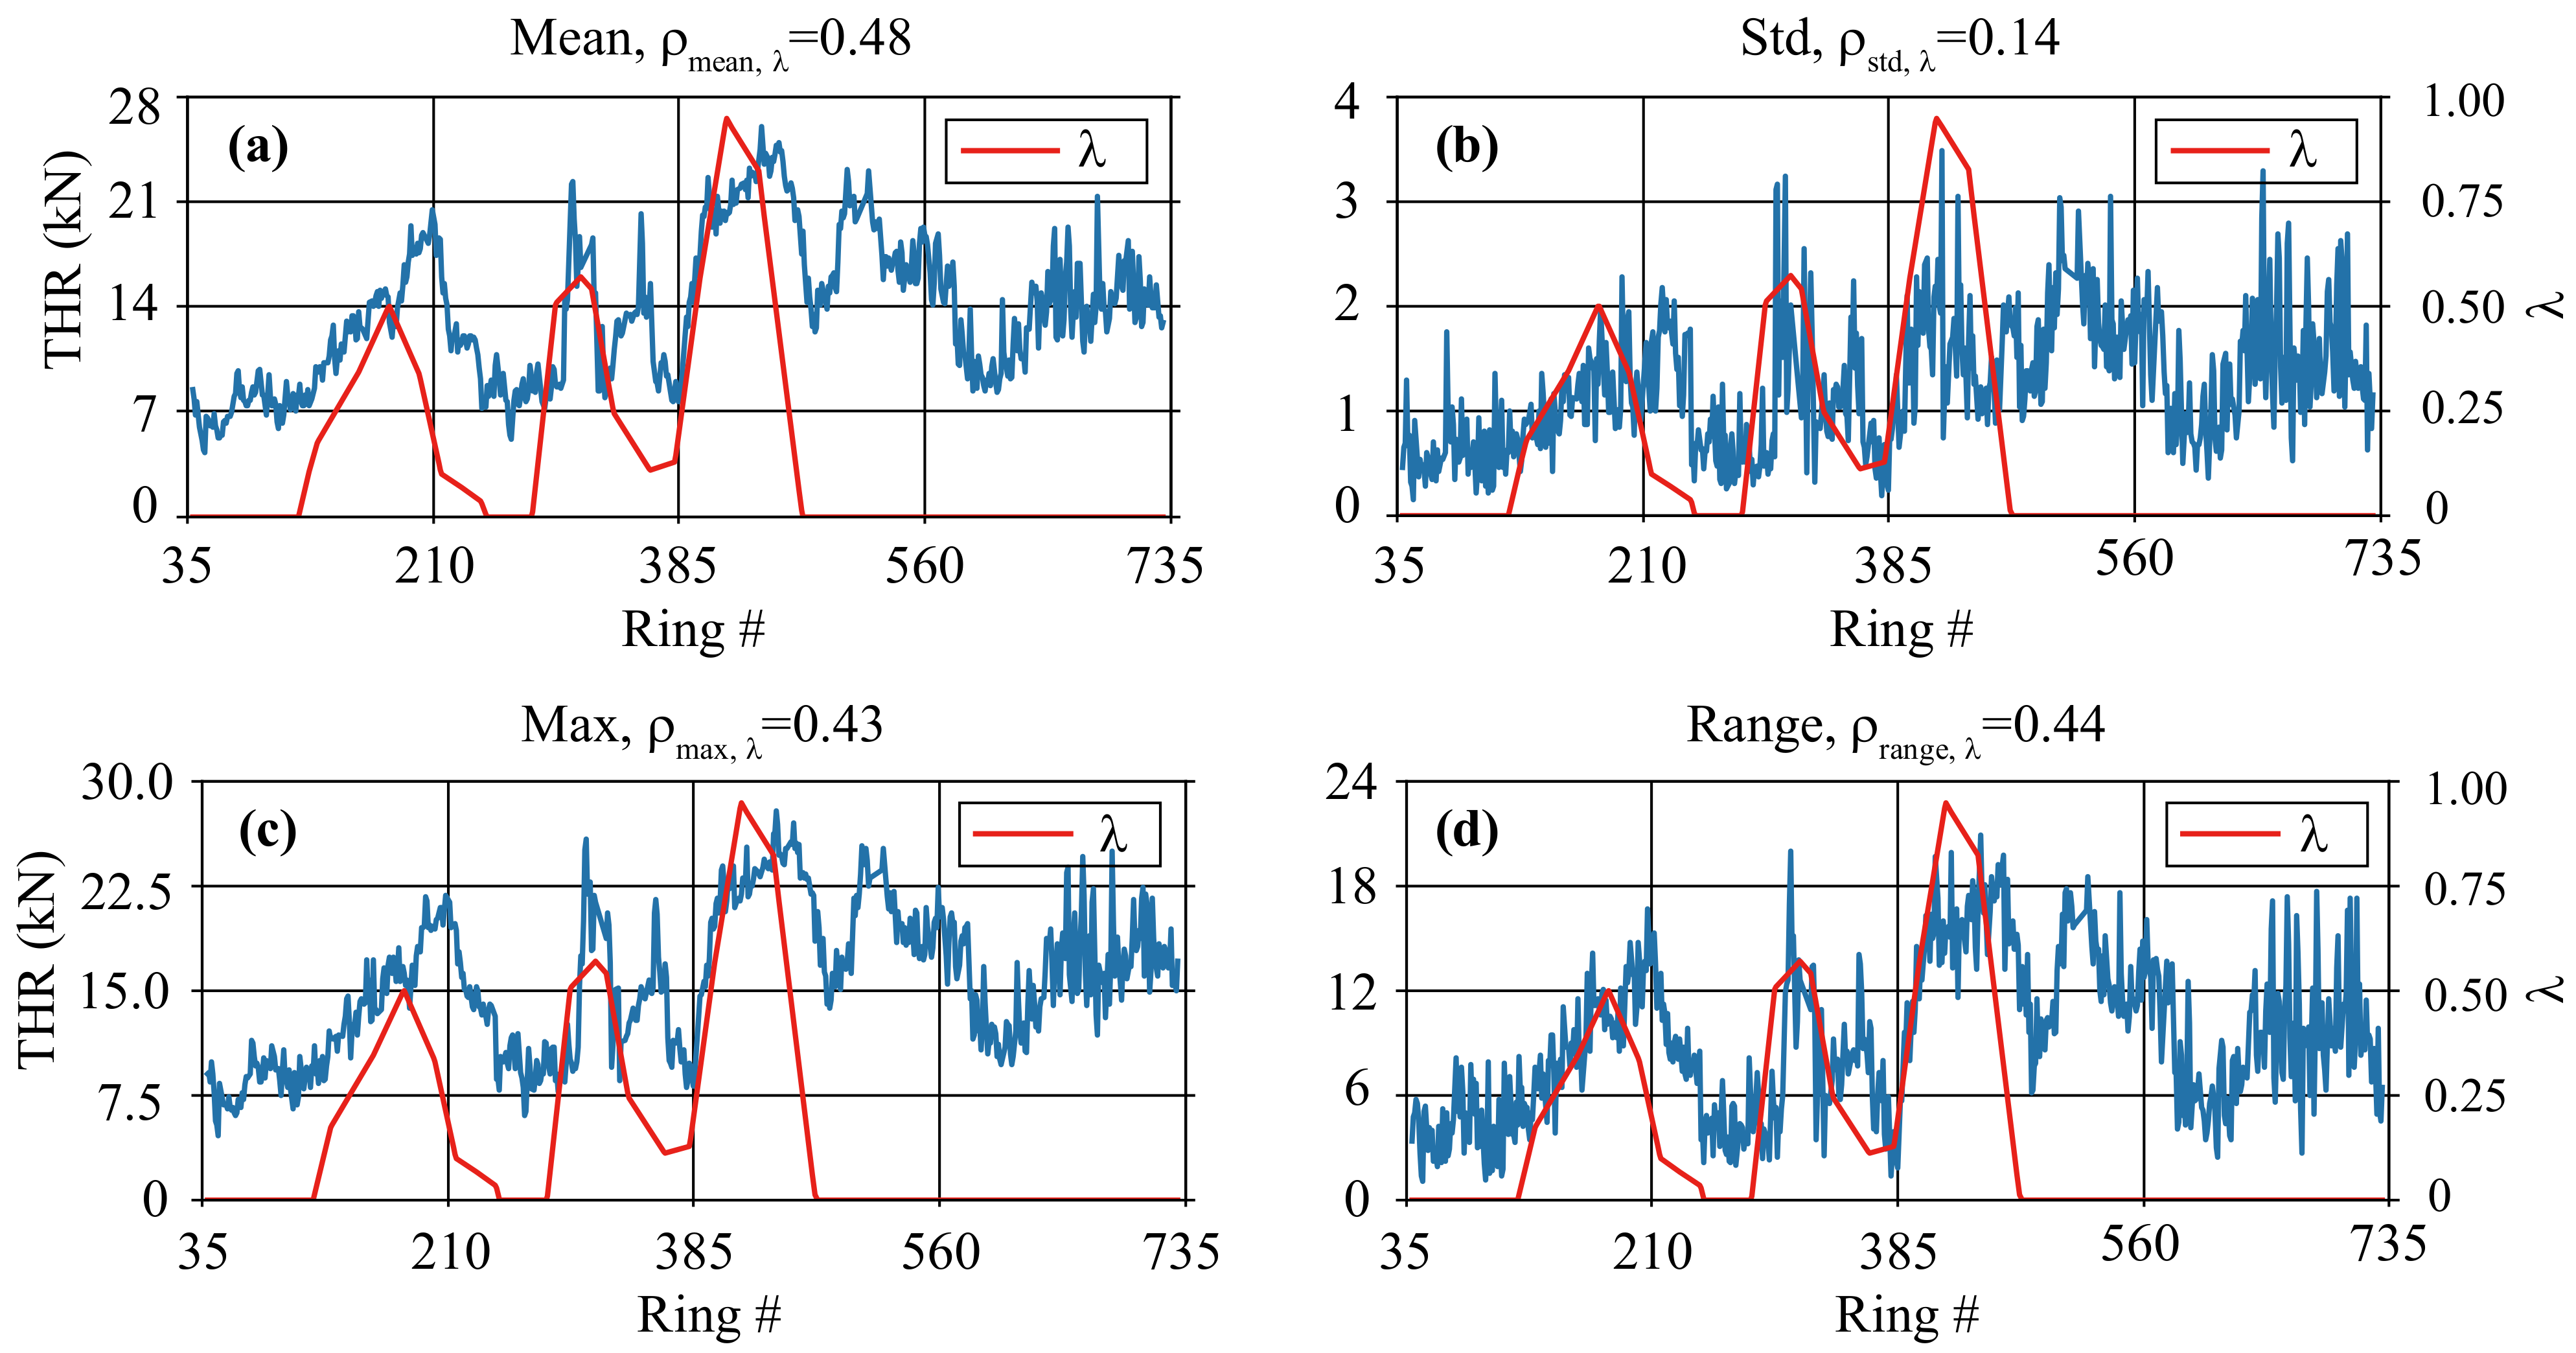
| THR (MN) | 12.1 | 16.5 | 1.2 | 1.4 | 14.1 | 18.4 | 7.9 | 11.8 |
| RS (rpm) | 1.0 | 1.2 | 0.03 | 0.05 | 1.1 | 1.3 | 0.2 | 0.2 |
| AR (mm/min) | 26.9 | 10.1 | 8.0 | 4.4 | 37.5 | 25.2 | 37.4 | 25.2 |
| Actual Class | |||
|---|---|---|---|
| P: Clogging | N: Normal | ||
| Predicted class | P: Clogging | TP | FP |
| N: Normal | FN | TN | |
| Tunneling Data Length (Minutes) | Error Rate (%) | Precision (%) | Recall (%) | F1 (%) | ||||
|---|---|---|---|---|---|---|---|---|
| Updating | No Updating | Updating | No Updating | Updating | No Updating | Updating | No Updating | |
| 0.5 | 16.5 | 20.7 | 80.5 | 80.2 | 77.3 | 62.8 | 78.9 | 70.4 |
| 1 | 11.6 | 18.6 | 88.6 | 77.5 | 81.2 | 75.2 | 84.7 | 76.3 |
| 2 | 9.7 | 24.5 | 89.5 | 64.3 | 85.6 | 84.5 | 87.5 | 73.0 |
| 3 | 6.4 | 12.5 | 82.5 | 80.1 | 91.3 | 91.2 | 86.7 | 85.3 |
| 4 | 5.2 | 9.7 | 93.8 | 84.6 | 93.4 | 92.7 | 93.6 | 88.5 |
| 5 | 4.2 | 5.4 | 95.6 | 94.1 | 93.9 | 92.8 | 94.7 | 93.4 |
| 6 | 4.3 | 5.5 | 95.1 | 95.2 | 93.9 | 92.6 | 94.5 | 93.9 |
| 8 | 4.3 | 5.2 | 95.1 | 94.2 | 94.0 | 92.8 | 94.6 | 93.5 |
Publisher’s Note: MDPI stays neutral with regard to jurisdictional claims in published maps and institutional affiliations. |
© 2022 by the authors. Licensee MDPI, Basel, Switzerland. This article is an open access article distributed under the terms and conditions of the Creative Commons Attribution (CC BY) license (https://creativecommons.org/licenses/by/4.0/).
Share and Cite
Zhai, J.; Wang, Q.; Yuan, D.; Zhang, W.; Wang, H.; Xie, X.; Shahrour, I. Clogging Risk Early Warning for Slurry Shield Tunneling in Mixed Mudstone–Gravel Ground: A Real-Time Self-Updating Machine Learning Approach. Sustainability 2022, 14, 1368. https://doi.org/10.3390/su14031368
Zhai J, Wang Q, Yuan D, Zhang W, Wang H, Xie X, Shahrour I. Clogging Risk Early Warning for Slurry Shield Tunneling in Mixed Mudstone–Gravel Ground: A Real-Time Self-Updating Machine Learning Approach. Sustainability. 2022; 14(3):1368. https://doi.org/10.3390/su14031368
Chicago/Turabian StyleZhai, Junli, Qiang Wang, Dongyang Yuan, Weikang Zhang, Haozheng Wang, Xiongyao Xie, and Isam Shahrour. 2022. "Clogging Risk Early Warning for Slurry Shield Tunneling in Mixed Mudstone–Gravel Ground: A Real-Time Self-Updating Machine Learning Approach" Sustainability 14, no. 3: 1368. https://doi.org/10.3390/su14031368
APA StyleZhai, J., Wang, Q., Yuan, D., Zhang, W., Wang, H., Xie, X., & Shahrour, I. (2022). Clogging Risk Early Warning for Slurry Shield Tunneling in Mixed Mudstone–Gravel Ground: A Real-Time Self-Updating Machine Learning Approach. Sustainability, 14(3), 1368. https://doi.org/10.3390/su14031368