Article

Environmental Assessment of a Diesel Engine Fueled with Various Biodiesel Blends: Polynomial Regression and Grey Wolf Optimization

1
Department of Mechanical Engineering, Faculty of Engineering, Tafila Technical University, Tafila 66110, Jordan
2
Department of Automated Systems, Faculty of Artificial Intelligence, Al-Balqa Applied University, Al-Salt 19117, Jordan
3
Renewable Energy Engineering Department, Faculty of Engineering, Amman Arab University, Amman 11953, Jordan
4
College of Engineering at Wadi Addawaser, Prince Sattam Bin Abdulaziz University, AI-Kharj 16278, Saudi Arabia
5
Electrical Engineering Department, Faculty of Engineering, Minia University, Minia 61517, Egypt
*
Author to whom correspondence should be addressed.
Sustainability 2022, 14(3), 1367; https://doi.org/10.3390/su14031367
Submission received: 23 December 2021 / Revised: 20 January 2022 / Accepted: 22 January 2022 / Published: 25 January 2022

Abstract

:
A series of tests were carried out to assess the environmental effects of biodiesel blends made of different vegetable oil, such as corn, sunflower, and palm, on exhaust and noise diesel engine emissions. Biodiesel blends with 20% vegetable oil biodiesel and 80% diesel fuel by volume were developed. The tests were conducted in a stationary diesel engine test bed consisting of a single-cylinder, four-stroke, and direct injection engine at variable engine speed. A prediction framework in terms of polynomial regression (PR) was first adopted to determine the correlation between the independent variables (engine speed, fuel type) and the dependent variables (exhaust emissions, noise level, and brake thermal efficiency). After that, a regression model was optimized by the grey wolf optimization (GWO) algorithm to update the current positions of the population in the discrete searching space, resulting in the optimal engine speed and fuel type for lower exhaust and noise emissions and maximizing engine performance. The following conclusions were drawn from the experimental and optimization results: in general, the emissions of unburned hydrocarbon (UHC), carbon dioxide (CO2), and carbon monoxide (CO) from all the different types of biodiesel blends were lower than those of diesel fuel. In contrast, the concentration of nitrogen oxides (NOx) emitted by all the types of biodiesel blends increased. The noise level produced by all the forms of biodiesel, especially palm biodiesel fuel, was lowered when compared to pure diesel. All the tested fuels had a high noise level in the middle frequency band, at 75% engine load, and high engine speeds. On average, the proposed PR-GWO model exhibited remarkable predictive reliability, with a high square of correlation coefficient (R2) of 0.9823 and a low root mean square error (RMSE) of 0.0177. Finally, the proposed model achieved superior outcomes, which may be utilized to predict and maximize engine performance and minimize exhaust and noise emissions.

1. Introduction

Recently, the interest in sustainable, eco–friendly, and renewable fuels has been growing as a result of environmental degradation from environmental pollution and the limited supply of conventional petroleum [1,2,3]. As a result of the growing knowledge of the environmental threats to human health, efforts have been made to keep engine emissions under control. Vibration, exhaust, and noise emissions are all major issues with diesel fuel [4,5,6].
Many combustion technologies, such as dual-fuel [7], partially premixed combustion (PPC) [8], advanced combustion system with optimized bowl and innovative fuel injection system [9], improved fuel injection [10], and employed exhaust gas recirculation (EGR) system [11], have been developed to minimize diesel engine exhaust emissions. Many researchers believe that biodiesel has the potential to reduce such emissions as hydrocarbon (HC), carbon monoxide (CO), and carbon dioxide (CO2), and with little increase in nitrogen oxides (NOx) emissions [12,13]. Biodiesel is a sustainable, biodegradable fuel derived from vegetable oils and animal fats as an alternative to fossil fuel through the transesterification method. Kalligeros et al. [14] evaluated the exhausted biodiesel emission that was fueled with a sunflower oil methyl ester. The authors remarked that the reduction in carbon monoxide, particulate matter, unburned hydrocarbon, and nitrogen oxide emissions compared to pure diesel blends were achieved. Fattah et al. [15] concluded that palm biodiesel fuel could dramatically reduce the HC and CO emissions by up to 50% compared to neat diesel fuel. Sanjid et al. [16] experimentally tested a compression ignition engine and compared the noise levels of various types of biodiesel. The results revealed that the combined blends of palm and jatropha biodiesel have a slightly higher brake specific fuel consumption rather than that of pure diesel. The acoustic emission was reduced in the range of 2.5% to 5% depending on blend ratios ranging from 5 to 10 by volume, respectively. This reduction may occur because of a decreased ignition delay period and improved lubricity. Another study by Sanjid et al. [17] compared the performance and exhaust emissions of two types of biodiesels, namely mustard and palm biodiesel fuels with 10% and 20% by volume blends. The results showed that the UHC of mustard biodiesel is 9% and 1.5% higher than that of palm biodiesel by 10% and 20% blends, respectively. Ndayishimiye and Tazerout [18] examined the engine performance and exhaust emission of a diesel engine fueled with palm oil blends. The authors found a small increase in brake specific fuel consumption (BSFC), brake thermal efficiency (BTE), and NOx emission compared to pure diesel fuel. However, a dramatic reduction in HC and CO emissions up to 65% compared to pure diesel fuel could be recorded. Rakopoulos et al. [19] reported that the peak of nitric oxide (NO) emission value for both n-butanol blends of 25% by volume and bio-diesel blend of 30% by volume was increased by 51% and 30%, respectively, compared to pure diesel. Uludamar et al. [20] experimentally examined the four cylinders, four-stroke, diesel engine fueled with different blends and types of biodiesel, namely corn, canola, and sunflower biodiesel, supplemented with hydrogen. The results showed a reduction in HC, CO, NOx, and noise emissions compared to pure diesel and biodiesel fuels that were not hydrogen-enriched. To overcome the higher viscosity of biodiesel fuel and thus improve its performance, Patel et al. [21] indicated that using biodiesel fuel instead of pure diesel would necessitate some modifications in diesel engines, particularly for the fuel filter, fuel pumps, and injector needle. Yuvarajan et al. [22] showed that supplementing a nanoparticle such as titanium oxide (TiO2) into diesel–biodiesel blends could reduce exhaust emissions.
Although there are many publications related to the outcome of biodiesel in terms of performance, combustion characteristics, and exhaust emissions, there are relatively few papers covering the acoustic emission aspects. The noise from the diesel engine comes from the gas flow, combustion behavior, and mechanical movement [23]. The gas flow noise is corresponding to the suction and exhaust stroke, while the mechanical noise is associated with piston movement, crankshaft, gears, valve trains, injection movement, and bearing. The combustion noise is associated with the maximum rate of the rising pressure inside the cylinder. Many researchers [19,23,24,25,26,27] have shown that fuel properties are some of the main factors that directly affect the diesel engine noise in terms of heating value, cetane number, chemical structure, fuel viscosity, fuel density, and heat of vaporization, etc. All these properties are responsible for the ignition delay period and, subsequently, the inside cylinder pressure rise rate. The most significant characteristics in the acoustic quality assessment of the engine are sharpness, loudness, strength, and roughness. Redel-Macias et al. [28] stated that, the higher the amount of biodiesel blend derived from palm oil methyl esters (PME), the greater attenuation of maximum engine noise in terms of loudness, while the high amount of biodiesel derived from olive pomace oil methyl esters (OPME) in blends resulted in the greatest attenuation of roughness. Aydin [29] found the canola biodiesel is better than diesel fuel according to noise emission criteria because it has a lower heating value and better lubrication characteristics. Conversely, Torregrosa et al. [30] stated that diesel engine noise increased with the increase in biodiesel content in the tested fuels. Bunce et al. [31] suggested using soy biodiesel instead of pure diesel to reduce the exhaust and noise emitted from a calibrated diesel engine. How et al. [32] conveyed that biodiesel blends were accompanied by a decreased short ignition delay, decreased peak heat release rate, and increased combustion duration. In another study, Torregrosa et al. [33] studied the effect of the injection on combustion noise for diesel engines. They revealed that the rise in inside cylinder pressure has a substantial influence on combustion noise. One of the important techniques used to reduce engine noise is controlling the ignition delay period. For instance, a shorter ignition delay diminishes the maximum pressure in the cylinder, thereby decreasing the combustion noise [34]. Nguyen and Mikami [35] added 10% of volume hydrogen in the suction air manifold of a single-cylinder diesel engine to minimize the engine noise considerably.
Because experimental investigations on biodiesel blends under various operating situations to identify their optimal engine outputs and lowest emissions generated are expensive, restricted, and time-consuming, any other effective approaches for assessing these attributes are required [36]. The use of optimization techniques is a beneficial strategy for reducing the need for extensive experimental testing. Many scholars have established and employed a variety of meta-heuristic algorithm optimization approaches in design analysis. Particle swarm optimization technique (PSO), genetic algorithm optimization (GA), ant colony optimization algorithm, artificial neural network (ANN), response surface methodology (RSM), artificial bee colony optimization algorithm, Taguchi’s optimization approach, and other algorithms have been widely used to improve engine performance and reduce exhaust emissions [37,38]. Kumar et al. [39] developed the RSM-based Box–Behnken approach design (BBD) to optimize biodiesel transesterification production parameters, such as temperature, molar ratio, reaction duration, and catalyst concentration, for a blending of Jatropha–algae oil. Adam et al. [40] investigated the effects of engine speed and load, as well as the fuel blend ratio, on the emissions and performance of an indirect injection (IDI) diesel engine powered by a rubber seed and palm oil blend. The engine performance and exhaust emission were assessed using a statistical BBD based on RSM. With a fuel blend of 18%, engine speed of 2320 rpm, and engine load of 82%, an ideal desirability value of 0.96 was achieved for the tested IDI engine. Xu et al. [41] investigated the exhaust emissions and performance of a compression ignition (CI) engine running on biodiesel blends of a 20% Jatropha curcas (J20) using various injection schemes. The parameters of the start of injection time, fuel injection pressure, and pilot-main injection periods were optimized using RSM and the desirability metric, resulting in increased performance and lower emissions. Bhowmik et al. [42] proposed using a coupled ANN with a multi-objective response surface method (MORSM) to simulate and optimize the exhaust emissions and performance of a diesel engine powered with diesosenol blends. According to the trade-off study: the ethanol portion of 10% and a kerosene portion of 2.42% by volumes at 74.14% diesel engine load are optimum attribute blend combinations and engine load, respectively. Yilmaz et al. [43] employed two alternative approaches to model engine emissions and performance. They evaluated RSM with support-vector machines (SVM) of least-squares (LS) version and concluded that, while SVM-LS was marginally more effective than RSM in predicting engine emissions and performance, RSM was still capable of accomplishing this. Dey et al. [44] established an ANN and fuzzy-based approach for predicting and optimizing diesel engine emissions and performance in relation to engine load and fuel blend. This experiment employed a single-cylinder diesel engine that was powered on palm biodiesel ethanol mixtures. The engine is driven at various loads ranging from 20 to 100% at 1500 rpm. According to a fuzzy model, at 20% load of 85% diesel, 10% palm biodiesel, and 5% ethanol by volumes has the highest index of multi-performance characteristics compared to other blends. Tosun et al. [45] developed an ANN model for forecasting diesel engine exhaust emissions in terms of CO and NOx. Diesel, peanut biodiesel, and a variety of peanut biodiesel and alcohol blends were used to power the diesel engine. Using a backpropagation approach combined with a multilayer feed-forward neural network model, researchers were able to predict outcomes more efficiently, robustly, and accurately than they could do with simple regression models. Uslu [46] compared two optimization strategies for identifying the optimum responses with the optimal operating variables for a diesel engine in terms of ANN and RSM implementations. The R2 values for the generated RSM model exceed 0.90, whereas R2 values for the ANN model range from 0.88 to 0.95. With optimal operating variables of 35 °CA injection advance, 17.88% palm oil percentage, and 780-Watt engine load, the optimal results were achieved as 0.126%, 196.25 ppm, and 189.764 ppm for CO, NOx, HC, respectively. Yldrm et al. [47] examined three different biodiesel blends, canola, sunflower, and corn, in a four-cylinder diesel engine, focusing on engine vibration, noise, and emissions while adding hydrogen to these blends. They used two artificial intelligence approaches to attempt to change the optimal hydrogen enrichment rate: (ANN) and (SVM). The R2 and the best mean average error are 0.9615 and 0.39 for noise, 0.9398 and 5.07 for NOx, 0.993 and 2.21 for CO2 values, and 0.8549 and 7.27 for CO. Furthermore, ANN was indicated to be more successful than SVM. Najafi et al. [48] utilized ANN and RSM to evaluate the energy and exergy of a CI engine running on waste cooking oil biodiesel. The experiments were carried out with varying loads and fuel blends at a constant engine speed. According to the data, the optimum results were achieved at an 80% engine load with a 20% biodiesel ratio. For biodiesel synthesis, Saqib et al. [49] employed the (RSM) to optimize the reaction parameters, such as molar ratio, catalyst concentration, reaction duration, and reaction temperature; biodiesel of rapeseed oil was used as feedstock. In addition, the behavior of biodiesel-generated exhaust emissions has been observed. According to optimized biodiesel production, the following were the best experimental conditions for producing biodiesel: reaction temperature 55 °C, catalyst concentration (%) 0.30, reaction period 60 min, and molar ratio 6.75. Biodiesel yields of 97.5% were produced under these ideal circumstances. According to the findings, the CO and particulate matter (PM) emissions for biodiesel were lower than those of pure diesel fuel. The NOX emissions of the biodiesel were lower compared to pure diesel for low biodiesel blends.
The grey wolf optimization (GWO) is an optimization approach that may be used to achieve diversified objectives in a variety of optimization tasks. The GWO has attracted the attention of scientists in various scientific and engineering sectors. In the literature, a limited number of research works are available on GWO for the environmental effect of a diesel engine fueled with various biodiesel blends. Samuel et al. [50] integrated the RSM and GWO to simulate the waste sunflower biodiesel synthesis from wasted sunflower oil. The densities of several biodiesel mixers were correlated using the least square regression approach. The highest yield of biodiesel fuel (96.70%) was obtained with a methanol/oil molar ratio of 5.99/1, a catalyst amount of 1.1 wt.%, and a reaction period of 77.6 min. Gujarathi et al. [51] employed the GWO to improve the diesel engine’s performance and emissions. A wide variety of factors, including BSFC, HC, CO, NOx, and PM, were taken into account throughout the optimization process. The researchers concluded that the GWO can identify the optimal parameters with minimum cost. Ileri et al. [52] optimized the cetane content in diesel engine blend fuel. They used the GWO to execute a series of experiments under various settings in order to determine the best blend outcomes. They considered engine performance as well as combustion emission throughout the optimization procedure. Finally, they computed the optimum engine performance after determining the best fuel blend under various scenarios. Luo et al. [53] enhanced the GWO by increasing the weight of the leader wolf location. The new approach surpasses the predecessor in terms of optimization accuracy and convergence speed. The new method has a minimal cost when it comes to solving technical engineering challenges. Another improvement for GWO was made by Vijay and Nanda [54]. They used three strategies: control level, prey weight, and both. They evaluated the performance of the innovated method relative to that of five other algorithms, comparing noise, data scalability, and algorithm parameter. According to the authors, the suggested approach outperformed PSO and GWO in the confined search space by obtaining the least value (global optima for most functions).
The present study focuses on a diesel engine that is run at full load and at varying engine speeds. The environmental behaviors in terms of the exhaust and noise emissions of an unmodified diesel engine fueled by corn, sunflower, and palm biodiesel blends have been carefully tested in this study experimentally. A prediction framework is proposed in this study by combining polynomial regression (PR) with GWO. Polynomial regression was used to establish the correlation between the independent factors (engine speed, fuel type) and the dependent variables in the suggested strategy (exhaust emissions, noise level, and brake thermal efficiency). The GWO technique was then used to optimize a regression model to update the population’s current locations in the discrete searching space, resulting in the optimal engine speed and fuel type for minimizing exhaust pollutants and noise levels while maximizing engine performance. The novelty of the study is to efficiently model and minimize noise and exhaust emissions concerning fuel types and engine speed while also improving engine performance. The following three points clearly define the novelty in this study:
  • Although there are many articles in the literature regarding engine performance and exhaust emission using different biodiesel fuel blends, there is still a gap in its acoustic emissions on the diesel engine. Commonly, the diesel engine is one of the major sources of noise in the automobile industry. Accordingly, significant consideration should be taken to minimize diesel engine noise levels.
  • Biodiesel fuel has been extensively researched, as mentioned in the preceding literature. However, there is limited study in the literature on the use of the latest up-to-date optimization approaches in terms of GWO for environmental evaluation of corn, palm, and sunflower biodiesel blends. The GWO method has superior qualities over other swarm intelligence approaches, such as its high flexibility and speedy programmability [55]. Furthermore, GWO requires no search space derivation information and operates with fewer parameters [56]. Through the search phase, the algorithm benefits from a balance of exploration and exploitation, leading to high convergence [57].
  • Moreover, there is no current literature on using polynomial regression with the GWO algorithm to reduce diesel engine exhaust emissions and improve engine performance. Considering the paucity of studies in the literature on the implementation of GWO in internal combustion engines, additional research is needed. The primary purpose of this research is to use the GWO to determine the optimal engine speed and fuel type in order to reduce exhaust and noise emissions, as well as to improve engine performance. The significant technical benefit of optimizing fuel type and engine speed is that it reduces the environmental effect of diesel engine exhaust and noise emissions while also improving engine performance. Furthermore, finding the relationship between independent factors, mathematically modeling the system, is an important benefit in cost and time savings by minimizing the number of experiments.

2. Experimental Setup, Equipment, and Procedure

A single-cylinder, direct injection, four-stroke of Lister LV1 of PETTER PHIW diesel engine was employed to carry out a set of experiments. For all measured characteristics except noise, the engine operation modes were full load and varying speeds. There was a noise measurement at 1800 rpm constant speed and different loads (25, 50, 75, and 100%). In addition, the noise level was measured at full load and various engine speeds. Table 1 shows the characteristics of diesel engines in further detail. All of the fuels that were tested, including biodiesel fuels, were used without any modifications to the diesel engine.

2.1. Biodiesel Preparation

The following technique was used to make three distinct biodiesel blends, each of which included 20% biodiesel of vegetable oil and 80% pure diesel fuel by volume, namely corn, sunflower, and palm biodiesels: (i) in a low-speed electrical blender, 4 g sodium hydroxide (NaOH) was added with 200 cm3 methyl alcohol, known as methanol (CH3OH), for about 2 min. As a consequence of the chemical reaction, the solution grew warmer. To make sodium methoxide (CH3NaO), it was violently swirled until all of the (NaOH) was totally dissolved in the (CH3OH). Then, (ii) 1000 cm3 of vegetable oil was warmed to 65 °C and progressively added to the prior mixture, with the electrical blender running for about 30 min; (iii) after blended, the mixture was allowed to settle for 4 h; (iv) the solution split into two layers due to gravity, with biodiesel at the top and glycerin at the bottom; (v) the biodiesel product was rinsed well to remove any residues of glycerin and impurities; (vi) the biodiesel was washed by pouring hot water over it and letting it settle in a separating funnel for 12 h; (vii) finally, the lower layer of the sample was gradually extracted until it was transparent. The refined biodiesel was put into a bottle and reheated up to 55 °C to remove the water content. Table 2 lists the measured fuel parameters as well as the equipment requirements. Only the cetane number measurements were obtained from a reference [58]. The percentages of fatty acids in the oil materials utilized were presented in Table 3 [59,60,61].

2.2. Exhaust Emission Measurement

A Kane automotive gas analyzer was used to assess the exhaust emissions, which are CO, CO2, UHC, and NOx. The exhaust emissions were measured as follows: the gas probe was mounted on the gas exhaust pipe and attached to the gas analyzer. The gas analyzer was started, and fresh air was pumped into emission sensors. The oxygen sensor was set to 20.9%. Under such conditions, the analyzer makes a self-calibration procedure during fresh air purging and the time countdown to zero. After self-calibration, a leak test was executed by fitting the probe seal. After passing the leak test, the probe seal was removed and the gas analyzer read zero for CO, CO2, and set oxygen at 20.9%. When the engine reached operating temperature, the exhaust emission reading was taken. Each test was repeated three times and the average of the recorded data was taken. Table 4 displays the specification of the exhaust gas analyzer equipment and its accuracy.
The following formula was used to compute the total percentage of uncertainty for the exhaust emissions [47,48]:
%   o f   u n c e r t a i n t y = ± { u n c e r t a i n t y   o f   H C 2 + u n c e r t a i n t y   o f   C O 2 2 + u n c e r t a i n t y   o f   C O 2 + u n c e r t a i n t y   o f   N O x 2 }
As regards Equation (1), the total uncertainties for exhaust gases is ±0.9%, which means that the examined results are reliable.

2.3. Engine Noise Measurement

Any sound source may be characterized primarily by its pressure, intensity, and power. A person can sense noises between 20 μPa and 20 Pascal [62], which is designated as the pain threshold. The root mean square (rms) sound pressure is the most essential sound indicator, which is described in Equation (2) as
P rms = P 2 t = lim T 1 T 0 T P 2 t dt 1 2
where: Prms is the root mean square value of the pressure in Pa; P(t) is the pressure value at a specific time t, in Pa; T is the total interval of time in which the pressure was measured, in sec; and P2(t) is the time-averaged pressure over T, in Pa.
Because of the wide range of related pressure (20 μPa–20 Pa), a logarithmic scale is more suitable. Another explanation is that a logarithmic evaluate of sound pressure corresponds significantly better with the subjective perception of how loud a noise sounds than the sound pressure itself. With a reference value (Pref = 20 μPa), the sound pressure level (SPL) is employed to characterize the sound loudness in dB. It is given by Equation (3):
L P = 10 log 10 P rms 2 P ref 2 = 20 log 10 P rms P ref
where: LP is the level of the sound pressure, in dB; Prms is the root mean square quantity of the pressure at a certain frequency, in Pa; and Pref is the reference value of 20 μPa.
The decibel dB(A) is a unit of measurement for intensity, commonly expressed in (W/m2). The decibel, therefore, denotes the amount of sound-wave power that passes throughout a 2-D slice of space at any particular time. The formula corresponding to the rise in the sound level in dB(A) to the rise in intensity (I) starting from initial reference intensity I0 is given by Equation (4):
S L d B = 10 log I I 0
where: I 0 is a reference intensity and equals 10−12 W/m2, which is the lowest audible sound that a person with normal hearing can detect at a frequency of 1000 Hz.
Besides monitoring the sound pressure level through each discrete frequency, the sound was typically measured in frequency ranges. Therefore, frequency filters with octave band in terms of one-third octave band filters were used.
Octave band noise assessment is widely used when the frequency analysis of the acoustic source is required to be studied. Therefore, 1/3 octave analysis was conducted to investigate the diesel engine acoustic emissions of all types of tested fuels. A frequency range of 20 Hz to 20 kHz was investigated. To address the noise emission from a diesel engine, a signal from cylinder pressure is typically observed based on the frequency spectrum. After that, a fast Fourier transform (FFT) was applied to transform the sound time domain to the frequency domain, or a filter of a one-third octave frequency band was applied to measure the sound pressure level at every distinct frequency [62]. A one-octave frequency band supported with a sound level meter type 2235 from Bruel & Kjaer to detect the noise of the diesel engine was used. The sensing microphone and a signal output terminal attached to the sound level meter were positioned at the upper and lower sides of the meter. The data collection interface receives audio information from an output signal terminal. This electrical signal is amplified inside the sound level meter and then sent to weighting networks that are nominated by a manual switch. The amplified weighted signal goes to the root mean square amplifier, is purified, and converted to a decibel logarithmic scale. After that, the digital reading of the sound pressure level in decibels dB(A) appears on the screen. The noise measurements were performed according to the following: all the acoustic measurements were carried out in the evening time (after 5 pm) to ensure there was no source of the noise. The noise measurement distance was one meter apart from the frontal surface of a diesel engine to make sure there was no absorption of sounds during the test. The diesel engine started once the set temperature was reached. The acoustic level, recorded in dB(A), was measured using a microphone as a sound level meter at the front side of the engine. The octave band filter was applied according to subsequent midpoint frequencies (20 Hz to 20 kHz), and, finally, the same procedure was repeated at different engine speeds and different tested fuels.

3. Mathematical Model

A regression model is a formula that describes the relationship between a response (dependent variable) and a set of design factors (independent variables). A regression model is widely used due to its simplicity, minimal processing effort, and ability to illustrate explicit relationships between variables. In some engineering computations, the model provided by the data is not sufficient for a linear line. In such instances, it is vital to apply a proper data curve. Polynomial regression is an evaluable approach at this moment.
The performance of the process was measured by examining exhaust emissions (NOx, CO, CO2, and UHC), engine performance (brake thermal efficiency), and engine noise, all of which are affected by engine speed and fuel type. Equation (5) expresses the interactions between the response Y and the input process variables. The tests were conducted at engine speeds ranging from 1200 to 2400 rpm. Pure diesel, palm biodiesel, sunflower biodiesel, and corn biodiesel are all assessed.
Y = β 0 + β 1 x + β 2 x 2 + + β n 1 x n 1 + β n x n
where: Y is the dependent variable, x is the independent variable, β is the regression coefficient, and n is the polynomial degree.

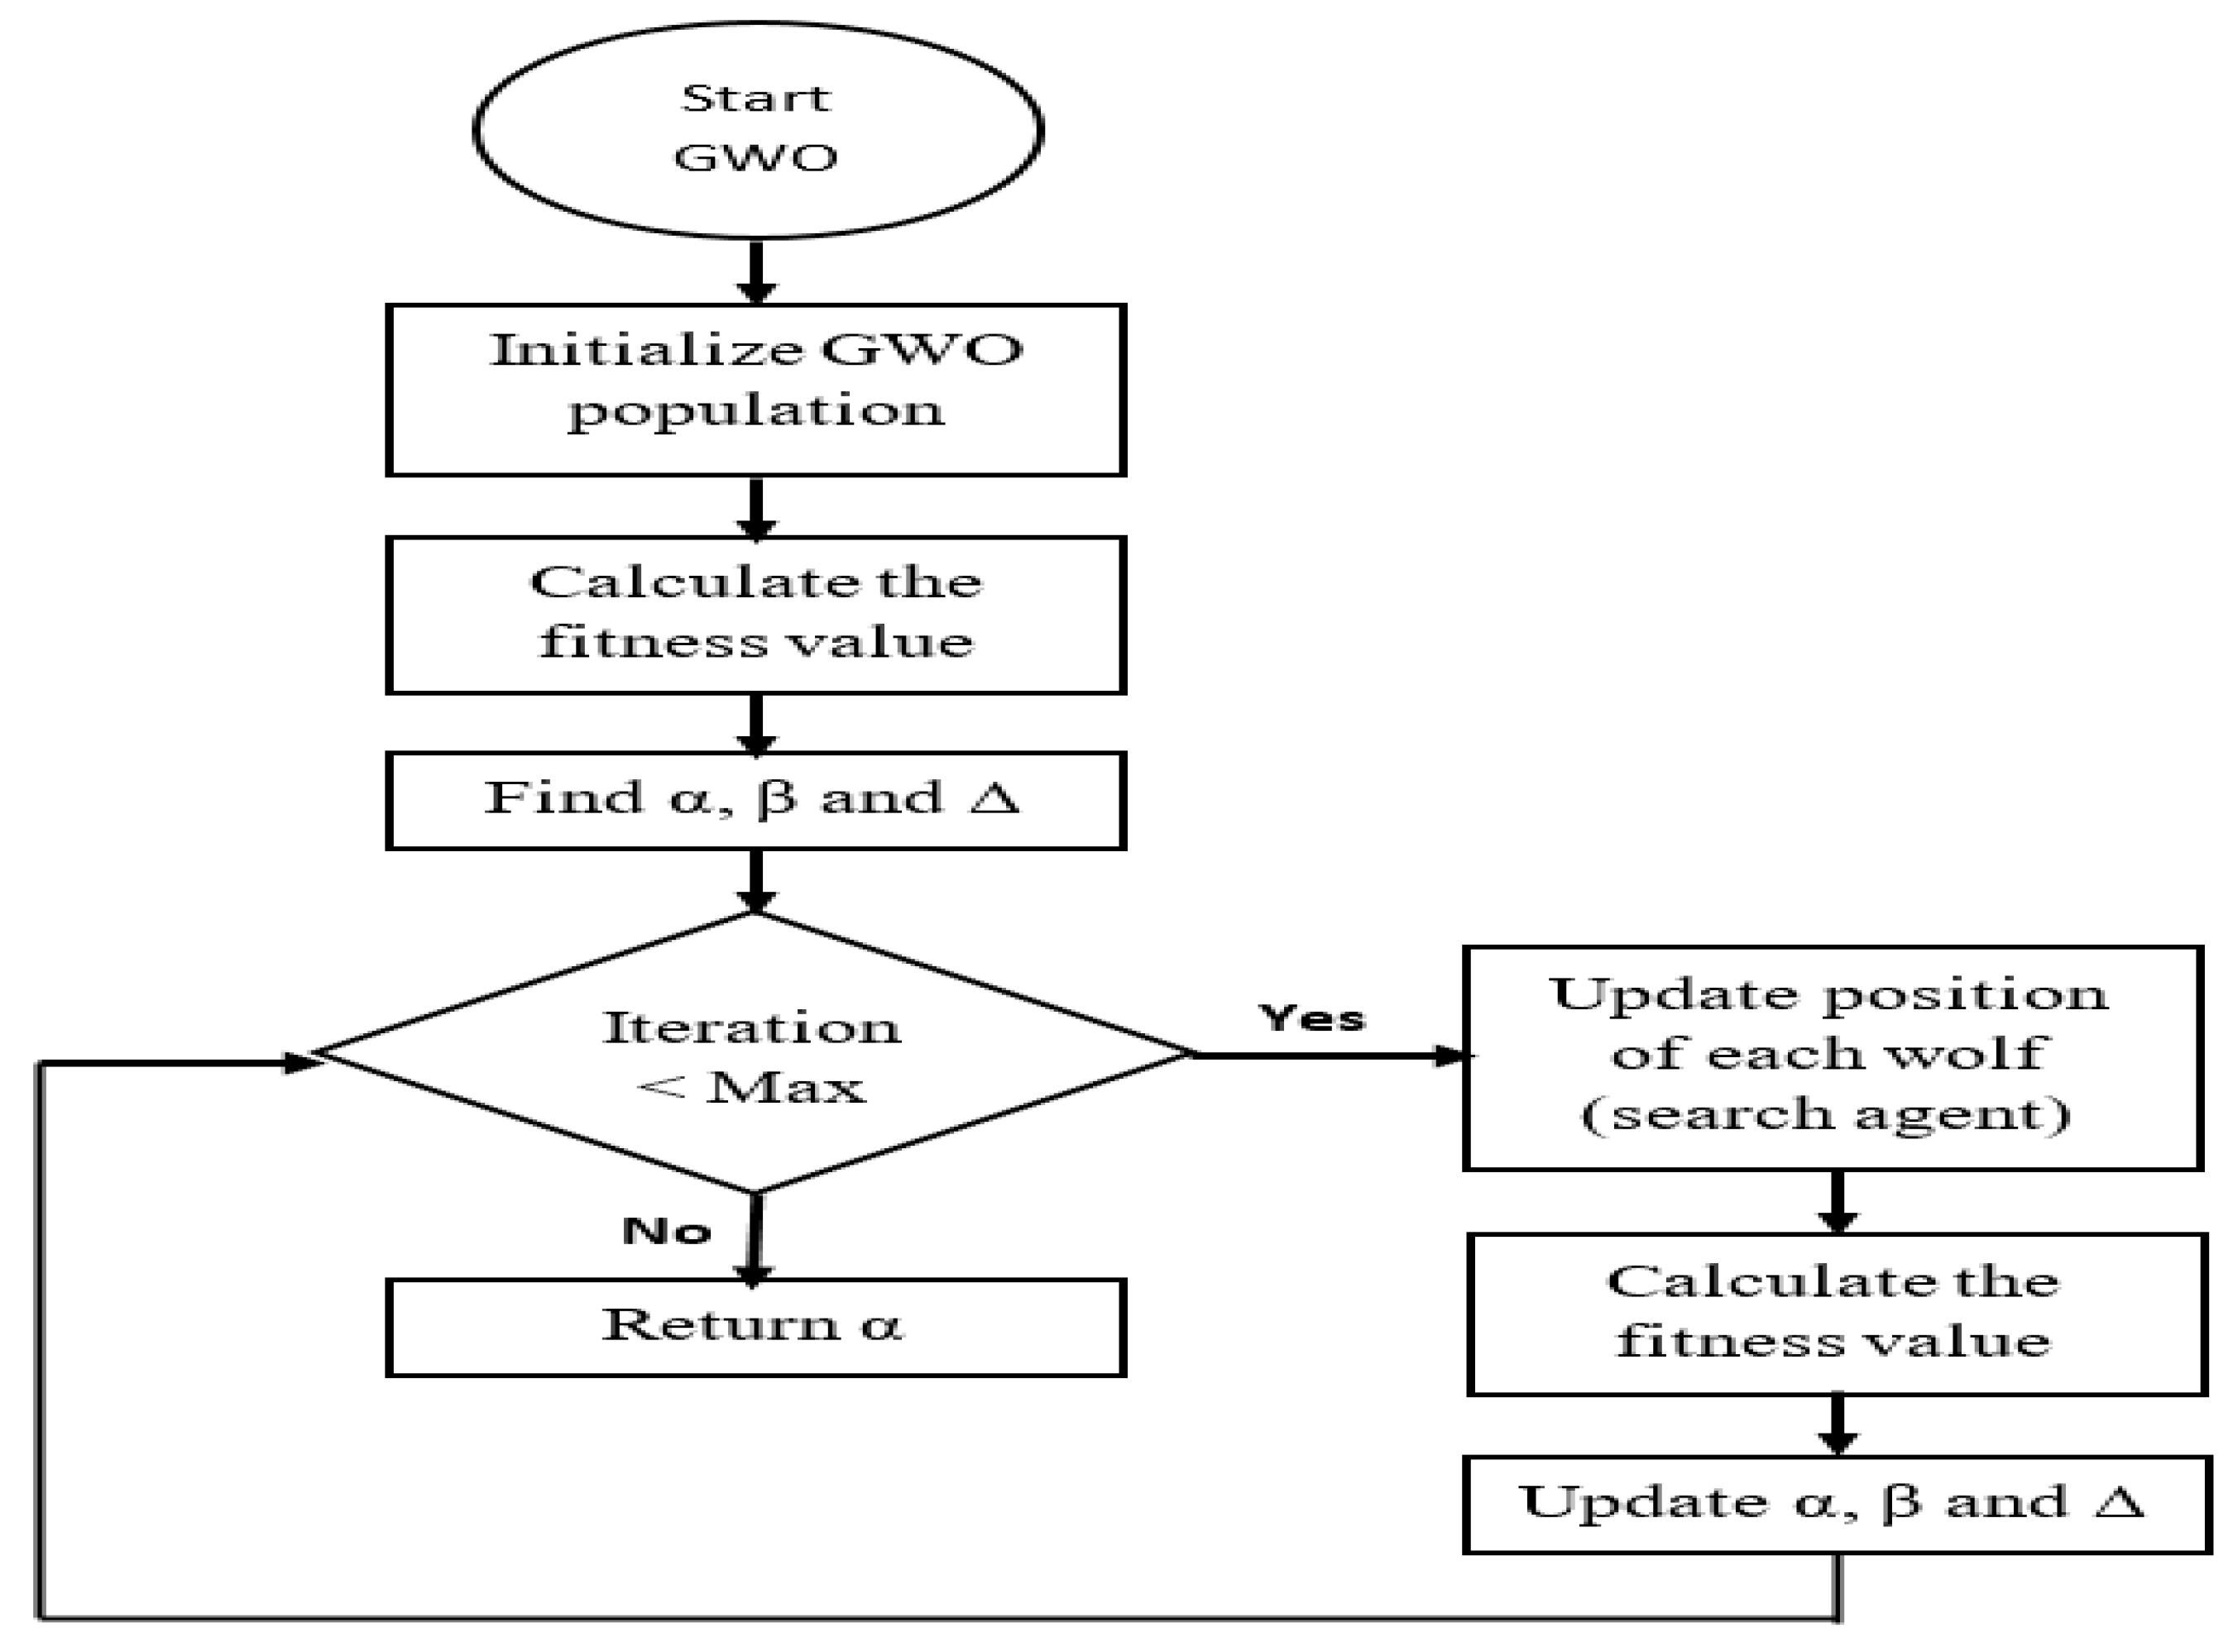
4. Parameter Optimization

With the use of a polynomial regression model, the optimization procedures were explored in order to attain the minimum exhaust emission yield. The GWO method proposed by Mirjalili et al. in 2014 [56] is similar to the PSO algorithm and is based on the metaheuristic principle. The algorithm concept leverages social authority, which is symbolized by the behavior of wolves while encircling a victim, to find the best solution to the problem to be optimized. This algorithm replicates the hierarchical superiority of grey wolves until their movements halt during the operation of hunting for the victim. It encourages the natural behavior of grey wolves scavenging for food in their social life in a similar way to population-based algorithms.
Figure 1 shows four different types of grey wolf groups that may be used to construct hierarchical commands, with the following three levels [63,64]:
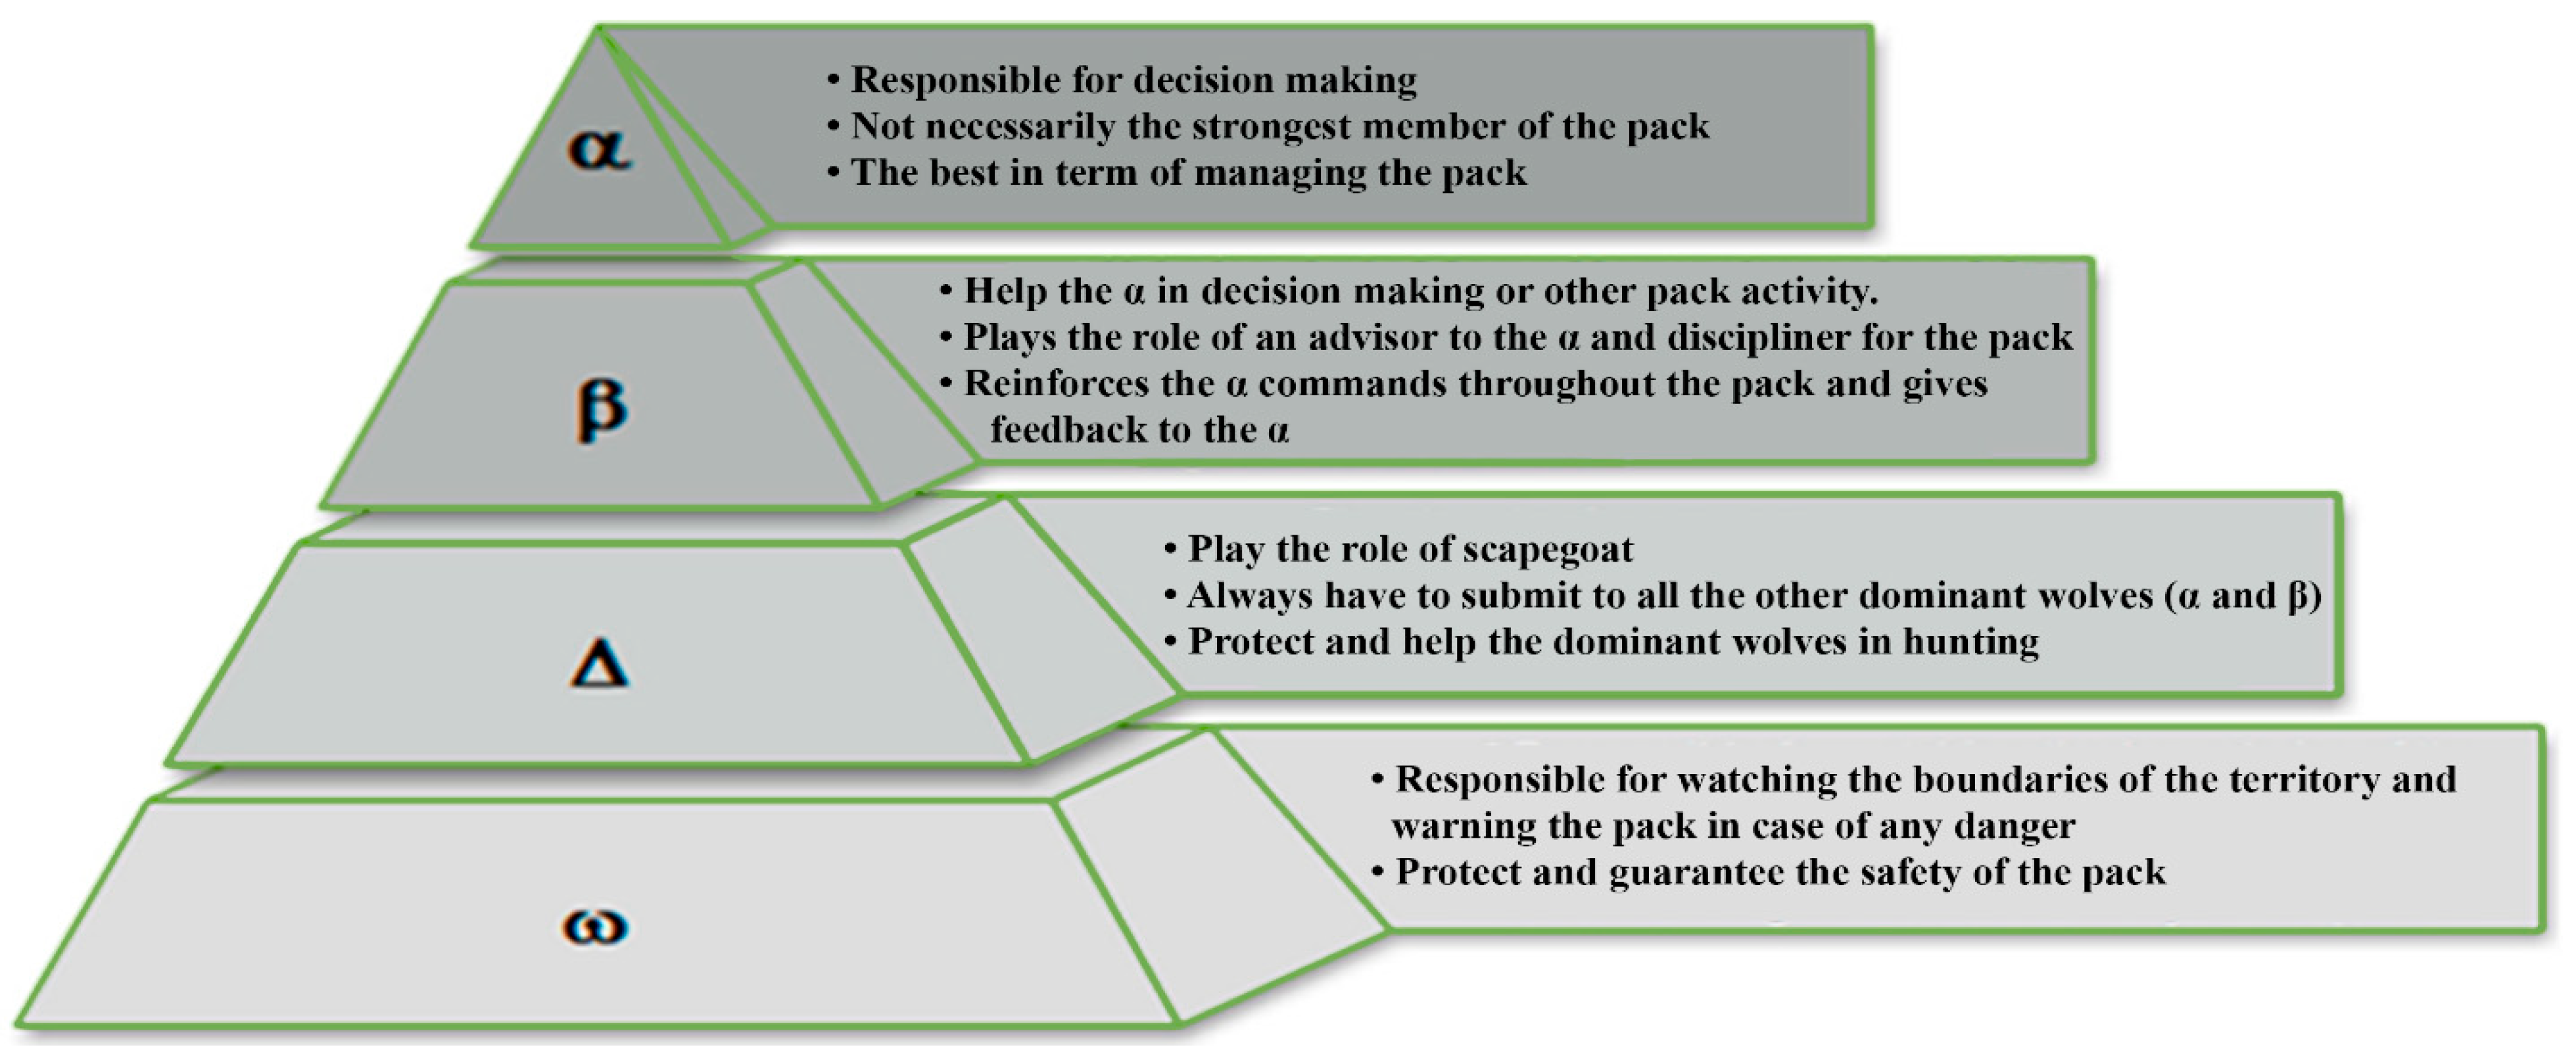
  • The first level reflects the command of the group. Alpha (α) is the name given to a wolf at this rank. The alpha is in charge of determining whether or not to hunt and giving commands to the other wolves in the pack. As a result, it might be deemed the best option.
  • The chain’s nesting level is known as beta (β). At this stage, wolves assist alphas in making choices and monitoring the behavior of other groups. When alphas die or get elderly, betas can take their place.
  • The bottom level has the lowest ranks, the delta (Δ) and omega (ω), who eat last after the upper-level wolves have finished.
The wolf pack’s hunting method consists of three key steps: hunting, encircling, and attacking the prey. The algorithm starts with a set number of grey wolves, whose placements are arbitrarily generated. When building GWO, the fittest solution as the alpha (α) was selected. This allows us to quantitatively describe the social structure of wolves. As a result, the second and third best solutions are designated by the letters beta (β) and delta (Δ). All other potential solutions are presumed to be omega (ω). The hunting (optimization) in the GWO algorithm is directed by the variables α, β, and Δ. Following these three wolves are the ω wolves.
As mentioned above, grey wolves encircle prey during the hunt. In order to mathematically model the encircling behavior of each packing group, the following equations (Equations (6) and (7)) are employed:
D = C . X P t X t
X t + 1 = X P t A . D
where: the grey wolf position vector denoted by X , X P is the prey vector position, t stands for the current iteration, and A and C are the coefficient vectors given by the following equation (Equation (8)):
A = 2 . a . r 1 a C = 2 . r 2 w i t h   : a = 2 . 1 t T m a x
where: the total number of iterations is Tmax, r1 and r2 are random vectors in [0,1], and a is encircling coefficient. Grey wolves have the ability to recognize the location of prey and encircle them. The hunt is usually guided by the alpha. The beta and delta might also participate in hunting occasionally. However, in an abstract search space, we have no idea about the location of the optimum (prey). In order to mathematically simulate the hunting behavior of grey wolves, we suppose that the alpha (best candidate solution), beta, and delta have better knowledge about the potential location of prey. Therefore, we save the first three best solutions obtained so far and oblige the other search agents (including the omegas) to update their positions according to the position of the best search agents. The following formulas (Equations (9) and (10)) are proposed in this regard.
X P t + 1 = X 1 t + X 2 t + X 3 t 3
where:
X 1 t = X α t A 1 . D α X 2 t = X β t A 2 . D β X 3 t = X Δ t A 3 . D Δ a n d   D α = C 1 X α t X t D β = C 2 X β t X t D Δ = C 3 X Δ t X t
Equation (6) denotes the distance from the current location, which should be minimized as much as possible so that Equation (7) represents the next position, which becomes closer and closer to the prey’s position. This means that the algorithm will arrive at the proper answer to the XP problem.
In this algorithm, the control parameter “a” decreases linearly from 2 to 0 over iterations using Equation (8). As a result, a search agent’s future position can be anywhere between its current position and the position of the prey (exploration phase). The criterion |A| < 1 causes the wolves to attack the prey.
The alpha group is thought to have the best information of where prey may be found. Once the location of the prey has been discovered, the alpha group will lead the hunt, followed by the beta and delta wolves. The last two groups take part in the hunt on occasion. The remainder of the gang is tasked with caring for the pack’s injured wolves. The wolves assault and finish the hunt after the prey stops moving.
Pseudocode of grey wolves:
Initialize grey wolf population Xi
Calculate the fitness value of each agent
Sort grey wolf population-based on fitness values (α, β, and Δ)
While Iterations < Max:
Update position of each wolf
Find the fitness of a population
Update alpha, beta, and delta
End while
Return alpha
The goal of using the GWO algorithm is to reduce exhaust emissions (UHC, CO, CO2, and NOx) for engine speed and fuel type (to determine the best engine speed with minimized exhaust emissions). The GWO technique is used to improve regression models in order to find the best input parameter values (x). The fuel type and engine speed are the variables that influence these responses. Firstly, the responses are estimated using regression models. Secondly, for these regression models, the GWO method is utilized to estimate the best factor levels. The algorithm used 30 search agents for this purpose, and the maximum number of iterations was set at 1000.
Each wolf position in the GWO corresponds to the fuel type factor that is applied to the engine speed. As a result, f represents the global best position of all wolves, whereas E is the exhaust emission based on fuel type, and “d” reflects the associated wolf’s best position. The objective function for this algorithm to find the minimum exhaust emission considering the fuel type with respect to the engine speed is described by Equation (11):
min E d = f α ,   β   and   Δ
Exhaust emission (E) value is varied depending on fuel type (d) and is considered as a grey wolf according to the GWO algorithm. As a consequence, we can rewrite Equation (7) as follows (Equation (12)):
E d k + 1 = E d k A . E
The working principle of GWO’s fitness function is described by Equation (13):
E j k d < E j k 1 d
where: j is the current grey wolves’ number, and k is the iteration number.
Figure 2 displays the flow chart of the grey wolf optimization algorithm process.

5. Results and Discussion

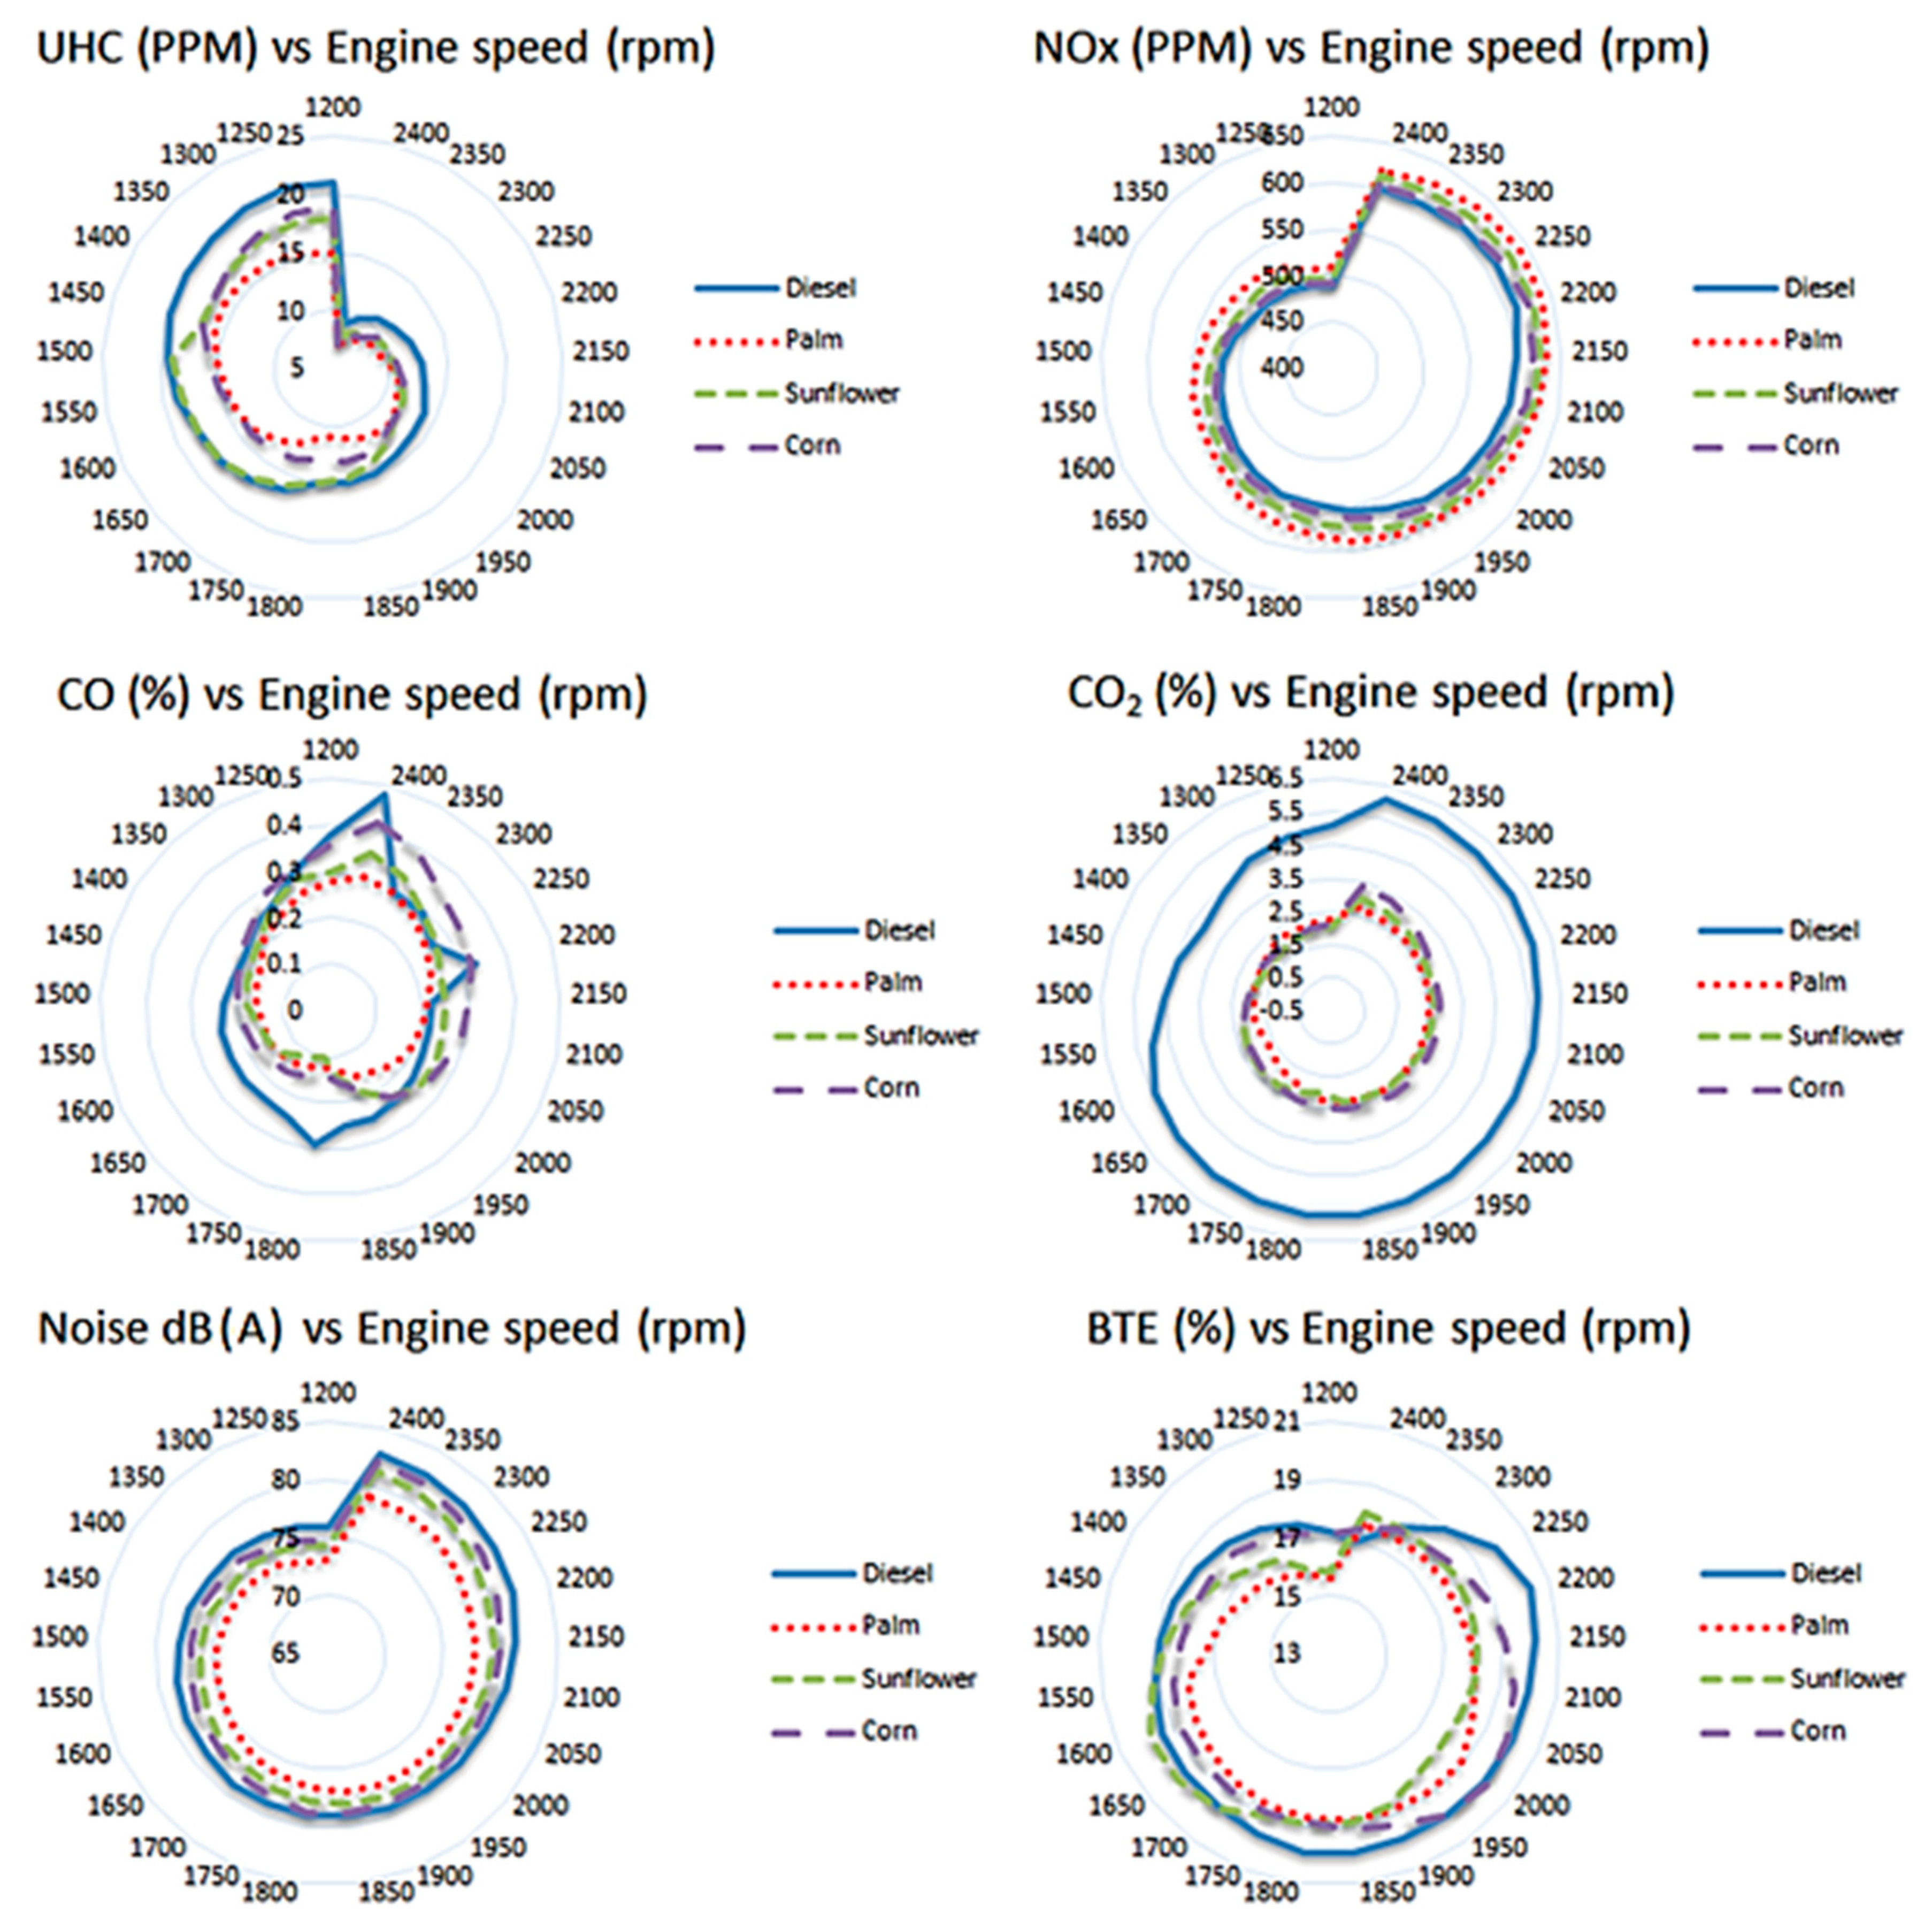
5.1. Exhaust Emission Analysis

This section presents a comprehensive, detailed evaluation of the impact of biodiesel blends on the engine exhaust emissions, which are unburned hydrocarbon, carbon dioxide, carbon monoxide, and nitrogen oxides, at varying engine speeds.

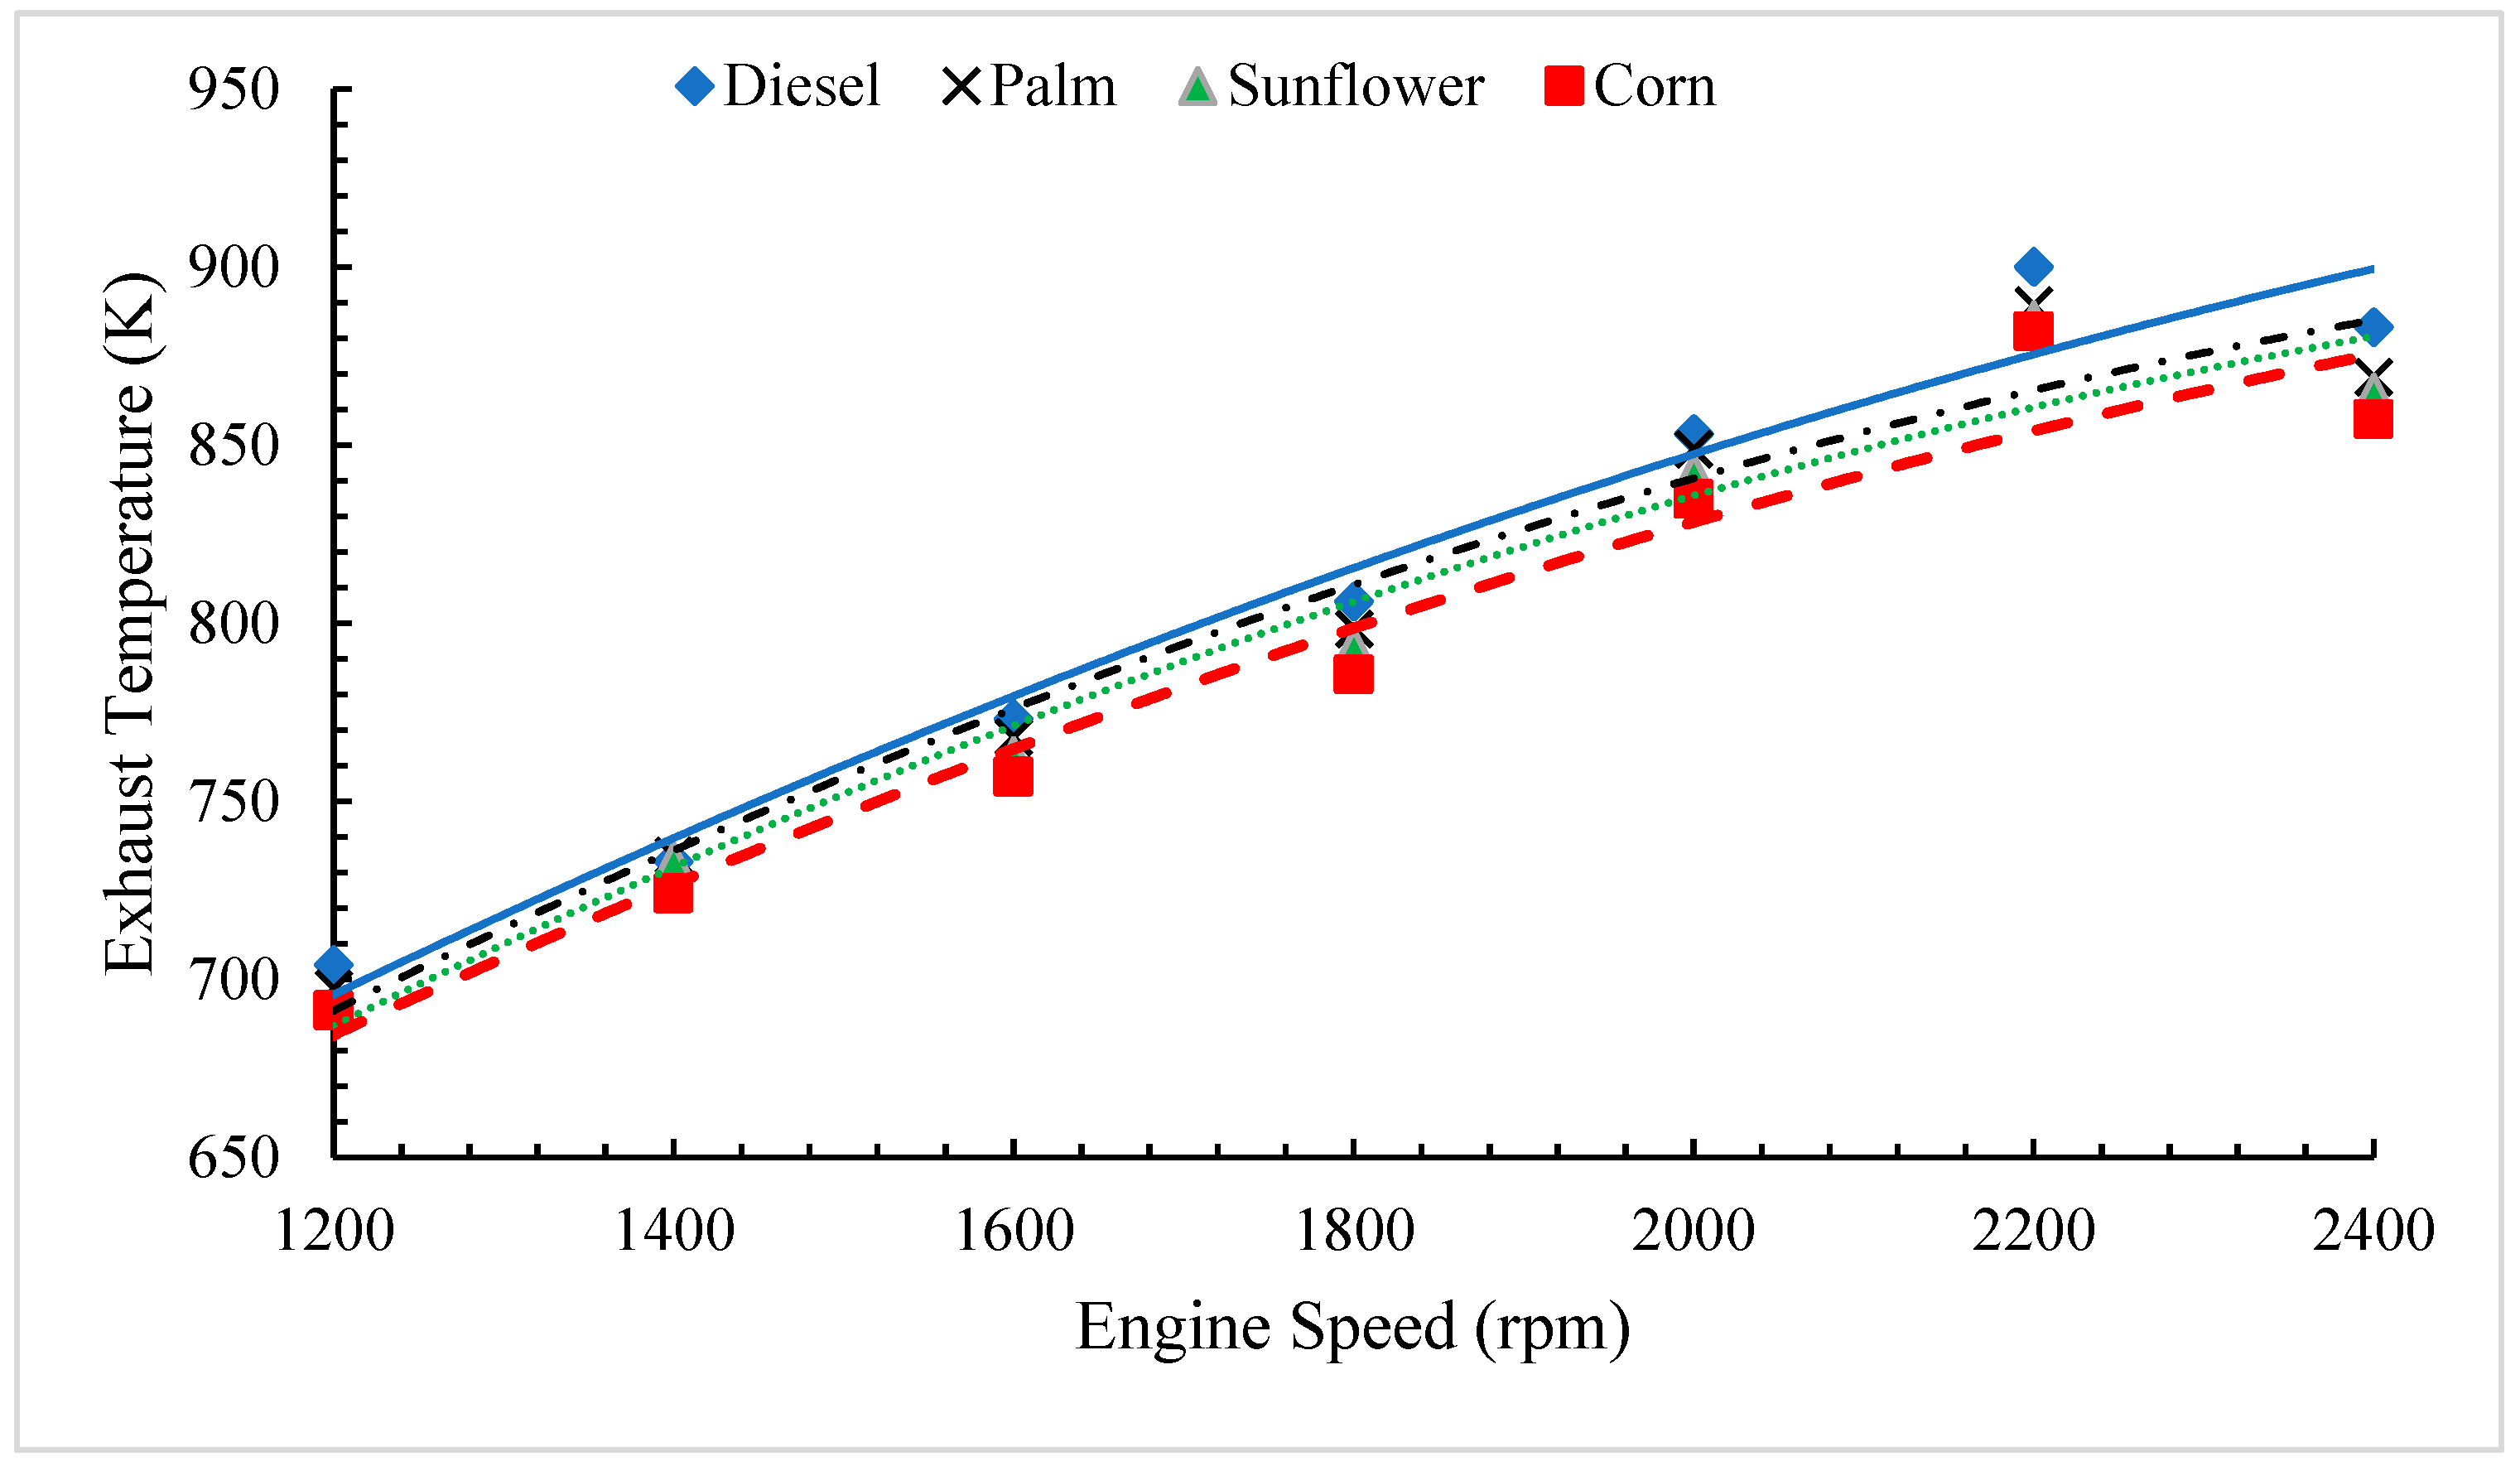
5.1.1. Exhaust Temperature

The change in the exhaust gas temperature versus engine speed for pure diesel and different types of biofuel blends is demonstrated in Figure 3. The exhaust gas temperature increased with the increase in engine speed until reaching the maximum value for all the tested fuels. This increase is due to the need for more fuel quantity to increase the engine speed. Moreover, all biodiesel fuel blends have lower exhaust gas temperatures than pure diesel. A reduction in exhaust gas temperature by 0.8%, 1.4%, and 2.1% has been obtained from palm, sunflower, and corn biodiesels, respectively, as compared to pure diesel. This reduction can be attributed to the following reasons: (i) the latent heat of vaporization for all biodiesel blends is more than that of pure diesel [65], which improves the cooling of the engine cylinder walls and, hence, decreases its temperature and, consequently, decreases its exhaust gas temperature; and (ii) the low energy content in terms of calorific heating value for all types of biodiesel compared to pure diesel. Masharuddin et al. [66] proposed emulsified biodiesel as an alternative fuel to minimize both peak cylinder pressure and flame temperature. The fine scattering of biodiesel fuel droplets causes the phenomenon of heat transfer in the combustion chamber. When this phenomenon occurs in the inner phase of biodiesel content, it leads to partially absorbing the calorific heat value of the blend, followed by decreasing the burning gas temperature. In other words, the emulsion absorbs heat from combustion by vaporizing liquid water into vapor.
However, a reverse trend was reported in a few studies [67,68]. They explained that the high exhaust gas temperature was attributed to the improved combustion behavior due to the increased oxygen molecules in the chemical formula of biodiesel blends and higher fuel consumption in each engine speed as compared to that of pure diesel.

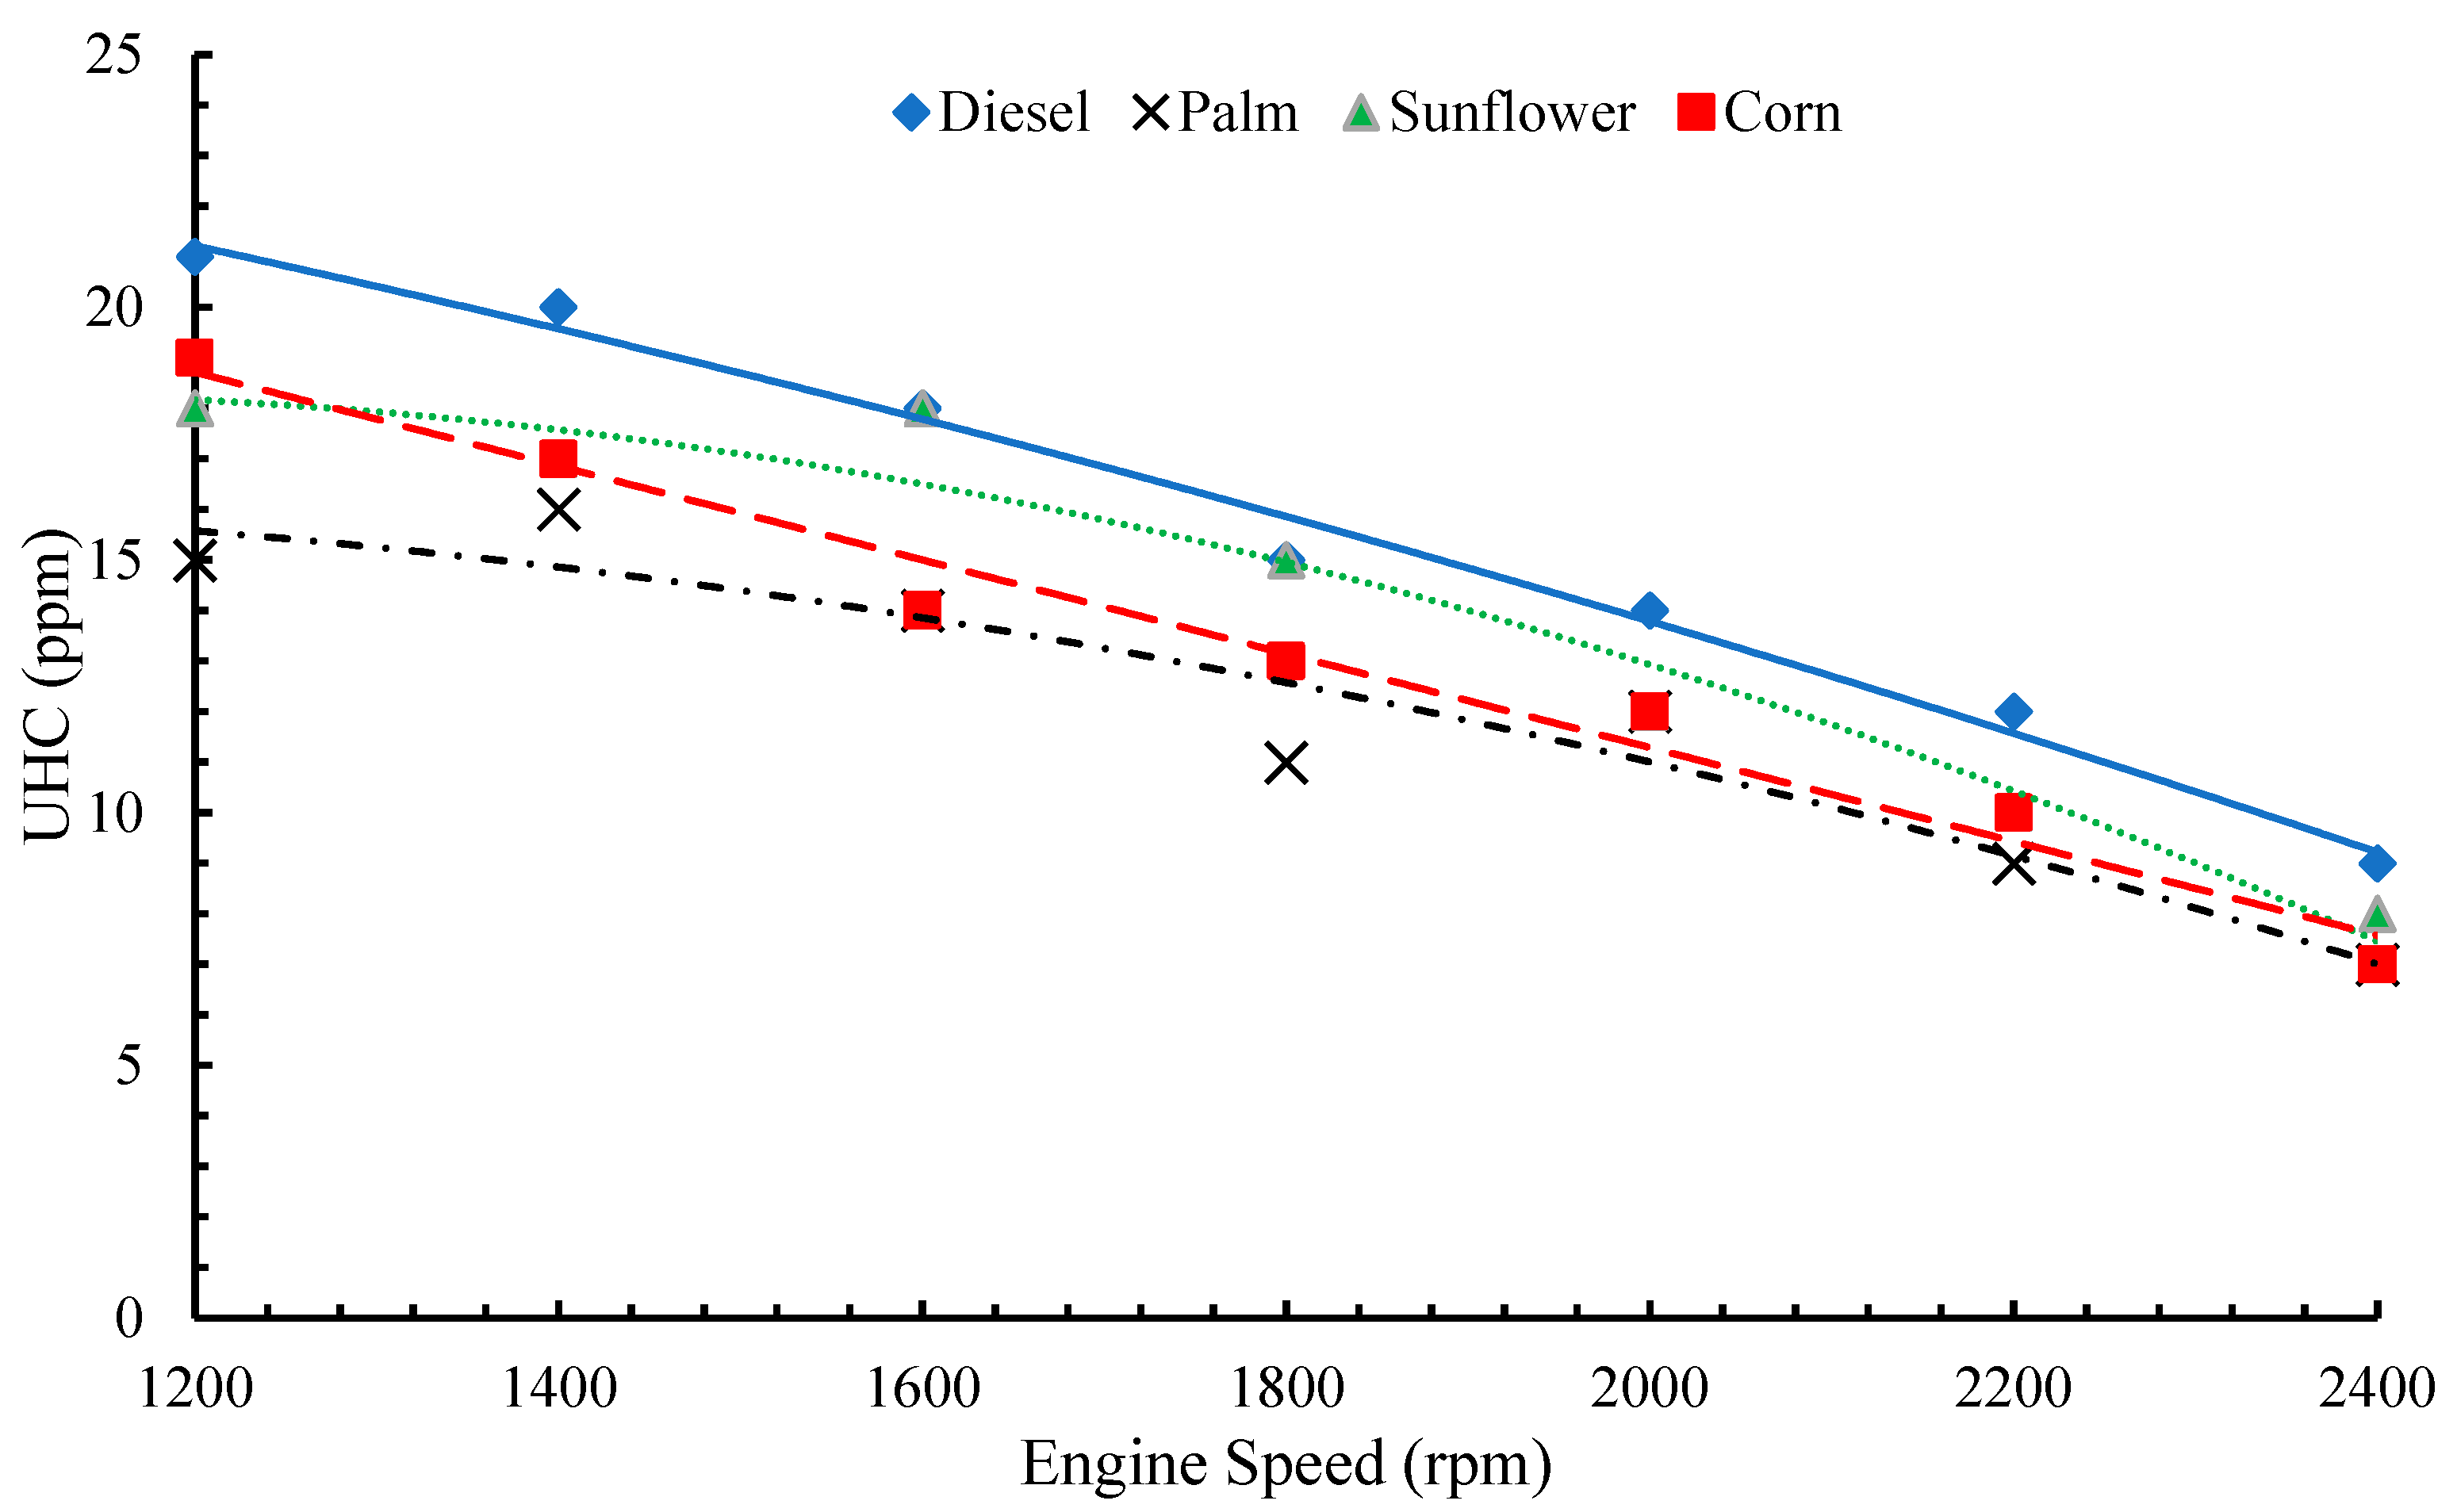
5.1.2. Unburned Hydrocarbon Emission (UHC)

The variation in total unburned hydrocarbon emission (UHC) with engine speed for pure diesel and 20% addition of different types of biofuels is presented in Figure 4. As depicted in the figure, the amount of UHC emission decreases when the engine speed increases. Therefore, higher engine speed will maintain a better mixing of air and fuel, leading to better combustion. Another observation is the UHC emitted by all the biodiesel blends is a little lower than that of pure diesel fuel. Numerically, on average, the UHC reduction of about 22.7%, 10.2%, and 16.2% was produced from palm, sunflower, and corn biodiesel blends, respectively, as compared to pure diesel. This reduction is due to: (i) improved combustion efficiency and ignitability because of the increased cetane number of the biofuel blends; a substance with a high cetane number displays a shorter delay period and gives additional time for the oxidization progression to happen, which leaves smaller amounts of HC in the exhaust; (ii) the inherent oxygen contained by the biofuel was responsible for the decrease in HC concentrations; (iii) despite biodiesel being just less volatile than diesel fuel, diesel fuel has been observed to have higher relative distillation points [69,70]; the last portion of the diesel may not be entirely evaporated and burned, resulting in higher THC emissions; (iv) the low fuel particle evaporation due to the reduced wall temperature; (v) the higher viscosity and density of biodiesel blend affect the atomization and volatilization phenomena of the fuel, leading to a lesser amount of lean blend at the edges of the spray flame-out region [71]; and, finally, (vi) the low heat of the biofuel blends vaporization leads to slow evaporation and poor fuel–air mixing.

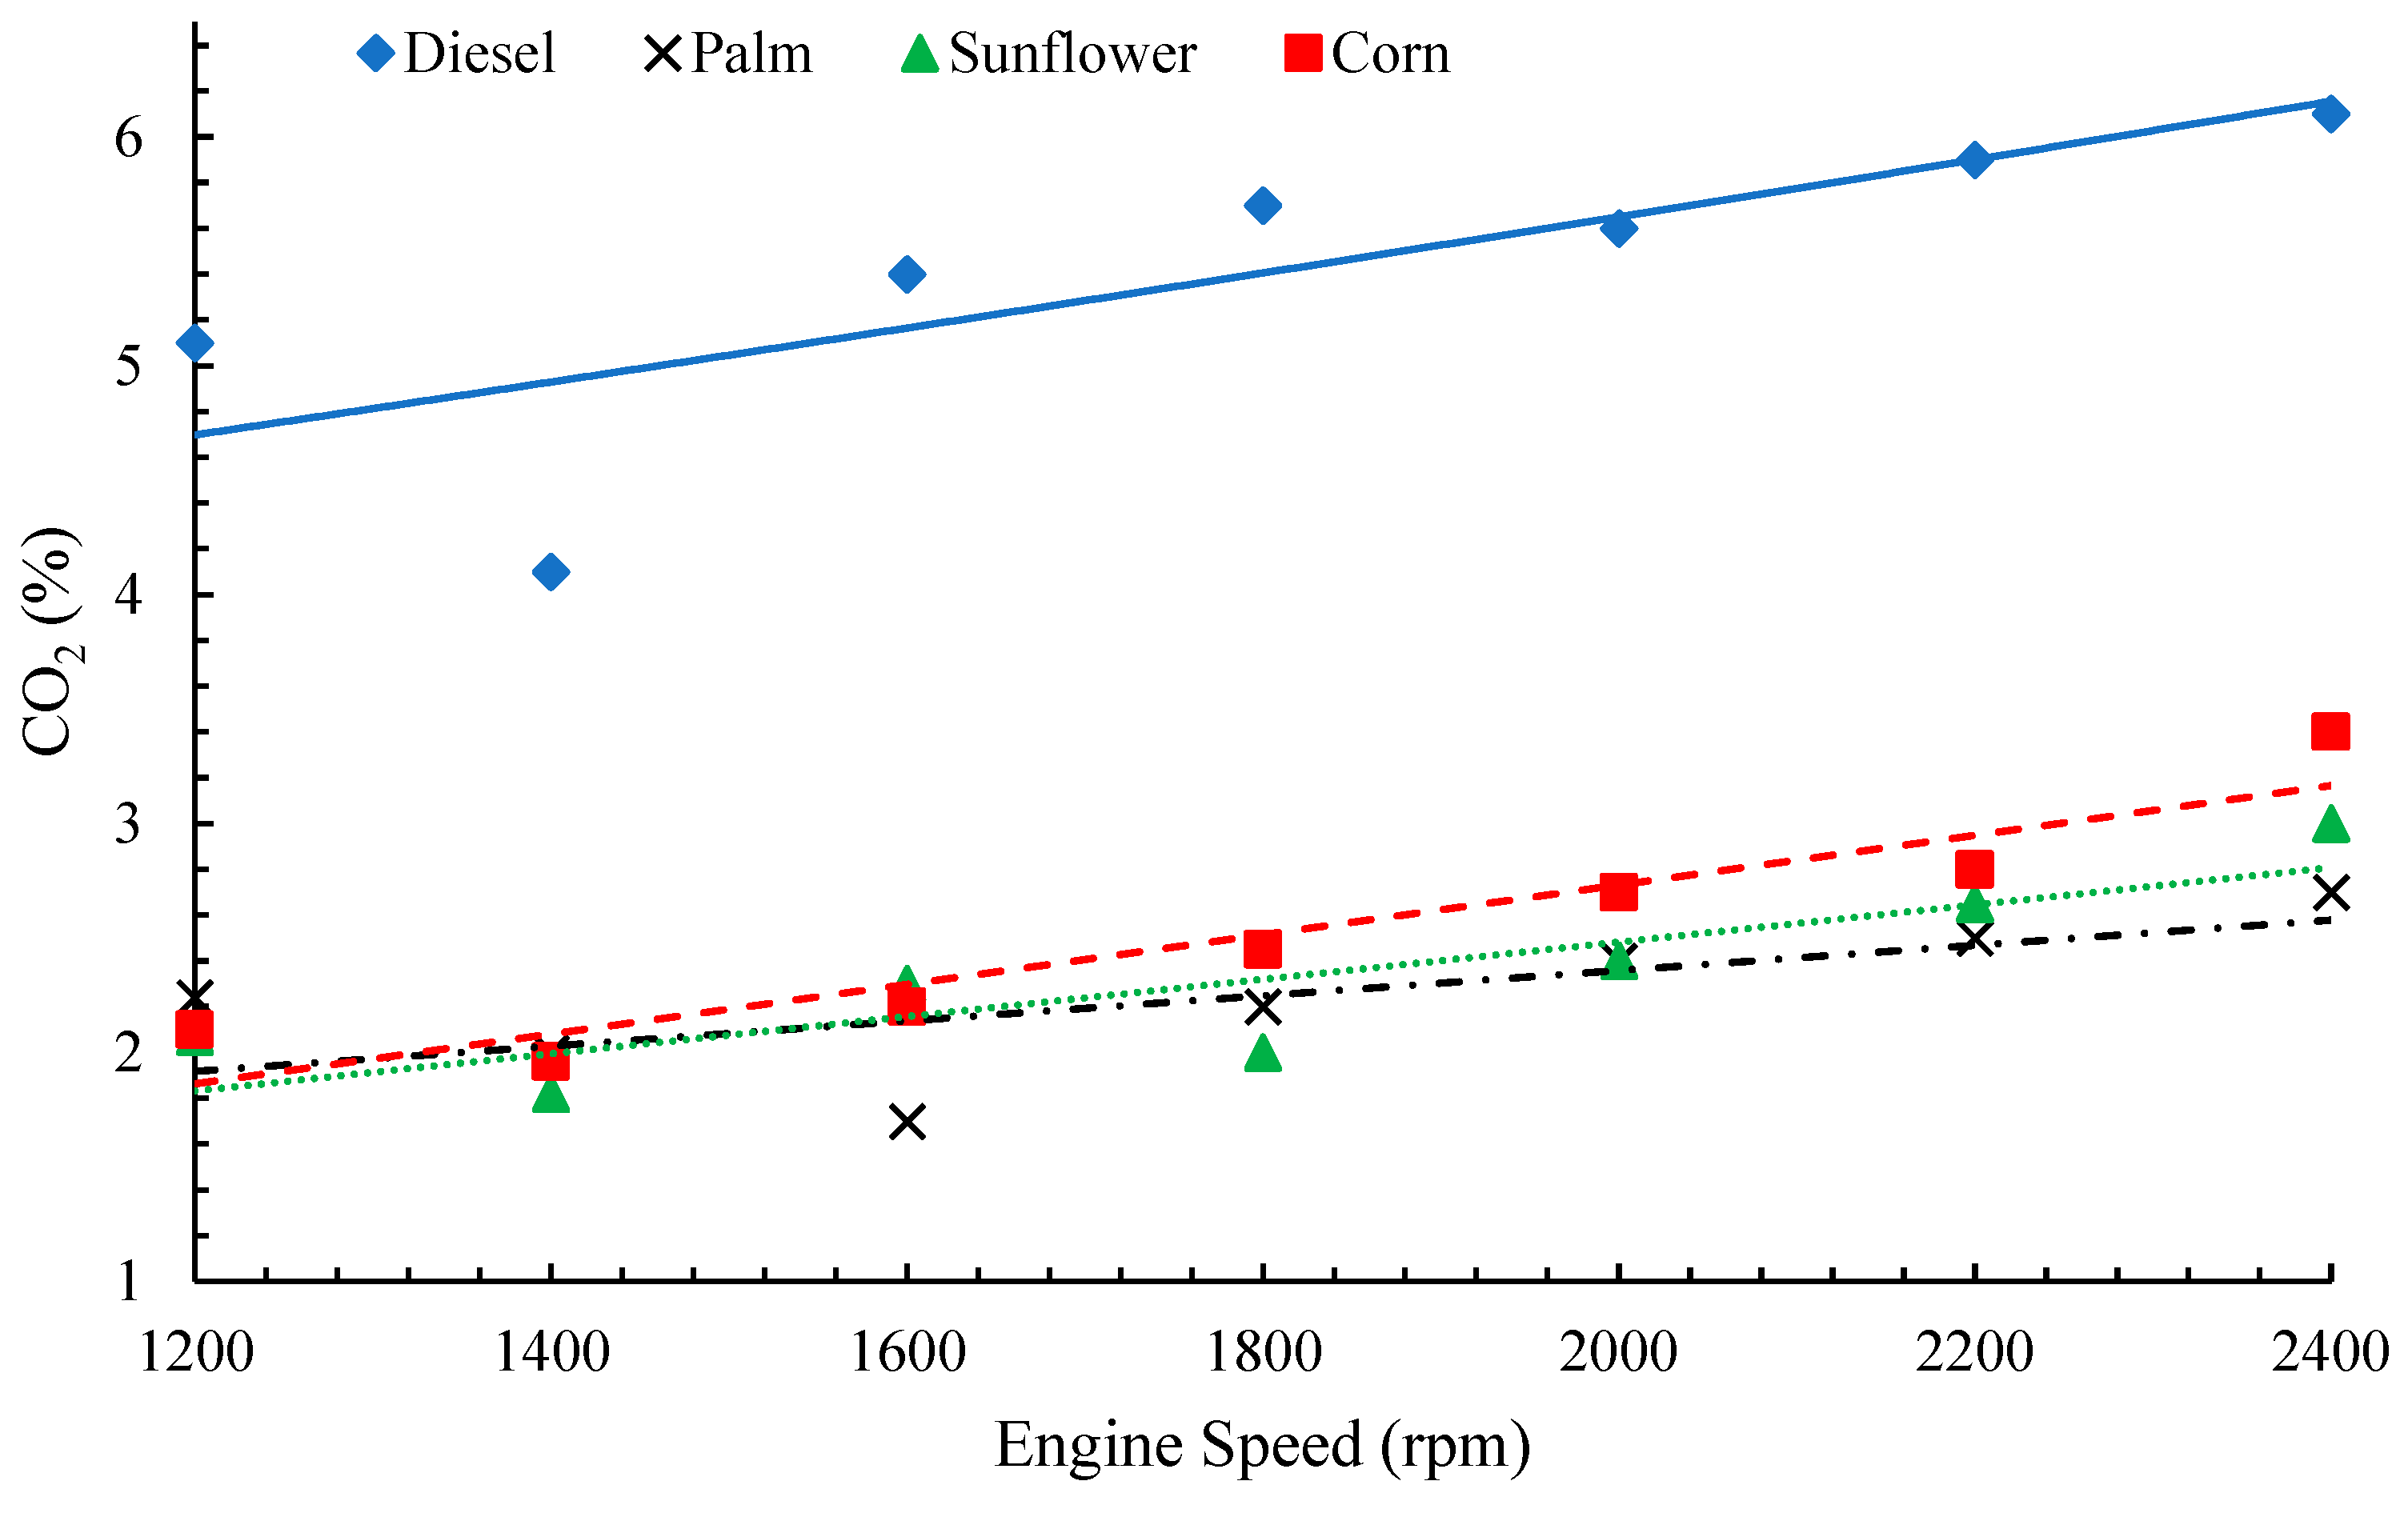
5.1.3. Carbon Dioxide Emission (CO2)

It is well known that carbon dioxide (CO2) is considered one of the greenhouse gas sources and is responsible for the global warming effect. Moreover, the produced CO2 emission is an indication of the completed combustion process. The variations in CO2 emissions versus engine speed for pure diesel and 20% additions of different types of biodiesels are displayed in Figure 5. It was noticed that the amount of CO2 emission increased proportionally with the increase in engine speed. For all the different types of biodiesel blends, the produced CO2 emissions were lower than those of pure diesel fuel by 58.2%, 57.2%, and 53.7% for palm, sunflower, and corn biodiesel blends, respectively. The reduction in CO2 emissions is due to the fact that biodiesel has low-carbon fuel and a lower carbon to hydrogen ratio than that of pure diesel fuel [72]. Ashok et al. [73] indicated that the high number of formations of free radicals during the combustion leads to a significantly reduced amount of CO2 emissions. Muralidharan and Vasudevan [74] stated that the CO2 produced from biodiesel combustion could be absorbed by trees; therefore, the CO2 level in the atmosphere will be maintained, thus avoiding environmental problems, such as global warming and ozone layer depletion. The previous interpretation was discussed in a more scientific and in-depth manner by Yee et al. [75]. The authors proposed the concept of life cycle assessment (LCA) for palm biodiesel to explore and evaluate the prevalent idea that palm biodiesel is a sustainable fuel. The LCA analysis was categorized into three phases: agricultural processes, biodiesel transesterification process, and oil milling. The greenhouse gas and energy balance were estimated for each phase. According to the results, the burning of palm biodiesel was shown to be more environmentally friendly than conventional diesel fuel, with a substantial 38% decline in CO2 emissions per liter combusted. A similar trend was reported by Sharon et al. [76].

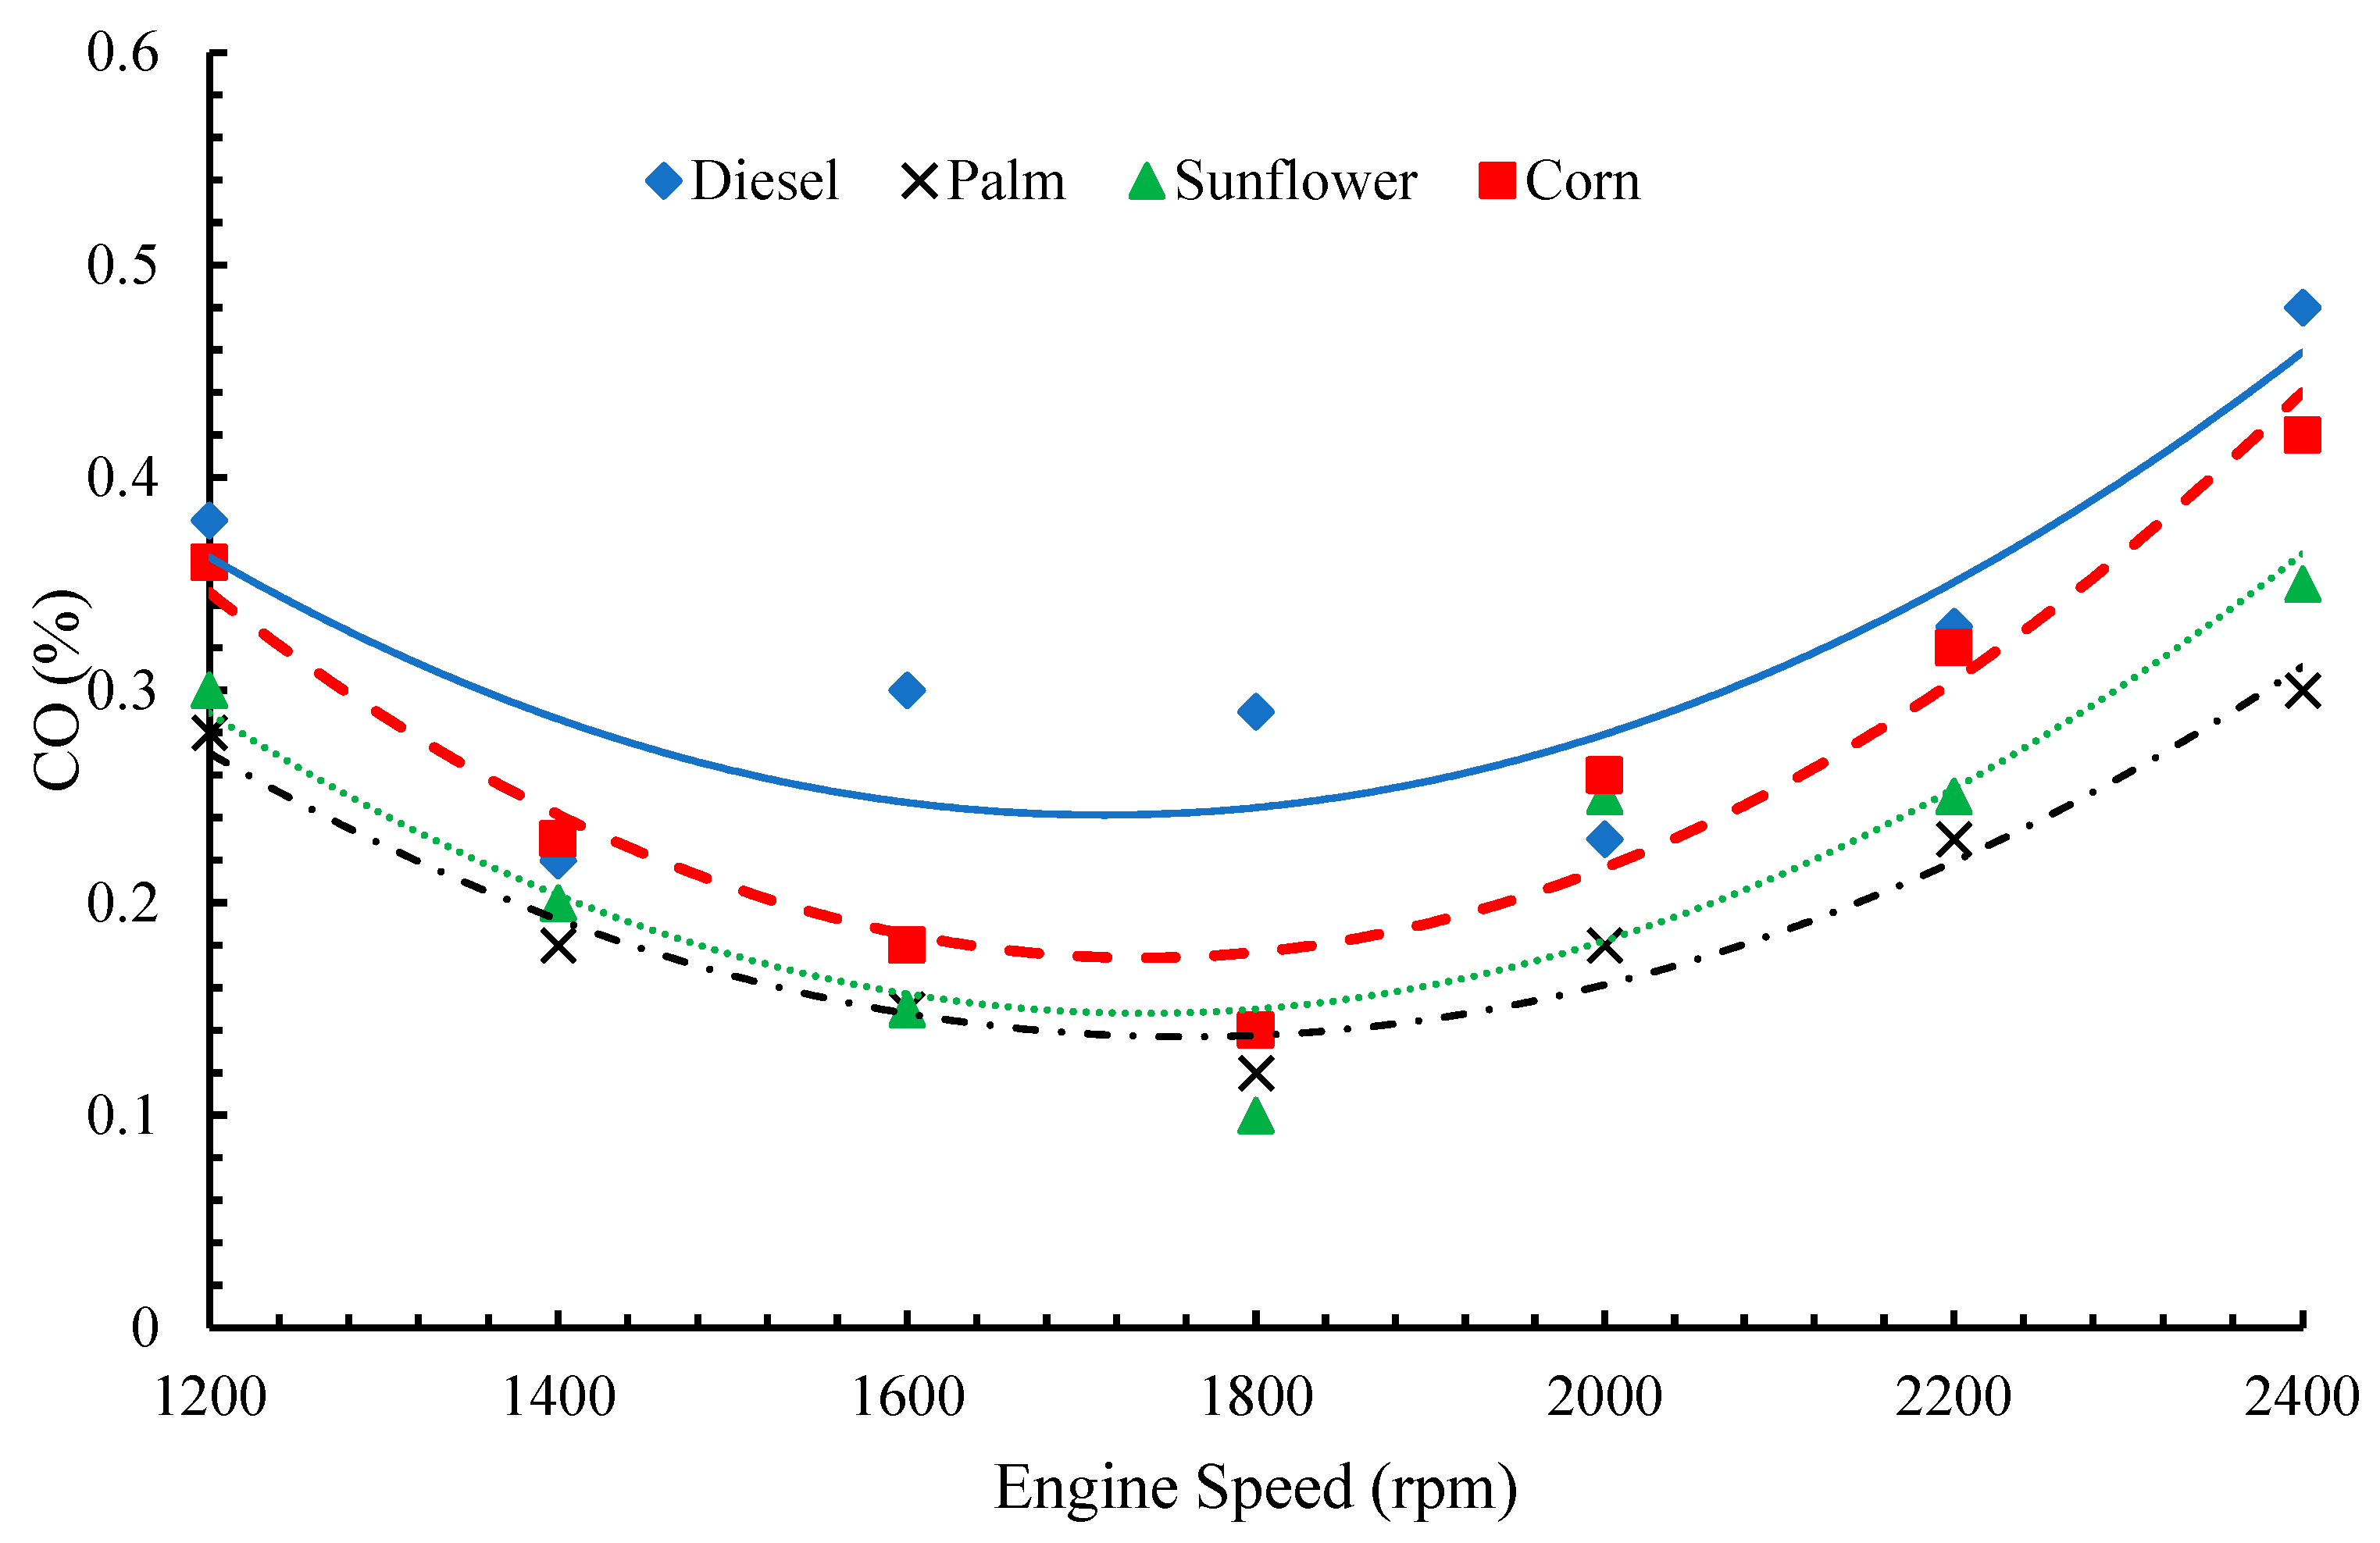
5.1.4. Carbon Monoxide Emission (CO)

The variation in carbon monoxide emission (CO) versus engine speed for pure diesel and 20% additions of different types of biofuels is displayed in Figure 6. According to Figure 6, it can be noticed that the amount of CO released for all the types of fuel tested decreased with the increase in engine speed until reaching a minimum, and then the CO emissions increased. This is due to a lean mixture combustion at a low speed, resulting in incomplete combustion. The further increase may occur due to the short time available to oxidize all the CO atoms and ignition timing retarding that leads to the release of more CO at the higher engine speed [6]. The CO released by the palm, sunflower, and corn biodiesel blends was 4.7%, 26.9%, and 13.6%, respectively, lower than that of pure diesel fuel. Palm biodiesel evaporates quickly and easily into the engine cylinder because it has low specific gravity as compared to other blends. As a result, a decrease in the length of spray atomization, which assists the complete combustion, and a decrease in the CO produced may occur. According to the current experiments, biofuel can reduce the emitted CO by up to 30% as compared to pure diesel depending on environmental conditions, engine type, and engine age [77].
Several factors have been ascribed to the decrease in CO emission in biodiesel fuel when compared to pure diesel, including: (i) the presence of more oxygen in the biodiesel fuel, which promotes full combustion and, hence, lowers CO emissions; (ii) the greater cetane number of biodiesel fuels, resulting in the lesser possibility of fuel-rich zones developing, which is generally linked to CO emissions; (iii) when utilizing biodiesel, the combustion and advanced injection may also explain the CO decrease. Other research works [78,79] revealed that the higher ratio of biofuel blends can increase the produced CO by up to 15% as compared to the pure diesel due to the high viscosity, low mixing of air–fuel ratio that troubles the fuel atomization, and increased period of premixed combustion. The same profile of CO with the engine speed for the different biodiesel tests was reported by Ozsezn et al. [80].

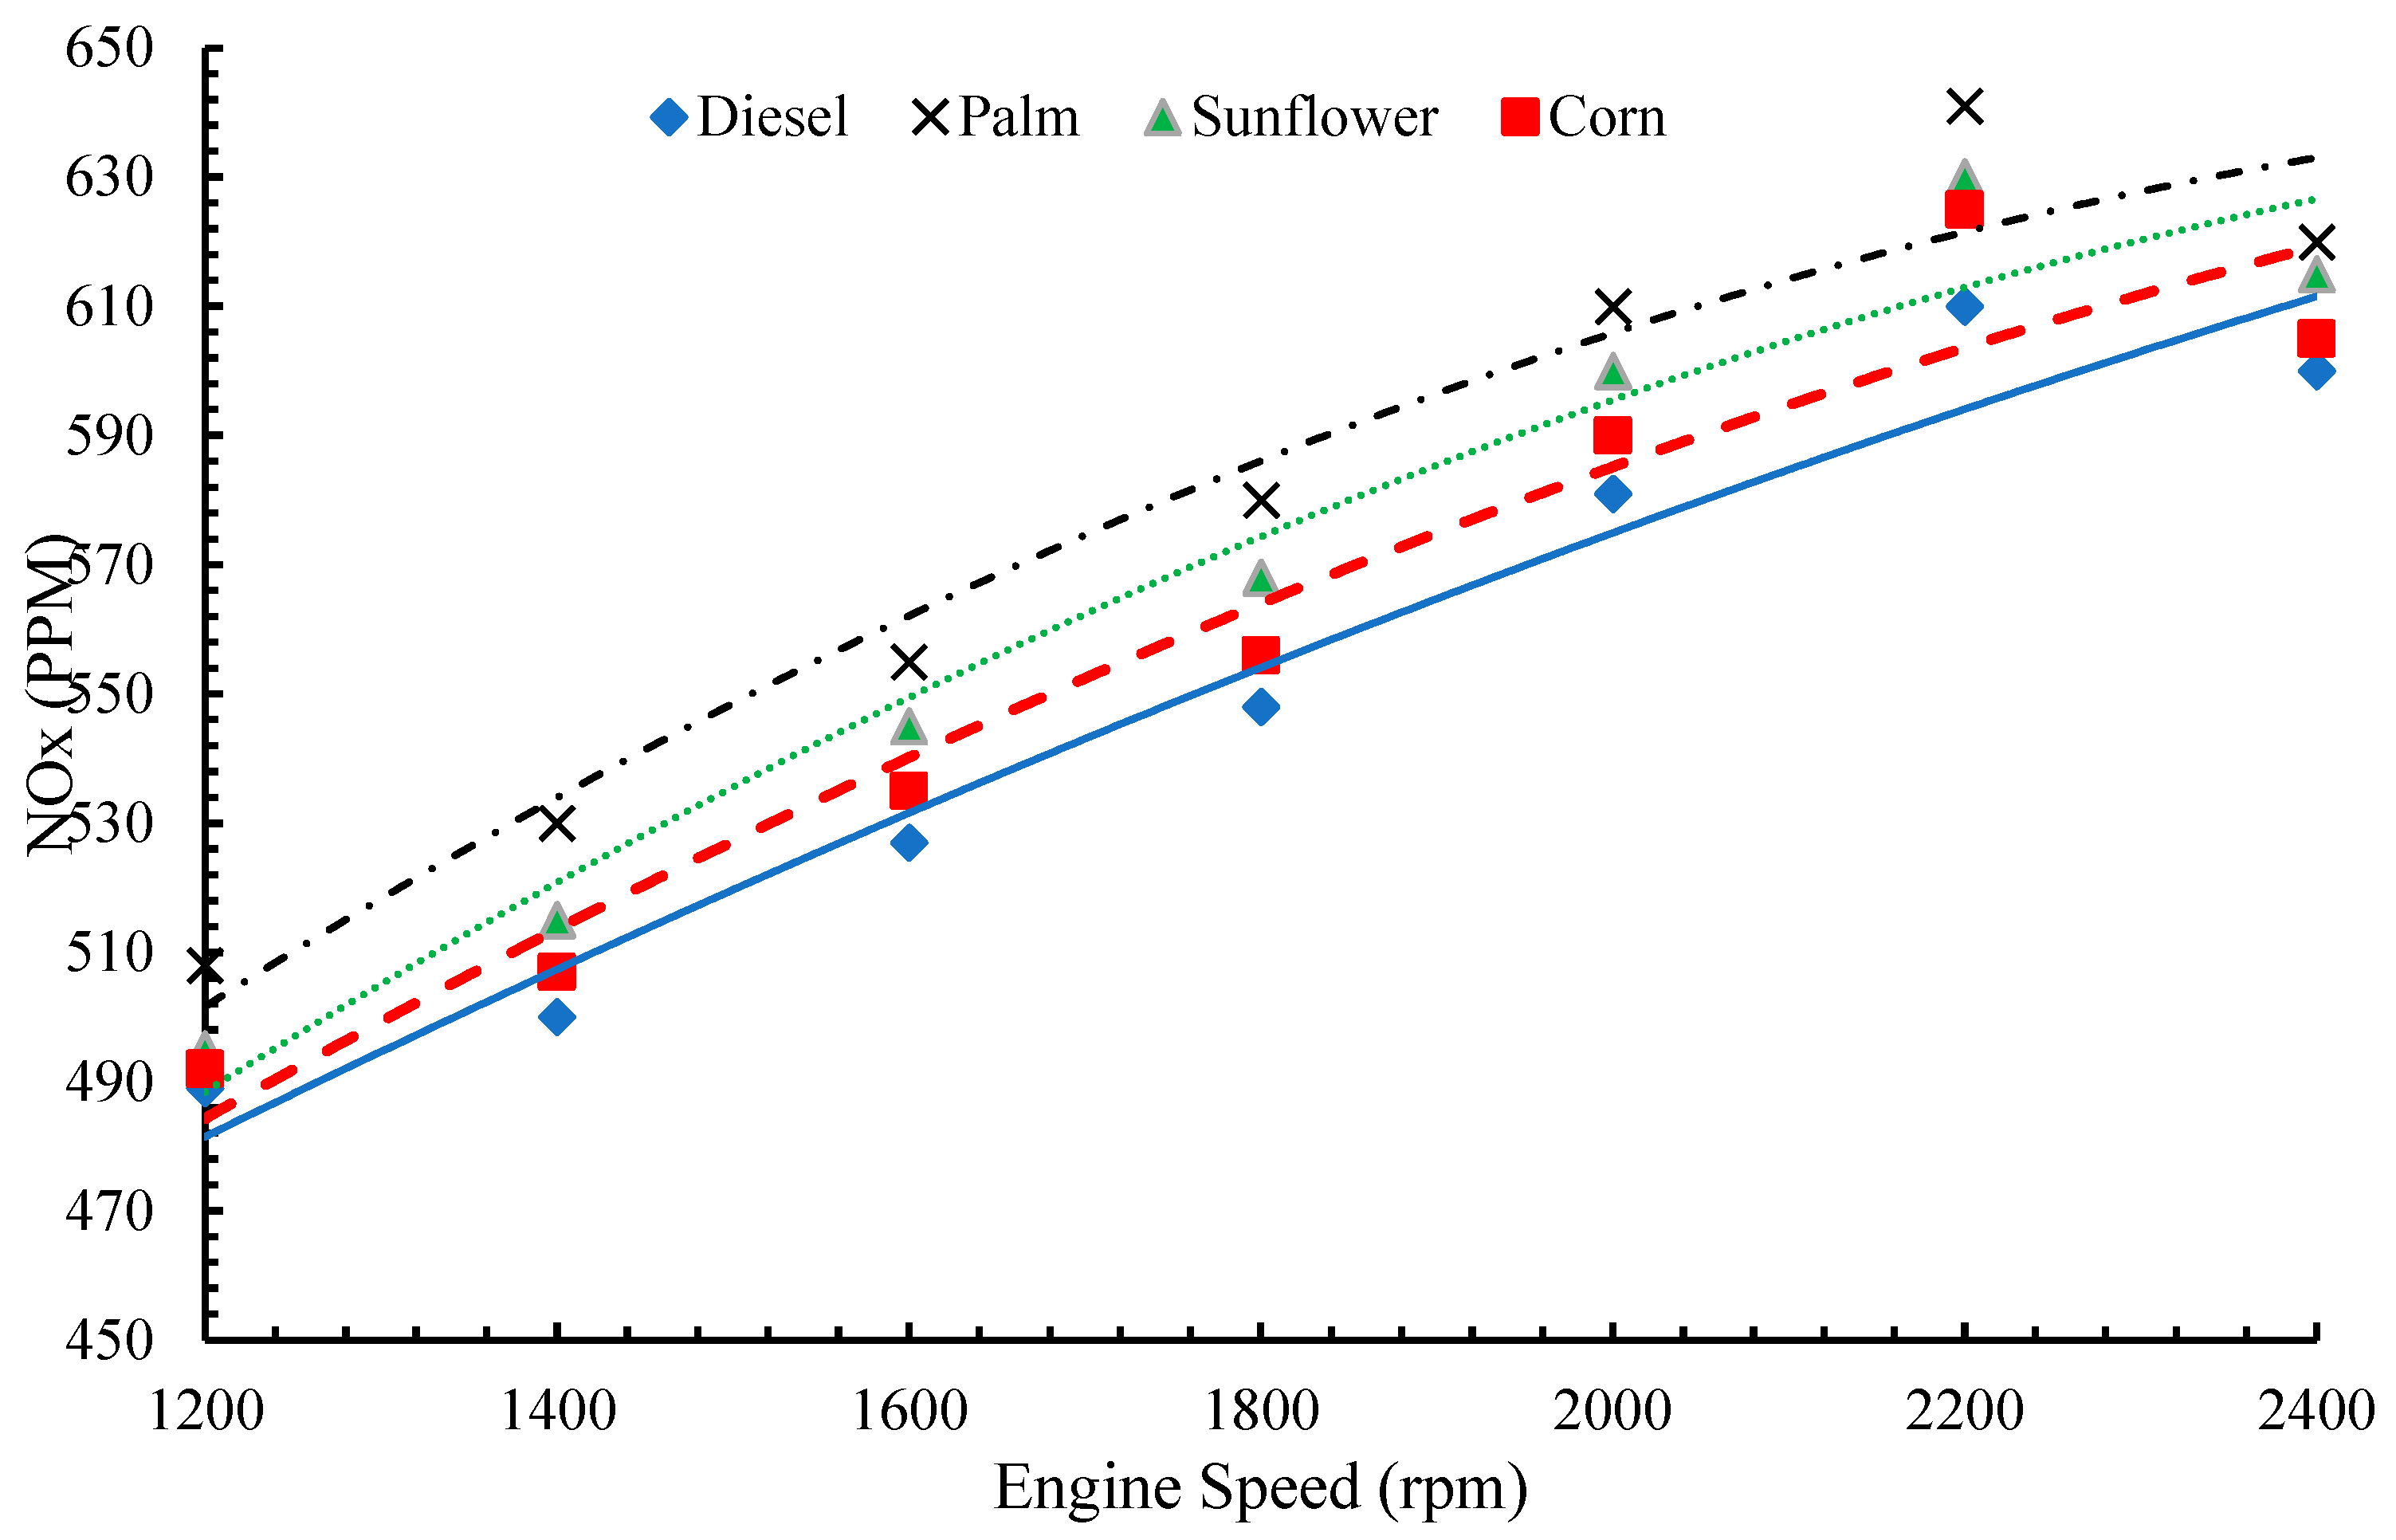
5.1.5. Nitrogen Oxides Emission (NOx)

The concentration of nitrogen oxides (NOx) emission versus engine speed using different types of biodiesel blends is illustrated in Figure 7. It is well known that the concentration of NOx emission mainly depends on the cylinder temperature, engine speed and load, mixture homogeneity, contents of the combustion chamber, oxygen concentration, air–fuel ratio, and residence time [15,81,82,83,84]. From Figure 7, the following points can be depicted: (i) the concentration of NOx increased with the increase in engine speed for all tested fuels. The reason for this increase could be the improved combustion behavior, which has a more homogenous air–fuel mixture at high engine speeds. (ii) For all types of biodiesel blends, there was an increase in NOx concentration of about 4.9%, 2.9%, and 1.4% for palm, sunflower, and corn biodiesel blends, respectively, as compared to pure diesel. The main crucial factor that leads to high emitted NOx emissions is the increase in in-cylinder temperature. The increased concentration of oxygen molecules in biodiesel blends improves the combustion behavior and increases the NOx emission. Moreover, the cetane number of biodiesel blends is higher than that of pure diesel, which leads to a shorter ignition delay. The short ignition delay indicates that a longer residence time is consumed for the initial combustion products and the air–fuel mixture at a higher temperature, which leads to an increase in the emitted NOx concentration. Furthermore, the higher viscosity of biodiesel assists to have a shorter ignition delay and larger droplet size, which finally improves the formation of NOx emissions [85,86]. (iii) When biodiesel is pumped, the pump produces a faster pressure rise because of its lower compressibility in terms of higher bulk modulus, and the sound propagates more rapidly towards the injectors due to its greater sound velocity. Furthermore, the increased viscosity lowers pump leaks, resulting in a greater injection line pressure. As a result, in the current diesel fuel, a faster and sooner needle opening will occur, and, finally, (iv) because the palm biodiesel has a higher cetane number and viscosity as compared to other biodiesel blends, more NOx emission produced during the combustion is expected. Cardone et al. [87] demonstrated a significant increase in NOx emissions at full load, and they demonstrated that the beginning of combustion was more advanced with biodiesel, leading to a higher average temperature peak, using a diagnostic single-zone framework that supplied the heat release graph from the in-cylinder pressure signal. With higher loads, the observed change in the advance of combustion increased. This advance was ascribed to the injection advance, and the authors indicated that it might be adjusted from the embedded controller to restore the original NOx emission level.

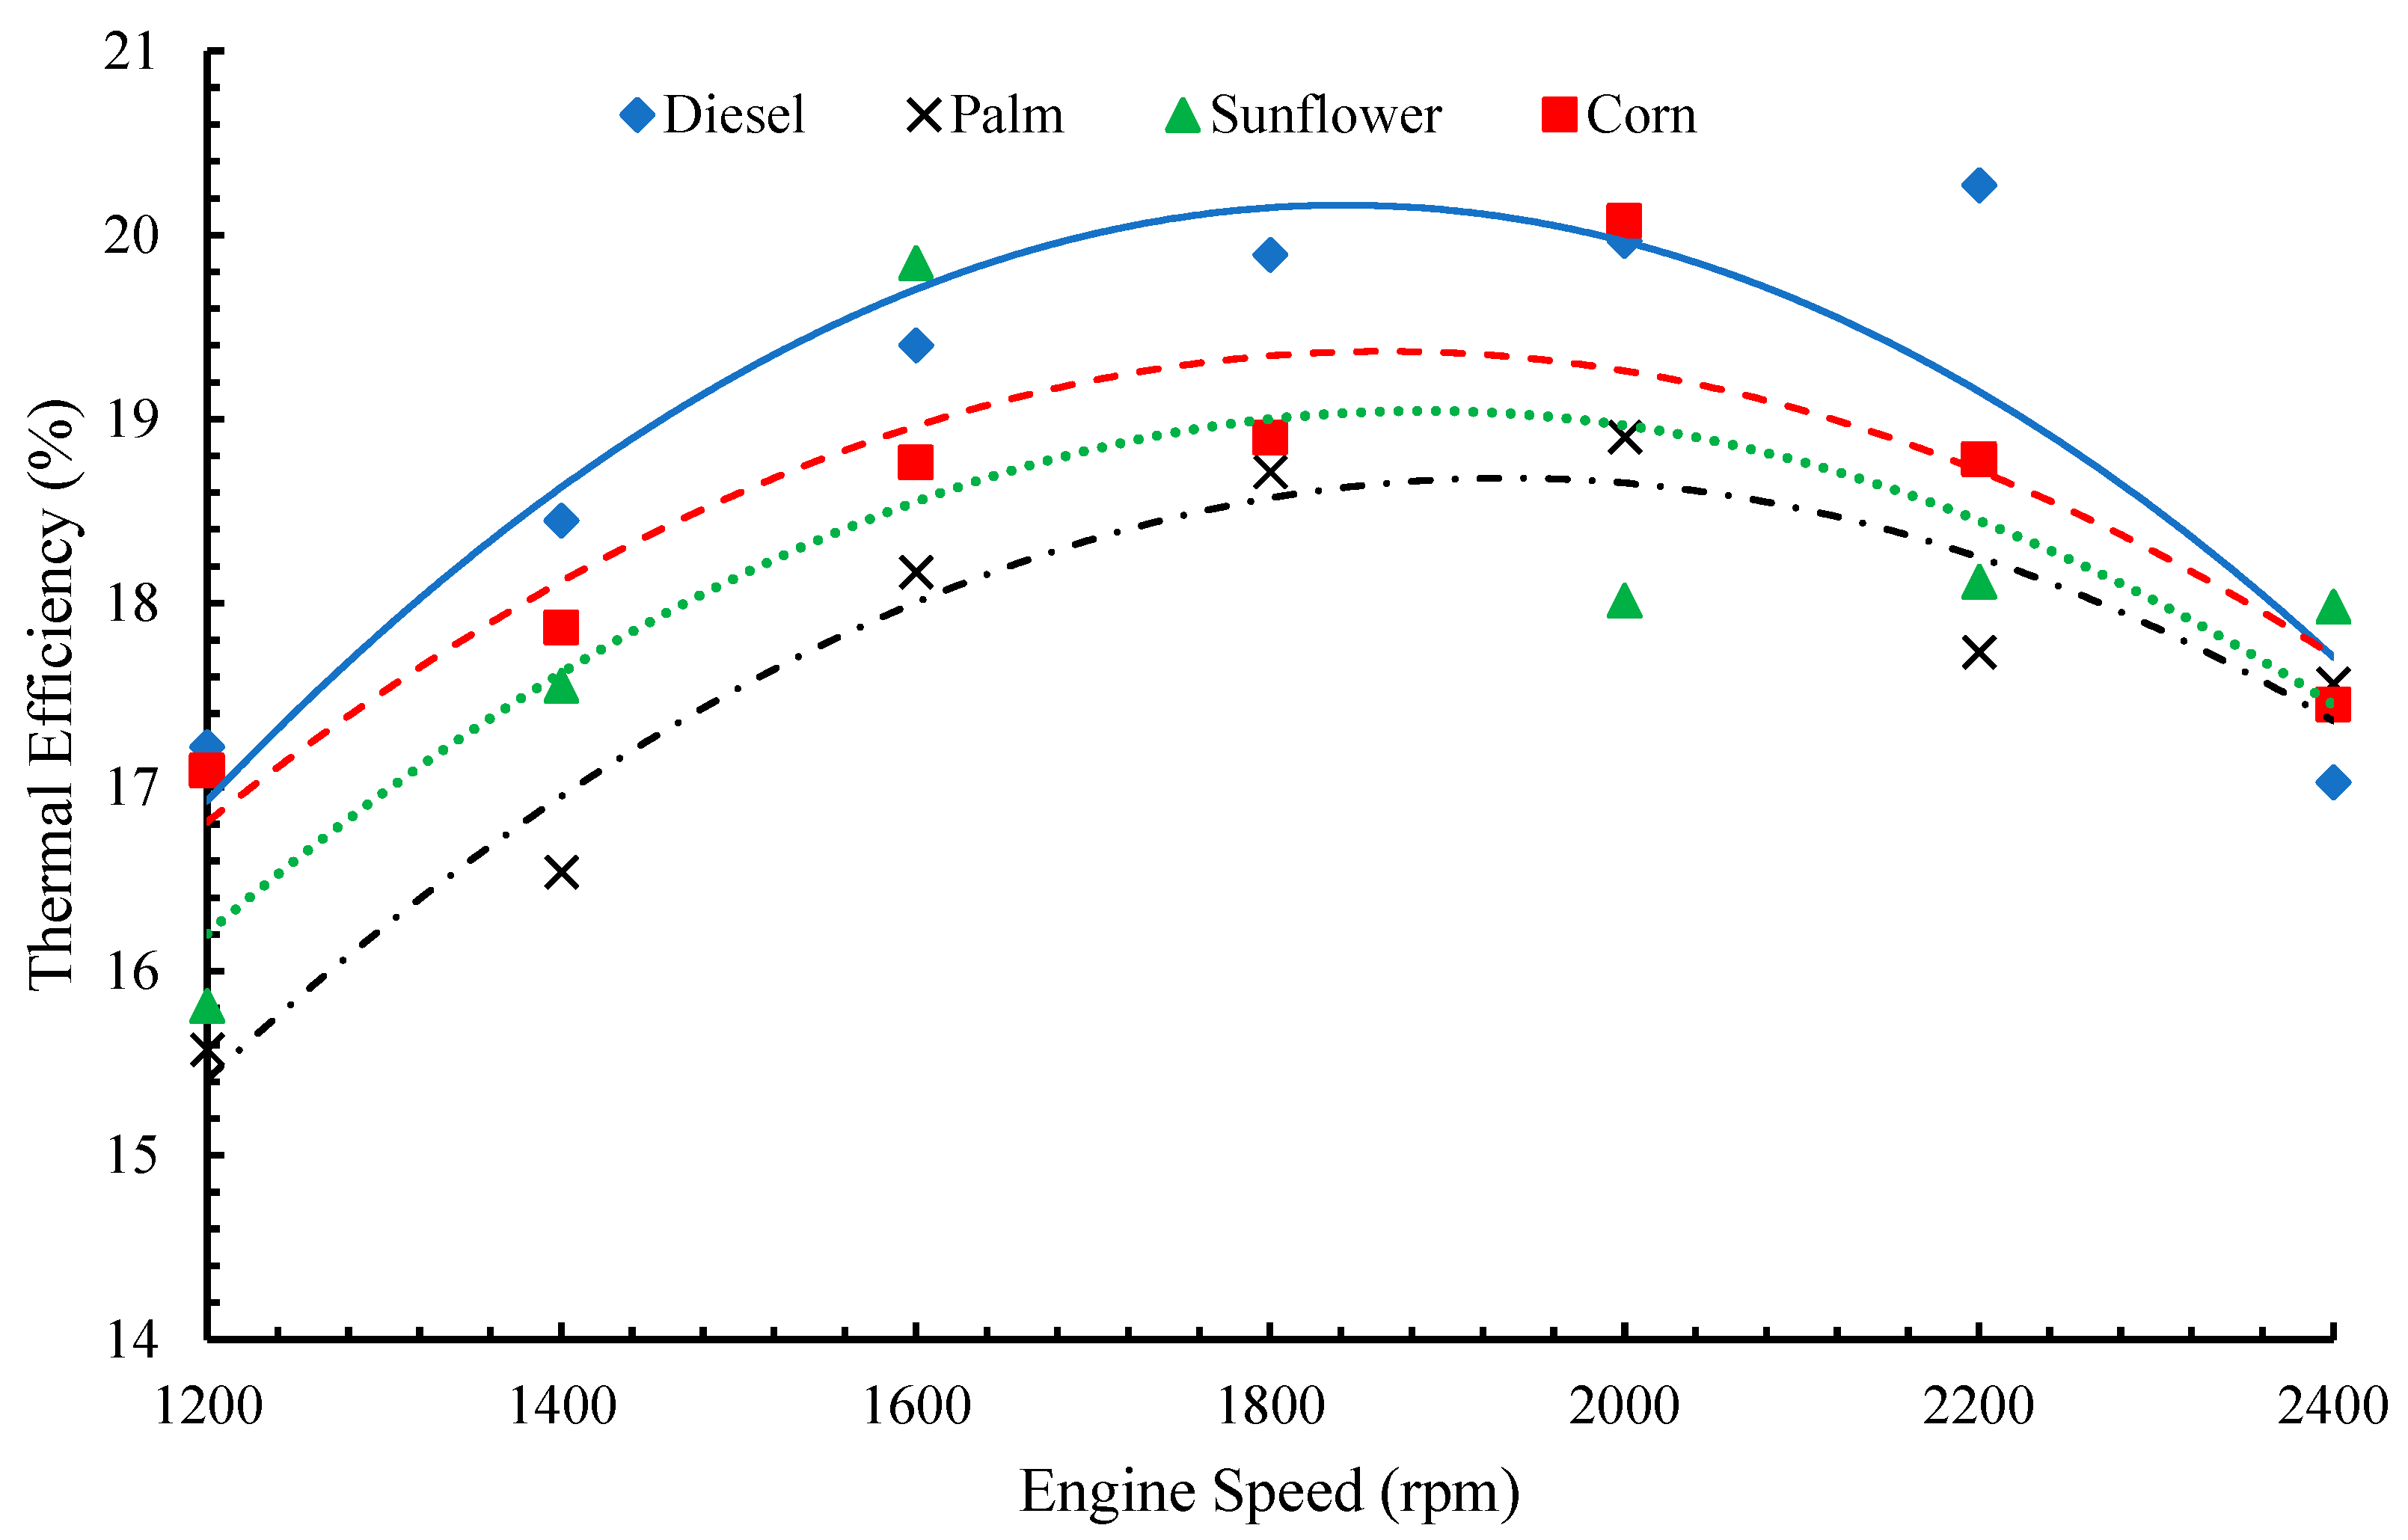
5.2. Engine Performance: Brake Thermal Efficiency

All of the parameter matrices relevant to diesel engine performance in terms of brake torque (BT), brake power (BP), brake thermal efficiency (BTE), and brake specific fuel consumption (BSFC) while using various biodiesel blends were discussed in-depth in a previous publication [88].
The fluctuation of BTE with a range of engine speeds for pure diesel and different types of biofuel blends is displayed in Figure 8. As depicted from this figure, the thermal efficiency gradually increases with the engine speed until reaches a maximum value. After that, it decreases with the increase in the engine speed. This behavior could be due to the prolonged time available for cylinder walls to transfer the heat, particularly at low speeds; therefore, a significant fuel quantity is consumed for a greater amount of heat loss that takes place. As the engine speed increases, the brake power increases, which means a higher thermal efficiency is obtained. At higher speeds, however, the friction power increases rapidly due to the high inertia of the moving parts, which could be a consequence of the drop in thermal efficiency. Another insight, all biodiesel blends show lower thermal efficiency as compared to pure diesel. On average, a reduction in thermal efficiency by 6.7%, 4.4%, and 2.4% was found for palm, sunflower, and corn biodiesels, respectively, as compared to pure diesel. This reduction is due to the increased thermal friction losses resulting from the presence of biodiesel fuel that transfers to the cylinder walls and engine coolant. It is known that the brake thermal efficiency is inversely proportional to BSFC and heating value [89]. For instance, the BSFC increases and the heating value decreases for all the biodiesel blends. On the other hand, the BSFC augmentation is more prevailing in this case. This explains the reason for the decrease in the thermal efficiency of biodiesel blends, although they have low heating value. Moreover, the biodiesel blends have a lower ignition delay, which means starting the combustion earlier as compared to pure diesel. The lower ignition delay leads to more heat losses to the surroundings, and, thus, more power is required for the piston to achieve the compression stroke. The same results were reported in many studies [78,85,90,91]. However, a few researchers [79,92] found an inverse profile. They explained the higher thermal efficiency as a result of the improved combustion behavior of the oxygenated biodiesel fuel.

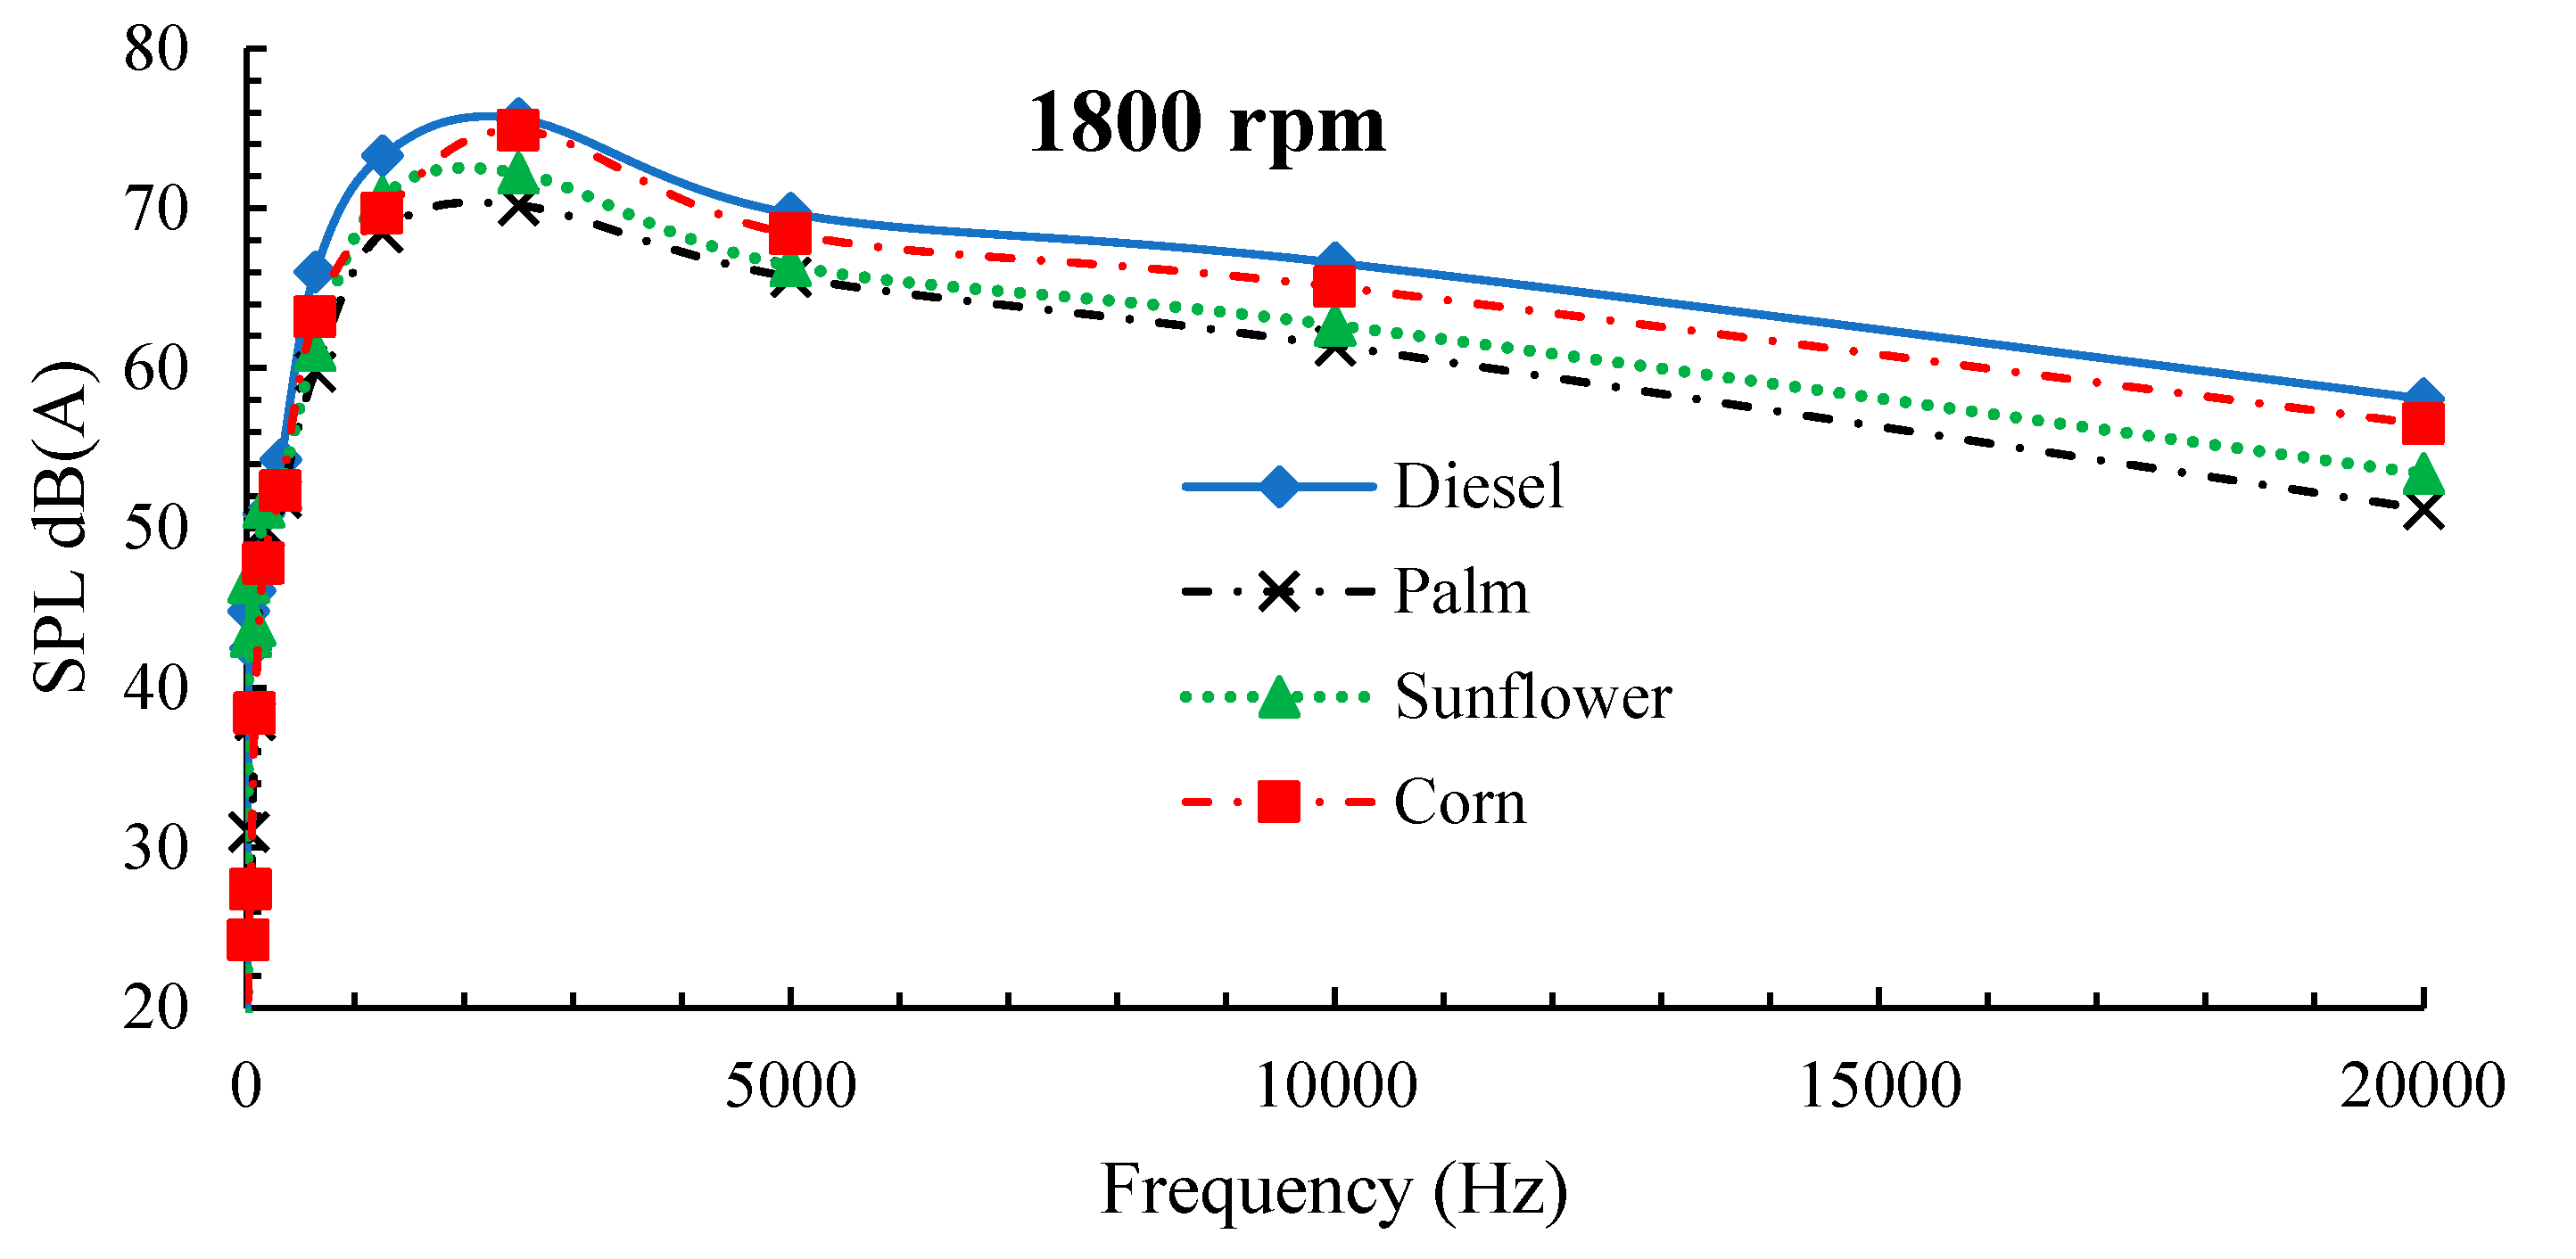
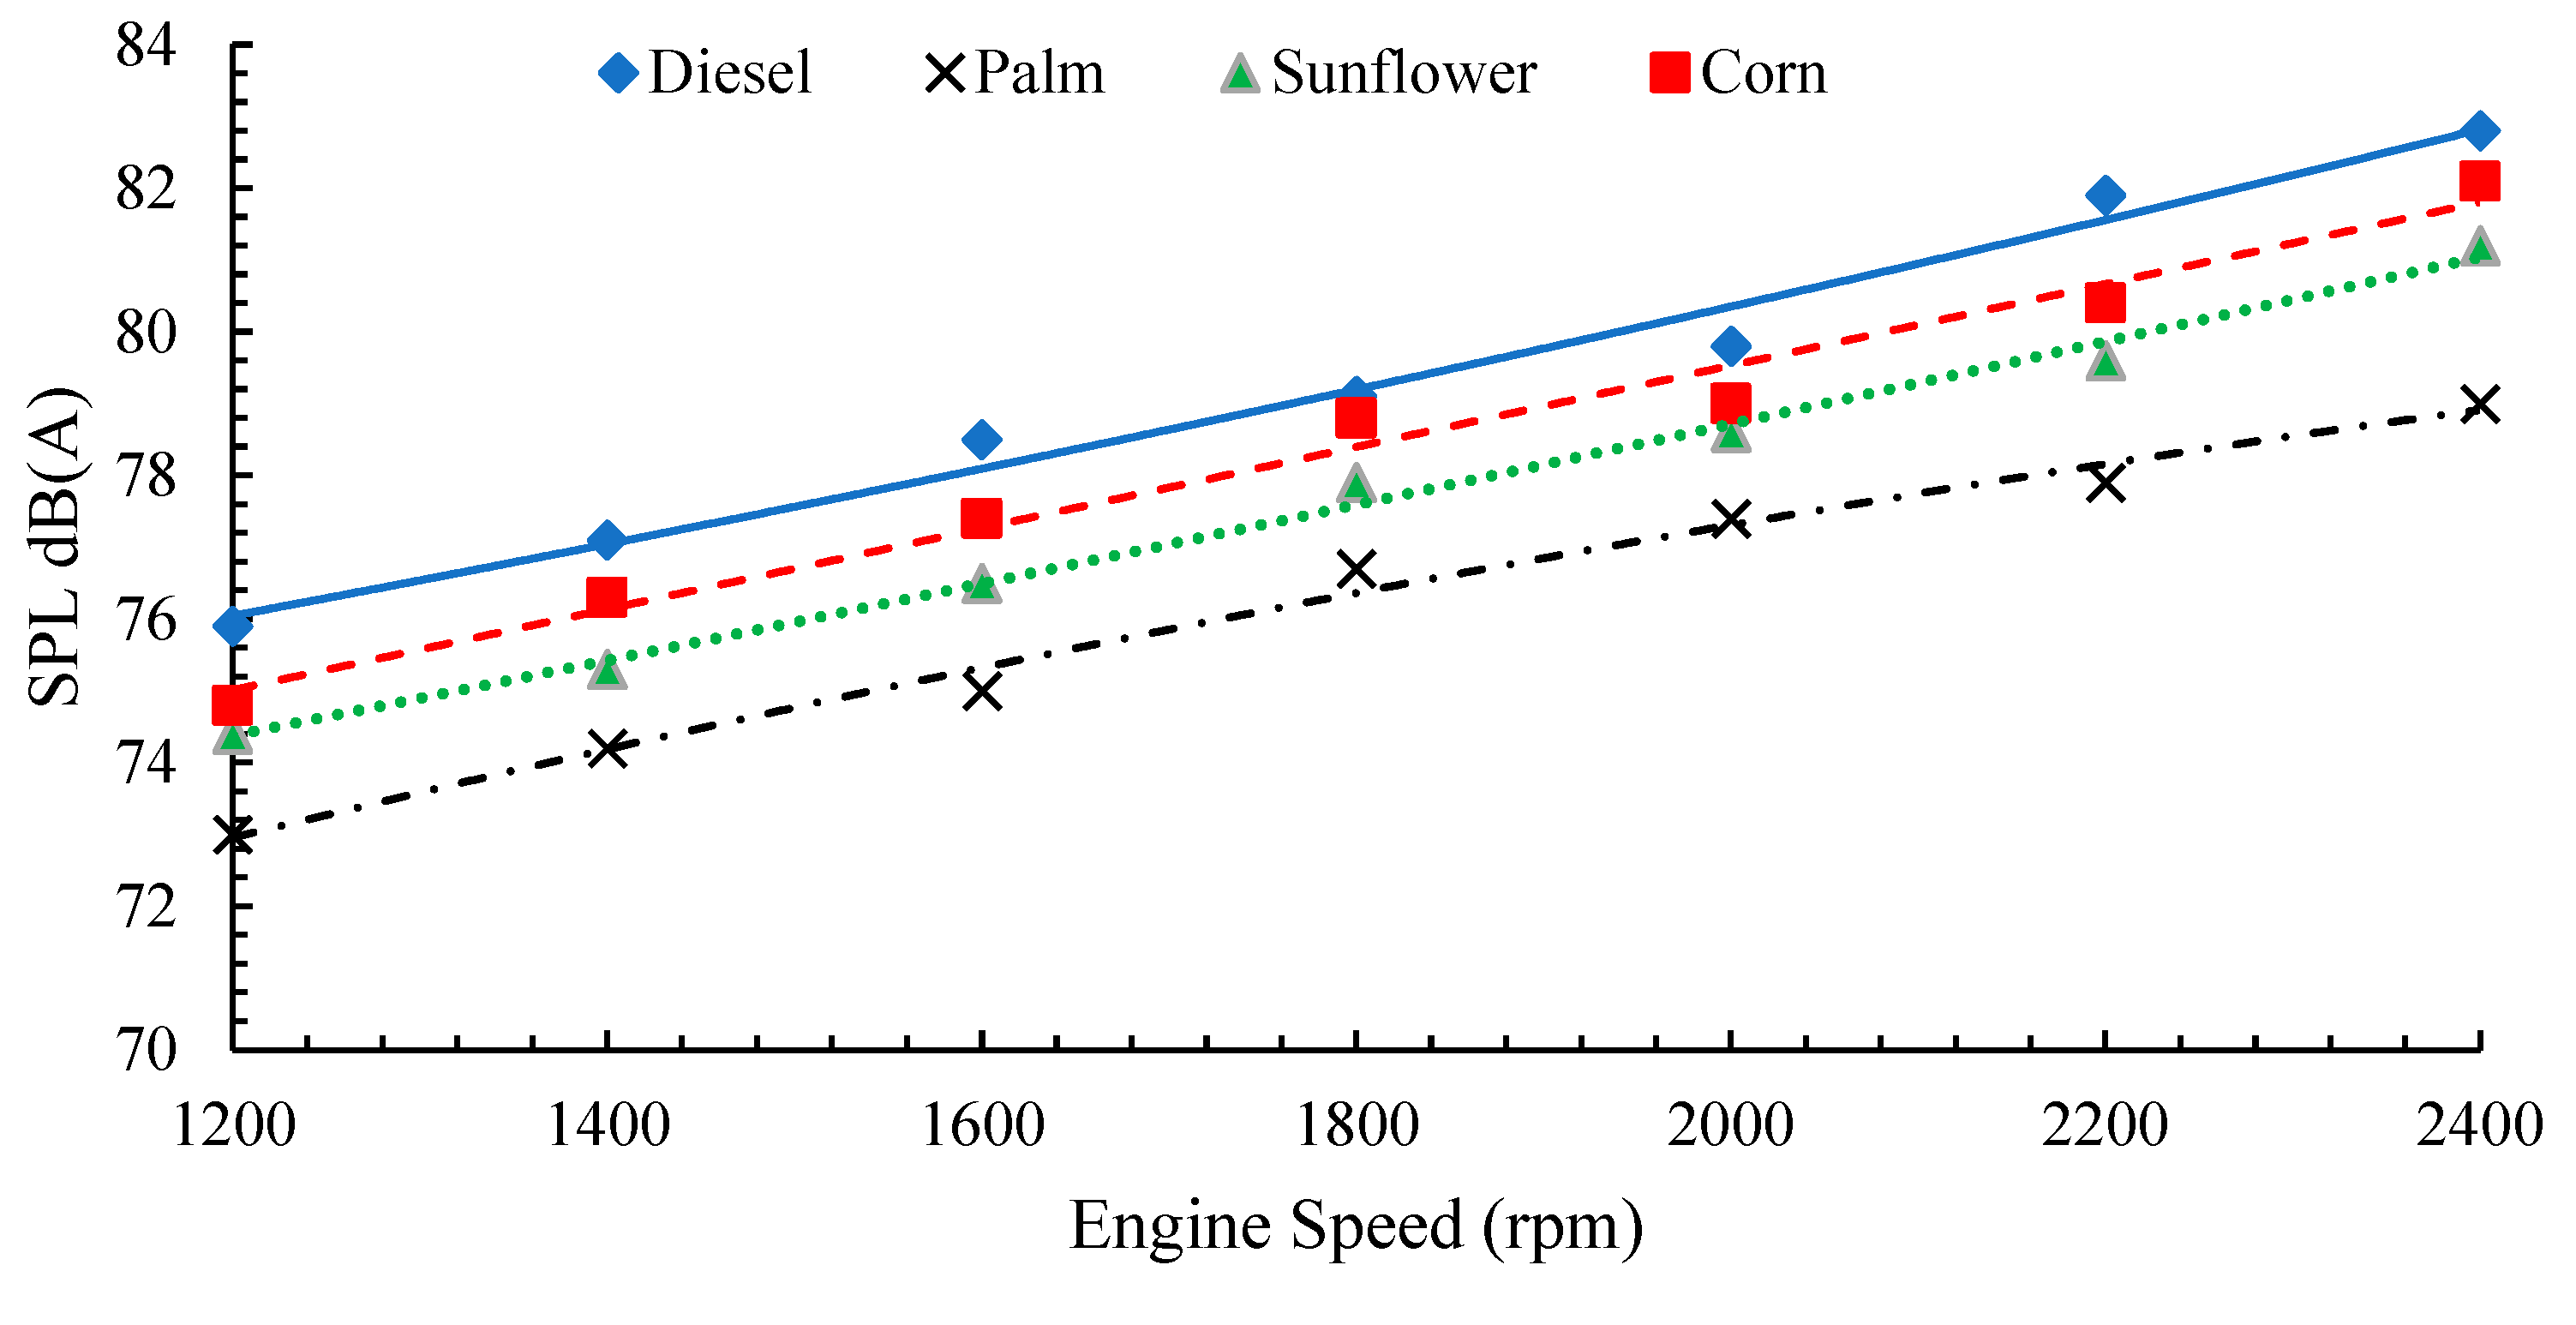
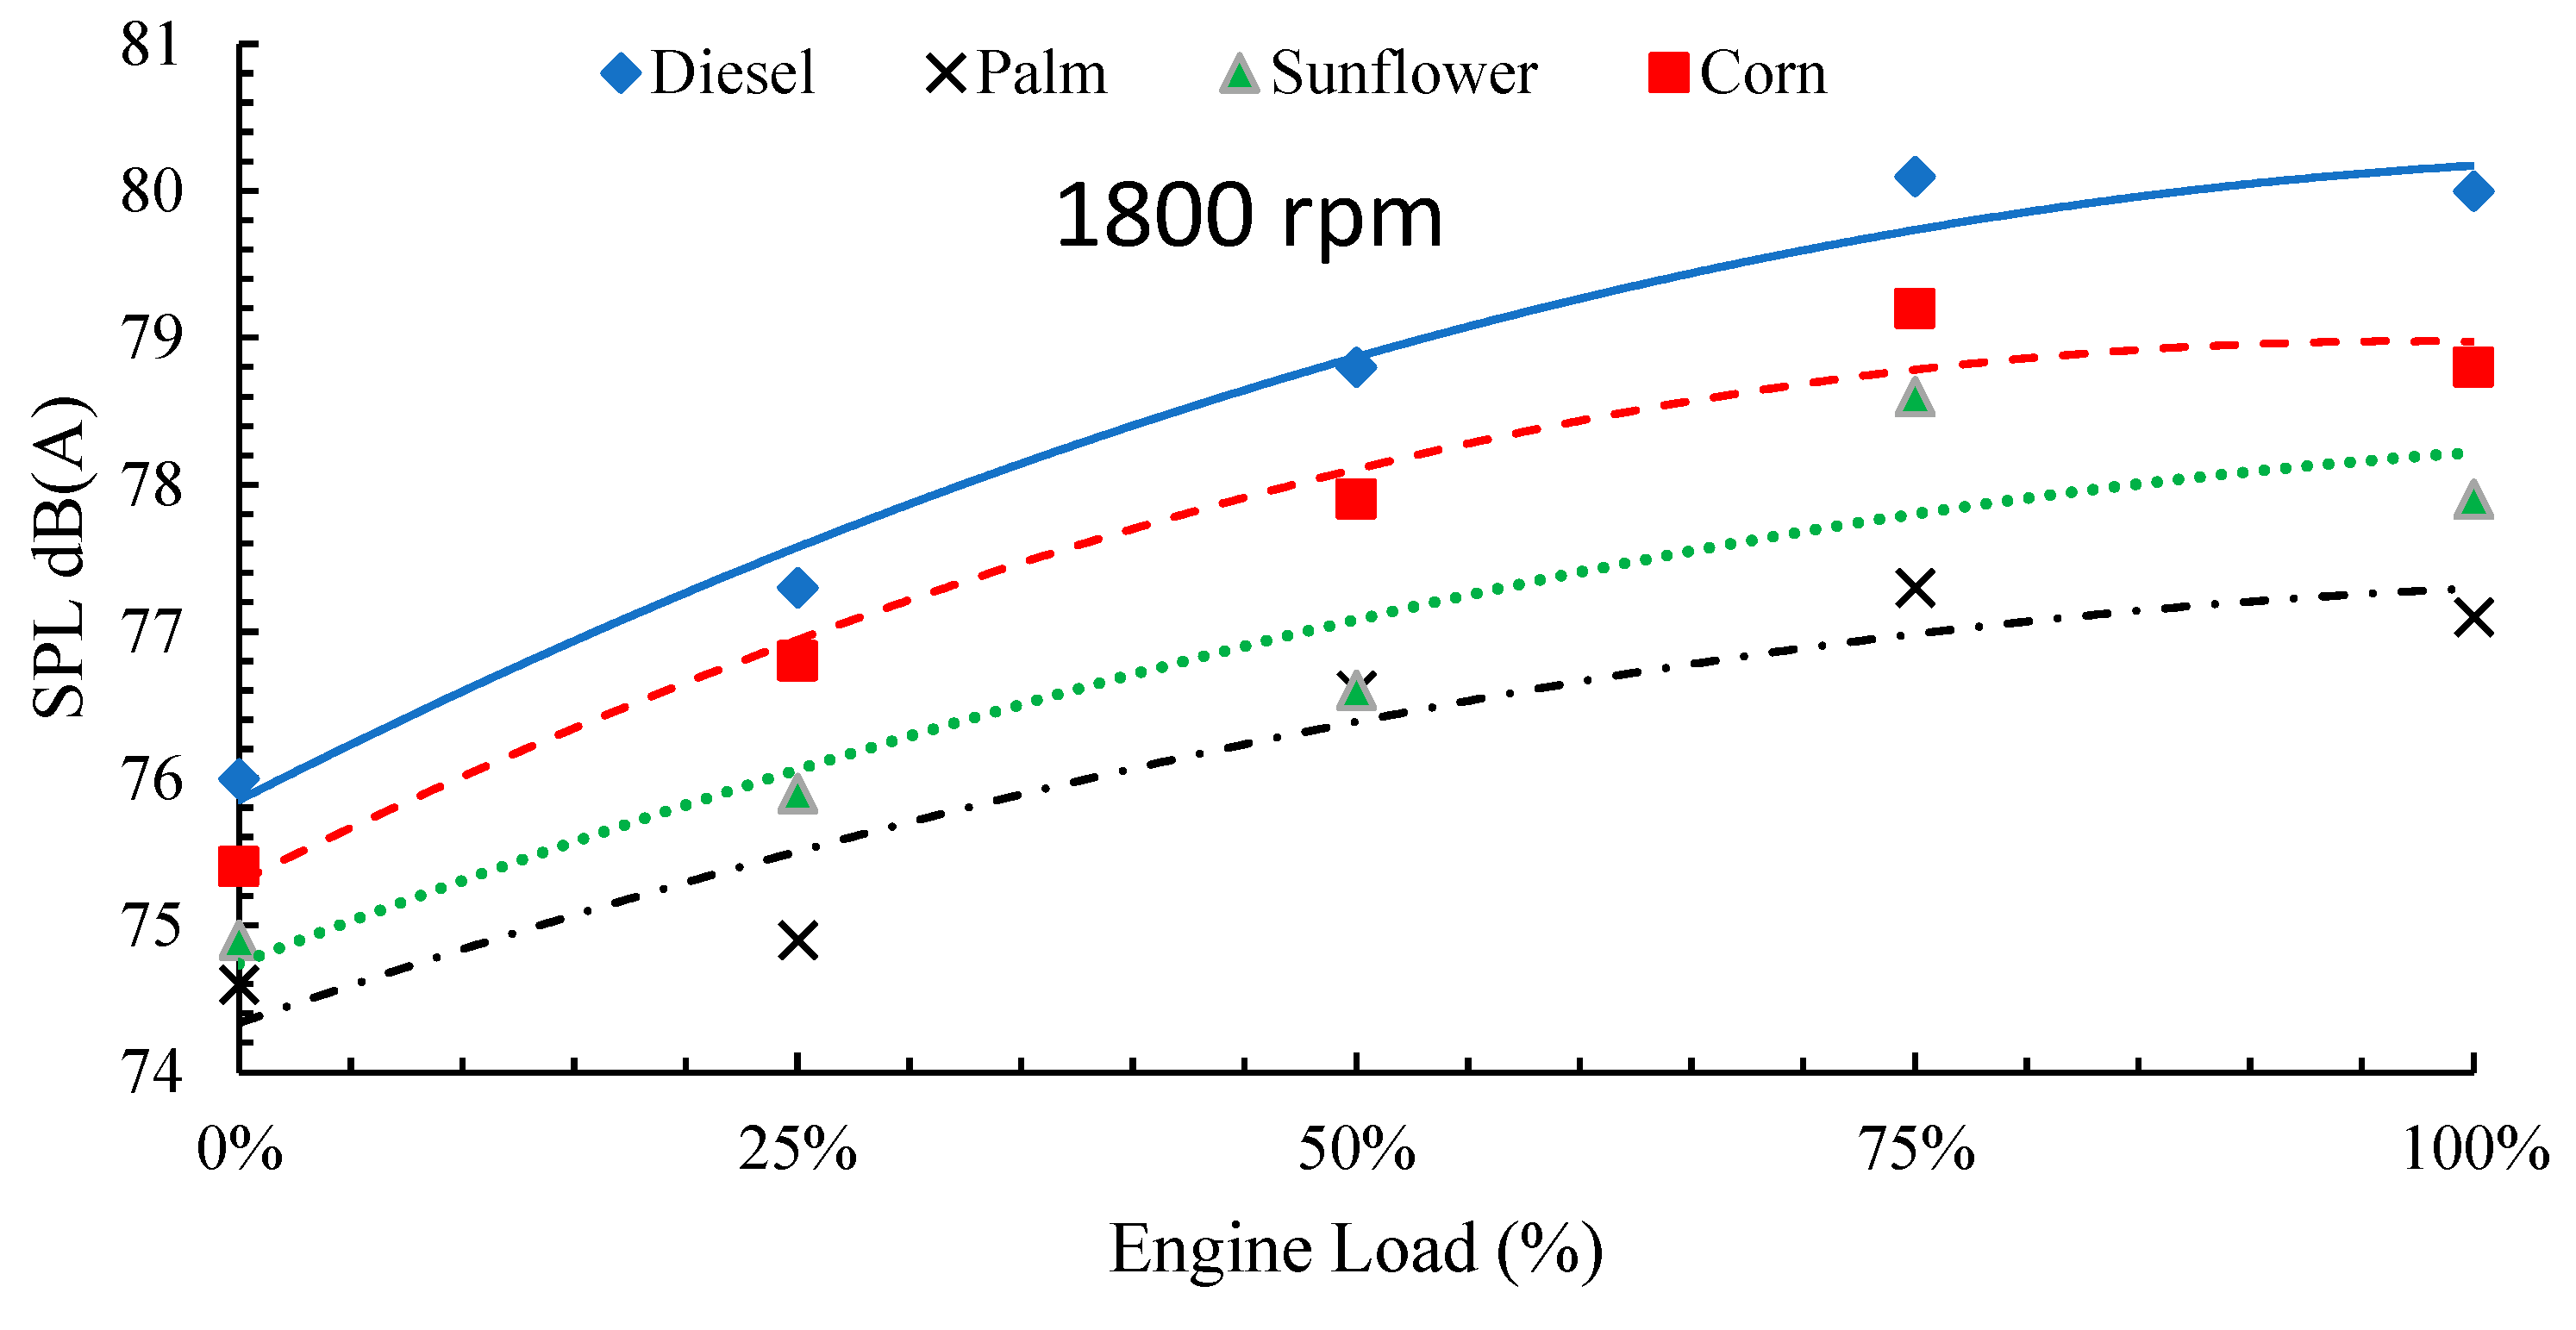
5.3. Noise Emission Analysis

In general, the diesel engine has a noise range of 80 to 110 dB(A) depending on engine size, injection time, and rotation speed of the crankshaft. According to Siavash et al. [93], the most effective noise resources in the diesel engine were piston slap, combustion behavior, and exhaust valve closing [94]. The impacts of biodiesel on diesel engine noise may be divided into two categories [93]: influence on combustion and impact on fuel injection, which includes the injection method and fuel spray pattern. The effect of different types of biodiesels on the noise level (sound pressure) values produced by the diesel engine is depicted in Figure 9, Figure 10 and Figure 11. Figure 9 shows the variation in noise level with the frequency at 1800 rpm engine speed, Figure 10 displays the fluctuation in noise level with engine speed, and Figure 11 illustrates the variation in noise level with engine load at 1800 rpm engine speed.
The following conclusions can be drawn from these figures: (i) according to Figure 10, it was clear after using Equation (4) that the sound intensity was reduced by 50.9%, 31.5%, and 18.5% for the palm, sunflower, and corn biodiesel blends, respectively, as compared to pure diesel fuel. The physical characteristics of biodiesel blends will directly impact the noise emission in addition to combustion productivity, especially cetane number, oxygen content, latent heat of vaporization, and kinematic viscosity. (ii) The reduction in noise level when biodiesel blends are used could be due to the improved combustion performance associated with the high oxygen content existing in biodiesel blends as compared to pure diesel fuel. Furthermore, biodiesel with a higher viscosity promotes lubricity and dampening, leading to lower sound levels. (iii) The noise level increased proportionally with the engine speed for all the tested fuels, as displayed in Figure 10. This increase is due to an increase in the combustion process of speed and repetition time, which is responsible for combustion noises caused by forces operating on the crankshaft and combustion excitation [95]. (iv) When the engine load elevated, the noise levels increased for all the tested fuels, as depicted in Figure 11. This can be referred to as the increase in the maximum heat release rate and in-cylinder pressure. The same results were achieved by Sarıdemir et al. [96]. Maillard and Jagla [89] showed that, at low-frequency values, there is little effect of load on the SPL, especially at high speeds. On the other hand, the effect of load was clear and more tangible at a low engine speed or high frequency. (v) The difference of biodiesel chemical structures and their characteristics, especially the calorific value, will directly affect the noise level. For instance, to compensate for the reduced heating value of biodiesel blends compared to pure diesel fuel, the quantity of supplied fuel should be increased. (vi) Palm biodiesel fuel has the highest cetane number among all the tested fuels. Consequently, the ignition delay duration is the shortest. For this short period, the fuel abruptly starts to ignite when it arrives at the ignition temperature. This abrupt ignition accompanies both the highest heat release rate and pressure rise in the cylinder, which are the lowest among other tested fuels. Therefore, palm biodiesel produces the lowest noise level. (vii) Moreover, palm biodiesel has the highest viscosity among all tested fuels. The higher viscosity is responsible for enhanced lubricity and damping capacity, subsequently reducing the noise level. Moreover, the higher viscosity leads to a decrease in both the ignition delay period and the rate of increasing pressure in the cylinder, which directly reduces the value of SPL [97,98]. However, Patel et al. [99] showed a high kinematic viscosity, which affects the formation of fuel droplets and produces a relatively larger diameter droplet, which makes it more difficult to evaporate and burn. Fattah et al. [100] indicated that the high viscosity leads to poor pulverization, which results in increasing the fuel droplet diameter inside the engine cylinder and decreasing the quantity of fuel. In such cases, the fuel is burnt through the premixed regime and makes a gradual reduction in the maximum pressure inside the cylinder. (vii) The low frequency values, the variance between all the profiles of SPL, is negligible. On the other side, this difference is clear at high frequencies for the tested fuels. The explanation of this observation is the very long wavelength at a low frequency; therefore, the sampling rate is a few points from this region in all the tested fuels. As a result, the sound pressure in terms of root mean square (RMS) values will be covered by a few points and this will conduct identical SPLs in all the tested fuels. In contrast, the wavelength is very short at high frequencies. Therefore, the sampling rate covers several points as compared to the previous scenario. Consequently, the sound pressure in terms of root mean square (RMS) values will be more precise, leading to more accurate SPL values in all the tested fuels [101]. (viii) The sound pressure level profiles are similar to the brake power profile generated from the diesel engine. For instance, the brake power is low at a low frequency and low speed. The sound pressure level increased gradually as the engine speed increased and, consequently, the brake power increased. Therefore, the noise level is directly related to engine speed, load, and power. (ix) All the tested fuels showed high noise levels at medium frequency range (75% engine load) and high engine speed range. This result is in agreement with Dal et al. [102]; and, finally, (x) regardless of all the tested fuels and loads, a larger quantity of the diesel engine noise in terms of the overall dB(A) level was observed in the frequency range of 500 Hz to 500 kHz, which is considered as a critical range for the combustion excitation forces. Moreover, the overall dB(A) is very low at a low frequency range of less than 500 Hz. The same trend was observed by Giakoumis et al. [103].

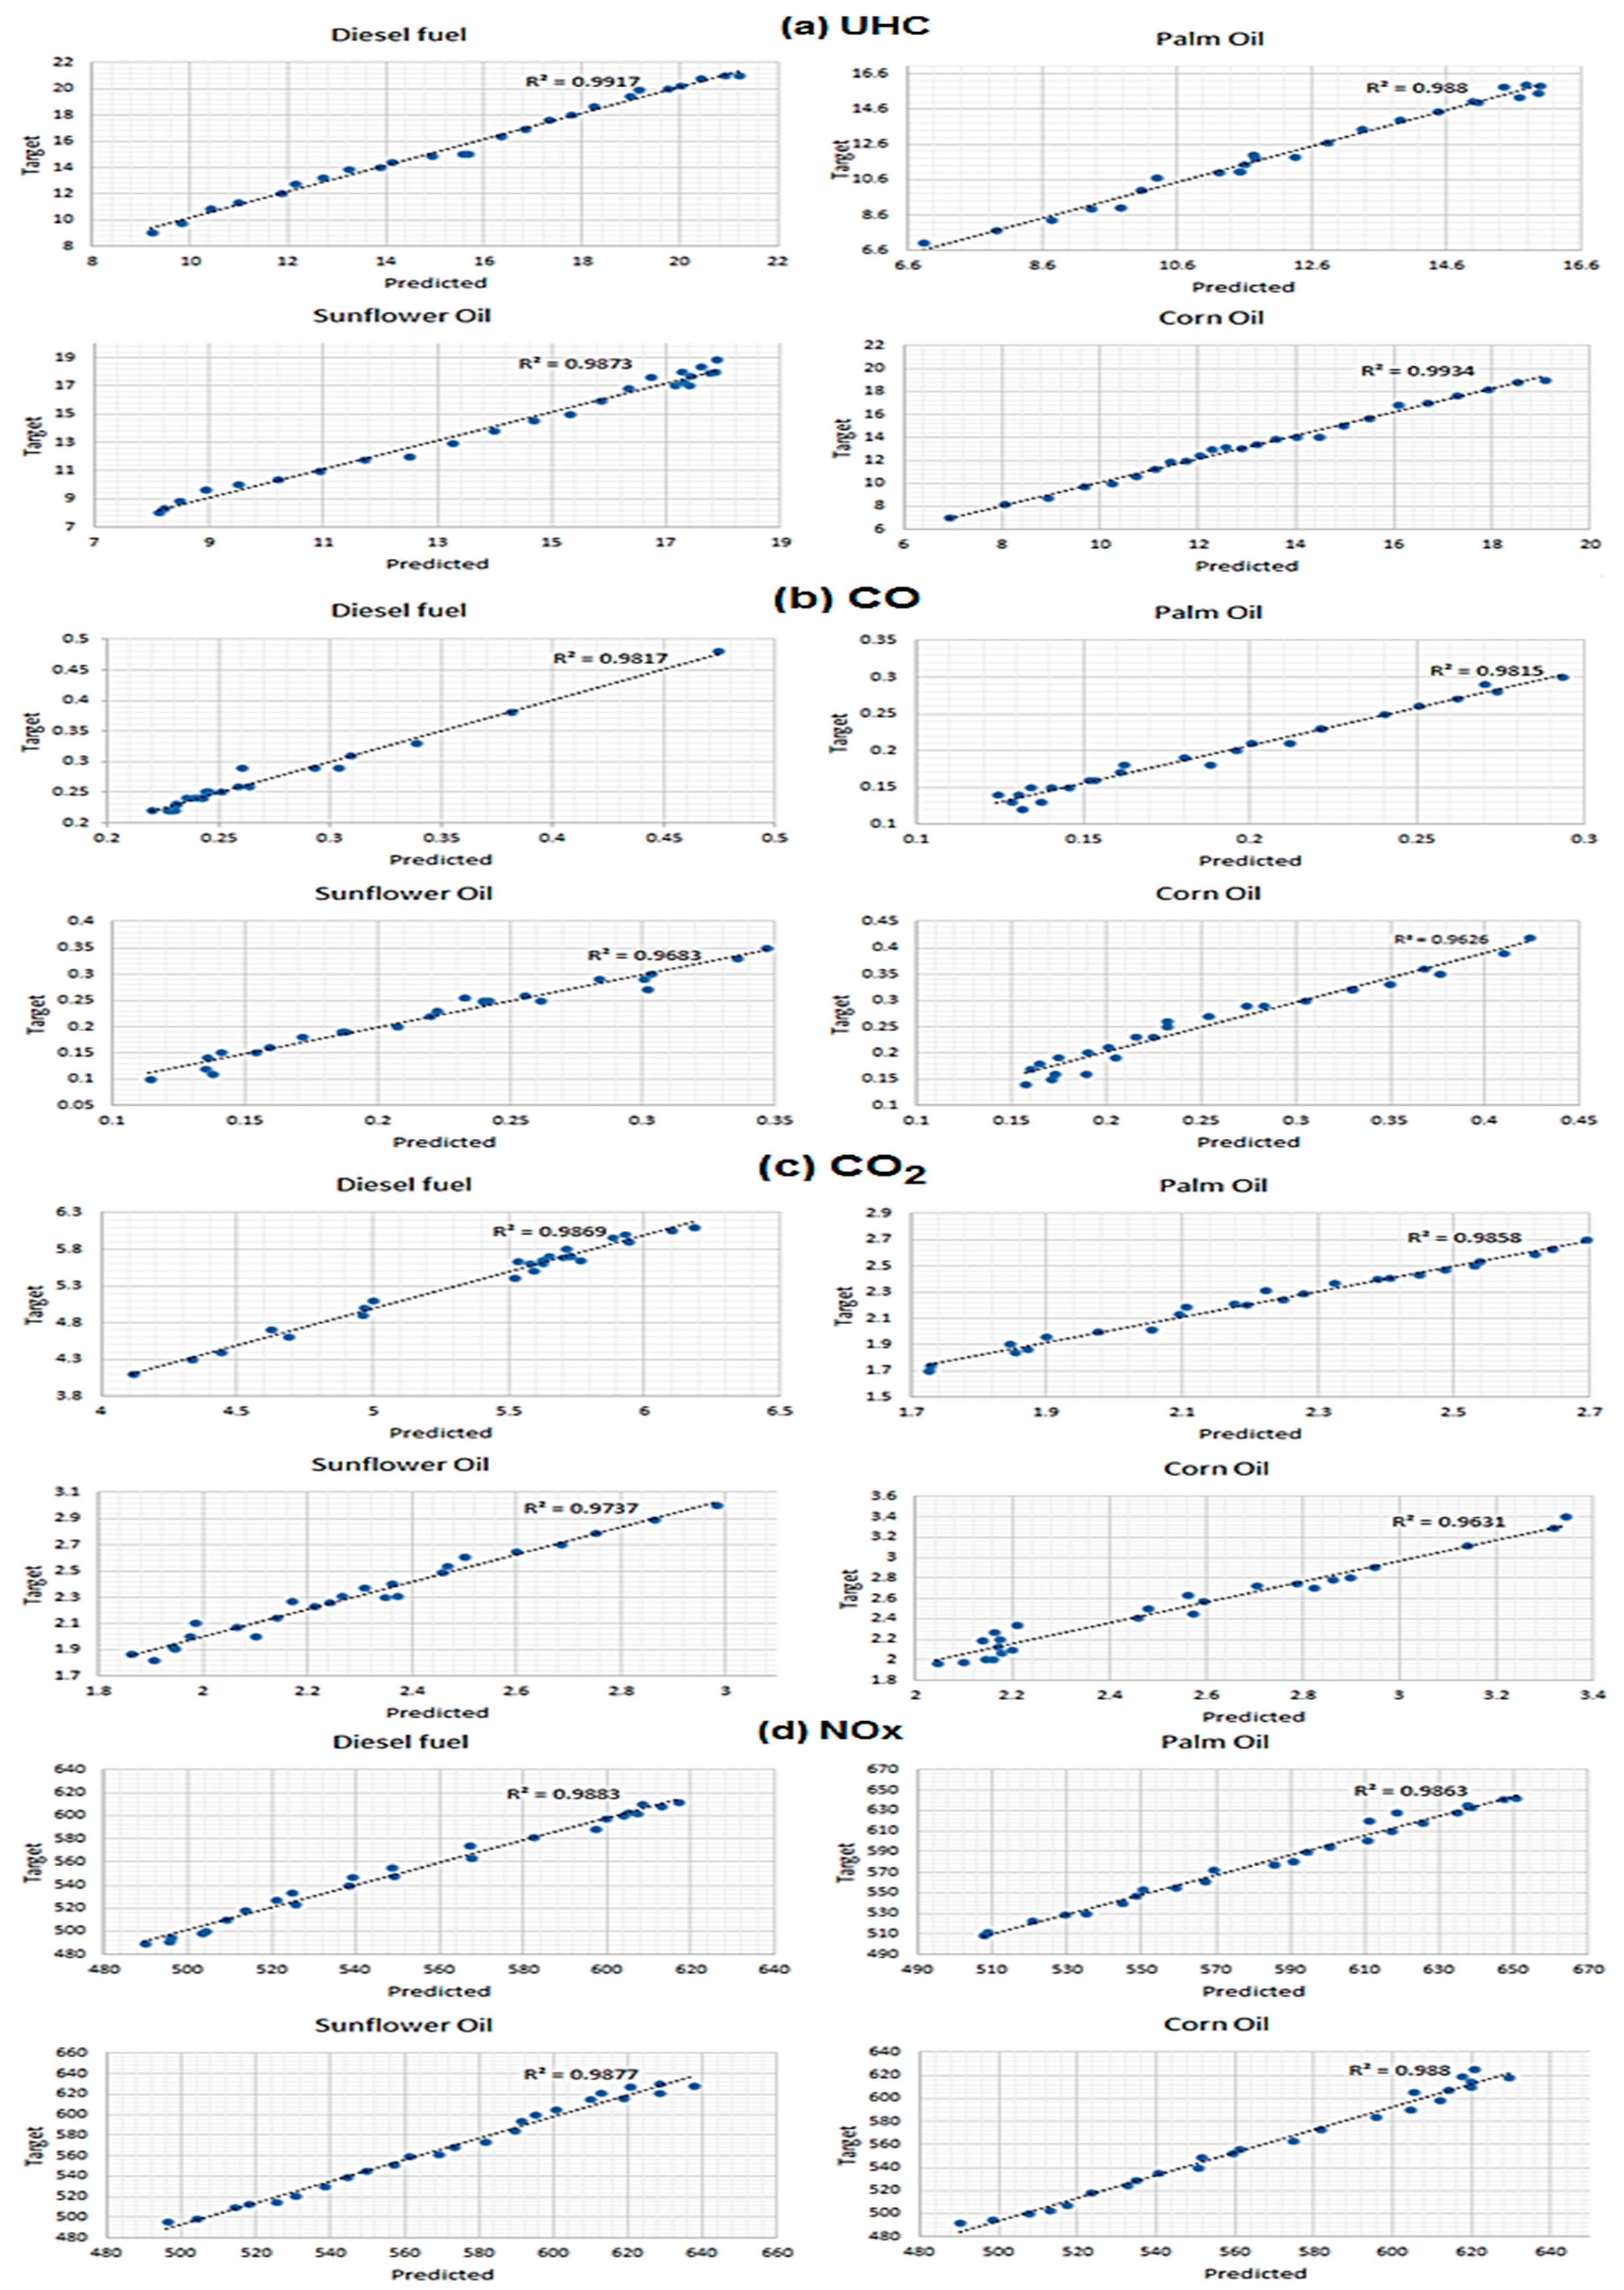
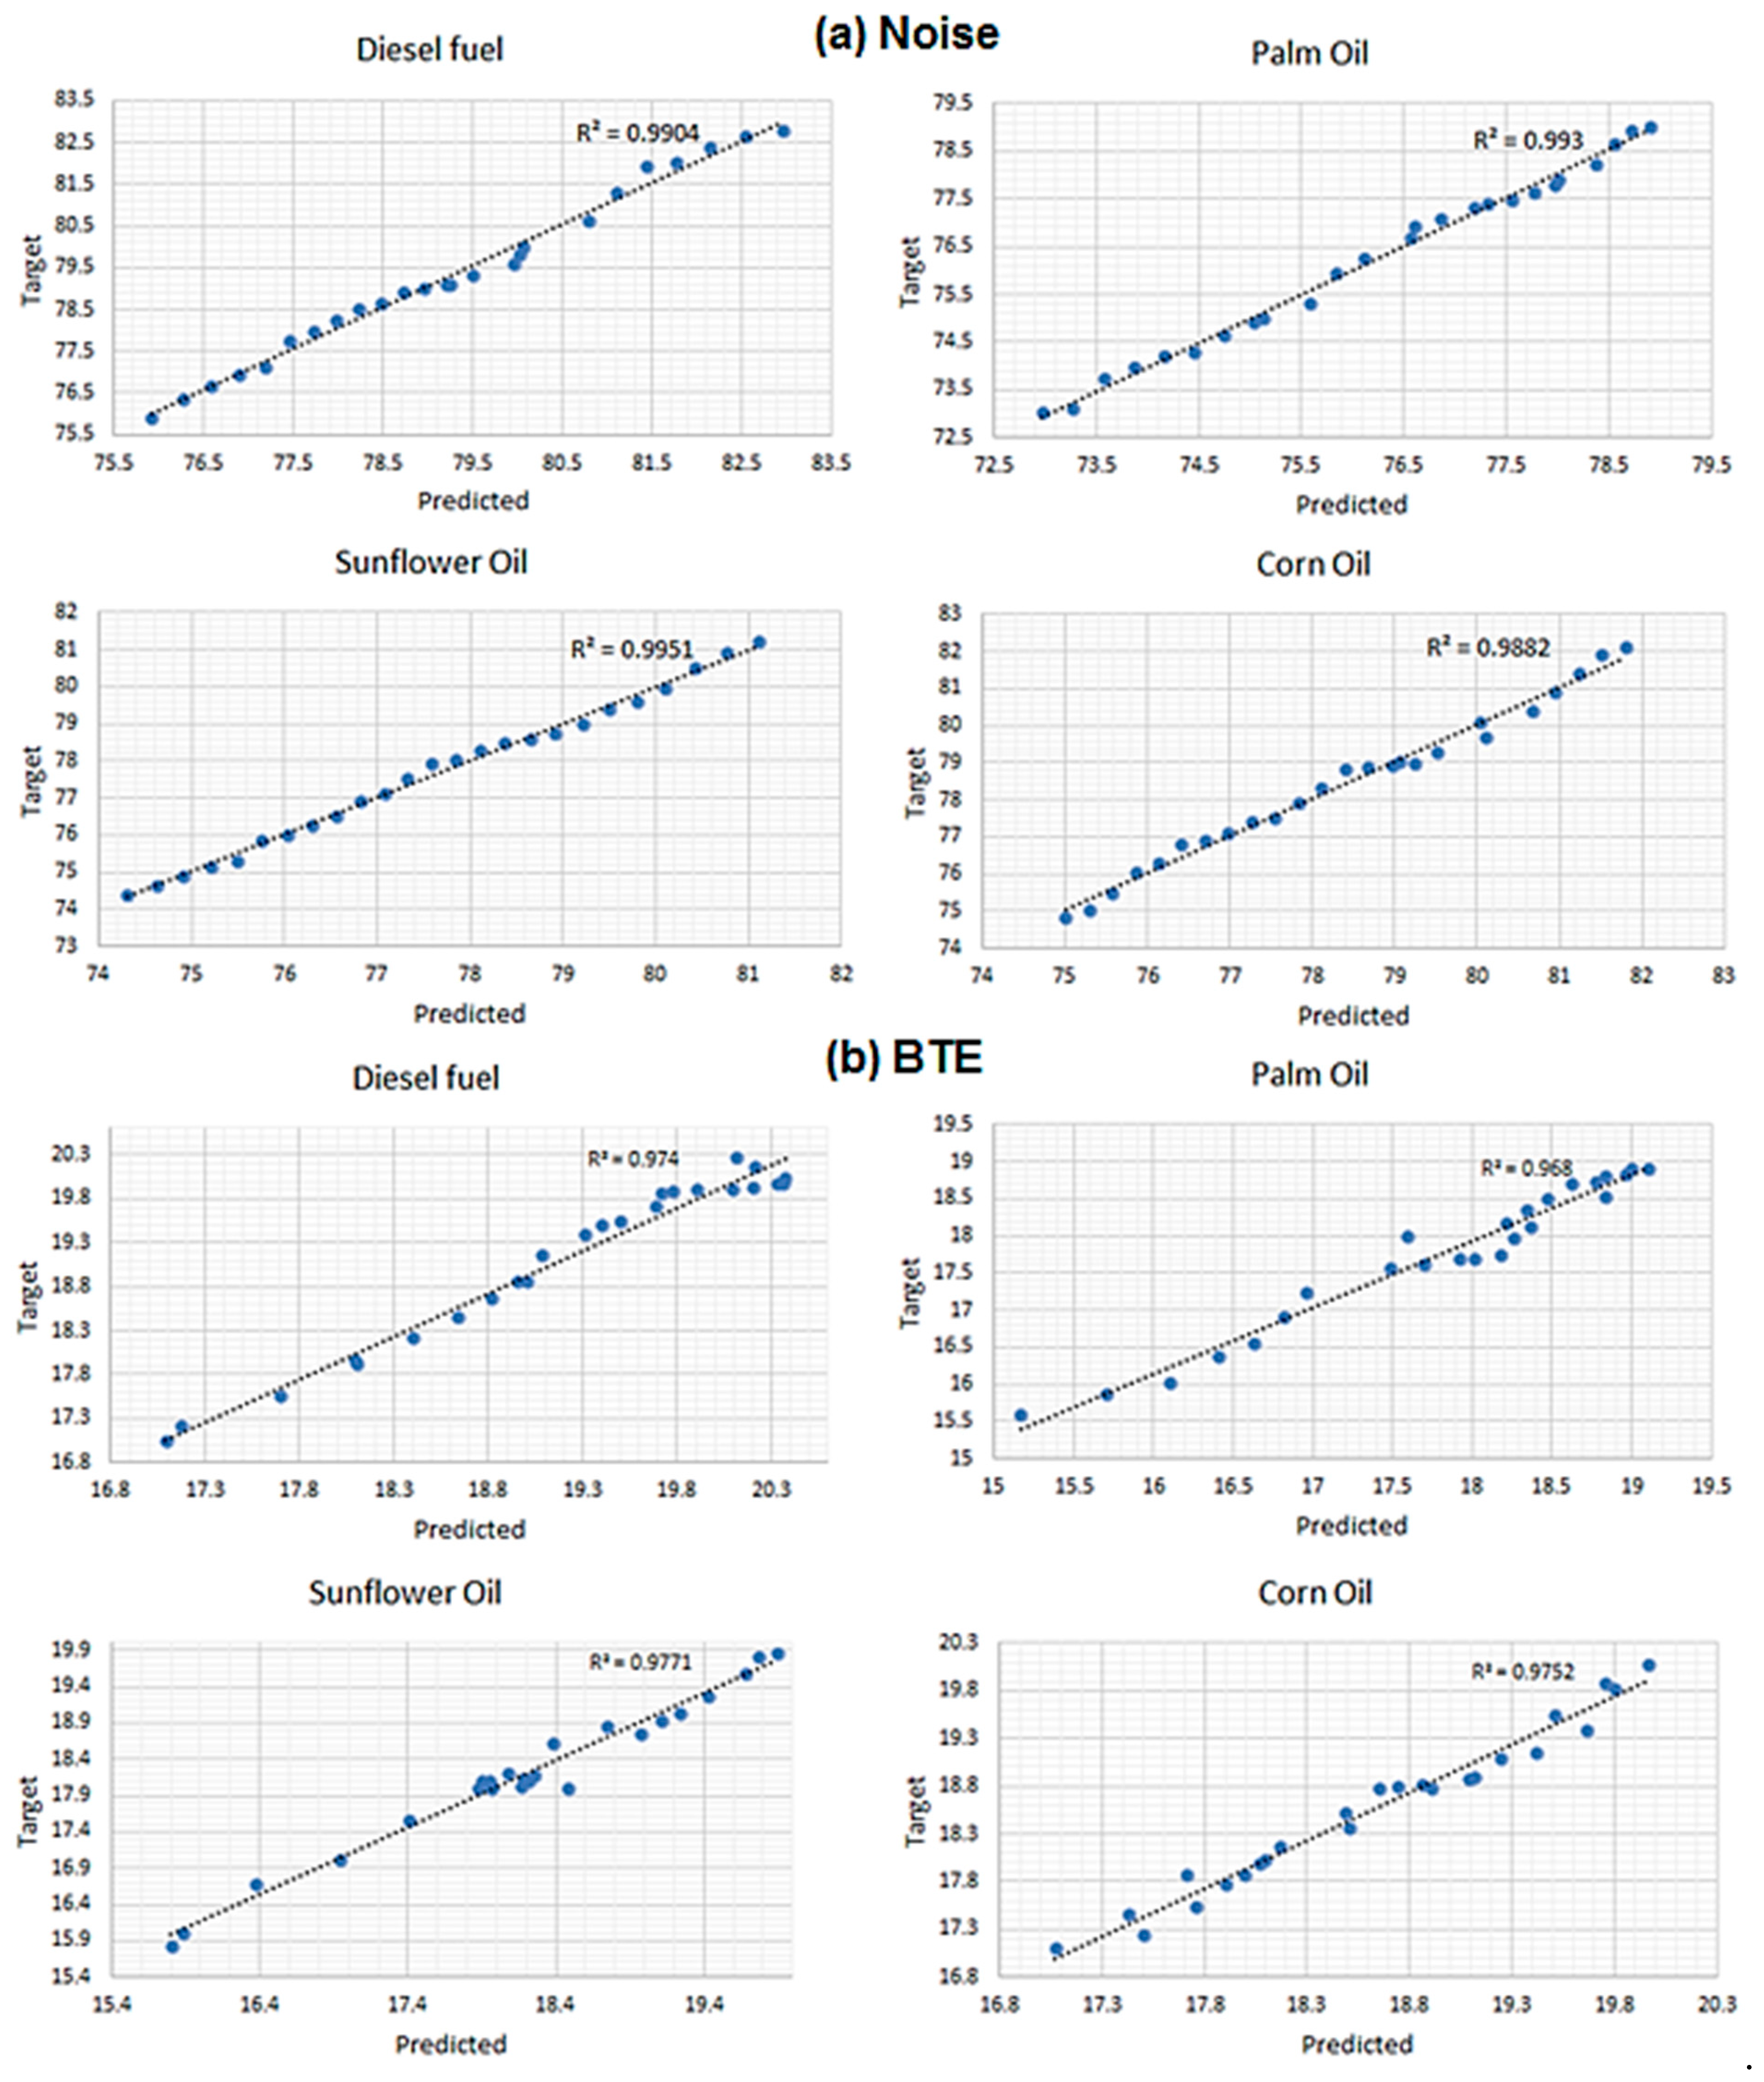
5.4. Polynomial Regression Model

The regression models in this study are generated using experimental data. This approach is anticipated to yield mathematical correlations between variables (engine speed) and responses emissions (UHC, CO2, CO, and NOx), brake thermal efficiency, and noise. As a consequence, regression is utilized to define the relationship between the factors and the response. After that, the GWO approach is used to optimize the response using the generated regression equations, as described in Equation (5).
To verify the accuracy of a polynomial regression model with different types of fuel, three metrics are used: the sum of square error (SSE), root mean square error (RMSE), and coefficient of determination (R2). In other words, R2 is a convenient 0–1 scale that reflects the strength of the relationship between the regression model and the dependent variables, as illustrated in Table 5.
According to the preceding Table 5, the average RMSE values for modeling exhaust emissions, brake thermal efficiency, and noise were 0.01883, 0.02715, and 0.0064, respectively, while the coefficients of determination (R2) were 0.9815, 0.9736, and 0.9917 for modeling exhaust emission, brake thermal efficiency, and noise, respectively.
The graphical representation is necessary for assessing the regression model. As a result, the models’ forecast accuracies were highlighted by graphing the models’ predictions against their associated targets, as illustrated in Figure 12 and Figure 13. Figure 12a–d shows the regression model prediction precision for exhaust emissions. While Figure 13a,b display the regression model prediction precision for noise and brake thermal efficiency respectively. This shows that the regression models accurately match the provided observations.

5.5. Grey Wolf Optimization (GWO)

The tests were carried out on an Intel Core I7-8th generation processor with 16 GB of RAM running Windows 10 64-bit. GWO was utilized to optimize the regression model generated by Python. The third-order model for CO and CO2 emissions was derived using the following equations in order of polynomial regression:
For CO emission (Equation (14)):
22.4412 0.05158   A + 6.923321   B   0.006261   AB   7.713 e 06   A 2 0.9123   B 2 6.657 e 06   A 2 B   + 0.00541   AB 2 3.819 e 10   A 3 + 0.0006923   B 3 .  
For CO2 emission (Equation (15)):
17.4583 0.03489   A 0.1479   B 0.05978   AB + 4.753 e 08   A 2 2.894 e 05   B 2 + 1.057 e 09   A 2 B 2.894 e 05   AB 2 1.057 e 11   A 3 1.643 e 06   B 3 .  
The second-degree of polynomial regression was utilized to compute all the remaining experiments. The NOx emission was estimated as the following equation (Equation (16)):
213.6 + 44.58   A + 0.2280   B 9.260   A 2 0.000032   B 2 + 0.00157   A B
For UHC (Equation (17)):
26.42 4.132   A + 0.00097   B + 0.682   A 2 0.000003   B 2 + 0.000106   A B
For brake thermal efficiency (Equation (18)):
1.57 2.134   A + 0.02456   B + 0.4394   A 2 0.000006   B 2 0.000105   A B
For Noise (Equation (19)):
73.93 5.089   A + 0.00492   B + 0.9575   A 2 + 0.000000   B 2 + 0.000097   A B
Analysis of variance (ANOVA) was also used to evaluate the model’s relevance. Table 6 displays the ANOVA findings at the 95% confidence level. The significance of the calculated regression models in Equations (14)–(19) is determined by the ANOVA results. According to these results, the null hypothesis is rejected if the p-value is less than 0.05, indicating that the regression model is significant and acceptable for optimization.
The contour plots are utilized to visualize the search spaces of the optimization process for the combinations of the factors and responses, as depicted in Figure 14.
Table 7 indicates the optimal value (minimization of emissions and noise with a maximum of brake thermal efficiency) for each fuel type for a given engine speed. According to the results, the lowest CO emission was 0.1135% when using sunflower biodiesel at engine speed 1787 rpm. In terms of CO2 emissions, the lowest was 1.6353% at engine speed 1576 rpm when palm biodiesel was utilized. When using corn biodiesel at 1200 rpm engine rpm, the lowest NOx emission was 492 ppm. At engine speeds of 1200 rpm, palm and corn oil biodiesels produced the lowest UHC emission, which was 7 ppm. The palm biodiesel produced the least noise and the highest brake thermal efficiency, which are 73 dB(A) at engine speed 1200 rpm and 20.3107% at engine speed 2183 rpm, respectively.
Table 8 presents weights for the responses that are used in the optimization process to find the optimum value (performance, emission, and noise) for each type of fuel. Because the engine efficiency is a critical and important metric, it was given the greatest weight of 0.3. Next, the most dangerous exhaust gases from diesel engines (NOx and CO) were given the weight of 0.2, and, finally, other emissions (HC and noise) received the lowest weight of 0.1.
Table 9 shows the optimum engine speed for various fuel types in order to reduce emissions and noise while maximizing thermal efficiency. The diesel has the second greatest thermal efficiency of 19.7993% at an engine speed of 1862 rpm. In comparison to the other fuel types, diesel has the greatest engine noise and the highest exhaust emission levels. At an engine speed of 1612 rpm, sunflower oil has the maximum thermal efficiency and the lowest NOx emissions. Palm biodiesel produced the lowest UHC, CO, and CO2 emissions and noise at engine speed 1743 rpm.
Table 10 summarizes the percentage reduction in exhaust and noise emission and improvement in BTE for biodiesel fuel after the applied optimization process compared to pure diesel fuel at the optimum engine speed. According to the data obtained after applying the optimization process, the optimum engine speed for each type of biodiesel fuel is reduced by 6.39% and 13.43% for palm and sunflower biodiesel, respectively, and an increased by 0.27% for corn biodiesel when compared to pure diesel, as shown in Table 9 and Table 10. When compared to pure diesel, palm biodiesel shows the highest reduction in CO, CO2, UHC, and noise by 49.46%, 64.7%, 23.61%, and 3.66%, respectively. Sunflower has the highest NOx reduction of 1.65% and the highest BTE improvement of 0.35%. Corn biodiesel shows the lowest reduction of CO and CO2 compared to other biodiesel fuels used by 37.79% and 56.09%, respectively. Palm and corn biodiesel fuel show an increase in NOx by 3.94% and 1.42%, respectively.

6. Conclusions

The effects of several biodiesel blends, such as corn, sunflower, and palm biodiesel, on the engine exhaust and noise emissions of a compression ignition engine were investigated experimentally. The emissions of CO, CO2, NOx, UHC, and noise were minimized and the BTE was maximized using a combination of polynomial regression (PR) model with GWO through the computing of the optimum input variables in terms of engine speed and biodiesel fuel types. The following are the most important outcomes based on the experimental observations and modeling optimization findings: (i) palm biodiesel had the highest reduction of CO, CO2, UHC, and noise by 49.46%, 64.7%, 23.61%, and 48.63%, respectively, when compared to the optimum values of pure diesel; (ii) according to the optimization results, the sunflower oil had the highest BTE and the lowest NOx emissions at the engine speed of 1612 rpm. Palm biodiesel generated the lowest UHC, CO, and CO2 emissions, as well as the least noise, at an engine speed of 1743 rpm; (iii) for all the tested fuels, the variations among the SPL values were very low at low-frequency range, and they became noticeable at high-frequency ranges; (iv) the regression model and GWO algorithm showed good agreement with realistic experiment results. Furthermore, GWO provided an optimized value with improved exploration capabilities and a reasonable computation time; (iv) regression modeling enabled us to formulate an empirical relationship, allowing the construction of mathematical models that allowed us to use the GWO method to address the optimization/minimization problem target. The objective of optimization was to reduce exhaust emissions and noise while increasing brake thermal efficiency; (v) finally, when the results of the integrated polynomial regression model with the minimization/maximization of the target using the GWO strategy were compared to the experimental data, it is obvious that the prediction errors are frequently less than 1%.
Particulate matter (PM) is one of the principal pollutants produced by diesel engines, and it has a negative influence on human health. As a result, future research will focus on the optimization of different types of biodiesel blends for simultaneous control of PM and NOx emissions in diesel engines, which will be thoroughly examined in various conditions and strategies utilized to restrict PM emissions.

Author Contributions

Conceptualization, A.A. and H.A.; methodology, A.A., H.A. and H.R.; software, H.A.; validation, A.A. and A.H.; formal analysis, A.A. and H.A.; investigation, A.A., H.A. and A.H.; resources, A.A., H.A. and H.R.; data curation, A.A. and H.A.; writing—original draft preparation A.A. and H.A.; writing—review and editing, A.A. and H.R.; visualization, A.A., H.A. and A.H.; supervision, A.A. and H.R.; project administration, A.A.; funding acquisition, A.H. All authors have read and agreed to the published version of the manuscript.

Funding

This research received no external funding.

Institutional Review Board Statement

Not applicable.

Informed Consent Statement

Not applicable.

Data Availability Statement

Not applicable.

Conflicts of Interest

The authors declare no conflict of interest.

Nomenclature

aencircling coefficientLSleast-squares
A , C coefficient vectorsNrotation engine speed
ABDCafter bottom dead centernpolynomial degree
ANNartificial neural networkNaOHsodium hydroxide
ANOVAanalysis of varianceNOxnitrogen oxides
ATDCafter top dead centerOPMEolive pomace oil methyl esters
BBDBox–Behnken approach designPrmsroot mean square value of the pressure
BBDCbefore bottom dead centerPMparticulate matter
BPbrake powerPMEpalm oil methyl esters
BSFCbrake specific fuel consumptionPPCpartially premixed combustion
BTbrake torquePRpolynomial regression
BTDCbefore top dead centerPSOparticle swarm optimization
BTEbrake thermal efficiencyPrefreference pressure value of 20 μPa
CAcrank angleP(t)pressure value at a specific time t
CH3NaOsodium methoxideP2(t)time averaged pressure over T
CH3OHmethanolr1, r2random vectors
CIcompression ignitionRcorrelation coefficient
COcarbon monoxideR2coefficient of determination
CO2carbon dioxideRMSroot mean square
dfuel typeRMSEroot mean square error
DCdirect currentrpmrevolution per minute
Dfdegree of freedomRSMresponse surface methodology
Dwolf’s positionSLsound level
Eexhaust emissionSPLsound pressure level
EGRexhaust gas recirculationSSEsum of square error
FFTfast Fourier transformSVMsupport-vector machines
fglobal best positionTtotal interval of time
GAgenetic algorithmtcurrent iteration
GWOgrey wolf optimizationTiO2titanium oxide
HChydrocarbonTmaxtotal number of iterations
IintensityUHCunburned hydrocarbon
I0reference intensity equal 10−12 W/m2 @ frequency of 1000 Hzxindependent variable
IDIindirect injection X vector position of the grey wolf
jcurrent grey wolves’ number X P vector prey position
kiteration numberYdependent variable
LCAlife cycle assessmentα, β and Δthree temporarily optimal solutions
LPlevels of the sound pressure in dB β regression coefficients

References

  1. Borowski, G.; Alsaqoor, S.; Alahmer, A. Using Agglomeration Techniques for Coal and Ash Waste Management in the Circular Economy. Adv. Sci. Technol. Res. J. 2021, 15, 264–276. [Google Scholar] [CrossRef]
  2. Alahmer, A. Thermal Analysis of a Direct Evaporative Cooling System Enhancement with Desiccant Dehumidification for Vehicular Air Conditioning. Appl. Therm. Eng. 2016, 98, 1273–1285. [Google Scholar] [CrossRef]
  3. Al-Dabbas, M.; Alahmer, A.; Mamkagh, A.; Gomaa, M.R. Productivity Enhancement of the Solar Still by Using Water Cooled Finned Condensing Pipe. Desalination Water Treat. 2021, 213, 35–43. [Google Scholar] [CrossRef]
  4. Zacharczuk, W.; Andruszkiewicz, A.; Tatarek, A.; Alahmer, A.; Alsaqoor, S. Effect of Ca-Based Additives on the Capture of SO2 during Combustion of Pulverized Lignite. Energy 2021, 231, 120988. [Google Scholar] [CrossRef]
  5. Aladayleh, W.; Alahmer, A. Recovery of Exhaust Waste Heat for ICE Using the Beta Type Stirling Engine. J. Energy 2015, 2015, 495418. [Google Scholar] [CrossRef] [Green Version]
  6. Alahmer, A. Performance and Emission Assessments for Different Acetone Gasoline Blends Powered Spark Ignition Engine. Int. J. Veh. Struct. Syst. 2018, 10, 127–132. [Google Scholar] [CrossRef]
  7. Ianniello, R.; Belgiorno, G.; Di Luca, G.; Beatrice, C.; Di Blasio, G. Ethanol in Dual-Fuel and Blend Fueling Modes for Advanced Combustion in Compression Ignition Engines. In Alcohol as an Alternative Fuel for Internal Combustion Engines; Springer: Berlin/Heidelberg, Germany, 2021; pp. 5–27. [Google Scholar]
  8. Shamun, S.; Belgiorno, G.; Di Blasio, G. Engine Parameters Assessment for Alcohols Fuels Application in Compression Ignition Engines. In Alternative Fuels and Their Utilization Strategies in Internal Combustion Engines; Springer: Berlin/Heidelberg, Germany, 2020; pp. 125–139. [Google Scholar]
  9. Belgiorno, G.; Boscolo, A.; Dileo, G.; Numidi, F.; Pesce, F.C.; Vassallo, A.; Ianniello, R.; Beatrice, C.; Di Blasio, G. Experimental Study of Additive-Manufacturing-Enabled Innovative Diesel Combustion Bowl Features for Achieving Ultra-Low Emissions and High Efficiency. SAE Int. J. Adv. Curr. Pract. Mobil. 2020, 3, 672–684. [Google Scholar] [CrossRef]
  10. Di Blasio, G.; Beatrice, C.; Ianniello, R.; Pesce, F.C.; Vassallo, A.; Belgiorno, G.; Avolio, G. Balancing Hydraulic Flow and Fuel Injection Parameters for Low-Emission and High-Efficiency Automotive Diesel Engines. SAE Int. J. Adv. Curr. Pract. Mobil. 2019, 2, 638–652. [Google Scholar]
  11. Dimitrakopoulos, N.; Belgiorno, G.; Tunér, M.; Tunestål, P.; Di Blasio, G. Effect of EGR Routing on Efficiency and Emissions of a PPC Engine. Appl. Therm. Eng. 2019, 152, 742–750. [Google Scholar] [CrossRef]
  12. Khalid, A.; Tajuddin, A.S.A.; Jaat, N.; Manshoor, B.; Zaman, I.; Hadi, S.A.A.; Nursal, R.S. Performance and Emissions of Diesel Engine Fuelled with Preheated Biodiesel Fuel Derived from Crude Palm, Jatropha, and Waste Cooking Oils. Int. J. Automot. Mech. Eng. 2017, 14, 4273–4284. [Google Scholar] [CrossRef]
  13. Abed, K.A.; Gad, M.S.; El Morsi, A.K.; Sayed, M.M.; Elyazeed, S.A. Effect of Biodiesel Fuels on Diesel Engine Emissions. Egypt. J. Pet. 2019, 28, 183–188. [Google Scholar] [CrossRef]
  14. Kalligeros, S.; Zannikos, F.; Stournas, S.; Lois, E.; Anastopoulos, G.; Teas, C.; Sakellaropoulos, F. An Investigation of Using Biodiesel/Marine Diesel Blends on the Performance of a Stationary Diesel Engine. Biomass Bioenergy 2003, 24, 141–149. [Google Scholar] [CrossRef]
  15. Masum, B.M.; Masjuki, H.H.; Kalam, M.A.; Fattah, I.M.R.; Palash, S.M.; Abedin, M.J. Effect of Ethanol–Gasoline Blend on NOx Emission in SI Engine. Renew. Sustain. Energy Rev. 2013, 24, 209–222. [Google Scholar] [CrossRef]
  16. Sanjid, A.; Masjuki, H.H.; Kalam, M.A.; Rahman, S.M.A.; Abedin, M.J.; Palash, S.M. Production of Palm and Jatropha Based Biodiesel and Investigation of Palm-Jatropha Combined Blend Properties, Performance, Exhaust Emission and Noise in an Unmodified Diesel Engine. J. Clean. Prod. 2014, 65, 295–303. [Google Scholar] [CrossRef]
  17. Sanjid, A.; Masjuki, H.H.; Kalam, M.A.; Abedin, M.J.; Rahman, S.M.A. Experimental Investigation of Mustard Biodiesel Blend Properties, Performance, Exhaust Emission and Noise in an Unmodified Diesel Engine. APCBEE Procedia 2014, 10, 149–153. [Google Scholar] [CrossRef] [Green Version]
  18. Ndayishimiye, P.; Tazerout, M. Use of Palm Oil-Based Biofuel in the Internal Combustion Engines: Performance and Emissions Characteristics. Energy 2011, 36, 1790–1796. [Google Scholar] [CrossRef]
  19. Rakopoulos, C.D.; Dimaratos, A.M.; Giakoumis, E.G.; Rakopoulos, D.C. Study of Turbocharged Diesel Engine Operation, Pollutant Emissions and Combustion Noise Radiation during Starting with Bio-Diesel or n-Butanol Diesel Fuel Blends. Appl. Energy 2011, 88, 3905–3916. [Google Scholar] [CrossRef]
  20. Uludamar, E.; Yıldızhan, Ş.; Aydın, K.; Özcanlı, M. Vibration, Noise and Exhaust Emissions Analyses of an Unmodified Compression Ignition Engine Fuelled with Low Sulphur Diesel and Biodiesel Blends with Hydrogen Addition. Int. J. Hydrog. Energy 2016, 41, 11481–11490. [Google Scholar] [CrossRef]
  21. Patel, C.; Agarwal, A.K.; Tiwari, N.; Lee, S.; Lee, C.S.; Park, S. Combustion, Noise, Vibrations and Spray Characterization for Karanja Biodiesel Fuelled Engine. Appl. Therm. Eng. 2016, 106, 506–517. [Google Scholar] [CrossRef]
  22. Yuvarajan, D.; Babu, M.D.; BeemKumar, N.; Kishore, P.A. Experimental Investigation on the Influence of Titanium Dioxide Nanofluid on Emission Pattern of Biodiesel in a Diesel Engine. Atmos. Pollut. Res. 2018, 9, 47–52. [Google Scholar] [CrossRef]
  23. Giakoumis, E.G.; Rakopoulos, D.C.; Rakopoulos, C.D. Combustion Noise Radiation during Dynamic Diesel Engine Operation Including Effects of Various Biofuel Blends: A Review. Renew. Sustain. Energy Rev. 2016, 54, 1099–1113. [Google Scholar] [CrossRef]
  24. Wang, S.; Chalu, C.; Duclaux, N.; Paquien, M. Noise Optimization of Diesel Engines with New Combustion Systems. SAE Int. J. Passeng. Cars Mech. Syst. 2009, 2, 1387–1395. [Google Scholar] [CrossRef]
  25. Patel, C.; Lee, S.; Tiwari, N.; Agarwal, A.K.; Lee, C.S.; Park, S. Spray Characterization, Combustion, Noise and Vibrations Investigations of Jatropha Biodiesel Fuelled Genset Engine. Fuel 2016, 185, 410–420. [Google Scholar] [CrossRef]
  26. Adaileh, W.; Alahmer, A. Reduction of the Spark Ignition Engine Emissions Using Limestone Filter. Can. J. Pure Appl. Sci. 2014, 8, 2761–2767. [Google Scholar]
  27. Alsaqoor, S.; Alahmer, A.; Aljabarin, N.; Gougazeh, M.; Czajczynska, D.; Krzyzynska, R. Effects of Utilization of Solid and Semi-Solid Organic Waste Using Pyrolysis Techniques. In Proceedings of the 2017 8th International Renewable Energy Congress (IREC), Amman, Jordan, 21–23 March 2017; IEEE: Piscataway, NJ, USA, 2017; pp. 1–5. [Google Scholar] [CrossRef]
  28. Redel-Macías, M.D.; Pinzi, S.; Ruz, M.F.; Cubero-Atienza, A.J.; Dorado, M.P. Biodiesel from Saturated and Monounsaturated Fatty Acid Methyl Esters and Their Influence over Noise and Air Pollution. Fuel 2012, 97, 751–756. [Google Scholar] [CrossRef]
  29. Aydın, F. The Impacts of Diesel and Canola Biodiesel Fuels on Noise Emission on Diesel Engines. Int. J. Automot. Eng. Technol. 2019, 8, 134–139. [Google Scholar] [CrossRef]
  30. Torregrosa, A.J.; Broatch, A.; Plá, B.; Mónico, L.F. Impact of Fischer–Tropsch and Biodiesel Fuels on Trade-Offs between Pollutant Emissions and Combustion Noise in Diesel Engines. Biomass Bioenergy 2013, 52, 22–33. [Google Scholar] [CrossRef] [Green Version]
  31. Bunce, M.; Snyder, D.; Adi, G.; Hall, C.; Koehler, J.; Davila, B.; Kumar, S.; Garimella, P.; Stanton, D.; Shaver, G. Optimization of Soy-Biodiesel Combustion in a Modern Diesel Engine. Fuel 2011, 90, 2560–2570. [Google Scholar] [CrossRef]
  32. How, H.G.; Masjuki, H.H.; Kalam, M.A.; Teoh, Y.H. An Investigation of the Engine Performance, Emissions and Combustion Characteristics of Coconut Biodiesel in a High-Pressure Common-Rail Diesel Engine. Energy 2014, 69, 749–759. [Google Scholar] [CrossRef]
  33. Torregrosa, A.J.; Broatch, A.; García, A.; Mónico, L.F. Sensitivity of Combustion Noise and NOx and Soot Emissions to Pilot Injection in PCCI Diesel Engines. Appl. Energy 2013, 104, 149–157. [Google Scholar] [CrossRef] [Green Version]
  34. Ahmed, S.; Hassan, M.H.; Kalam, M.A.; Rahman, S.M.A.; Abedin, M.J.; Shahir, A. An Experimental Investigation of Biodiesel Production, Characterization, Engine Performance, Emission and Noise of Brassica Juncea Methyl Ester and Its Blends. J. Clean. Prod. 2014, 79, 74–81. [Google Scholar] [CrossRef]
  35. Nguyen, T.A.; Mikami, M. Effect of Hydrogen Addition to Intake Air on Combustion Noise from a Diesel Engine. Int. J. Hydrog. Energy 2013, 38, 4153–4162. [Google Scholar] [CrossRef]
  36. Jafarmadar, S.; Khalilaria, S.; Saraee, H.S. Prediction of the Performance and Exhaust Emissions of a Compression Ignition Engine Using a Wavelet Neural Network with a Stochastic Gradient Algorithm. Energy 2018, 142, 1128–1138. [Google Scholar]
  37. Alahmer, A.; Ajib, S. Solar Cooling Technologies: State of Art and Perspectives. Energy Convers. Manag. 2020, 214, 112896. [Google Scholar] [CrossRef]
  38. Ajib, S.; Alahmer, A. Solar Cooling Technologies. In Energy Conversion-Current Technologies and Future Trends; IntechOpen: London, UK, 2018. [Google Scholar]
  39. Kumar, S.; Jain, S.; Kumar, H. Process Parameter Assessment of Biodiesel Production from a Jatropha–Algae Oil Blend by Response Surface Methodology and Artificial Neural Network. Energy Sources Part A Recovery Util. Environ. Eff. 2017, 39, 2119–2125. [Google Scholar] [CrossRef]
  40. Adam, I.K.; Aziz, A.R.A.; Yusup, S.; Heikal, M.; Hagos, F.Y. Optimization of Performance and Emissions of a Diesel Engine Fuelled with Rubber Seed-Palm Biodiesel Blends Using Response Surface Method. Asian J. Appl. Sci. 2016, 4, 401–421. [Google Scholar]
  41. Xu, H.; Yin, B.; Liu, S.; Jia, H. Performance Optimization of Diesel Engine Fueled with Diesel-Jatropha Curcas Biodiesel Blend Using Response Surface Methodology. J. Mech. Sci. Technol. 2017, 31, 4051–4059. [Google Scholar] [CrossRef]
  42. Bhowmik, S.; Paul, A.; Panua, R.; Ghosh, S.K.; Debroy, D. Performance-Exhaust Emission Prediction of Diesosenol Fueled Diesel Engine: An ANN Coupled MORSM Based Optimization. Energy 2018, 153, 212–222. [Google Scholar] [CrossRef]
  43. Yilmaz, N.; Ileri, E.; Atmanlı, A.; Deniz Karaoglan, A.; Okkan, U.; Sureyya Kocak, M. Predicting the Engine Performance and Exhaust Emissions of a Diesel Engine Fueled with Hazelnut Oil Methyl Ester: The Performance Comparison of Response Surface Methodology and LSSVM. J. Energy Resour. Technol. 2016, 138, 052206. [Google Scholar] [CrossRef]
  44. Dey, S.; Reang, N.M.; Majumder, A.; Deb, M.; Das, P.K. A Hybrid ANN-Fuzzy Approach for Optimization of Engine Operating Parameters of a CI Engine Fueled with Diesel-Palm Biodiesel-Ethanol Blend. Energy 2020, 202, 117813. [Google Scholar] [CrossRef]
  45. Tosun, E.; Aydin, K.; Bilgili, M. Comparison of Linear Regression and Artificial Neural Network Model of a Diesel Engine Fueled with Biodiesel-Alcohol Mixtures. Alex. Eng. J. 2016, 55, 3081–3089. [Google Scholar] [CrossRef] [Green Version]
  46. Uslu, S. Optimization of Diesel Engine Operating Parameters Fueled with Palm Oil-Diesel Blend: Comparative Evaluation between Response Surface Methodology (RSM) and Artificial Neural Network (ANN). Fuel 2020, 276, 117990. [Google Scholar] [CrossRef]
  47. Yıldırım, S.; Tosun, E.; Çalık, A.; Uluocak, İ.; Avşar, E. Artificial Intelligence Techniques for the Vibration, Noise, and Emission Characteristics of a Hydrogen-Enriched Diesel Engine. Energy Sources Part A Recovery Util. Environ. Eff. 2019, 41, 2194–2206. [Google Scholar] [CrossRef]
  48. Najafi, B.; Faizollahzadeh Ardabili, S.; Mosavi, A.; Shamshirband, S.; Rabczuk, T. An Intelligent Artificial Neural Network-Response Surface Methodology Method for Accessing the Optimum Biodiesel and Diesel Fuel Blending Conditions in a Diesel Engine from the Viewpoint of Exergy and Energy Analysis. Energies 2018, 11, 860. [Google Scholar] [CrossRef] [Green Version]
  49. Saqib, M.; Mumtaz, M.W.; Mahmood, A.; Abdullah, M.I. Optimized Biodiesel Production and Environmental Assessment of Produced Biodiesel. Biotechnol. Bioprocess Eng. 2012, 17, 617–623. [Google Scholar] [CrossRef]
  50. Samuel, O.D.; Okwu, M.O.; Oyejide, O.J.; Taghinezhad, E.; Afzal, A.; Kaveh, M. Optimizing Biodiesel Production from Abundant Waste Oils through Empirical Method and Grey Wolf Optimizer. Fuel 2020, 281, 118701. [Google Scholar] [CrossRef]
  51. Gujarathi, P.K.; Shah, V.A.; Lokhande, M.M. Grey Wolf Algorithm for Multidimensional Engine Optimization of Converted Plug-in Hybrid Electric Vehicle. Transp. Res. Part D Transp. Environ. 2018, 63, 632–648. [Google Scholar] [CrossRef]
  52. Ileri, E.; Karaoglan, A.D.; Akpinar, S. Optimizing Cetane Improver Concentration in Biodiesel-Diesel Blend via Grey Wolf Optimizer Algorithm. Fuel 2020, 273, 117784. [Google Scholar] [CrossRef]
  53. Luo, K. Enhanced Grey Wolf Optimizer with a Model for Dynamically Estimating the Location of the Prey. Appl. Soft Comput. 2019, 77, 225–235. [Google Scholar] [CrossRef]
  54. Vijay, R.K.; Nanda, S.J. A Quantum Grey Wolf Optimizer Based Declustering Model for Analysis of Earthquake Catalogs in an Ergodic Framework. J. Comput. Sci. 2019, 36, 101019. [Google Scholar] [CrossRef]
  55. Faris, H.; Aljarah, I.; Al-Betar, M.A.; Mirjalili, S. Grey Wolf Optimizer: A Review of Recent Variants and Applications. Neural Comput. Appl. 2018, 30, 413–435. [Google Scholar] [CrossRef]
  56. Mirjalili, S.; Mirjalili, S.M.; Lewis, A. Grey Wolf Optimizer. Adv. Eng. Softw. 2014, 69, 46–61. [Google Scholar] [CrossRef] [Green Version]
  57. Mohanty, S.; Subudhi, B.; Ray, P.K. A New MPPT Design Using Grey Wolf Optimization Technique for Photovoltaic System under Partial Shading Conditions. IEEE Trans. Sustain. Energy 2015, 7, 181–188. [Google Scholar] [CrossRef]
  58. Giakoumis, E.G.; Sarakatsanis, C.K. A Comparative Assessment of Biodiesel Cetane Number Predictive Correlations Based on Fatty Acid Composition. Energies 2019, 12, 422. [Google Scholar] [CrossRef] [Green Version]
  59. Zahan, K.A.; Kano, M. Biodiesel Production from Palm Oil, Its by-Products, and Mill Effluent: A Review. Energies 2018, 11, 2132. [Google Scholar] [CrossRef] [Green Version]
  60. Ito, T.; Sakurai, Y.; Kakuta, Y.; Sugano, M.; Hirano, K. Biodiesel Production from Waste Animal Fats Using Pyrolysis Method. Fuel Process. Technol. 2012, 94, 47–52. [Google Scholar] [CrossRef]
  61. Alptekin, E.; Canakci, M.; Sanli, H. Biodiesel Production from Vegetable Oil and Waste Animal Fats in a Pilot Plant. Waste Manag. 2014, 34, 2146–2154. [Google Scholar] [CrossRef]
  62. Bies, D.A.; Hansen, C.; Howard, C. Engineering Noise Control; CRC Press: Boca Raton, FL, USA, 2017. [Google Scholar]
  63. Mirjalili, S.; Saremi, S.; Mirjalili, S.M.; Coelho, L.d.S. Multi-Objective Grey Wolf Optimizer: A Novel Algorithm for Multi-Criterion Optimization. Expert Syst. Appl. 2016, 47, 106–119. [Google Scholar] [CrossRef]
  64. Naserbegi, A.; Aghaie, M.; Zolfaghari, A. Implementation of Grey Wolf Optimization (GWO) Algorithm to Multi-Objective Loading Pattern Optimization of a PWR Reactor. Ann. Nucl. Energy 2020, 148, 107703. [Google Scholar] [CrossRef]
  65. Liu, H.-P.; Strank, S.; Werst, M.; Hebner, R.; Osara, J. Combustion Emissions Modeling and Testing of Neat Biodiesel Fuels. Energy Sustain. 2010, 43949, 131–140. [Google Scholar]
  66. Masharuddin, S.M.S.; Karim, Z.A.A.; Said, M.A.M.; Amran, N.H.; Ismael, M.A. The Evolution of a Single Droplet Water-in-Palm Oil Derived Biodiesel Emulsion Leading to Micro-Explosion. Alex. Eng. J. 2022, 61, 541–547. [Google Scholar] [CrossRef]
  67. Yilmaz, N.; Atmanli, A.; Vigil, F.M. Quaternary Blends of Diesel, Biodiesel, Higher Alcohols and Vegetable Oil in a Compression Ignition Engine. Fuel 2018, 212, 462–469. [Google Scholar] [CrossRef]
  68. Deepanraj, B.; Dhanesh, C.; Senthil, R.; Kannan, M.; Santhoshkumar, A.; Lawrence, P. Use of Palm Oil Biodiesel Blends as a Fuel for Compression Ignition Engine. Am. J. Appl. Sci. 2011, 8, 1154–1158. [Google Scholar] [CrossRef]
  69. Murillo, S.; Miguez, J.L.; Porteiro, J.; Granada, E.; Moran, J.C. Performance and Exhaust Emissions in the Use of Biodiesel in Outboard Diesel Engines. Fuel 2007, 86, 1765–1771. [Google Scholar] [CrossRef]
  70. Lapuerta, M.; Armas, O.; Rodriguez-Fernandez, J. Effect of Biodiesel Fuels on Diesel Engine Emissions. Prog. Energy Combust. Sci. 2008, 34, 198–223. [Google Scholar] [CrossRef]
  71. Song, J.T.; Zhang, C.H. An Experimental Study on the Performance and Exhaust Emissions of a Diesel Engine Fuelled with Soybean Oil Methyl Ester. Proc. Inst. Mech. Eng. Part D J. Automob. Eng. 2008, 222, 2487–2496. [Google Scholar] [CrossRef]
  72. Sureshkumar, K.; Velraj, R.; Ganesan, R. Performance and Exhaust Emission Characteristics of a CI Engine Fueled with Pongamia Pinnata Methyl Ester (PPME) and Its Blends with Diesel. Renew. Energy 2008, 33, 2294–2302. [Google Scholar] [CrossRef]
  73. Ashok, B.; Nanthagopal, K.; Subbarao, R.; Johny, A.; Mohan, A.; Tamilarasu, A. Experimental Studies on the Effect of Metal Oxide and Antioxidant Additives with Calophyllum Inophyllum Methyl Ester in Compression Ignition Engine. J. Clean. Prod. 2017, 166, 474–484. [Google Scholar] [CrossRef]
  74. Muralidharan, K.; Vasudevan, D. Performance, Emission and Combustion Characteristics of a Variable Compression Ratio Engine Using Methyl Esters of Waste Cooking Oil and Diesel Blends. Appl. Energy 2011, 88, 3959–3968. [Google Scholar] [CrossRef]
  75. Yee, K.F.; Tan, K.T.; Abdullah, A.Z.; Lee, K.T. Life Cycle Assessment of Palm Biodiesel: Revealing Facts and Benefits for Sustainability. Appl. Energy 2009, 86, S189–S196. [Google Scholar] [CrossRef]
  76. Sharon, H.; Jai Shiva Ram, P.; Jenis Fernando, K.; Murali, S.; Muthusamy, R. Fueling a Stationary Direct Injection Diesel Engine with Diesel-Used Palm Oil-Butanol Blends—An Experimental Study. Energy Convers. Manag. 2013, 73, 95–105. [Google Scholar] [CrossRef]
  77. Agarwal, A.K. Biofuels (Alcohols and Biodiesel) Applications as Fuels for Internal Combustion Engines. Prog. Energy Combust. Sci. 2007, 33, 233–271. [Google Scholar] [CrossRef]
  78. Nalgundwar, A.; Paul, B.; Sharma, S.K. Comparison of Performance and Emissions Characteristics of DI CI Engine Fueled with Dual Biodiesel Blends of Palm and Jatropha. Fuel 2016, 173, 172–179. [Google Scholar] [CrossRef]
  79. Rakopoulos, D.C.; Rakopoulos, C.D.; Giakoumis, E.G.; Dimaratos, A.M.; Founti, M.A. Comparative Environmental Behavior of Bus Engine Operating on Blends of Diesel Fuel with Four Straight Vegetable Oils of Greek Origin: Sunflower, Cottonseed, Corn and Olive. Fuel 2011, 90, 3439–3446. [Google Scholar] [CrossRef]
  80. Ozsezn, A.N.; Canakci, M. Determination of Performance and Combustion Characteristics of a Diesel Engine Fueled with Canola and Waste Palm Oil Methyl Esters. Energy Convers. Manag. 2011, 52, 108–116. [Google Scholar] [CrossRef]
  81. Alahmer, A. Reduction a Particulate Matter of Diesel Emission by the Use of Several Oxygenated Diesel Blend Fuels. Int. J. Therm. Environ. Eng. 2014, 7, 45–50. [Google Scholar]
  82. Alahmer, A.; Yamin, J.; Sakhrieh, A.; Hamdan, M.A. Engine Performance Using Emulsified Diesel Fuel. Energy Convers. Manag. 2010, 51, 1708–1713. [Google Scholar] [CrossRef]
  83. Alahmer, A. Influence of Using Emulsified Diesel Fuel on the Performance and Pollutants Emitted from Diesel Engine. Energy Convers. Manag. 2013, 73, 361–369. [Google Scholar] [CrossRef]
  84. Da Silva Trindade, W.R.; dos Santos, R.G. Review on the Characteristics of Butanol, Its Production and Use as Fuel in Internal Combustion Engines. Renew. Sustain. Energy Rev. 2017, 69, 642–651. [Google Scholar] [CrossRef]
  85. Abedin, M.J.; Masjuki, H.H.; Kalam, M.A.; Varman, M.; Arbab, M.I.; Fattah, I.M.; Masum, B.M. Experimental Investigation of a Multicylinder Unmodified Diesel Engine Performance, Emission, and Heat Loss Characteristics Using Different Biodiesel Blends: Rollout of B10 in Malaysia. Sci. World J. 2014, 2014, 349858. [Google Scholar] [CrossRef] [Green Version]
  86. Kalam, M.A.; Masjuki, H.H.; Jayed, M.H.; Liaquat, A.M. Emission and Performance Characteristics of an Indirect Ignition Diesel Engine Fuelled with Waste Cooking Oil. Energy 2011, 36, 397–402. [Google Scholar] [CrossRef]
  87. Senatore, A.; Cardone, M.; Buono, D.; Rocco, V. Combustion Study of a Common Rail Diesel Engine Optimized to Be Fueled with Biodiesel. Energy Fuels 2008, 22, 1405–1410. [Google Scholar] [CrossRef]
  88. Alahmer, A.; Rezk, H.; Aladayleh, W.; Mostafa, A.O.; Abu-Zaid, M.; Alahmer, H.; Gomaa, M.R.; Alhussan, A.A.; Ghoniem, R.M. Modeling and Optimization of a Compression Ignition Engine Fueled with Biodiesel Blends for Performance Improvement. Mathematics 2022. accepted. [Google Scholar]
  89. Maillard, J.; Jagla, J. Effect of Load on Engine Noise for the Auralization of Road Traffic. In Proceedings of the Euronoise 2015, Maastricht, The Netherlands, 31 May–3 June 2015. [Google Scholar]
  90. Rahman, S.M.A.; Masjuki, H.H.; Kalam, M.A.; Abedin, M.J.; Sanjid, A.; Sajjad, H. Production of Palm and Calophyllum Inophyllum Based Biodiesel and Investigation of Blend Performance and Exhaust Emission in an Unmodified Diesel Engine at High Idling Conditions. Energy Convers. Manag. 2013, 76, 362–367. [Google Scholar] [CrossRef]
  91. Sharon, H.; Karuppasamy, K.; Kumar, D.R.S.; Sundaresan, A. A Test on DI Diesel Engine Fueled with Methyl Esters of Used Palm Oil. Renew. Energy 2012, 47, 160–166. [Google Scholar] [CrossRef]
  92. Rakopoulos, C.D.; Antonopoulos, K.A.; Rakopoulos, D.C.; Hountalas, D.T.; Giakoumis, E.G. Comparative Performance and Emissions Study of a Direct Injection Diesel Engine Using Blends of Diesel Fuel with Vegetable Oils or Bio-Diesels of Various Origins. Energy Convers. Manag. 2006, 47, 3272–3287. [Google Scholar] [CrossRef]
  93. Siavash, N.K.; Najafi, G.; Hassan-Beygi, S.R.; Ahmadian, H.; Ghobadian, B.; Yusaf, T.; Mazlan, M. Time–Frequency Analysis of Diesel Engine Noise Using Biodiesel Fuel Blends. Sustainability 2021, 13, 3489. [Google Scholar] [CrossRef]
  94. Alahmer, A.; Aladayleh, W. Effect Two Grades of Octane Numbers on the Performance, Exhaust and Acoustic Emissions of Spark Ignition Engine. Fuel 2016, 180, 80–89. [Google Scholar] [CrossRef]
  95. Chiatti, G.; Chiavola, O.; Palmieri, F. Vibration and Acoustic Characteristics of a City-Car Engine Fueled with Biodiesel Blends. Appl. Energy 2017, 185, 664–670. [Google Scholar] [CrossRef]
  96. Sarıdemir, S.; Ağbulut, Ü. Combustion, Performance, Vibration and Noise Characteristics of Cottonseed Methyl Ester–Diesel Blends Fuelled Engine. Biofuels 2019, 1–10. [Google Scholar] [CrossRef]
  97. Redel-Macías, M.D.; Pinzi, S.; Leiva, D.; Cubero-Atienza, A.J.; Dorado, M.P. Air and Noise Pollution of a Diesel Engine Fueled with Olive Pomace Oil Methyl Ester and Petrodiesel Blends. Fuel 2012, 95, 615–621. [Google Scholar] [CrossRef]
  98. Shrivastava, N. Experimental Investigation of Performance, Emission, and Noise Parameters of Water-Emulsified Karanja Biodiesel: A Prospective Indian Fuel. J. Braz. Soc. Mech. Sci. Eng. 2017, 39, 1009–1017. [Google Scholar] [CrossRef]
  99. Patel, C.; Sharma, N.; Tiwari, N.; Agarwal, A.K. Effects of Spray Droplet Size and Velocity Distributions on Emissions from a Single Cylinder Biofuel Engine; SAE Technical Paper: 2016-01-0994; SAE International: Warrendale, PA, USA, 2016; Available online: https://www.sae.org/publications/technical-papers/content/2016-01-0994/ (accessed on 22 December 2021).
  100. Fattah, I.M.R.; Masjuki, H.H.; Liaquat, A.M.; Ramli, R.; Kalam, M.A.; Riazuddin, V.N. Impact of Various Biodiesel Fuels Obtained from Edible and Non-Edible Oils on Engine Exhaust Gas and Noise Emissions. Renew. Sustain. Energy Rev. 2013, 18, 552–567. [Google Scholar] [CrossRef]
  101. Alahmer, A.I.; Adaileh, W.M.; Al Zubi, M.A. Monitoring of a Spark Ignition Engine Malfunctions Using Acoustic Signal Technique. Int. J. Veh. Noise Vib. 2014, 10, 201–213. [Google Scholar] [CrossRef]
  102. Dal, H.; Emiroğlu, A.O.; Bilge, H.; Şen, M. Experimental Investigation of the Effects of Chicken and Turkey Biodiesel Blends on Diesel Engine Noise Emissions. Int. J. Environ. Sci. Technol. 2019, 16, 5147–5154. [Google Scholar] [CrossRef]
  103. Giakoumis, E.G.; Rakopoulos, C.D.; Dimaratos, A.M.; Rakopoulos, D.C. Combustion Noise Radiation during the Acceleration of a Turbocharged Diesel Engine Operating with Biodiesel or N-Butanol Diesel Fuel Blends. Proc. Inst. Mech. Eng. Part D J. Automob. Eng. 2012, 226, 971–986. [Google Scholar] [CrossRef]
Figure 1. Hierarchical levels of grey wolves and their tasks.
Sustainability 14 01367 g001
Figure 2. Flow chart of the grey wolf optimization algorithm process.
Sustainability 14 01367 g002
Figure 3. Variation in exhaust temperature vs. engine speed for different biodiesel blends.
Sustainability 14 01367 g003
Figure 4. Variation in unburned hydrocarbon emission vs. engine speed for different biodiesel types.
Sustainability 14 01367 g004
Figure 5. Variation in carbon dioxide emission vs. engine speed for different biodiesel types.
Sustainability 14 01367 g005
Figure 6. Variation in carbon monoxide emission vs. engine speed for different biodiesel types.
Sustainability 14 01367 g006
Figure 7. Variation in nitrogen oxides emission vs. engine speed for different biodiesel types.
Sustainability 14 01367 g007
Figure 8. Thermal efficiency fluctuates with engine speed for various biodiesel blends.
Sustainability 14 01367 g008
Figure 9. Variation in noise level dB(A) vs. frequency Hz at an engine speed of 1800 rpm for different biodiesel types.
Sustainability 14 01367 g009
Figure 10. Variation in noise level dB(A) vs. engine speed for different biodiesel types.
Sustainability 14 01367 g010
Figure 11. Variation in noise level dB(A) vs. engine load at an engine speed of 1800 rpm for different biodiesel types.
Sustainability 14 01367 g011
Figure 12. Regression model prediction precision for exhaust emissions.
Sustainability 14 01367 g012
Figure 13. Regression model prediction precision for (a) noise and (b) brake thermal efficiency.
Sustainability 14 01367 g013
Figure 14. Contour plots are being used to visualize search spaces during the optimization process.
Sustainability 14 01367 g014
Table 1. Specifications of the diesel engine used.
ParameterSpecification
TypeLister LV1
Nominal speed range1000–3000 rpm
Maximum power9 HP (6.7 kW) @ 3000 rpm
Number of cylindersSingle
InjectionDirect
Engine operationFour-stroke
Bore * Stroke85.73 × 82.55 mm
Compression ratio17:1
Injector opening pressure180 bar
Intake valve opening/closing15° CA BTDC/41° CA ABDC
Exhaust valve opening/closing41° CA BBDC/15° CA ATDC
Air intake processNaturally aspirated
Type of coolingAir-cooled
DynamometerA swinging field direct current (DC) dynamometer
Table 2. Measured fuel blends properties of all tested fuel.
PropertiesDieselCorn
Biodiesel
Palm
Biodiesel
Sunflower
Biodiesel
Test MethodEquipment
Cetane Number [58]47536152ASTM D613-
Heating Value (MJ/kg)43.539.540.139.8ASTM D240Automatic adiabatic bomb calorimeter
Specific gravity at 15 °C (kg/m3)0.830.860.850.85IP 190/93Capillary stoppered
pycnometer
Viscosity at 40 °C (cSt)3.854.775.284.96ASTM D445EMILA rotary viscometer apparatus
Table 3. Percentage of fatty acids in oil materials used [59,60,61].
Sources% (wt) Palmitic
(C16:0)
% (wt) Stearic
(C18:0)
% (wt) Oleic
(C18:1)
% (wt) Linoleic
(C18:2)
% (wt) Linolenic
(C18:3)
Palm oil4543911- *
Sunflower3–101–1014–3555–75<0.3
Corn8–101–430–5034.560.5–1.5
* Not specified.
Table 4. Exhaust emission apparatus and its accuracy.
EmissionTest MethodAccuracyResolutionMaximum Limit
CO2Nondispersive infrared±5% of reading
±0.5% volume
0.01%16%
CONondispersive infrared±5% of reading
±0.5% volume
0.01%10%
UHCNondispersive infrared±5% of reading1 ppm5000
NOxFuel cell0–4000 ppm ±4%;
4000–5000 ppm ±5%
1 ppm5000
Table 5. Statistical evaluation of the regression models.
ExperimentFuel TypeSSERMSER2
UHCDiesel8.45 × 10−48.40 × 10−39.92 × 10−1
Palm Biodiesel2.38 × 10−31.22 × 10−29.88 × 10−1
Sunflower Biodiesel2.57 × 10−31.29 × 10−29.87 × 10−1
Corn Biodiesel4.21 × 10−46.10 × 10−39.93 × 10−1
CO2Diesel4.55 × 10−34.77 × 10−29.87 × 10−1
Palm Biodiesel6.82 × 10−31.85 × 10−29.86 × 10−1
Sunflower Biodiesel1.25 × 10−32.50 × 10−29.74 × 10−1
Corn Biodiesel5.47 × 10−31.35 × 10−29.63 × 10−1
CODiesel5.28 × 10−42.24 × 10−29.82 × 10−1
Palm Biodiesel4.97 × 10−41.58 × 10−29.82 × 10−1
Sunflower Biodiesel1.89 × 10−33.08 × 10−29.68 × 10−1
Corn Biodiesel2.24 × 10−32.73 × 10−29.63 × 10−1
NOxDiesel4.55 × 10−31.18 × 10−29.88 × 10−1
Palm Biodiesel6.82 × 10−31.39 × 10−29.86 × 10−1
Sunflower Biodiesel1.25 × 10−31.25 × 10−29.88 × 10−1
Corn Biodiesel5.47 × 10−31.21 × 10−29.88 × 10−1
BTEDiesel1.31 × 10−32.67 × 10−29.74 × 10−1
Palm Biodiesel2.36 × 10−33.31 × 10−29.68 × 10−1
Sunflower Biodiesel1.37 × 10−32.34 × 10−29.77 × 10−1
Corn Biodiesel3.64 × 10−32.54 × 10−29.75 × 10−1
NoiseDiesel6.29 × 10−46.50 × 10−39.90 × 10−1
Palm Biodiesel4.39 × 10−45.80 × 10−39.93 × 10−1
Sunflower Biodiesel3.80 × 10−53.70 × 10−39.95 × 10−1
Corn Biodiesel7.17 × 10−49.60 × 10−39.88 × 10−1
Table 6. The regression models’ ANOVA results.
ResponseDff-Valuep-Value
UHC221.79<0.0001
CO2321.50<0.008
CO334.56<0.001
NOx2597.56<0.0001
BTE234.86<0.0006
Noise280.79<0.0001
Table 7. Optimization results for each response separately with respect to the fuel type.
ExperimentFuel TypeEngine SpeedOptimum Value
UHC (PPM)Diesel24009
Palm Biodiesel24007
Sunflower Biodiesel24008
Corn Biodiesel24007
CO2 (%)Diesel13673.92
Palm Biodiesel15761.64
Sunflower Biodiesel13731.82
Corn Biodiesel13421.95
CO (%)Diesel14070.22
Palm Biodiesel17650.12
Sunflower Biodiesel17870.11
Corn Biodiesel17620.14
NOx (PPM)Diesel1200489
Palm Biodiesel1200508
Sunflower Biodiesel1200495
Corn Biodiesel1200492
BTE(%)Diesel218320.31
Palm Biodiesel193719.10
Sunflower Biodiesel163119.89
Corn Biodiesel198820.02
Noise leveldB(A)Diesel120075.9
Palm Biodiesel120073
Sunflower Biodiesel120074.4
Corn Biodiesel120074.8
Table 8. Weights for the responses used in optimization.
ResponseWeightTarget
UHC0.1Minimize
CO20.1Minimize
CO0.2Minimize
NOx0.2Minimize
BTE0.3Maximize
Noise0.1Minimize
Table 9. Summary of optimization results for all exhaust emissions, engine performance, and noise for each fuel type.
ExperimentalFuel TypeEngine Speed (rpm)CO (%)CO2
(%)
NOx
(ppm)
UHC
(ppm)
BTE
(%)
Noise
dB(A)
Optimum ValuesDiesel18620.265.69555.1415.021.9879.14
Palm17430.132.01577.0011.481.8776.24
Sunflower16120.152.32546.0017.841.9976.51
Corn18670.162.50563.0013.091.9478.86
Table 10. Exhaust emission, engine noise, and performance improvement after applied optimization process compared to pure diesel fuel at optimum engine speed.
Fuel TypeEngine SpeedCOCO2NOxUHCBTENoise
Palm Biodiesel
−6.39%

−49.46%

−64.70%

3.94%

−23.61%

−5.56%

−48.63%
Sunflower
Biodiesel

−13.43%

−41.29%

−59.25%

−1.65%

18.76%

0.35%

−45.34%
Corn Biodiesel
0.27%

−37.79%

−56.09%

1.42%

−12.90%

−2.08%

−6.16%
Publisher’s Note: MDPI stays neutral with regard to jurisdictional claims in published maps and institutional affiliations.

