Article

An Evaluation of Supply Chain Performance of China’s Prefabricated Building from the Perspective of Sustainability

1
Engineering Management, School of Civil Engineering and Architecture, Wuhan University of Technology, Wuhan 430070, China
2
China Construction Seventh Division South Company, Shenzhen 518000, China
*
Author to whom correspondence should be addressed.
Sustainability 2022, 14(3), 1299; https://doi.org/10.3390/su14031299
Submission received: 13 December 2021 / Revised: 11 January 2022 / Accepted: 12 January 2022 / Published: 24 January 2022
(This article belongs to the Special Issue Energy Efficiency Measures in Supply Chain Systems)

Abstract

:
Prefabricated building is an objective requirement to achieve sustainable development of the construction industry. However, it should be noted that Chinese enterprises are characterized by an immature supply chain management mechanism, and weak environmental protection awareness and social responsibility awareness. Therefore, from the perspective of sustainable development, a performance evaluation system for a prefabricated building supply chain was established based on SEM (Structural Equation Model) and virtual frontier SBM–DEA (Slacks-Based Measure and Data Envelopment Analysis). Upon summarization of a great deal of literatures, the most influential 34 indexes were selected, after which the weight calculation and index screening were performed using SEM method. Second, the performance evaluation was conducted using the virtual SBM–DEA method. Horizontally, a comparison is made on the performance and total performance of the four sub-units (supply chain operation, economic benefit, environmental protection and social liabilities) in the supply chain; vertically, the dynamic changes of the supply chain in time dimension are assessed. After the evaluation system was applied into enterprises, research results show that factors affecting the performance of the corporate supply chain are ranked as: supply chain operation > economic benefits > environmental protection > social responsibility. At the same time, the performance of 14 supply chains was evaluated, in order to provide guidance for supply chain management in enterprises.

1. Introduction

In recent years, China’s construction industry has been developing by leaps and bounds, which drives related industries such as cement, steel, and machinery manufacturing. Frankly, large-scale construction has brought considerable economic and social benefits, but at the same time, problems are caused, namely huge energy consumption and environmental pollution [1]. As a result, the sustainable construction industry emphasizes to create and keep a healthy building environment on the premise of resources efficiency and ecological protection. Characterized by high production efficiency, high resource utilization rate, low pollution emission, less personnel input and other advantages, the prefabricated building mode fully meets the requirements of sustainability. In other words, prefabricated building is an objective requirement for sustainable development of the construction industry, and accordingly, the Chinese government introduced policies to encourage the application of prefabricated buildings [2].
Furthermore, prefabricated buildings also conform to the principle of a circular economy. A circular economy is an important means to achieve sustainable development in the building industry, and prefabricated buildings are its important drive [3]. Prefabricated buildings improve the resources utilization in the building industry under the “3R” principle (reduce, reuse and recycle) of a circular economy, not only promoting the use of high-strength materials and a large frame structure to reduce the use of materials in the building industry, but also improving the service life of buildings and reducing pollution to the environment [4]. The circular economy exerts whole-process control over design, construction and dismantling of prefabricated buildings, thus reducing the damage and pollution to the environment. At the design stage, green and renewable materials are adopted to reduce the use of non-renewable materials. At the construction stage, the clean production process with less energy consumption and pollutant emission is adopted. At the building dismantling stage, the construction materials are kept intact as far as possible, so that they may be reused. As regards building wastes, they are recycled as resources.
Compared with the supply chain management capabilities of other industries, prefabricated building has supply chains featuring in late start and unsound management systems [5]. In addition, the evaluation mechanism for supply chain performance is far from complete. In China, sustainable supply chain management is still in its infancy. Construction enterprises hold a weak awareness of environmental protection and social responsibility so that they cannot assume responsibilities in protecting the environment and learn social ethics actively [6]. Based on this, this study builds a performance evaluation system for prefabricated building from the perspective of sustainable development.

2. Literature Review

2.1. Definition and Characteristics of Prefabricated Building Supply Chain

In existing literatures, the prefabricated building supply chain has been defined as producer [7], manufacturer and supplier [8], supply network for suppliers at different levels [9], off-site enterprise from the organizational perspective [10], and industrialized housing construction enterprise [11]. After summarizing the traditional building supply chain and the manufacturing supply chain, this study defines the prefabricated building supply chain: With prefabricated building enterprises as the core, it is a construction network consisting of an entire construction project surrounded by parts manufacturing enterprises, raw material suppliers and owners, including production, storage, transportation and on-site assembly of parts and semi-finished products. Figure 1 refers to the prefabricated building supply chain process.
Prefabricated building entails the following: transfer a large amount of on-site work in traditional construction methods to factories where building components and accessories (such as floor slabs, wall panels, stairs, balconies, etc.) are processed, after which they are transported to the construction site to be assembled and installed on site through reliable connection methods [12]. This shows that prefabricated building has a shorter construction period than traditional construction methods; tasks at the assembly site are simple, but there are extra parts manufacturing and transportation processes. Therefore, prefabricated buildings have something in common with the manufacturing industry and the traditional construction industry, and supply chain is both similar with and different from the two industries [13]. In this study, a comparison was made among supply chains of prefabricated building, manufacturing and of traditional building for analysis, as shown in Table 1.
The characteristic of the manufacturing supply chain lies in manufacturing products based on present market forecast; furthermore, the products are manufactured in batches on a large scale in factories, where their design is basically not changed. The characteristic of the traditional building supply chain is that the production is conducted in accordance with the requirements of building projects. Since each building is unique, the production is only once and not reproducible. Furthermore, all materials are concentrated on the construction site for manufacturing; there are more design changes. Compared with the foregoing two supply chains, the prefabricated building supply chain differs in the following aspects: (1) Prefabricated buildings are manufactured as per the quantity in the order placed by owners. Namely, the standard parts are manufactured at parts manufacturing enterprises and delivered to the construction site, after which they are further assembled into the owner’s desired buildings. (2) In the prefabricated building supply chain, the production cycle of parts is longer and there are less changes of product; furthermore, in addition to high transportation costs due to large size, the parts easily suffer damage during transportation and storage. Therefore, the resources turnover in the prefabricated building supply chain should be finer. (3) In the prefabricated building supply chain, large-scale production of parts is allowed, drawing closer the cooperation among enterprises. What is more, there is a higher requirement on the turnover rate of resources. Hence, enterprises in the prefabricated building supply chain may carry out long-term strategic cooperation and jointly formulate objectives to achieve win–win cooperation.

2.2. Performance Evaluation of Prefabricated Building Supply Chain

Many scholars study the performance evaluation system of the prefabricated building supply chain. Specifically, Cheng, J.C. introduced a supply chain management concept in the manufacturing industry to the construction industry, identified management problems of construction enterprises, and optimized corporate resources, in order to enhance value of the entire supply chain management of the industry [14]. G. Demiralp and G. Guven et al. constructed the PNGK model and proposed that establishment and standardization of the performance evaluation system will be an important research direction for the construction industry in the future [15]. Moreover, Eriksson, P.E. mainly explored the supply chain network structure of the participants in the construction industry, and optimized the evaluation process and performance analysis of supply chains from a strategic angle [16]. Tae-Hong Shin and Sangyoon Chin et al. pointed out that information sharing of enterprises in supply chains is important, and designed a corresponding evaluation system to measure the information sharing rate of participants, thereby providing significant information sharing for the improvement of the corporate management level [17]. Based on the connotation and definition of green supply chain management, Zhu mingqiang and Zouzuxu successfully perfected a green supply chain management model by referring to the implementation experience of green supply chains in developed countries, greatly supporting relevant green performance evaluation [18]. In addition, Kamali, through sustainability performance evaluation, makes a comparative evaluation of prefabricated buildings and traditional buildings [19].
Upon summarization of past literatures, the following drawbacks were found: (1) in carrying out the performance evaluation of the prefabricated building supply chain, the perspectives of most scholars were different; however, there was a lack of evaluation of the supply chain’s performance from the angle of prefabricated building developers and from the perspective of sustainable development. (2) The scholars’ evaluation methods were too single and lacked a combination of qualitative and quantitative methods, resulting in poor persuasion of evaluation results. (3) The result of scholars’ performance evaluation was not complete and lacked dual lateral (comparison of supply chains) and vertical (comparison from the timeline) comparison of supply chain performance laterally, which increased the management burden of enterprises.
There are many performance evaluation methods, including fuzzy comprehensive evaluation, principal component analysis, data envelopment analysis, benchmarking, balanced score card, genetic algorithm, etc. They have advantages and disadvantages. This study adopted the SEM method and the DEA method for analysis; the former is subjective evaluation, and the latter means objective evaluation, which make evaluation results more scientific. From the perspective of components procurement of prefabricated buildings, Zhang Wenbin used structural equation modeling (SEM) to establish a risk influencing factor model. At the same time, SEM was adopted by Chang to reveal the influence path of risk factors on safe construction of prefabricated buildings, and established related safety mechanisms to cope with risks [20]. Li also applied SEM to quantitatively evaluate investment risk of the prefabricated building industry, and came up with relevant measures to guide assessment of project investment risks [21]. Wang Xiaowen, from three sub-units (developer, design and construction), built a network DEA model to measure supply chain performance of prefabricated dwellings [22]. Based on the application of the method in the foregoing fields, it can be learned that the application of SEM and DEA in the field of prefabricated buildings has been quite mature and helps solve a series of relevant problems such as construction risks, investment risks and performance evaluation. Therefore, the combination of SEM and DEA is more adaptable to the performance evaluation of the prefabricated building supply chain, as their respective advantages may be utilized to reach more scientific evaluation results.
In summary, although performance evaluation of supply chain ushers in bright prospects in the field of prefabricated building, its evaluation system indicators are not researched systematically and profoundly compared with other industries. Furthermore, application of evaluation methods is far from mature enough and perfect. Sustainable supply chain management, as a new management model, not only includes traditional capital flow, business flow, and information flow, but also strengthens the concept of social responsibility and social awareness in each process, and fully considers improvement of overall performance of society. The ultimate goal is to achieve the highest efficiency and maximum benefit of society [23]. Consequently, from the perspective of sustainability, this study shall be of theoretical and practical significance to evaluate performance of the prefabricated building supply chain.

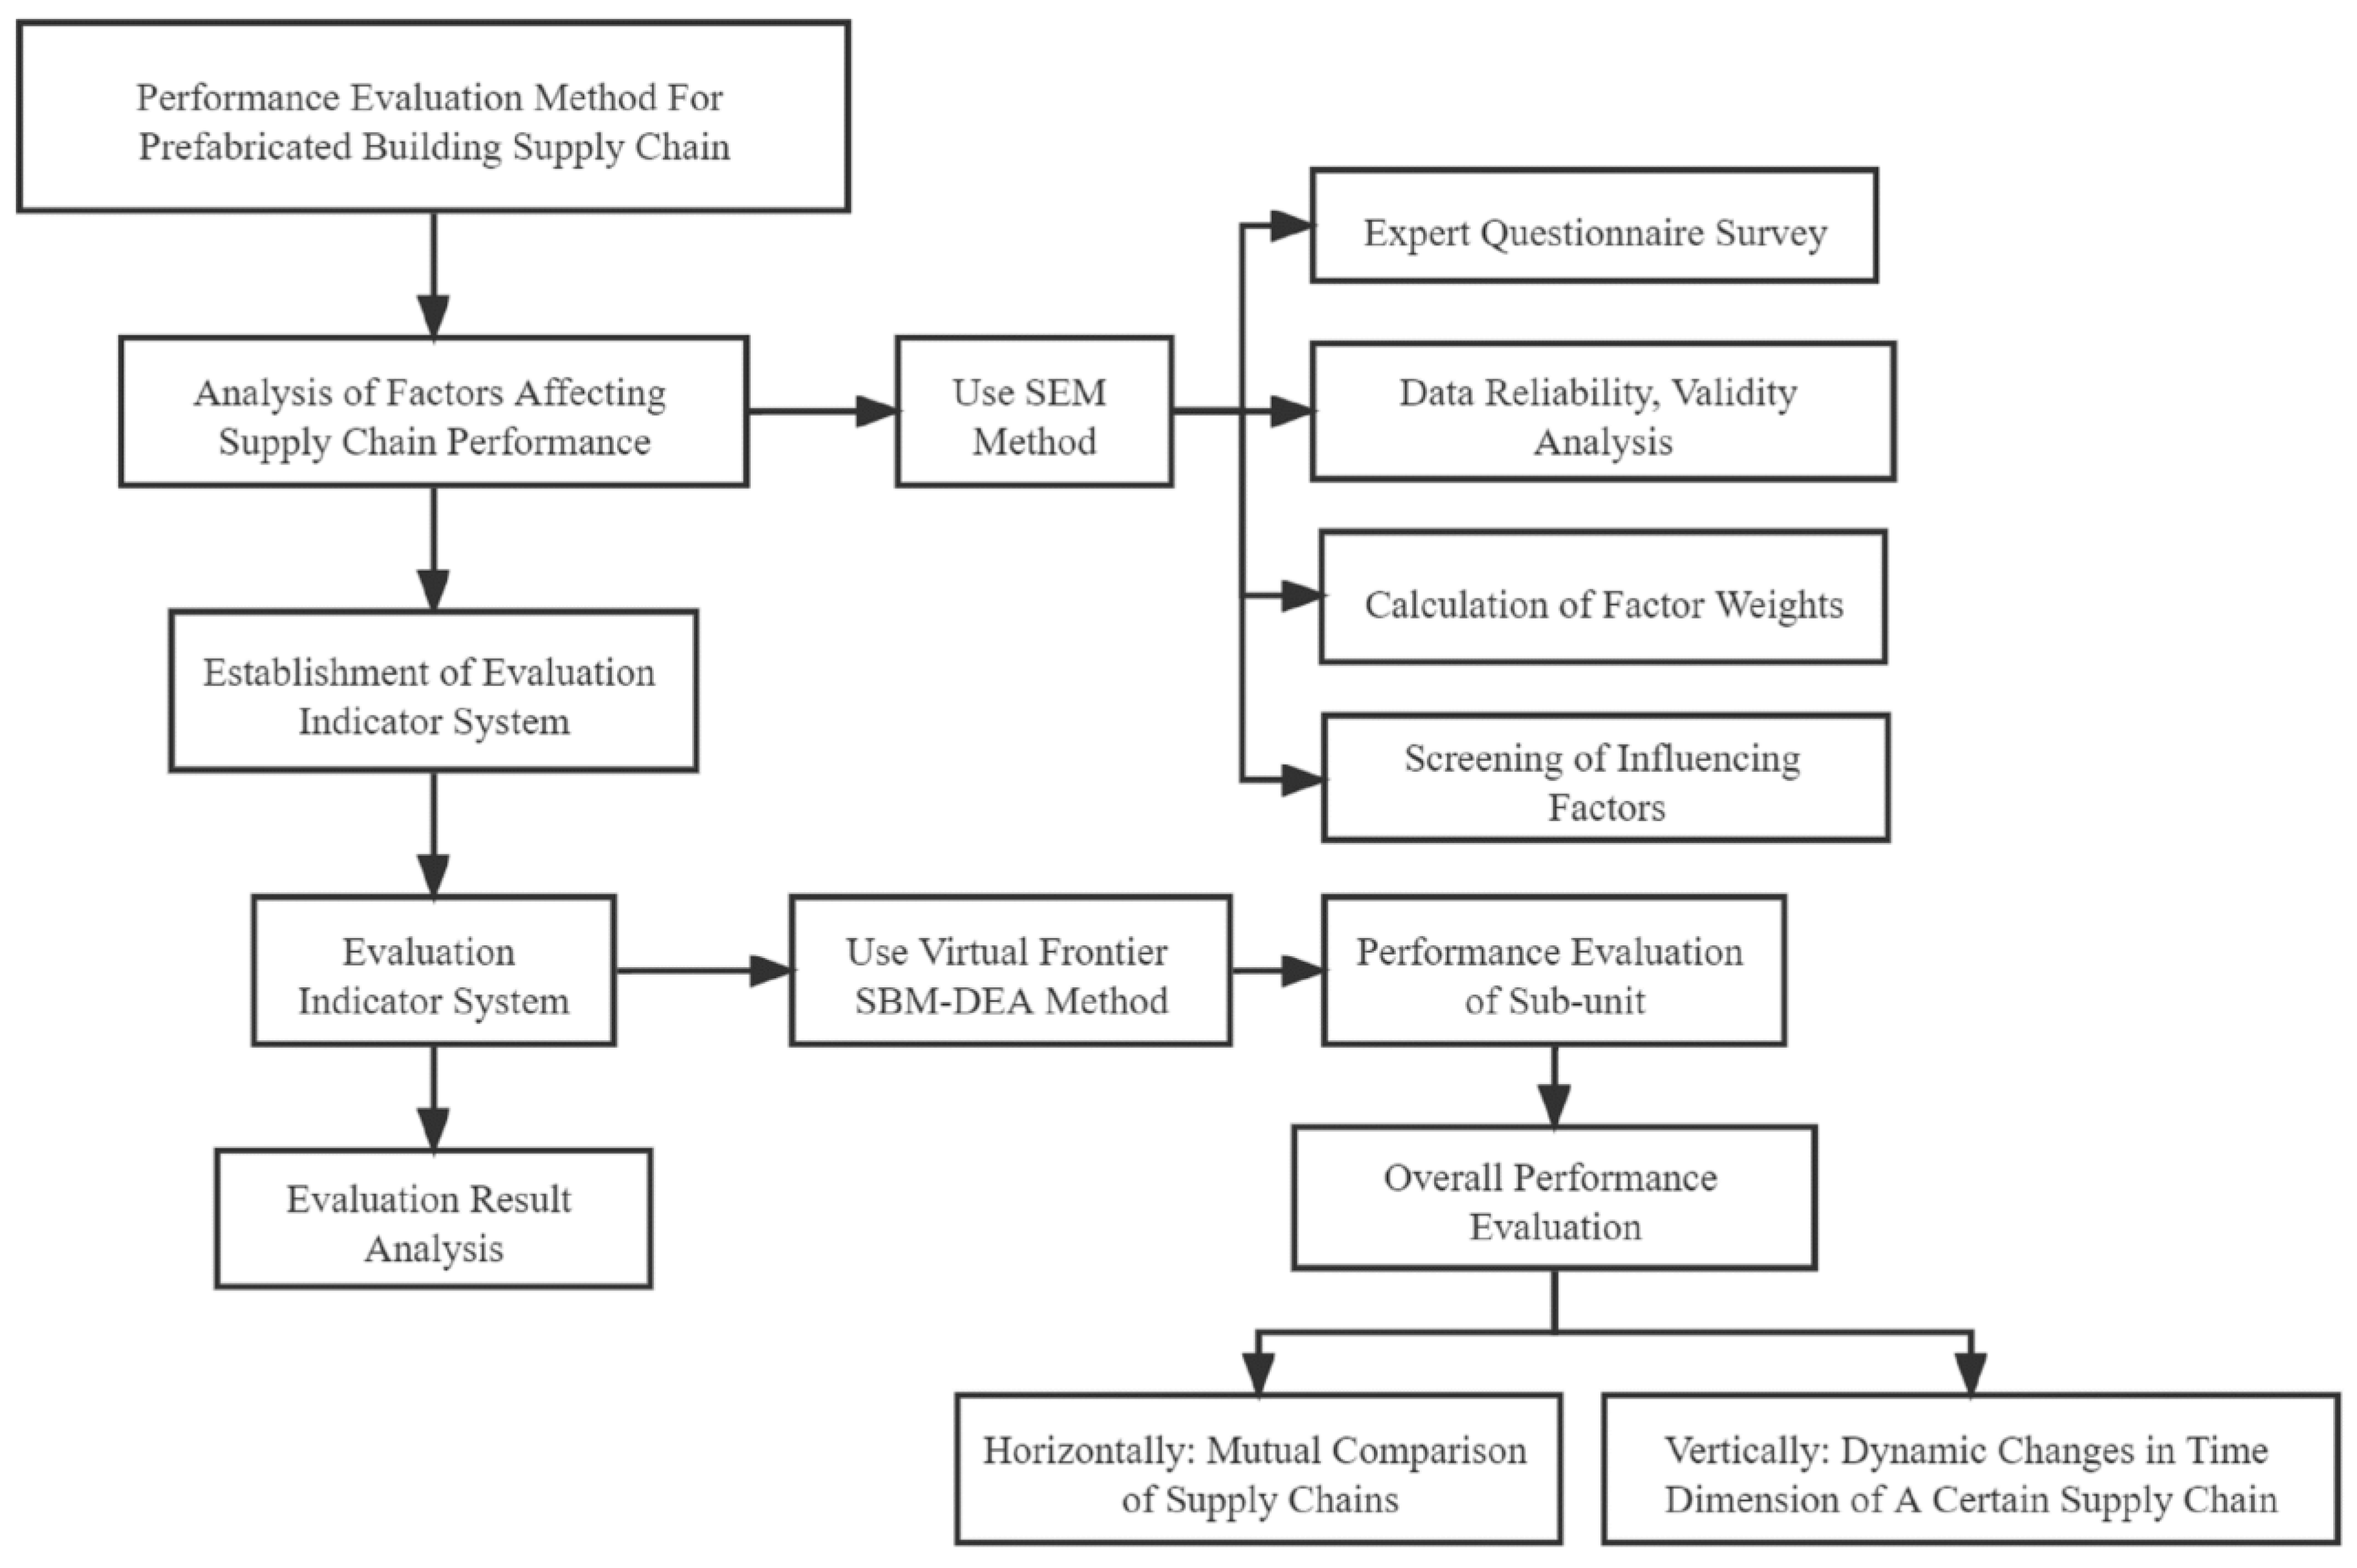
3. Materials and Methods

“How to establish a performance evaluation system for supply chain of prefabricated building that is more complete and sustainable?” “How to evaluate supply chain performance more scientifically and provide effective management measures and methods for construction enterprises?” In order to solve these problems, the study summarized research experience of predecessors, and proposed a set of performance evaluation systems of the prefabricated building supply chain in line with sustainable development, as shown in Figure 2.

3.1. Analysis of Influencing Factors

3.1.1. Collection of Impact Factors

Relevant papers in developed countries on prefabricated building, sustainable supply chain development and supply chain performance evaluation have been referred. For instance, Mafini constructed a coordinated performance evaluation index system for the supply chain of prefabricated building enterprises from the aspects of transportation coordination, inventory management coordination, information sharing coordination, cost-control coordination, client service coordination and risk-sharing coordination, etc. [24]. Kim analyzed the enterprises’ supply chain performance from the five aspects of internal operation capacity, owner satisfaction, agility, development and innovation and financial status [25]. Liu classified the influencing factors of sustainable development of the building supply chain from the three aspects of business flows, financial management and customers [26]. In this paper, the influencing factors with high frequency in [27,28,29,30,31] are summarized and the most influential 34 indexes are selected. Furthermore, following the idea of the triple bottom lines in sustainable development, they are divided into four sub-units of supply chain operation, economic benefit, environmental protection and social liabilities, as shown in Table 2. Among them, supply chain operation took into account reliability, agility, degree of collaborative communication, information sharing rate, and degree of intelligence of supply chain. Environmental protection considered carbon emissions, green GDP efficiency, and degree of environmental impact.

3.1.2. Questionnaire Survey

A questionnaire was designed. Respondents were required to score the influence of factors influencing performance of prefabricated building supply chain based on their own experience, using a Likert five-level scale, 1: minimal influence; 2: relatively small influence; 3: a certain influence; 4: large influence; 5: great influence [32].
A total of 300 questionnaires were distributed and 279 (93%) were collected. Among them, 232 were valid (83.2%). The respondents were Chinese experts and scholars who researched prefabricated building projects and engaged in prefabricated building work, including universities, government departments, construction units, design units, construction units, consulting units, assembly-type production units, etc. Their job positions and work experience are introduced in Figure 3.

3.1.3. Data Processing

The questionnaire data obtained were analyzed in reliability and validity. The study adopted SPSS software for calculation, and Cronbach’s Alpha for reliability analysis. Validity and factors were analyzed via KMO test and Bartlett sphere test [33]. The results showed that the Cronbach’s Alpha coefficient of variables was greater than 0.9, which indicated that research data were highly reliable. The KMO value of variables was greater than 0.9, meaning that there was a good correlation between variables. The p value in the Bartlett sphere test was less than 0.001, indicating that the questionnaire had a good structure. In general, the data met the requirements of the structural equation model and could be analyzed by SEM.

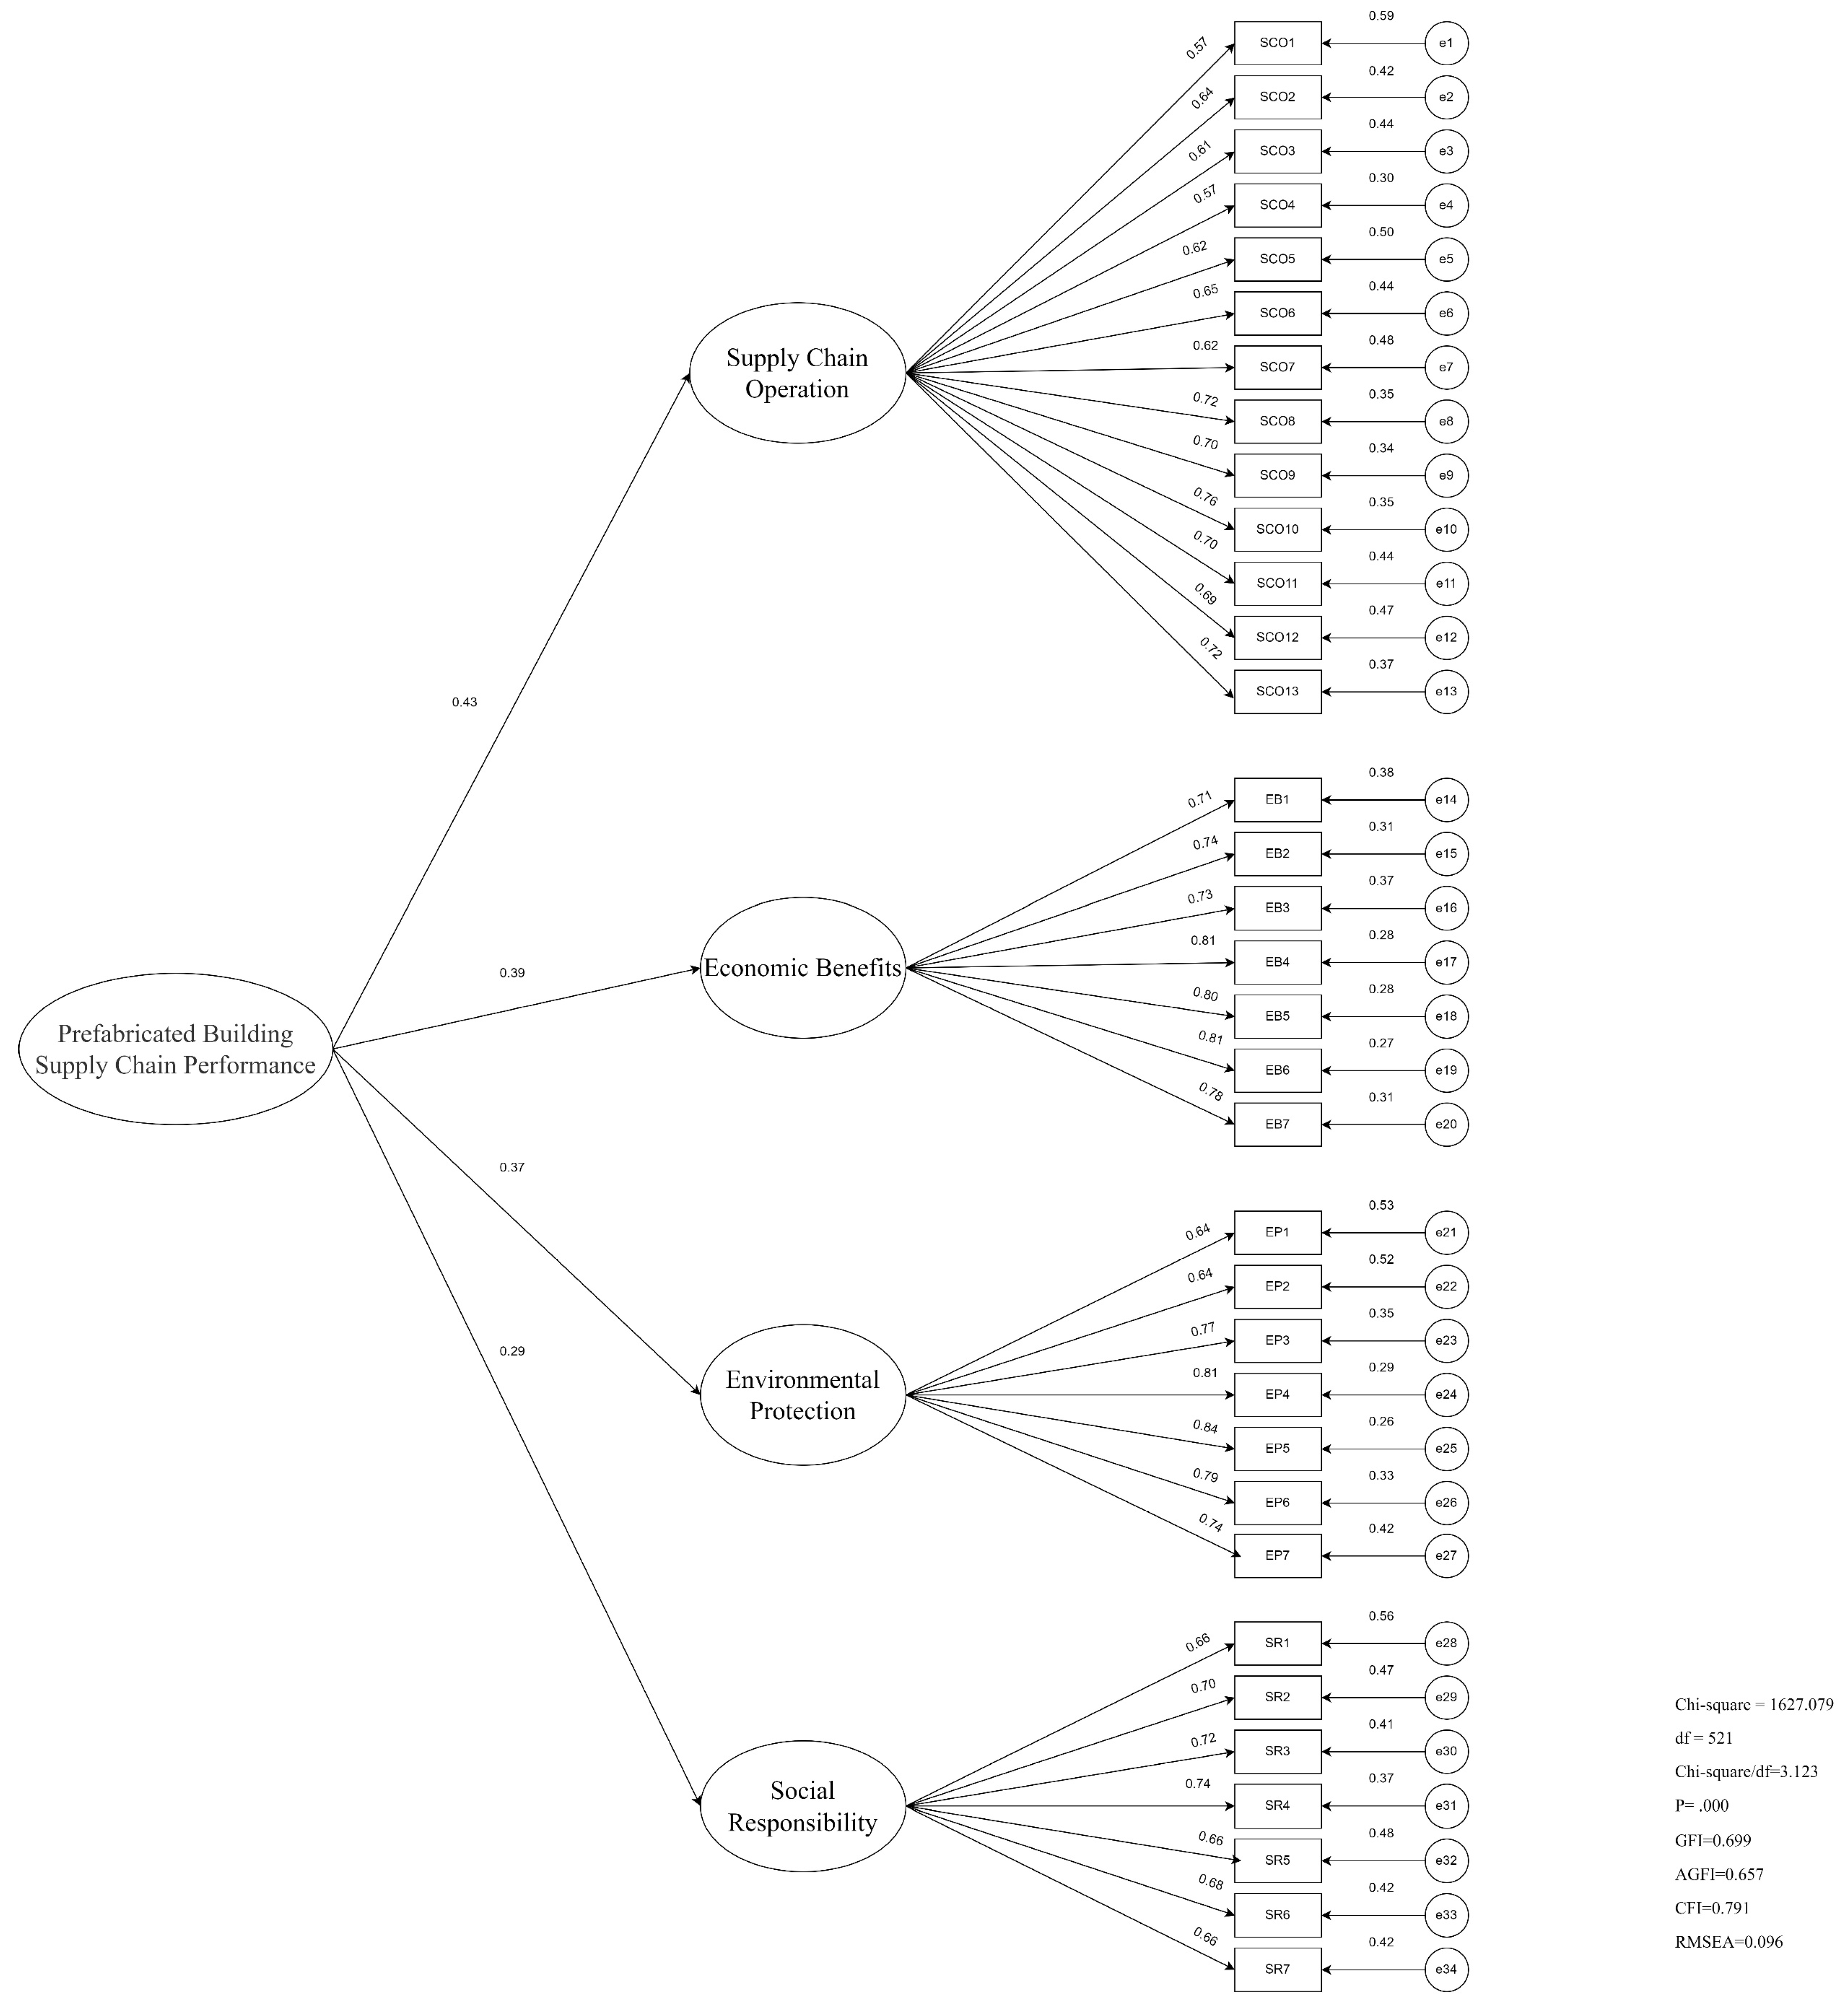
3.1.4. SEM Model Fitting and Correction

The structural equation model (SEM) is a statistical analysis that analyzes the relationship between variables in accordance with a covariance matrix of variables. It can properly handle relationships between hidden variables, or mutual influence between hidden variables and explicit variables [34]. The SEM method is applicable to multifactor relationship analysis, extraction of risk factors, evaluation system optimization and determination of index weight, etc. Now, it has been widely applied in economics, management science and social sciences, etc. [35]. Here, AMOS software was introduced as an analysis tool.
SEM includes two basic models: measured model and structural model. The measured model is composed of latent variable and observed variable, and it represents relationships between observed variable and latent variable indicator [36]. The relationship between latent variables is reflected by structural model.
(1)
Measured model
Measurement equation of derived variables (independent variables):
X = Λ x ξ + δ
Measurement equation of endogenous derivative variable (dependent variable):
Y = Λ y η + ε
In Equations (1) and (2):
  • X represents the derived observed indicator, and Y represents the endogenous observed indicator;
  • δ means measurement error of the derived variable, and ε is measurement error of the endogenous variable;
  • ξ stands for derived latent variables, and η is endogenous latent variables;
  • Λx represents the relationship between derived observed variable X and derived latent variable ξ, Λy indicates the relationship between endogenous observed variable Y and endogenous latent variable η [37].
(2)
Structural model
Structural model shows causality of latent variables, and its structural equation is:
η = Γ ξ + β η + ζ  
In Equation (3), Γ is the influence of derived latent variable ξ on endogenous latent variable η.
β refers to the relationship between endogenous latent variables; ζ is the residual term of the structural equation [38].
Figure 4 describes the relationship between the measurement model and the structural model.
AMOS was operated to estimate parameters firstly. Figure 5 refers to the standardized path coefficient structure diagram of the initial SEM model with parameter values.
The overall fit test of the initial model was: it was in a poor fit and acceptable. The hypothetical initial theoretical model remained to be improved and further revised. Next, the MI value of the SEM model was rectified, and it represented a decrease of the Chi-square value if a correlation path was added between two variables. Please see Figure 6 for the revised model. The new model was established after verification, with good degree of fitting, so, it could be accepted.

3.2. Establishment of an Indicator System

Calculated path coefficients in the revised SEM model according to Equation (4) to obtain the weight of each influencing factor; screened factors with smaller weights (Table 3) to form the final performance evaluation indicator for supply chain of prefabricated building in Table 4.
β i = λ i i = 1 n λ i
βi represents the weight of this factor, and λi is path coefficient of the factor.

3.3. Establishment of Virtual Frontier SBM–DEA Evaluation Model

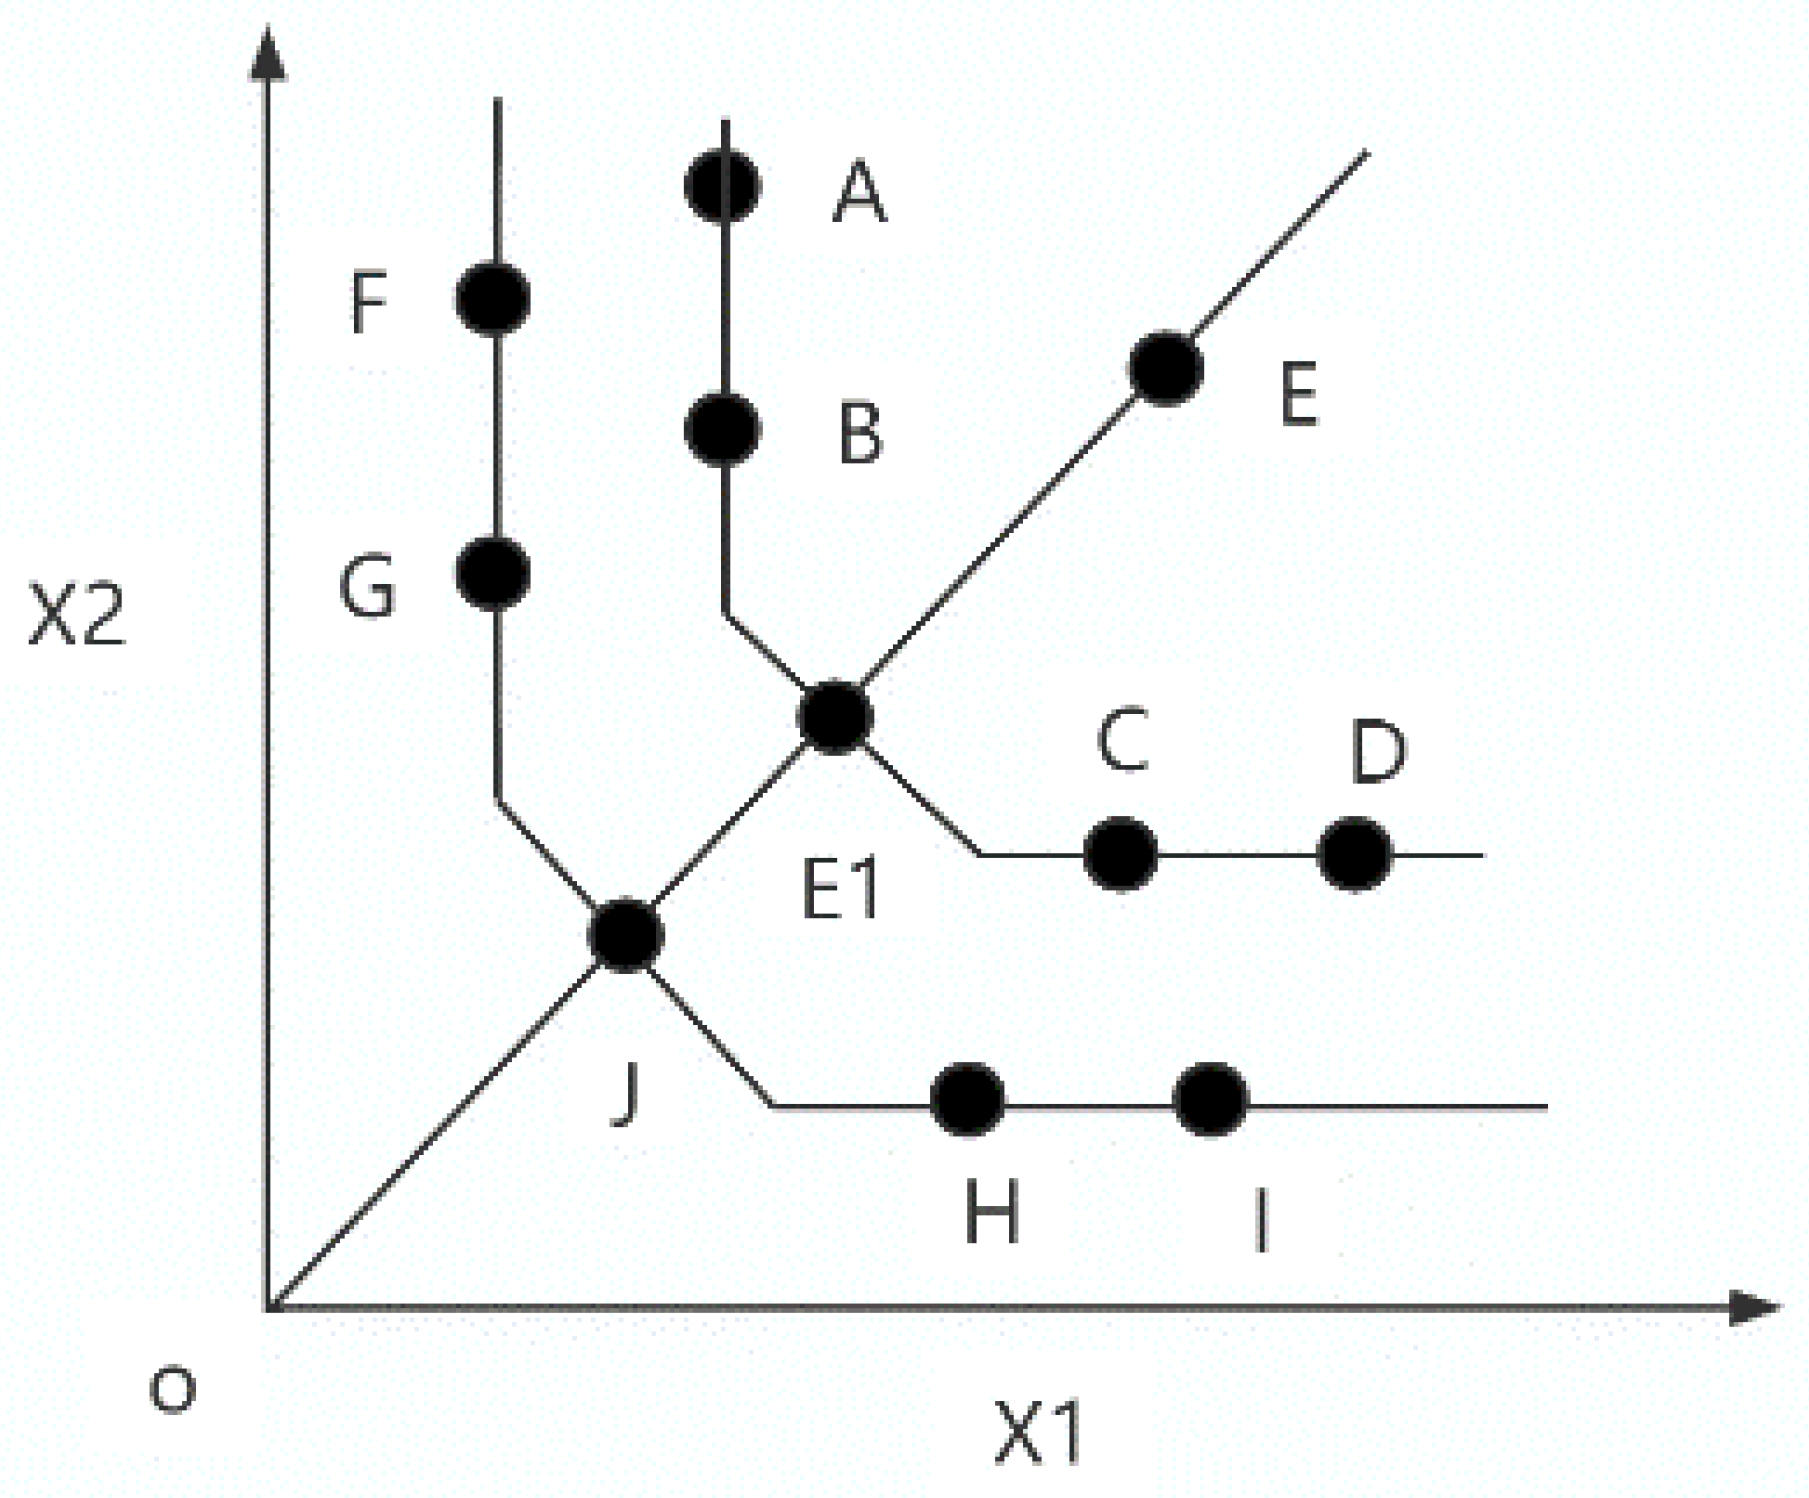
3.3.1. Introduction to Virtual Frontier SBM–DEA Evaluation Model

DEA belongs to the field of cross-study of operational research, management science and mathematical economics. It is mainly used for calculating the relative efficiency between the evaluated units. Currently, it has been applied in dealing with the problems such as resources distribution, industry efficiency and influencing factors [38]. Data Envelopment Analysis (DEA) is used to evaluate efficiency value of a decision-making unit with multiple inputs and outputs. Production possibility set is composed of input of the decision-making unit and all units of output [39]. The production frontier refers to Pareto optimal surface with a purpose of minimizing input and maximizing output. The DEA method is deemed as a non-parametric method. With continuous deepening of data envelopment analysis, various derivative models developed from the original standard model, such as the three-stage DEA model, benevolent DEA model, and SBM model [40].
Tone raises a slacks-based measure, which solved the problem of slack in input and output in traditional models. In the SBM model, the decision-making unit is expressed as J = { 1 , 2 , n } , and each J has m inputs and s outputs [41]. The input and output vectors of each decision-making unit DMUj are expressed as:
x j = ( x 1 j , x 2 j , , x m j ) T ,   y i = ( y i j , y 2 j , , y s j ) T
sm, s+n represent excessive input of m-th input and under-output of the n-th output respectively; λ is the weight; M and N stand for number of inputs and outputs respectively; K means the number of decision-making units [42]. In this study, the non-directional dominance SBM model was used, as shown in Equations (5) and (6):
ρ I 0 * = min λ , s , s + 1 ( 1 m ) i = 1 m ( s i x i 0 ) 1 + ( 1 s ) i = 1 s ( s r + y r 0 )
s . t . { x i 0 = j = 1 n x i j λ j + s j y r 0 = j = 1 n y r j λ j s r + λ j > 0 ( j ) , s j 0 ( i ) , s r + 0 ( r )
The principle of the virtual frontier DEA model is explained in Figure 7 [43]. For the traditional DEA model, A, B, C, D, and E are decision-making units; A, B, C, and D are valid for DEA, and E is invalid for DEA, but efficiency values of A, B, C, and D are all 1. Therefore, they cannot be distinguished effectively by the traditional DEA model. The virtual frontier DEA establishes a virtual frontier FGHI as optimal reference frontier for A, B, C, D, E. The new virtual frontier is constructed by zooming in and zooming out input and output at a certain proportion of the decision-making unit of the reference set. It shows from the figure that, under new reference frontiers, five decision-making units, A, B, C, D, and E, all become ineffective for DEA, so their efficiency can be further identified.
ξ represents the set of decision-making units being evaluated, ψ is the set of reference decision-making units (virtual frontier); the virtual frontier DEA model is expressed in Equations (7) and (8):
θ d = m a x U T Y d V T X d
s . t . { U T Y i V T X i 1 , i = 1 , 2 , n , i ψ , d ξ U 0 , V 0
Set x 0 j = m i n i { x i j }   y 0 r = m a x i { y i j } , i = 1 , 2 , ,  n represents decision-making unit; xij means the j-th input of decision-making unit i, and yij indicates the r-th output of decision-making unit i. For the reference set of decision-making unit I, the input and output are randomly generated. Set input interval [ 0.95 x 0 j , x 0 j ] , and the output interval [ y 0 r , 1.05 y 0 r ] . Therefore, the improved virtual frontier SBM model is described in Equations (9) and (10):
ρ I 0 * = min λ , s , s + 1 ( 1 m ) i = 1 m ( s i x i 0 ) 1 + ( 1 s ) i = 1 s ( s r + y r 0 )
s . t . { x i 0 = j = 1 n X X i j λ j + s j y r 0 = j = 1 n Y Y r j λ j s r + λ j > 0 ( j ) , s j 0 ( i ) , s r + 0 ( r )
The virtual frontier model is superior to the traditional model, to some extent [44]. The virtual frontier SBM model is characteristic in two aspects: a. the efficiency value of the virtual frontier SBM is smaller than that obtained by other SBM methods. b. unless input and output of two decision-making units are exactly the same, there is no same efficiency value in virtual frontier SBM model results. The decision-making unit can be identified through two features. In summary, this method is significant to distinguish the performance evaluation of the prefabricated building supply chain via the virtual frontier SBM model, because it effectively identifies the performance value of each supply chain and annual change of the performance value [45].

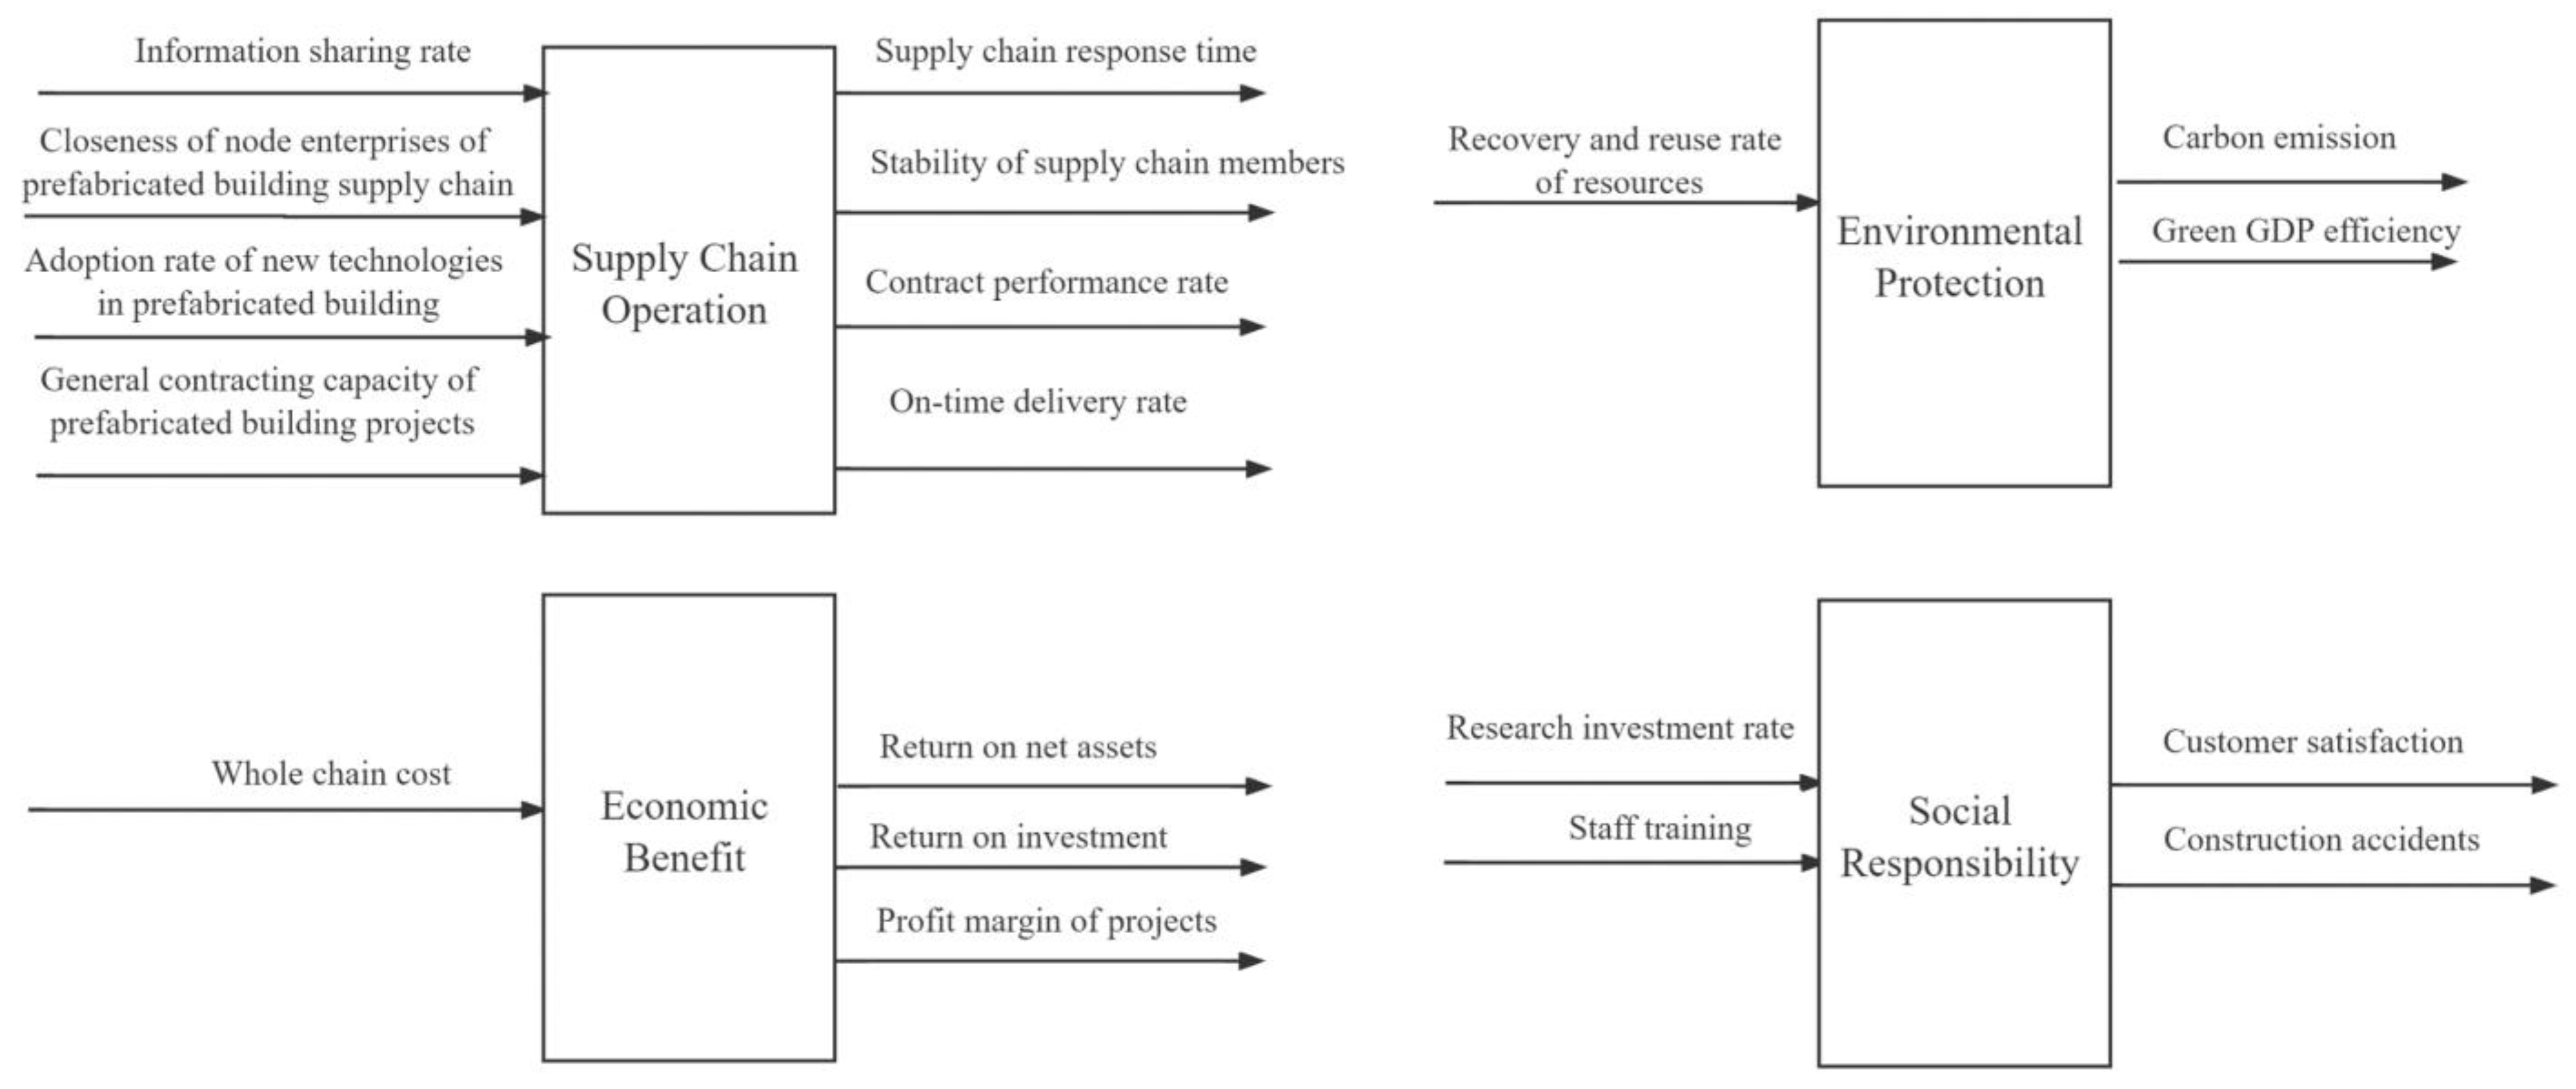
3.3.2. Establishment of Performance Evaluation Model of Supply Chain

According to the final indicator system in Table 4, input–output indicators are designed. As shown in Figure 8, a virtual frontier SBM–DEA evaluation model is built to assess the supply chain performance of prefabricated building, with supply chain operation sub-unit as an example. According to Equations (11) and (12):
ρ I 0 * = min λ , s , s + 1 ( 1 4 ) ( s 0 ISR I S R 0 + s 0 C C 0 + s 0 A R A R 0 + s 0 G C C G C C 0 ) 1 + ( 1 4 ) ( s 0 S C R T S C R T 0 + s 0 S S C M S S C M 0 + s 0 C P R C P R 0 + s 0 O T D R O T D R 0 )
s . t . { I S R 0 = j = 1 n V I S R j λ j + s 0 I S R C 0 = j = 1 n V C j λ j + s 0 C A R 0 = j = 1 n V A R j λ j + s 0 A R G C C 0 = j = 1 n V G C C j λ j + s 0 G C C S C R T 0 = j = 1 n V S C R T j η j s 0 S C R T S S C M 0 = j = 1 n V S S C M j η j s 0 S S C M C P R 0 = j = 1 n V C P R j η j s 0 C P R O T D R 0 = j = 1 n V O T D R j η j s 0 O T D R
Variable description:
  • ISR0 (Information Sharing Rate) represents the information sharing rate of enterprises in the supply chain, and it serves as an input to the supply chain operation sub-unit.
  • C0 (Closeness of node enterprises of prefabricated building supply chain) means the closeness of node enterprises in the supply chain, and it serves as the input of the supply chain operation sub-unit.
  • AR0 (Adoption rate of new technologies in prefabricated building) indicates the degree of intelligence of prefabricated buildings, and it serves as an input for the supply chain operation sub-unit.
  • GCC0 (General contracting capacity of prefabricated building projects) is the general contracting capacity of prefabricated building projects, and it serves as an input for the supply chain operation sub-unit.
  • SCRT0 (Supply Chain Response Time) stands for response time of the supply chain, and it serves as the output of the supply chain operation sub-unit.
  • SSCM0 (Stability of supply chain members) means the stability of supply chain members, and it serves as the output of the supply chain operation sub-unit.
  • CPR0 (Contract Performance Rate) is contract performance rate, and it serves as the output of the supply chain operation sub-unit.
  • OTDR0 (On-time delivery rate) indicates the on-time delivery rate, and it serves as the output of the supply chain operation sub-unit.
  • λj represents weight of investment.
  • ηj is weight of output.
  • VISRj indicates virtual information sharing rate, V I S R j = 0.95 × m i n j ( I S R j )
  • VCj means closeness of virtual node enterprises, V E C j = 0.95 × m i n j ( E C j )
  • VARj stands for virtual degree of intelligence, V D I j = 0.95 × m i n j ( D I j )
  • VGCCj is virtual general contracting capability of projects, V G C C P j = 0.95 × m i n j ( G C C P j )
  • VSCRTj means virtual supply chain response time, V S C R T j = 1.05 × m a x j ( S C R T j )
  • VSSCMj represents virtual supply chain member stability, V S C M S j = 1.05 × m a x j ( S C M S j )
  • VCPRj is virtual contract performance rate,   V C P R j = 1.05 × m a x j ( C P R j )
  • VOTDRj represents virtual delivery rate on time, V D R O T j = 1.05 × m a x j ( D R O T j )

4. Case Study

How does one prove the proposed evaluation system is effective and better than other systems? Generally speaking, actual cases or projects are required to prove that it can be applied to provide effective guidance [46]. The performance evaluation method (virtual frontier SBM–DEA method) is an improvement based on the traditional DEA method. Therefore, a specific case is needed to prove whether this improved method is effective, so as to provide guidance on management for more enterprises in the future. In this paper, a prefabricated building developer was adopted as the research object, because it has adequate supply chain data and the authenticity and validity of the data are guaranteed. On one hand, the characteristics of the company’s supply chain conform to the requirements of the study: (1) there are financial institutions, design units, construction units, developers, parts suppliers, material suppliers, supervisors and users, etc., on its supply chain. (2) Its supply chain is long with stable suppliers. Therefore, the use of year as the unit in performance evaluation conforms to the requirements.
Shuangyashan Chengxiang Real Estate Development Company (Shuangyashan, Heilongjiang, China) is a prefabricated building developer, with more than ten prefabricated building projects. This study investigated supply chains involved in this company, and particularly analyzed 14 supply chains. Next, data were collected according to variables required by the DEA model, and processed by min–max standardization according to Equation (13) [47]:
y i = 0.1 + 0.9 x i m i n 1 j n { x j } m a x 1 j n { x j } m i n 1 j n { x j }
Data were analyzed on DEAP software through the virtual frontier SBM–DEA method and traditional SBM–DEA method, with calculation results shown in Table 5 and Table 6.
Taking the A supply chain as a case, this study collected relevant data for 5 years, and, with 2016 as a benchmark, applied the virtual frontier SBM–DEA method to calculate performance change in five years on DEAP software. The calculation results are listed in Table 7 and Figure 9.

5. Discussion

The study aimed to establish a more scientific and sustainable performance evaluation system for the supply chain of prefabricated building, and evaluated the performance. First of all, 34 factors were collected that affected the performance of prefabricated buildings, and their weights were calculated by the SEM method. According to the results, four sub-units (supply chain operation, economic benefits, environmental protection, social responsibility) were ranked from large to small based on importance degree: supply chain operation > economic benefits > environmental protection > social responsibility. Factors that greatly impacted performance referred to the general contracting capacity of prefabricated building projects, return on investment, cost of whole chain, carbon emissions, green GDP efficiency, customer satisfaction and construction accidents. Impact factors with low weight were eliminated, and the final performance evaluation indicator system was formed, with a total of 19 impact factors.
The results signified that, in the supply chain operation sub-unit, focus should be placed on the information sharing rate between enterprises in the supply chain, collaboration degree, degree of intelligence of the supply chain, and supply chain response time. For enterprises, they should pay more attention to the operation of supply chain, improve project resources utilization in all aspects, and achieve optimized configuration of resources [48]. At the same time, it is necessary to ensure upstream and downstream cooperative enterprises that the entire prefabricated building supply chain collaborates closely, maximizes benefits and boosts competitive advantage [49]. On the other hand, the sustainable supply chain will be an inevitable trend, which implies that enterprises can evaluate the bottom line of financial benefits produced by their own supply chains, but more importantly, take into account social ethics and environmental performance [50]. The cost of the whole chain and economic benefits must be considered in the economic benefit sub-unit. In the environmental protection sub-unit, enterprises in the supply chain should use environmentally friendly materials, emphasize recycling and utilization of PC components, and reduce carbon emissions during construction [51]. In the social responsibility sub-unit, supply chain enterprises are required to assume social responsibilities, and highly value the satisfaction of customers and employees. Furthermore, they are recommended to increase funding for scientific research, improve the public’s credibility in society, and establish corporate culture [52].
Subsequently, it established a performance evaluation model of the virtual frontier SBM–DEA, analyzed through actual cases, and made a comparison on differences between the improved method and the traditional method. The results proved that performance of many supply chain operation sub-units obtained by the traditional method was 1, but it was impossible to distinguish performance rankings of supply chains. However, in the virtual frontier SBM method, no performance was 1, and the value obtained was smaller. The improved method was able to more clearly distinguish the performance [53]. In the meantime, horizontally, performance of 14 supply chains in enterprises was compared. It indicated from the results performance that supply chains B and C were the best, but they performed poorly in terms of environmental protection. In future projects, more attention will be paid to environmental protection, so as to realize long-term development. Vertically, performance changes of supply chain A were discussed over the past five years. The results explained that changes in each sub-unit were the same as those in the performance of the whole chain. Specifically, they were in an upward trend in 2017 and 2019, but declined in 2018 and 2020. The performance changes of supply chain sub-units tended to be stable. Under this circumstance, enterprises should find out reasons for the performance decline based on realities, and prepare well for the future
According to the experience of the British construction industry, supply chain management helps lower infrastructure costs, shorten the construction period, reduce defects and accidents, improve predictability of the construction period and cost, and increase labor productivity, output value and profits [54]. The final direction for prefabricated building supply chain management must be the integrated supply chain dynamic alliances, which are called supply chain communities, and the strategic goals and development goals are about to occupy a leading position in the market [55]. Hence, in terms of performance improvement of the supply chain, enterprises should attach importance to sustainability management of the supply chain, and consider corporate long-term interests and long-term development potential as top priorities from a strategic perspective. Only in this way can enterprises develop steadily in today’s turbulent society.

6. Conclusions

Extensive construction and a management model caused by large-scale construction is intensifying environmental pollution and resource consumption, which seriously restricts the implementation of a sustainable development strategy in China’s construction industry. Fortunately, prefabricated buildings advocate environmental protection in the whole life cycle of buildings, which is expected to effectively reduce consumption and pollution. At the same time, the construction supply chain is a bond that connects all links of energy conservation and environmental protection, and is also an effective way to facilitate green development of the construction industry. Therefore, it is essential to investigate the performance evaluation of the prefabricated building supply chain from the angle of sustainable development. However, management of all links in the supply chain is ignored, and the supply chain system is troubled by serious fragmentation, a low degree of corporate relevance, and poor environmental protection capabilities of member enterprises, which go against green transformation development policies in China.
Firstly, this study introduced components of the prefabricated building supply chain and its operation process, summarized previous research on performance evaluation of the supply chain, and proposed a set of performance evaluation systems in line with sustainable development. Moreover, it constructed an evaluation indicator system by the SEM method, and evaluated the indicator system through the virtual frontier SBM–DEA method. Horizontally, performance between supply chains was assessed, as were dynamic changes of a certain supply chain in time dimension vertically. In practices, it selected a prefabricated building developer as a core enterprise, to evaluate performance of the supply chain, and provide guidance on corporate management. The research results showed that, among 14 supply chains, most performed badly in environmental protection. Economic benefits were brought at the expense of the natural environment, seriously harming long-term development of the enterprise. In future, enterprises should raise their awareness of environmental protection, in order to go further.
In general, there are shortcomings and space to be improved in this study. For example, the indicator system is only applicable to China’s policy environment and is not compatible with other countries. This study evaluates the performance of supply chains, and finds their strengths and weaknesses rather than performance of a supply chain in a certain period alone. Therefore, in future studies, scholars should pay particular attention to these aspects.

Author Contributions

Conceptualization, S.Z.; data curation, M.Y.; formal analysis, S.Z.; methodology, J.W.; software, Q.H.; writing—original draft, S.Z. and X.S. All authors have read and agreed to the published version of the manuscript.

Funding

This study was supported by National key R&D projects, grant number (2018YFC0704301), the Science and Technology Project of Wuhan Urban and Rural Construction Bureau, China (201943), Research on theory and application of prefabricated building construction management (20201h0439); Wuhan Mo Dou construction consulting Co., Ltd. (20201h0414), Pre-liminary Study on the Preparation of the 14th Five-Year Plan for Housing and Urban-Rural Development in Hubei Province (20202s0002).

Institutional Review Board Statement

Not applicable.

Informed Consent Statement

Informed consent was obtained from all subjects involved in the study.

Data Availability Statement

The case analysis data used to support the findings of this study are available from the corresponding author upon request.

Conflicts of Interest

The authors declare no conflict of interest.

References

  1. Chan, L.F.; Wu, G.; Zhang, Y.B. Construction enterprise supply chain design research. In Proceedings of the International Conference on Mechatronics and Materials Processing (ICMMP), Guangzhou, China, 18–20 November 2011. [Google Scholar]
  2. Chen, X.; Tang, J.Y. Application of improved data envelopment analysis in construction supply chain management. In Proceedings of the 3rd International Conference on Civil, Architectural and Hydraulic Engineering (ICCAHE), Hangzhou, China, 30–31 July 2014. [Google Scholar]
  3. Li, R.J.; Liu, A.M. Study an circular economy-oriented building energy efficiency. In Proceedings of the International Conference on Construction and Real Estate Management, Bristol, UK, 21–22 August 2007. [Google Scholar]
  4. Akhimien, N.G.; Latif, E.; Hou, S.S. Application of circular economy principles in buildings: A systematic review. J. Build. Eng. 2020, 38, 102041. [Google Scholar] [CrossRef]
  5. Arashpour, M.; Bai, Y.; Aranda-Mena, G.; Bab-Hadiashar, A.; Hosseini, R.; Kalutara, P. Optimizing decisions in advanced manufacturing of prefabricated products: Theorizing supply chain configurations in off-site construction. Autom. Constr. 2017, 84, 146–153. [Google Scholar] [CrossRef]
  6. Ebrahimy, Y.; Abourizk, S.M.; Fernando, S.; Mohamed, Y. Simphony Supply Chain Simulator: A Simulation Toolkit to Model the Supply Chain of Construction Projects. Simulation 2011, 87, 657–667. [Google Scholar] [CrossRef]
  7. King, E. Global Academy, London: How offsite modular construction is reshaping education. Proc. Inst. Civ. Eng. Civ. Eng. 2020, 173, 35–38. [Google Scholar] [CrossRef]
  8. Liu, Y.; Dong, J.; Shen, L. A Conceptual Development Framework for Prefabricated Construction Supply Chain Management: An Integrated Overview. Sustainability 2020, 12, 1878. [Google Scholar] [CrossRef] [Green Version]
  9. Steinhardt, D.; Manley, K.; Bildsten, L.; Widen, K. The structure of emergent prefabricated housing industries: A comparative case study of Australia and Sweden. Constr. Manag. Econ. 2019, 38, 483–501. [Google Scholar] [CrossRef]
  10. Manley, K.; Widen, K. Prefabricated housing firms in Japan and Sweden: Learning from leading countries. In Offsite Production and Manufacturing for Innovative Construction—People Process, and Technology, 1st ed.; Goulding, J.S., Rahimian, F.P., Eds.; Routledge: London, UK, 2019; pp. 399–418. [Google Scholar]
  11. Lessing, J.; Brege, S. Business models for product-oriented house-building companies—Experience from two Swedish case studies. Constr. Innov. 2015, 15, 449–472. [Google Scholar] [CrossRef]
  12. Ekanayake, E.M.A.C.; Shen, G.Q.P.; Kumaraswamy, M.M. Identifying supply chain capabilities of construction firms in industrialized construction. Prod. Plan. Control 2020, 32, 303–321. [Google Scholar] [CrossRef]
  13. Farajmandi, M.; Ali, M.; Hermann, R.; Abourizk, S. A Decision Support Tool for Planning Module Installation in Industrial Construction. Eng. Constr. Arch. Manag. 2020, 27, 2615–2641. [Google Scholar] [CrossRef]
  14. Cheng, J.C. A web service framework for measuring and monitoring environmental and carbon footprintin construction supply chain. Procedia Eng. 2011, 14, 141–147. [Google Scholar] [CrossRef] [Green Version]
  15. Demiralp, G.; Guven, G.; Ergen, E. Analyzing the Benefits of Rfid Technology for Cost Sharing in Construction Supply Chains: A Case Study on Prefabricated Precast Components. Autom. Constr. 2012, 24, 120–129. [Google Scholar] [CrossRef]
  16. Eriksson, P.E. Partnering in Engineering Projects: Four Dimensions of Supply Chain Integration. J. Purch. Supply Manag. 2015, 21, 38–50. [Google Scholar] [CrossRef] [Green Version]
  17. Shin, T.-H.; Chin, S.; Yoon, S.-W.; Kwon, S.-W. A service-oriented integrated information framework for RFID/WSN-based intelligent construction supply chain management. Autom. Constr. 2011, 20, 706–715. [Google Scholar] [CrossRef]
  18. Zhu, M.Q.; Zou, Z.X. Green supply chain management in construction industry. In Proceedings of the International Conference on Computing, Information and Control (ICCIC), Wuhan, China, 17–18 September 2011. [Google Scholar]
  19. Kamali, M.; Hewage, K. Development of Performance Criteria for Sustainability Evaluation of Modular Versus Conventional Construction Methods. J. Clean. Prod. 2017, 142, 3592–3606. [Google Scholar] [CrossRef]
  20. Chang, C.G.; Zhao, T. Gt-sem-based safety risk mechanism of prefabricated construction. In Proceedings of the 12th International Conference on Communication Software and Networks (ICCSN), Chongqing, China, 12–15 June 2020. [Google Scholar] [CrossRef]
  21. Li, X.J. Research on Investment Risk Influence Factors of Prefabricated Building Projects. J. Civ. Eng. Manag. 2020, 26, 599–613. [Google Scholar] [CrossRef]
  22. Wang, X.; Jiang, C.; Sun, D. Research on performance measurement of prefabricated housing supply chain based on network DEA. Build. Econ. 2017, 38, 89–94. [Google Scholar]
  23. Kim, S.-Y.; Nguyen, V.T. A Structural model for the impact of supply chain relationship traits on project performance in construction. Prod. Plan. Control 2017, 29, 170–183. [Google Scholar] [CrossRef]
  24. Mafini, C.; Poobie, P. A Diagnostic Review of the Barriers to Supply Chain Management in Construction Supply Chains. In Proceedings of the 6th IISES Business and Management Conference, Geneva, Switzerland, 27–30 June 2017. [Google Scholar]
  25. Kim, Y.-W.; Han, S.-H.; Yi, J.-S.; Chang, S. Supply chain cost model for prefabricated building material based on time-driven activity-based costing. Can. J. Civ. Eng. 2016, 43, 287–293. [Google Scholar] [CrossRef]
  26. Liu, K.; Su, Y.; Zhang, S. Evaluating Supplier Management Maturity in Prefabricated Construction Project-Survey Analysis in China. Sustainability 2018, 10, 3046. [Google Scholar] [CrossRef] [Green Version]
  27. Ekanayake, E.M.A.C.; Shen, G.Q.; Kumaraswamy, M.M.; Owusu, E.K.; Saka, A.B. Modeling Supply Chain Resilience in Industrialized Construction: A Hong Kong Case. J. Constr. Eng. Manag. 2021, 147, 11. [Google Scholar] [CrossRef]
  28. Chen, Q.; Hall, D.M.; Adey, B.T.; Haas, C.T. Identifying enablers for coordination across construction supply chain processes: A systematic literature review. Eng. Constr. Arch. Manag. 2020, 28, 1083–1113. [Google Scholar] [CrossRef]
  29. Hsu, P.-Y.; Aurisicchio, M.; Angeloudis, P. Risk-averse supply chain for modular construction projects. Autom. Constr. 2019, 106, 102898. [Google Scholar] [CrossRef]
  30. Lyons, R.E.; Roulstone, A.R.M. Production learning in a small modular reactor supply chain. In Proceedings of the International Congress on Advances in Nuclear Power Plants, Charlotte, NC, USA, 8–11 April 2018; pp. 1034–1041. [Google Scholar]
  31. Wuni, I.Y.; Shen, G.Q. Critical success factors for modular integrated construction projects: A review. Build. Res. Inf. 2020, 48, 763–784. [Google Scholar] [CrossRef]
  32. Liu, A.; Xiaohui, L. Research on the construction of a comprehensive performance evaluation index system of an integrated construction supply chain. In Proceedings of the International Conference on Construction and Real Estate Management (ICCREM), Lulea, Sweden, 11–12 August 2015. [Google Scholar]
  33. Cheng, J.C.; Law, K.H.; Bjornsson, H.; Jones, A.; Sriram, R.D. Modeling and monitoring of construction supply chains. Adv. Eng. Inform. 2010, 24, 435–455. [Google Scholar] [CrossRef] [Green Version]
  34. Chen, Y.; Leishan, Z. Community property analysis and optimization in cooperative construction supply chain networks. In Proceedings of the International Conference on Construction and Real Estate Management, Bristol, UK, 21–22 August 2007. [Google Scholar]
  35. Rosete, J.C.G.-P.; Barros, R.H.; Blanco-Jiménez, M. SEM analysis on Global Fortune 500 Corporations with green ratings. Energy Effic. 2020, 13, 1135–1145. [Google Scholar] [CrossRef]
  36. Deng, M.R.; Zhang, L.J. A systematic study on supply chain collaboration in construction. In Proceedings of the International Conference on Construction and Real Estate Management, Penang, Malaysia, 12–13 December 2005. [Google Scholar]
  37. Di, C.; Ziyou, G. The scale-free property and its weight of construction supply chain networks. In Proceedings of the International Conference on Construction and Real Estate Management, Bristol, UK, 21–22 August 2007. [Google Scholar]
  38. Ashuri, B.; Wang, J.; Shahandashti, M.; Baek, M. A data envelopment analysis (DEA) model for building energy benchmarking. J. Eng. Des. Technol. 2019, 17, 747–768. [Google Scholar] [CrossRef]
  39. Luo, L.Z.; Shen, G.Q.; Xu, G.Y.; Liu, L.Y.; Wang, Y. Stakeholder-Associated Supply Chain Risks and Their Interactions in a Prefabricated Building Project in Hong Kong. J. Manag. Eng 2019, 35, 05018015. [Google Scholar] [CrossRef]
  40. Gao, F. Research on risk analysis and control of construction supply chain. In Proceedings of the 4th International Conference on Operations and Supply Chain Management/15th Annual Meeting of the Asia-Pacific-Decision-Sciences-Institute, Hong Kong, China, 25–31 July 2010. [Google Scholar]
  41. Hou, X.P.; Wang, Y.W.; Zhang, Y.; Zhang, Y.J. Research on the construction supply chain management based on neural network. In Proceedings of the International Conference on Construction and Real Estate Management, Penang, Malaysia, 12–13 December 2005. [Google Scholar]
  42. Hu, J. The research on supply chain management in public construction project. In Proceedings of the International Conference on Construction and Real Estate Management, Bristol, UK, 21–22 August 2007. [Google Scholar]
  43. Masood, R.; Lim, J.B.; González, V.A. Performance of the supply chains for New Zealand prefabricated house-building. Sustain. Cities Soc. 2020, 64, 102537. [Google Scholar] [CrossRef]
  44. Kahkonen, K.; Koskela, L.; Leinonen, J.; Aromaa, P. Supply chain management aspects for top quality industrial construction. In Proceedings of the 10th International Symposium on Construction Innovation and Global Competitiveness, Cincinnati, OH, USA, 9–13 September 2002. [Google Scholar]
  45. Moon, S.; Zekavat, P.R.; Bernold, L.E. Dynamic Control of Construction Supply Chain to Improve Labor Performance. J. Constr. Eng. Manag. 2015, 141, 5015002. [Google Scholar] [CrossRef]
  46. Luo, L.; Jin, X.; Shen, G.Q.; Wang, Y.; Liang, X.; Li, X.; Li, C.Z. Supply Chain Management for Prefabricated Building Projects in Hong Kong. J. Manag. Eng. 2020, 36, 05020001. [Google Scholar] [CrossRef]
  47. Hu, W.; Xinhua, H. Communication improvement for integrated construction supply chain management systems. In Proceedings of the International Conference on Logistics Engineering and Supply Chain, Changsha, China, 20–22 August 2008. [Google Scholar]
  48. Huang, C. A study of the application of supply chain management in construction industry. In Proceedings of the 12th Wuhan International Conference on E-Business, Wuhan, China, 29–31 October 2013. [Google Scholar]
  49. Jin, M.H.; Wang, Y.W. Study on the framework of construction supply chain quality management. In Proceedings of the International Conference on Construction and Real Estate Management, Penang, Malaysia, 12–13 December 2005. [Google Scholar]
  50. Liu, S.; Mansoor, A.; Bouferguene, A.; Al-Hussein, M. The performance evaluation of different modular construction supply chain configurations using discrete event simulation. In Proceedings of the Construction Research Congress (CRC) on Construction Research and Innovation to Transform Society, Tempe, AZ, USA, 8–10 March 2020. [Google Scholar]
  51. Cheng, B.; Lu, K.; Li, J.; Chen, H.; Luo, X.; Shafique, M. Comprehensive assessment of embodied environmental impacts of buildings using normalized environmental impact factors. J. Clean. Prod. 2022, 334, 130083. [Google Scholar] [CrossRef]
  52. Pan, N.-H.; Lee, M.-L.; Chen, S.-Q. Construction Material Supply Chain Process Analysis and Optimization. J. Civ. Eng. Manag. 2011, 17, 357–370. [Google Scholar] [CrossRef] [Green Version]
  53. Li, X.D.; Zhang, Y.J.; Hou, X.P. The comparative research on construction supply chain management and manufacturing supply chain management. In Proceedings of the International Conference on Construction and Real Estate Management, Penang, Malaysia, 12–13 December 2005. [Google Scholar]
  54. Xie, L.L.; Chen, Y.J.; Chang, R.D. Scheduling Optimization of Prefabricated Construction Projects by Genetic Algorithm. Appl. Sci. 2021, 11, 5531. [Google Scholar] [CrossRef]
  55. Li, W.Q.; Wang, Y.W.; Zhao, X.F. A framework for construction supply chain operations reference-model. In Proceedings of the International Conference on Construction and Real Estate Management, Penang, Malaysia, 12–13 December 2005. [Google Scholar]
Figure 1. Prefabricated Building Supply Chain process.
Sustainability 14 01299 g001
Figure 2. Performance Evaluation System for Prefabricated Building Supply Chain.
Sustainability 14 01299 g002
Figure 3. Job Positions and Work Experience Distribution of Respondents.
Sustainability 14 01299 g003
Figure 4. SEM Model Diagram.
Sustainability 14 01299 g004
Figure 5. Initial SEM Model.
Sustainability 14 01299 g005
Figure 6. Revised SEM Model.
Sustainability 14 01299 g006
Figure 7. Virtual Frontier DEA.
Sustainability 14 01299 g007
Figure 8. Input–output Indicator Model.
Sustainability 14 01299 g008
Figure 9. A supply chain performance curve from 2016 to 2020.
Sustainability 14 01299 g009
Table 1. Comparison between Supply Chain of Prefabricated Building, Manufacturing and Traditional Building.
Supply Chain of Prefabricated BuildingSupply Chain of
Traditional Building
Supply Chain of
Manufacturing
Production modeMake-to-orderBuild to projectProduction according to market forecast
Production characteristicsMass repetitive manufacturingOne-time production and non-reproducibilityMass production and large-scale replication
Place of productionFactory production, on-site assemblyMaterials are manufactured on the construction siteMade in the factory
DesignLess design changesMore design changesBasically unchanged design
Table 2. Primary Indicator System.
Latent VariableS/NObserved VariableS/N
Supply Chain OperationSCOFlexible scheduleSCO1
Rate of excellent engineering qualitySCO2
Project winning rateSCO3
Supply chain response timeSCO4
Rate of qualified productsSCO5
Information sharing rateSCO6
Risk control capability of prefabricated building enterprisesSCO7
Closeness of node enterprises of prefabricated building supply chainSCO8
Adoption rate of new technologies in prefabricated buildingSCO9
General contracting capacity of prefabricated building projectsSCO10
Stability of supply chain membersSCO11
Contract performance rateSCO12
On-time delivery rateSCO13
Economic BenefitsEBProfit growth rateEB1
Rate of return on total assetsEB2
Labor productivityEB3
Return on net assetsEB4
Return on investmentEB5
Profit margin of projectsEB6
Whole chain costEB7
Environmental ProtectionEPPollutant discharge rateEP1
Green procurement rateEP2
Carbon emissionEP3
Green GDP efficiencyEP4
Recovery and reuse rate of resourcesEP5
Resource saving rateEP6
Environmental impactEP7
Social ResponsibilitySREmployee satisfactionSR1
Customer satisfactionSR2
Staff trainingSR3
Construction accidentsSR4
Social contributionSR5
Research investment rateSR6
Social credibilitySR7
Table 3. Weight of influencing factors.
Latent VariableWeightObservation VariableWeightResult
Supply Chain OperationSCO0.3Flexible scheduleSCO10.07delete
Rate of excellent engineering qualitySCO20.07delete
Project winning rateSCO30.07delete
Supply chain response timeSCO40.08reserve
Rate of qualified
products
SCO50.07delete
Information sharing rateSCO60.08reserve
Risk control capability of prefabricated building enterprisesSCO70.07delete
Closeness of node enterprises of prefabricated building supply chainSCO80.08reserve
Adoption rate of new technologies in prefabricated buildingSCO90.08reserve
General contracting capacity of prefabricated building projectsSCO100.09reserve
Stability of supply chain membersSCO110.08reserve
Contract performance rateSCO120.08reserve
On-time delivery rateSCO130.08reserve
Economic BenefitsEB0.26Profit growth rateEB10.12delete
Rate of return on total assetsEB20.14delete
Labor productivityEB30.14delete
Return on net assetsEB40.15reserve
Return on investmentEB50.15reserve
Profit margin of projectsEB60.15reserve
Whole chain costEB70.15reserve
Environmental ProtectionEP0.24Pollutant discharge rateEP10.12delete
Green procurement rateEP20.12delete
Carbon emissionEP30.16reserve
Green GDP efficiencyEP40.16reserve
Recovery and reuse rate of resourcesEP50.16reserve
Resource saving rateEP60.14delete
Environmental impactEP70.14delete
Social ResponsibilitySR0.2Employee satisfactionSR10.14delete
Customer satisfactionSR20.15reserve
Staff trainingSR30.15reserve
Construction accidentsSR40.15reserve
Social contributionSR50.12delete
Research investment rateSR60.15reserve
Social credibilitySR70.14delete
Table 4. Final Indicator System.
Latent VariableMeasurement Variable
Supply chain operationSCOSupply chain response timeSCO4
Information sharing rateSCO6
Closeness of node enterprises of prefabricated building supply chainSCO8
Adoption rate of new technologies in prefabricated buildingSCO9
General contracting capacity of prefabricated building projectsSCO10
Stability of supply chain membersSCO11
Contract performance rateSCO12
On-time delivery rateSCO13
Economic BenefitsEBReturn on net assetsEB4
Return on investmentEB5
Profit margin of projectsEB6
Whole chain costEB7
Environmental ProtectionEPCarbon emissionEP3
Green GDP efficiencyEP4
Recovery and reuse rate of resourcesEP5
Social ResponsibilitySRCustomer satisfactionSR2
Staff trainingSR3
Construction accidentsSR4
Research investment rateSR6
Table 5. Calculation results of virtual frontier SBM–DEA model.
Supply Chain OperationEconomic BenefitsEnvironmental ProtectionSocial
Responsibility
Total
Performance
C0.980.790.330.980.77
B0.990.980.280.760.77
A0.960.210.990.550.69
M0.970.110.950.530.65
N0.960.120.400.980.61
G0.910.130.940.410.61
K0.960.680.180.510.61
E0.980.200.220.990.60
J0.960.050.210.990.55
H0.930.210.320.630.54
L0.980.070.430.580.53
D0.990.100.500.410.52
I0.910.040.150.910.50
F0.890.030.180.450.41
Table 6. Calculation results of traditional SBM–DEA model.
Supply Chain NameSupply Chain OperationEconomic BenefitsEnvironmental ProtectionSocial
Responsibility
Total
Performance
C1.001.000.331.000.84
B1.001.000.280.760.78
A1.000.321.000.550.73
M1.000.181.000.530.69
K0.960.910.190.510.67
N1.000.190.401.000.65
E1.000.310.231.000.64
G0.900.200.920.410.62
H1.000.390.330.630.60
J1.000.100.221.000.58
L1.000.110.440.580.55
D1.000.160.500.410.54
I0.900.080.160.910.51
F1.000.050.190.450.45
Table 7. Performance changes of a supply chain in 2016–2020.
TimeSupply Chain
Operation
Economic BenefitsEnvironmental
Protection
Social
Responsibility
Total Performance
201611111
20171.501.941.571.201.57
20180.740.060.060.400.33
20190.941.331.331.621.27
20200.970.320.320.150.48
Publisher’s Note: MDPI stays neutral with regard to jurisdictional claims in published maps and institutional affiliations.

