Article

Circular Economy Projects and Firm Disclosures in an Encouraging Institutional Environment

by
Isabel-María García-Sánchez
1,*,
Francisco-Manuel Somohano-Rodríguez
2,
Víctor Amor-Esteban
3 and
Benito Gonzalez-Valdueza
4
1
Instituto Multidisciplinar de Empresa—IME, Universidad de Salamanca, Campus Miguel de Unamuno, Paseo Francisco Tomás y Valiente, s/n, Edificio FES, 37007 Salamanca, Spain
2
Departamento de Administración de Empresas, Universidad de Cantabria, Avda. de los Castros 56, 39005 Santander, Spain
3
Departamento de Estadística, Universidad de Salamanca, Campus Miguel de Unamuno, c/Alfonso X El Sabio, s/n, 37007 Salamanca, Spain
4
Facultad de Economía y Empresa, Universidad de Salamanca, Campus Miguel de Unamuno, Paseo Francisco Tomás y Valiente, s/n, 37007 Salamanca, Spain
*
Author to whom correspondence should be addressed.
Sustainability 2022, 14(3), 1149; https://doi.org/10.3390/su14031149
Submission received: 7 December 2021 / Revised: 10 January 2022 / Accepted: 13 January 2022 / Published: 20 January 2022
(This article belongs to the Special Issue Ecological Transition and Circular Economy)

Abstract

:
This paper analyses the strategies implemented by listed Spanish companies that are leaders in their industrial environments to inform shareholders and the public about their circular economy projects. It uses content and textual approaches through the factorial correspondence analysis of all the information about the circular economy presented on corporate websites. The analysis of the 17,510 resulting terms suggests that companies prioritise discourses about a sustainable future, their commitment to the proper use of resources and the reduction or elimination of greenhouse gases. The sectors most sensitive to institutional pressures, such as oil and energy companies, are more active in disclosing the problems and desired solutions of their projects.

1. Introduction

Our world is technologically and scientifically connected. We know that the industrial revolution has had very positive effects overall in the reduction of poverty and the improvement of well-being, but it has also had negative effects, such as environmental degradation. Transition to the circular economy (CE) is a technical evolution from the linear production–consumption model. The circular economy interconnects business cycles to maintain the value of products and services as long as possible, diminishes production costs by reducing the flow of materials (raw materials are replaced with recycled ones), saves energy and is based on the idea that natural and social capital must be constantly renewed through multiple phases [1,2]. CE is one of the pillars of sustainable policies in many countries, especially those in the European Union, and it is an important driver of the transition towards global sustainability. The NextGenerationEU Plan establishes circular transformation as one of the engines of a post-COVID-19 economic recovery through a package of measures (structural funds, research and innovation financing programmes and others). It is part of the Green Deal or the European Green Pact to help European businesses and consumers transition to a more sustainable economy and the Eurozone’s roadmap for designing strategic recovery and resilience plans for a green, digital and climate-resilient future [3].
European institutions understand that the current system of production and consumption does not environmentally bring into equilibrium raw materials, consumption, goods produced and consumed, and the waste generated. Hence, an ecological transition is an evolution from a polluting production model to a more environmentally friendly one, driving the sustainable development objectives in economic, social and environmental dimensions. It requires integrating “sustainable circularity” into the socioeconomic system to ensure that the regenerative management of the resource–waste cycle improves competitiveness, creates new jobs, reduces dependence on raw materials and minimises environmental impacts.
The CE model increases the efficient use of resources, minimising waste and emissions (reduce, reuse, recycle) in favour of an extended “R-Typology” (reject, rethink, repair, renew, remanufacture, retrofit, recover). In Spain, the Ministry for Ecological Transition and Demographic Challenge (MITECO) has developed the Recovery, Transformation and Resilience Plan to reactivate an economy affected by the COVID-19 pandemic. This plan has four fundamental pillars: ecological transition, digital transformation, social and territorial cohesion and equality. The Spanish Circular Economy Strategy (EEEC), Spain Circular 2030, lays the foundations for a new production and consumption model where the value of products, materials and resources is maintained in the economy for as long as possible, waste generation is reduced to a minimum and unavoidable waste is used to the greatest extent possible. This strategy thus contributes to Spain’s efforts to achieve a sustainable, decarbonised, resource-efficient and competitive economy.
The CE has received little attention from the academic community until recently. Currently, however, quite a lot of research has appeared considering different aspects of the CE, such as the efficient use of materials and their productivity [4,5,6,7,8,9,10], its adoption by countries and sectors [2,11,12,13,14,15,16], business networks [17] and transitions towards the circular model [2]. Once the need for the transition was accepted, authors explored the factors that drive or hinder this process, opening a wide range of opportunities to advance the research. One of these new areas is the analysis of company initiatives in the CE and their real impacts and legitimacy [18,19,20]. Ref. [7] explain that although studies show that social institutions and legitimacy are relevant aspects of the transition to the CE, our understanding of how these factors affect initiatives is still limited.
Economic neo-institutionalism explains that the economic reality of the market is where companies, consumers and governments act. They are all determinants of business decisions and economic results. Therefore, these economic agents are not individualistic, and their decisions are not only determined by rationality since membership in social organisations is conditioned by restrictions inherent to the institutional structure in which they operate [21]. This institutional framework, according to [22], comprises formal and informal rules that guide individual behaviour and reduce uncertainty. Decision-making is aimed at guaranteeing compliance with the coercive, normative and cognitive elements in place. Institutions are, therefore, enforcing the rules of the game, or the constraints conventionally constructed to frame human and organisational interaction in a given society.
Although the CE has a theoretical–conceptual basis, there are still many aspects to research [2]. Among these aspects are why companies select particular CE projects, the effects these projects have on the companies themselves and how they can counteract the negative effect of their corporate activity. The objective of our research is to explain the relationship between institutional pressures and the amount and type of information companies provide about the CE projects they carry out in a proactive and favourable institutional environment. To do this, we have categorised the companies in our sample as symbolic or active according to the real value of the CE information they make publicly available [23], taking the companies’ activity sector into account [24]. Faced with substantive projects, managers may prefer symbolic actions that appear to comply with the rules and thus send signals to stakeholders using a “green discourse” [25,26]. According to our hypothesis, these symbolic messages are stronger in the industries most affected by institutional pressures.
The results show that industrial strategies can be identified in CE disclosures, as they are broader and more detailed in companies that belong to the sectors most sensitive to institutional, especially coercive, pressures, such as the oil and energy industries. Our work makes a significant contribution to the area of corporate information and the CE. It complements previous studies such as those by [16,27,28,29], who found a high correlation between sensitive industries and the sustainable initiatives voluntarily carried out by companies. In fact, our work broadens the application of semantic metrics, i.e., the measurement of distances on the ontology level, focussing on compliance with sustainability indicators in an organisational context [19,20,30,31].

2. Theoretical Framework

The CE implies an evolution of the current economic model characterised by linearity in the extraction, manufacturing, commercialisation, consumption and disposal processes typical of an “open” planet towards a new paradigm of extraction, manufacturing, commercialisation, consumption and reuse (recovery and recycling) of a “limited” planet. On this limited planet, human beings must find their place in a cyclical ecological system capable of continually reconverting materials and conserving their values [32]. The McKinsey Center for Business and Environment and the Ellen MacArthur Foundation explain that the CE has its raison d’être in the best preservation of the usefulness of products, components and materials. It is based on three basic principles [33]: (1) the preservation and appreciation of natural resources through controlling finite reserves and balancing the flows of renewable resources; (2) the optimisation of resource productivity, considering the technical and biological cycles of products, components and materials; (3) improving the efficiency of the system by protecting human well-being with regard to food, mobility, housing, education, health and entertainment and managing land, air, water and noise pollution, the release of toxic substances and climate change.
Why the CE influences companies and how they face the challenge of converting their businesses can be analysed from the perspective of the institutional theory [34], incorporating the social and legitimation aspects of sustainability [35] to explain what factors help and what factors hinder transformation to the CE [7]. According to the resource-based approach (RBV), companies must configure their resources to develop the capacities they need to sustain a competitive advantage, i.e., a competitive advantage depends on the match between distinctive internal capabilities and changing external environmental circumstances [36], such as climate change. Separating institutions into three pillars, based on Scott’s institutional theory [37], we identify three types of institutional pressures (coercive, normative and mimetic) that are exerted on companies by their external environment. These pressures force companies to reconfigure their key resources, and thus, to standardise their functioning [38].
However, in this process, organisations must maintain their competitive advantages and obtain new ones, theoretically through cost reduction, sustainable manufacturing and material circularity [39]. These two approaches, institutionalism and the competitive advantage of RBV, can be addressed in the characterisation of the CE research scenario. Both approaches have been used simultaneously in several studies to consider the environmental and social pressures that can affect the heterogeneity of companies’ environmental strategies [40,41] and their effects on business performance [42,43].
Assuming the positive intention of environmental and social pressures, institutional changes are slow to come about due to, for example, the circumstances noted by [44] that prevent institutional pressures from working well. These circumstances are (1) little regulation regarding reuse and its inconsistent application in different countries; (2) the lack of legal indications beyond recycling, such as for reuse; (3) the lack of a reuse culture and people’s preference for new products. Factors such as the capacities of managers and staff and resource availability also affect the integration of climate change in company strategies, determining the advantages or disadvantages in the transition [45,46,47].
Business initiatives often do not find followers among consumers due to customers’ concerns for their own benefit, health and safety [48] or because these initiatives are not perceived as being beneficial for the environment [49]. From a performance perspective, the changes required of established companies to transform to the CE are significant and costly [50], especially in environmentally sensitive sectors [51]. These affect all organisational levels and include production systems, anticipating impacts, innovating, collaborating both internally and externally, optimising and reporting openly and completely, with clarity, precision, honesty and promptness [52].
Firms often disseminate information to increase the value of their brands [53] and offset the costs of their transition to the CE, at least partially. In doing so, companies can collaborate with external agents and disseminate information on sustainability and CE aspects, among other measures. These actions are part of mimetic institutionalism, and they help legitimise an organisation [54]. For example, although recycling is one of the central processes of a reverse logistics business integrated into the value chain, for a manufacturer, it represents an increase in costs that can become a competitive advantage if this practice is recognised as responsible behaviour by the markets [55]. Therefore, this information is used to capture value [56]. Companies have different ways of increasing the information available to stakeholders to reduce uncertainty and favour company interests by aligning their brands with the social behaviours that are the heart of the transition to a “new” socioeconomic system [57].
The use of information to improve reputations and enhance the value of brands is explained by the signal theory [53], while the legitimacy theory [28,58] posits that the extent of a firm’s disclosures is also a product of the firm’s exposure to public pressure from stakeholder groups in the social, political and regulatory environment. For instance, reputation improvement and brand value enhancement can be carried out internally, motivating workers to create a culture of innovation internally [59], or externally, favouring a culture of sustainability in industry and institutions [60]. Our research is focused on corporations from industries whose activities have a negative influence on the environment (environmentally sensitive industries according to the National Pollutant Release Inventory [61]). In general, corporations from oil and energy and basic material industries (steel, cement and concrete product manufacturing, foundries, etc.) emphasise information on environmental, health and safety issues [62,63]. In a proactive and favourable institutional environment, institutional pressures contribute to the amount and type of information leading companies provide about their CE projects. Thus, our hypothesis is formulated as follows:
Hypothesis 1 (H1).
Corporations from environmentally sensitive industries disclose and report more CE information than firms from other sectors do.
Organisations search their environment for clues about who to follow, looking for emerging leaders who have the prestige and respect to inspire imitation, that is, they engage in institutional mimicry. These emerging leaders align with other leaders, opinion makers and governments, who make up a tacit or explicit network to drive a shift towards the CE, highlighting its environmental benefits to increase consumer acceptance [49]. According to [64], these networks are important to establish subjective norms that shape a social system while spreading new ideas, in this case, about the CE [65]. Rogers identifies structure, opinion leadership and types of decision as the most important areas of interest in social systems, resulting in certain processes being internally created and maintained, linking the elements of the social system to the adoption process. Ultimately, social systems are not action systems derived from an approach based on resources and capabilities and directed by the thoughts and behaviours of people in the organisation. Social systems are communication systems where communication itself determines the process of change [66].
In the following sections, we analyse CE business initiatives and the relationship between institutional pressures and the volume and type of information provided about implemented CE projects.

3. Research Design

3.1. Population and Sample
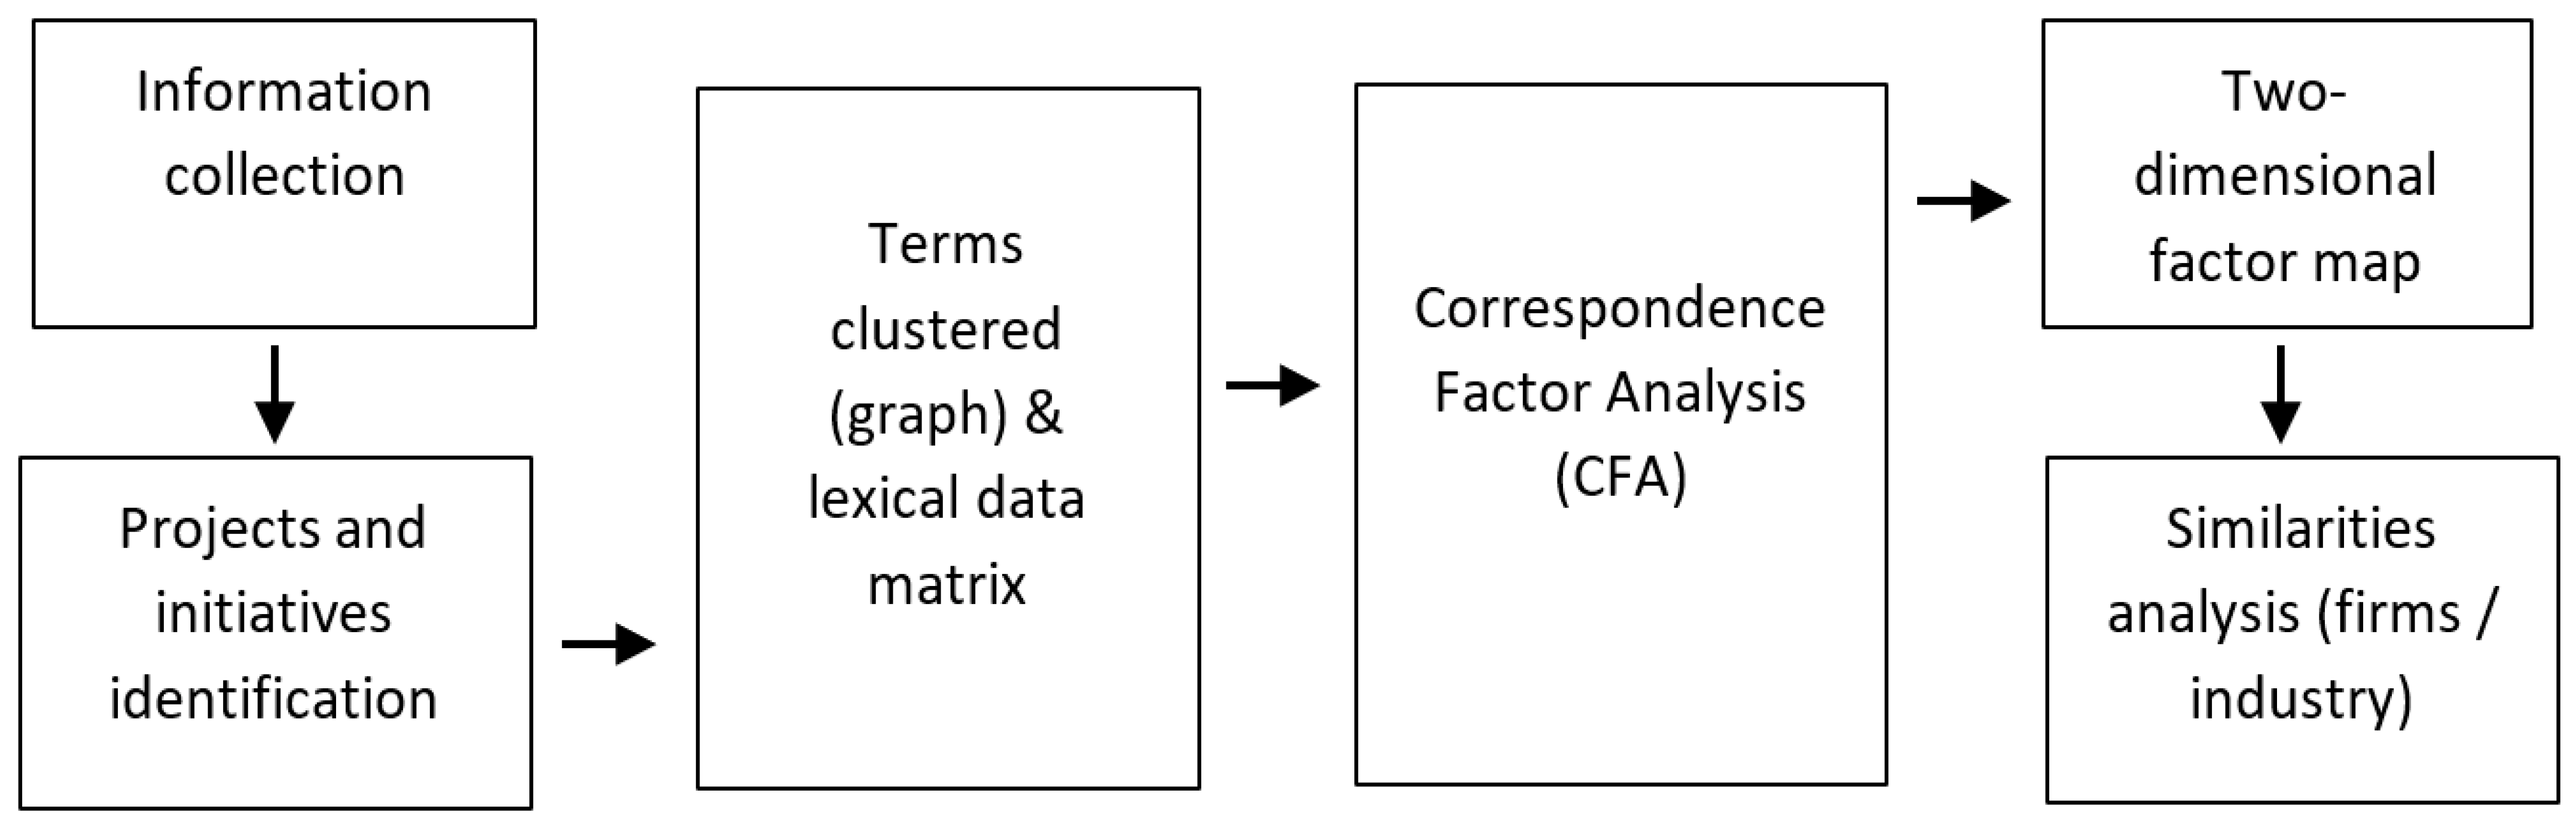
We selected the companies listed on the IBEX-35 of the Madrid Stock Exchange as the target population with which to analyse the initiatives and projects developed in the area of CE and the information disclosed. The reasons for this selection are that these companies operate in the institutional environment established in the previous section, and they are immersed in a system that fosters a sustainable business model by promoting different public initiatives. This framework determines the existence of institutional pressures in favour of circular transformation and, therefore, the decisions that these companies make regarding changes in their economic activity to legitimise themselves in their environment. These companies are also the most liquid and the most active in sustainability issues [29].
Based on the analysis of the information available on these companies’ corporate websites—specific sites and sustainability or similar reports—the analysis sample corresponds to 17 listed Spanish companies operating in all sectors, although the majority are involved in the oil and energy industries (see Table 1, the 13th company today comprises two merged companies). Compared to the population, the companies in the sample represent 52% of the listed companies and are the only ones that offer public information about their current and future circular transformation projects and processes (Appendix A Table A1).

3.2. Methodology

Information for the analysis and identification of the key issues was obtained through content and textual analysis [67,68]. Specifically, the information on the CE was all first disclosed by the companies on their corporate websites and is verbatim. The information was collected in March 2021 and has been subsequently processed using the analysis methodologies indicated below.
Projects, initiatives and other aspects have been identified through content analysis. They allowed us to identify which CE initiatives have been promoted by companies, the CE phase involved and the benefits derived from them. The information downloaded from the websites was also processed through a textual analysis programme based on our own R code. It allowed us to determine the technical and quantitative content of the information reported to stakeholders.
For the textual analysis of information, we applied a descending hierarchical classification according to the method described by [69], where lexical classes are defined, and each one represents a subject that can be described by the vocabulary that defines the subject. By using the proximity of text segments to cluster the terms and identifying the central points of company communiques, we can understand firms’ priorities in terms of circular transformation.
In this analysis, we also constructed a matrix of lexical data, where the rows include the different words used in the reports and the columns include the companies issuing the reports. Their confluence corresponds to absolute frequency. We did not work with this matrix, however, since pre-processing, which consists of eliminating empty words like conjunctions, prepositions, etc. and keeping only semantically loaded elements, was applied to the initial data. Lemmatisation was carried out on this group of elements, reducing several words to a single term based on semantic relationships (e.g., I said, I will say, let us say). Once all the words were obtained, and the data cleaning and debugging processes were complete, we obtained the final lexical data matrix with which we worked.
Given the multidimensional structure of this matrix, we used the correspondence factor analysis (CFA), which is a classic multivariate technique in text statistics to detect associations and oppositions between individuals and observations. These associations and oppositions can be visualised separately or simultaneously on two-dimensional factor maps [70]. Since the CFA works on profiles (the distribution of relative frequencies of a line in a table, row or column in relation to the marginal total) and captures structures, we carried out a statistical analysis of textual data to identify the most relevant terms in the analysed reports. This analysis resulted in a geometric representation that facilitated the interpretation of the numerical information of the lexical table, looking for axes of the maximum dispersion of point-profiles around the centroid, with a minimum loss of information. The chi-square distance metric was used, a weighted Euclidean distance, which allows infrequent words to be weighted more and the most frequent words, less. The chi-square distance neutralises all distortions in the graphical representation.
The words and companies—or activity sectors by groups of companies—are shown in their representation on the factorial plane. We then looked for similarities according to the proximity of the words to the companies on the plane. In this way, we characterised each company based on the terms they used the most, which indicates the differences between companies and their main focuses. We did the same for the sectors of activity, discovering what really concerns these sectors and where they use most of their resources. The overall methodological process is outlined in Figure 1.

4. Results

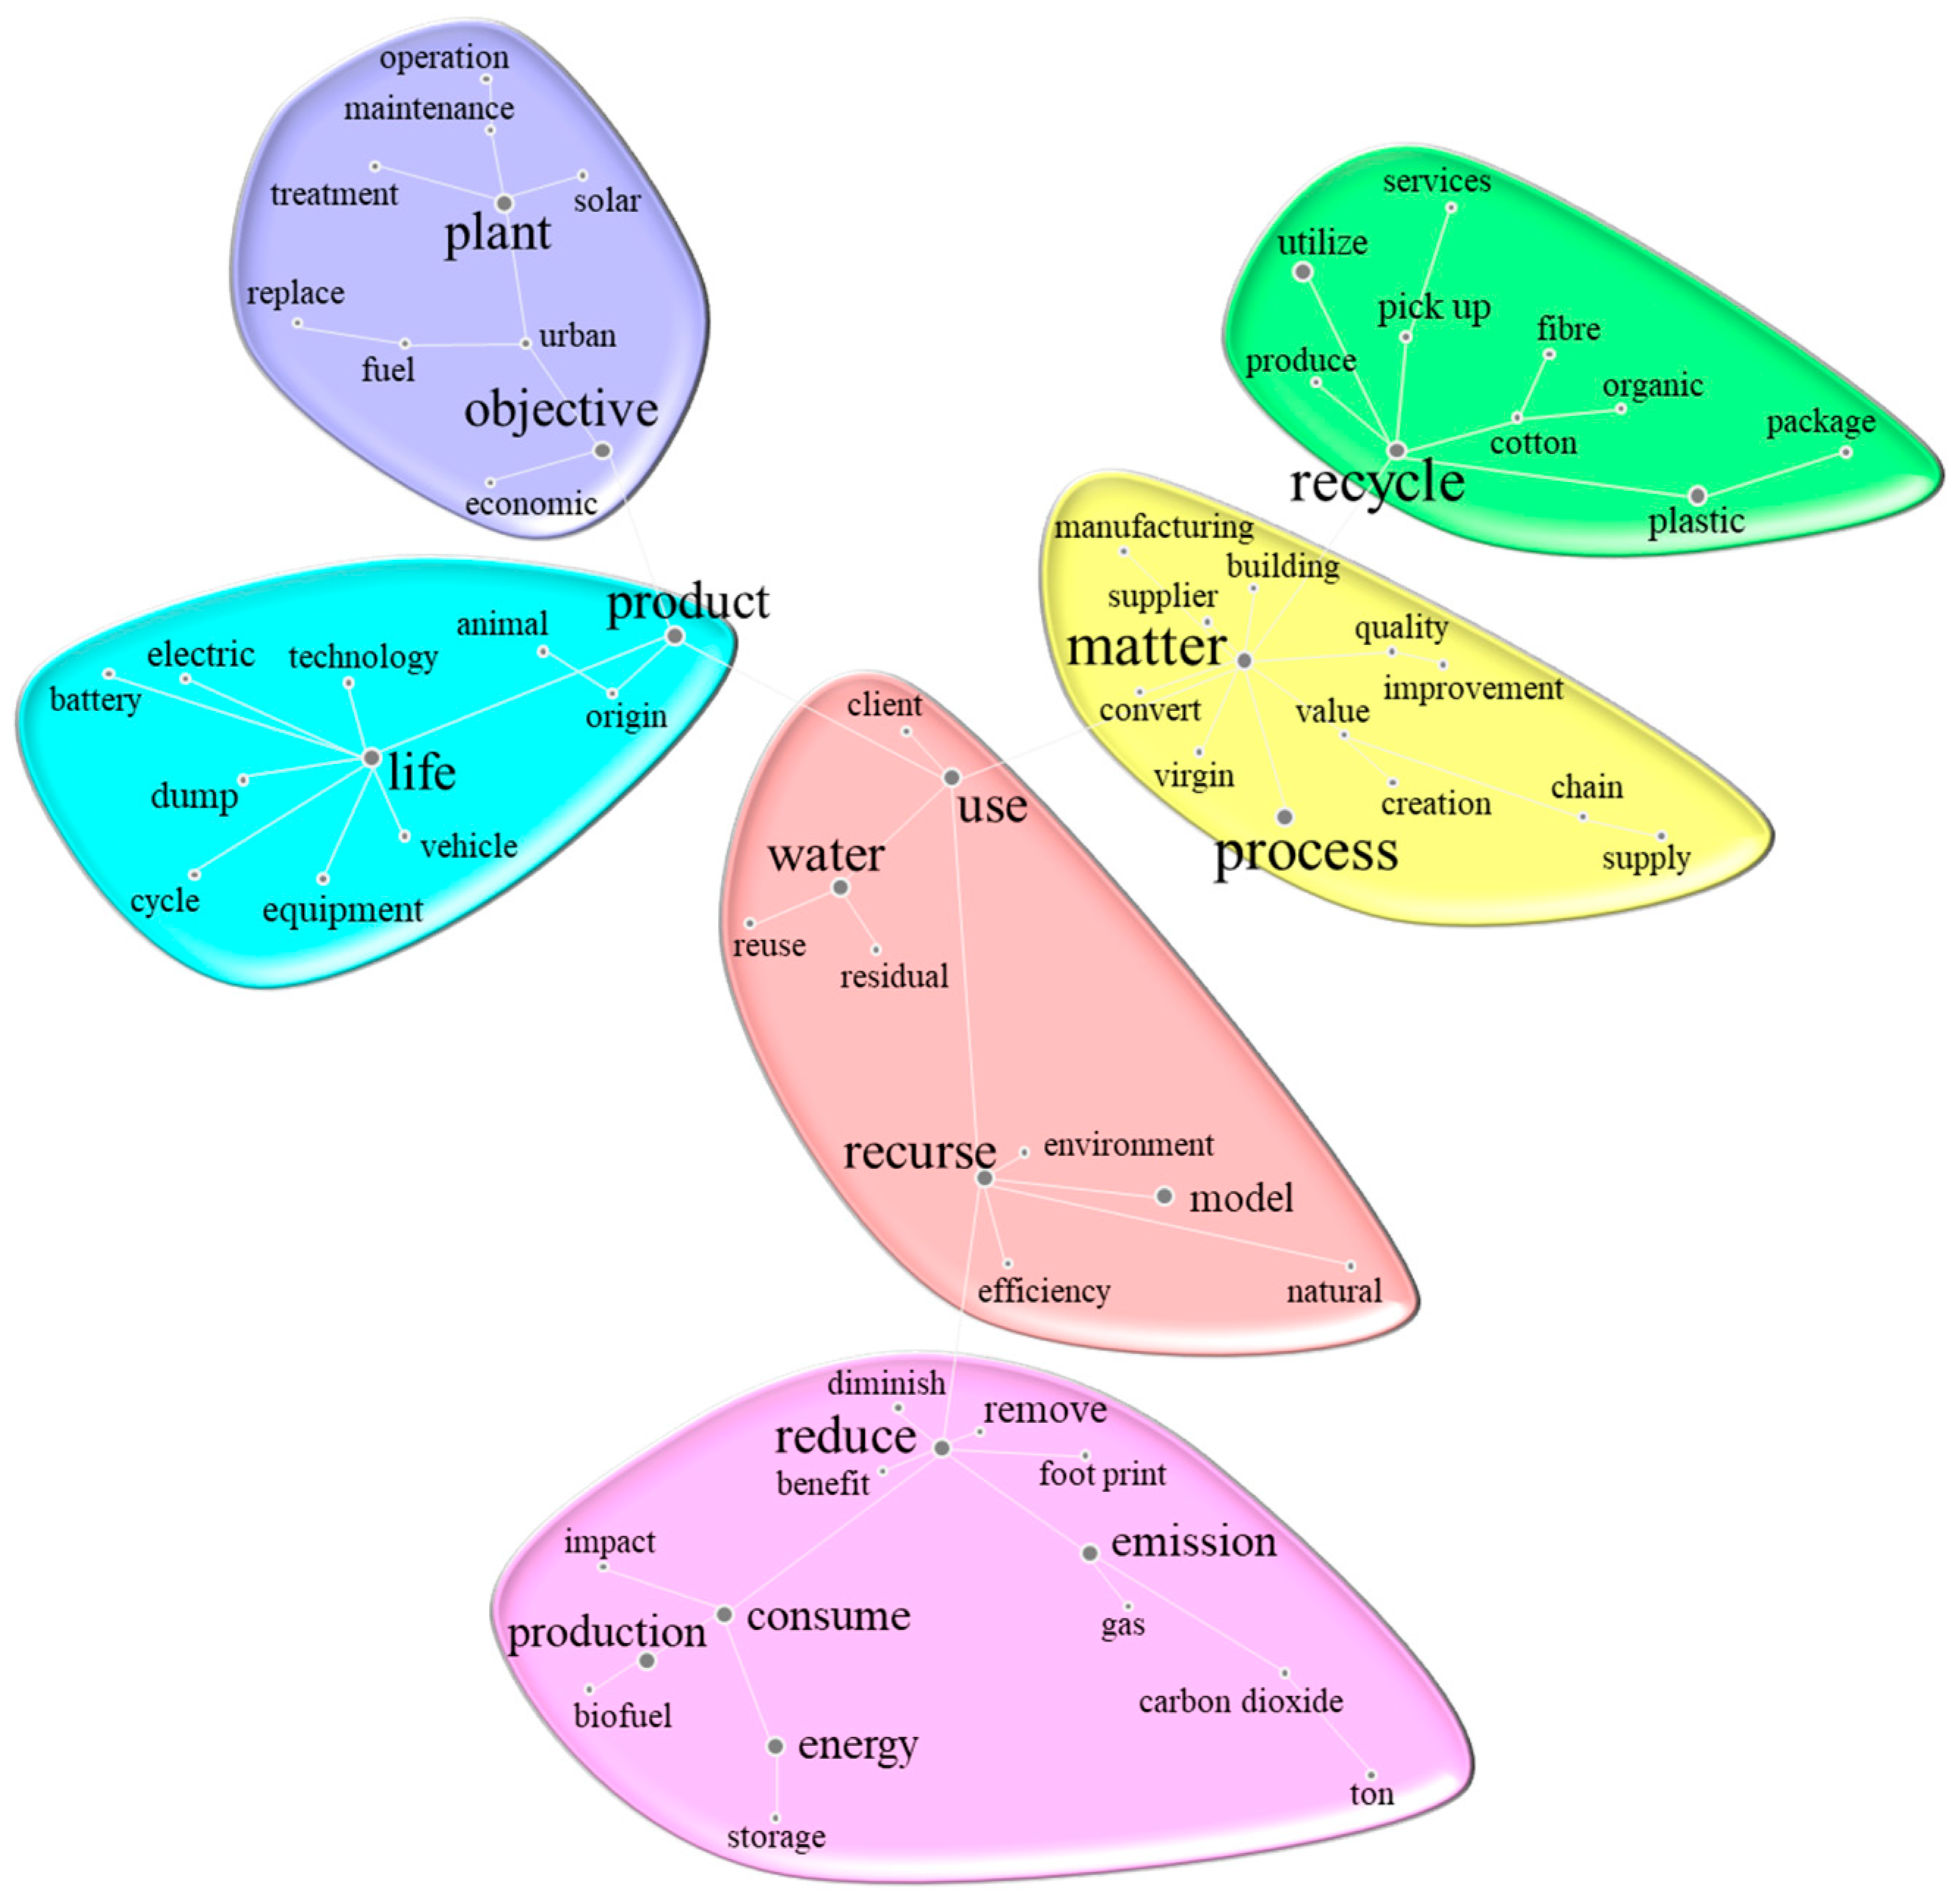
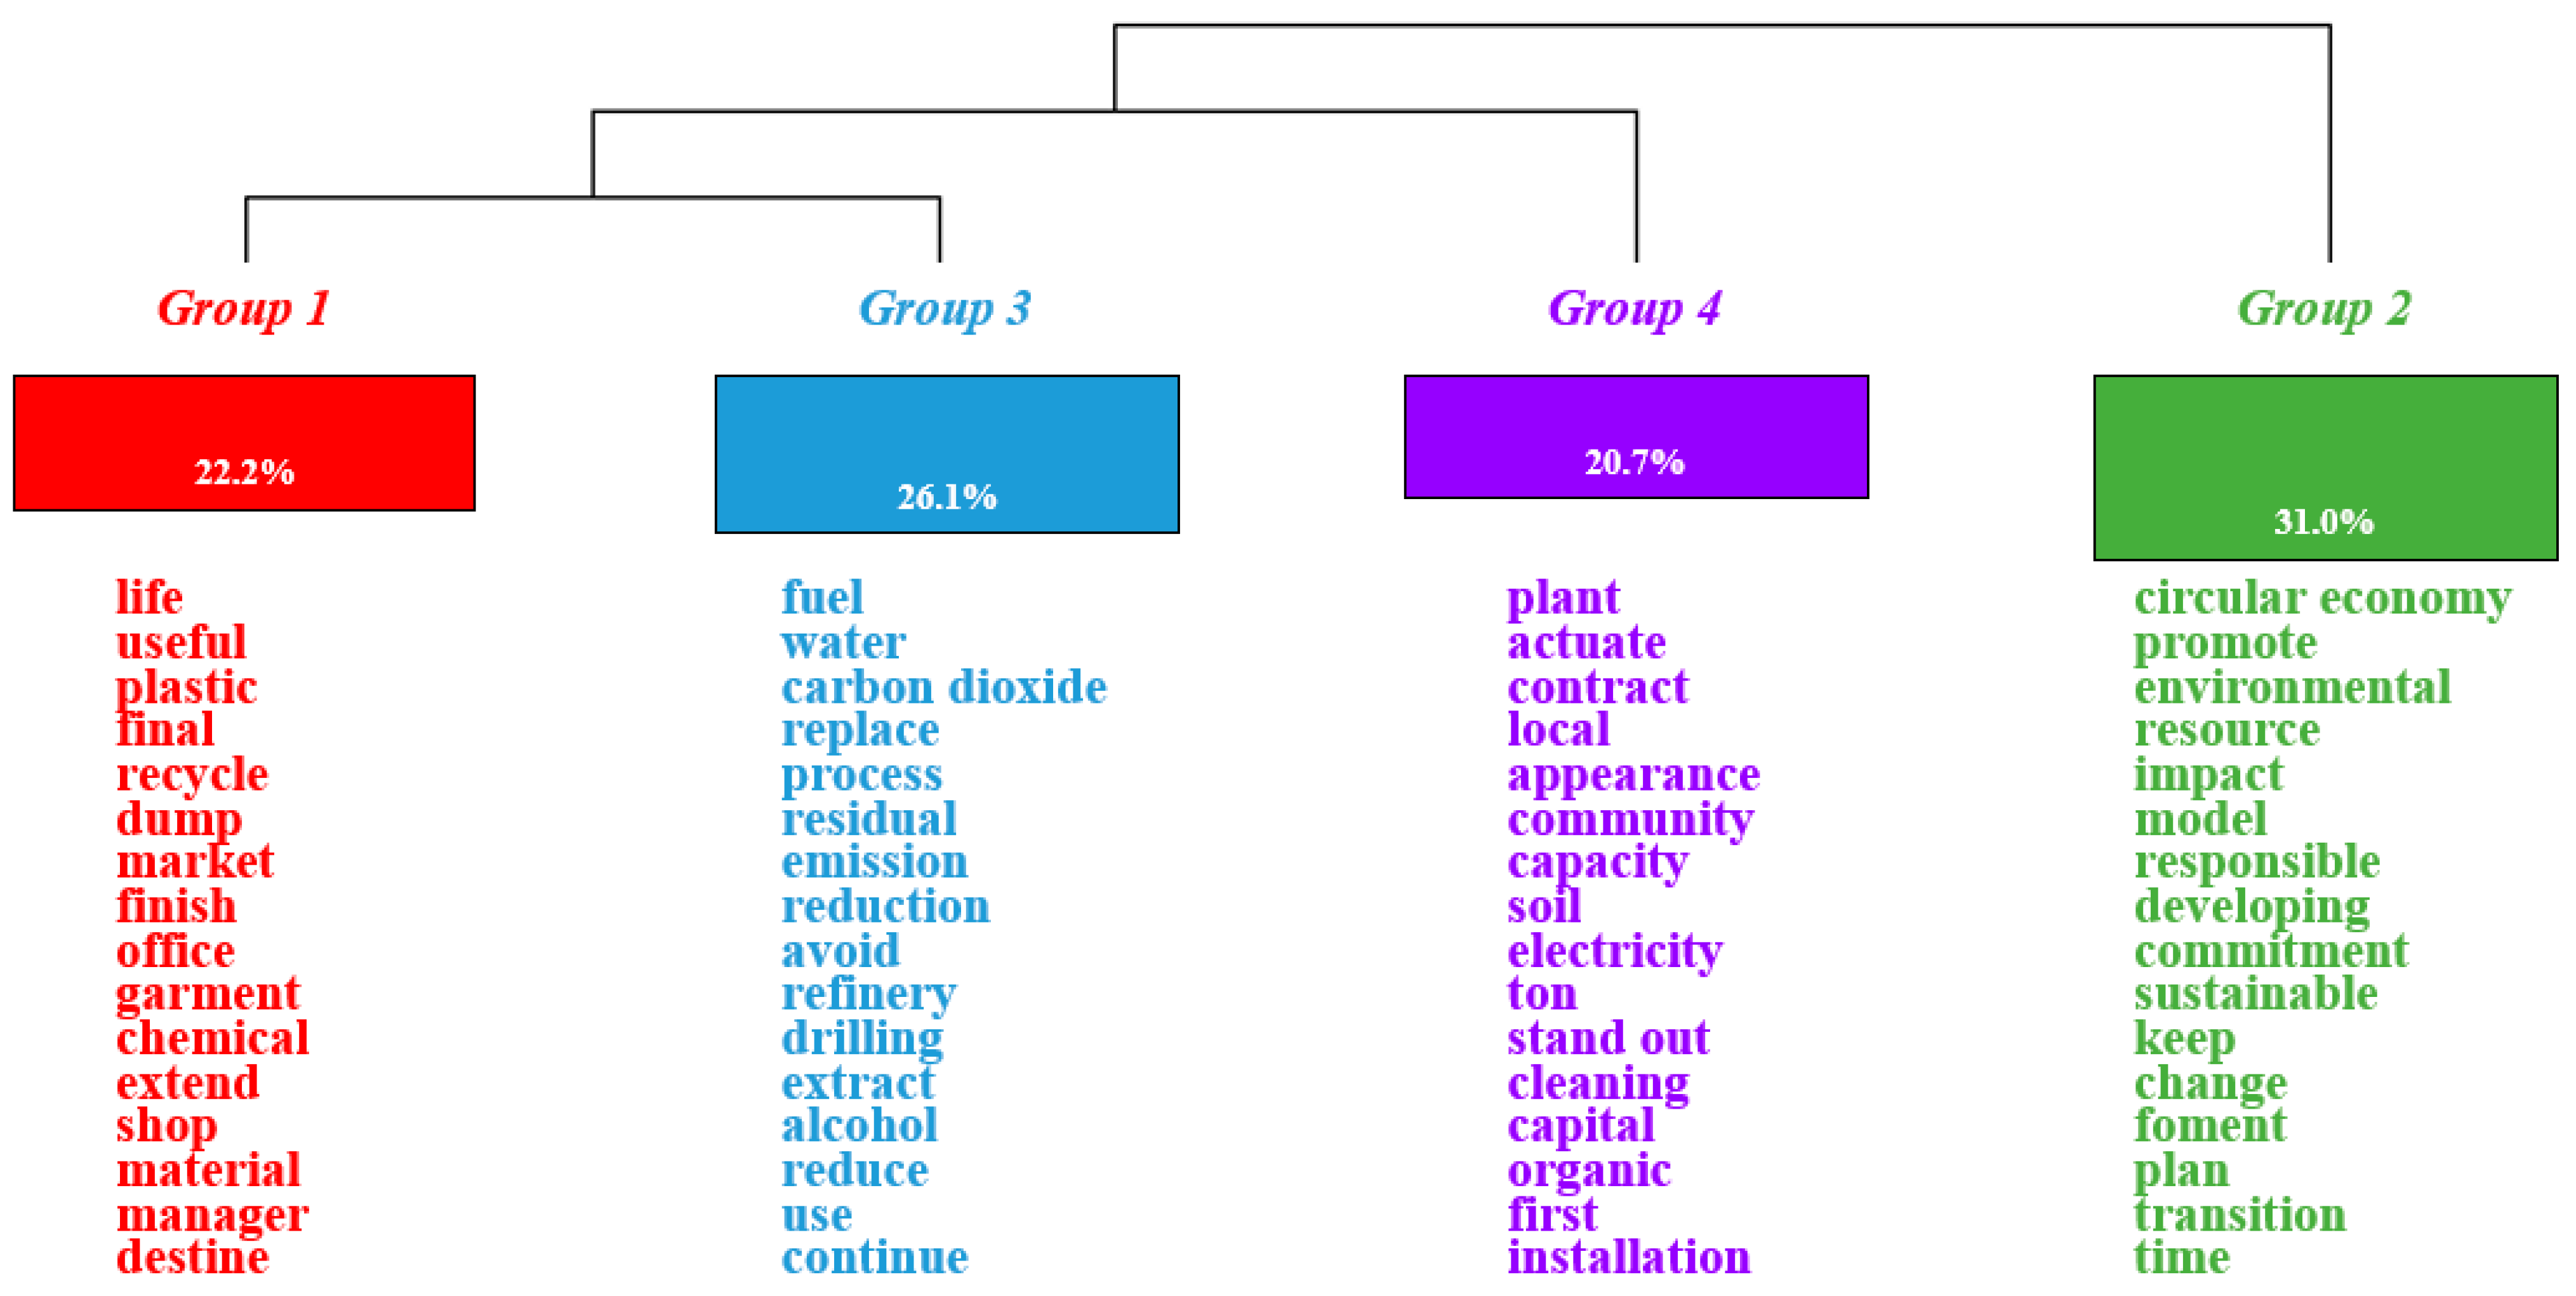
4.1. Descriptive Textual Analysis

The analysis of the texts resulted in a total of 17,510 terms, represented in 2341 different ways. We first represented the most frequent terms used by companies in a similarity graph, similar to classification trees, representing the links of the selected type with the other class types (see Figure 2). Before commenting on the results, note that certain words assumed to be common to the topic have been deleted to obtain only the most relevant information. These deleted words include circular economy, sustainability, project, environmental, management, waste, commitment and responsible. This type of discourse focuses on the term use, as it is linked with the rest of the terms; the use of matter, product, water, in general, the importance of how to treat all resources. The CE represents a new model of society that uses and optimises the stock and flow of materials, energy and waste, and its objective is the efficient use of resources.
The word matter is close to the central term use. It is connected to the terms quality, processes in its creation, manufacture or supply. Following its trail, it connects with the verb recycle. A little further away, we find the word plastic linked to the term package, highlighting the importance of plastic in this movement. On the left, we have the term product and the importance of animal and origin; close to these, we find the discourse on the life cycle of certain equipment, vehicles and the relevance of electricity and new technology. In the upper area, we find the paragraph dedicated to objectives, naturally including the economy. It talks about the importance of replacing urban fuel or the creation of solar plants and their maintenance. Finally, in the lower part, we observe how the CE is a strategy that aims to reduce both the use of virgin materials and the production of waste, closing the loops or economic and ecological flows of resources. Here, we can find terms such as reduce or remove, linked to emissions, gas, carbon dioxide, or the impact or footprint left by tons of waste. On the other hand, we have the importance of reducing production and consumption, especially energy, its storage and the increasingly frequent alternative of biofuel.
Secondly, and in view of what has already been noted, we grouped all the terms into four clearly differentiated clusters, discovering the four topics that companies prioritise in their CE reports (see Figure 3):
  • Red cluster: represents 22.2% of companies’ discourses, focussed on extending the useful life of products, with a notable emphasis on recycling, especially plastic.
  • Blue cluster: companies focus 26.1% of their reports on pollution, with the aim of avoiding or reducing gas emissions (carbon dioxide, fuel, refinery, etc.) and favouring processes for prudent water consumption.
  • Purple cluster: occupying 20.7% of the reports, this cluster focuses on business actions. There are references to electrical installations, community relations and many references to the management (cleaning) of generated waste.
  • Green cluster: companies use 31% of their discourse explaining the importance of the CE for a sustainable future. They focus on the search for a commitment to and the development of sustainable activities, where they prioritise and promote models, make plans to change the environmental impact of their current activities and promote the adequate use of resources over time.

4.2. Analysis of CE Projects

The number of projects promoted, the CE phase to which they refer and a description of the projects and their benefits were identified through content analysis for each of the 17 companies reporting on their commitment to the CE. This information is detailed in Annex 1. These companies have been classified into three levels according to the specificity of their CE initiatives. Level 0 includes those companies that do not present a description of their CE phases and do not determine circular benefits; that is, they make symbolic speeches [23]. Level 1 includes active companies that present a description of their projects but not the benefits. Level 2 includes very active companies that report all the information, a description and the benefits of their CE projects. Twenty-two percent of the companies in the data sample used for this research belong to Level 0, with no description of benefits. Forty-four percent correspond to Level 1, with projects seeking to reduce landfill waste, recycle vehicles, give a second life to obsolete machines, revalue technology equipment, eliminate single-use plastics, etc.
The remaining thirty-four percent are Level 2 companies, where the projects promoted are mainly linked to the production of biogas, second-life electric vehicle batteries, the production of green hydrogen, the creation of new textile fibres from recycled garments and digital solution projects to reduce the consumption of energy, water and CO2. All these projects create benefits by removing tons of urban waste, generating large amounts of biogas, lengthening the life of batteries and avoiding large amounts of CO2 emissions. They result in a 10% reduction in fuel consumption, a 20% reduction in water consumption in agriculture, and a 30% reduction in public lighting, among many other advantages. They also help to decrease 85% of the black spots where there is poor waste separation.

4.3. Business Strategies in CE Reporting

We grouped the information disclosed according to levels 0, 1 and 2, into which we have classified the companies. As expected, there is a greater volume of information at the higher levels (Level 0: 843 words, Level 1: 3146 words and Level 2: 13,521 words), with very concise reports from firms in Level 0, at an average of 211 words; reports that are nearly twice the length from companies in Level 1, at 393 words, and reports in Level 2 that clearly explain the phases and benefits of their CE projects, at 2254 words.
Studying the most commonly used terms (see Table 2) allows us to see that companies in Level 0 use a discourse aimed at actions that should not be carried out, talking about reducing water and energy consumption and emphasising the footprint of gas emissions, carbon dioxide, etc. The terms used by companies in Level 1 show a different discourse, focussing on new objectives, such as the use of electrical material, raw materials versus products and their manufacturing processes and the importance of recycling. Finally, the information included by companies classified in Level 2 involves the most important aspects of the CE. This production and consumption model is mainly concerned with reducing the amount of waste generated, which involves improving raw material use or consumption, reusing and giving a second or third life to certain products, and recycling as the last phase a product goes through: the three Rs on which the CE is based in search of a sustainable economy.
If we delve a little deeper into the information obtained by levels (see Table 3), we find no difference in the use of numbers in the reports, with values around 1.4–1.7%. However, we do find differences in the use of technical words, and the proportion of these words is much higher for firms in Level 2.
We analysed the possible effect of CEOs’ and directors’ training and gender. The CEOs were all male, and we found a notable difference in the training of those in Level 2, where there are high rates of engineers or chemists. The teams in the companies have higher proportions of men at all levels, at around 70%, and higher rates of economists in training, especially in Level 2 companies, with greater differences over other degrees among women.

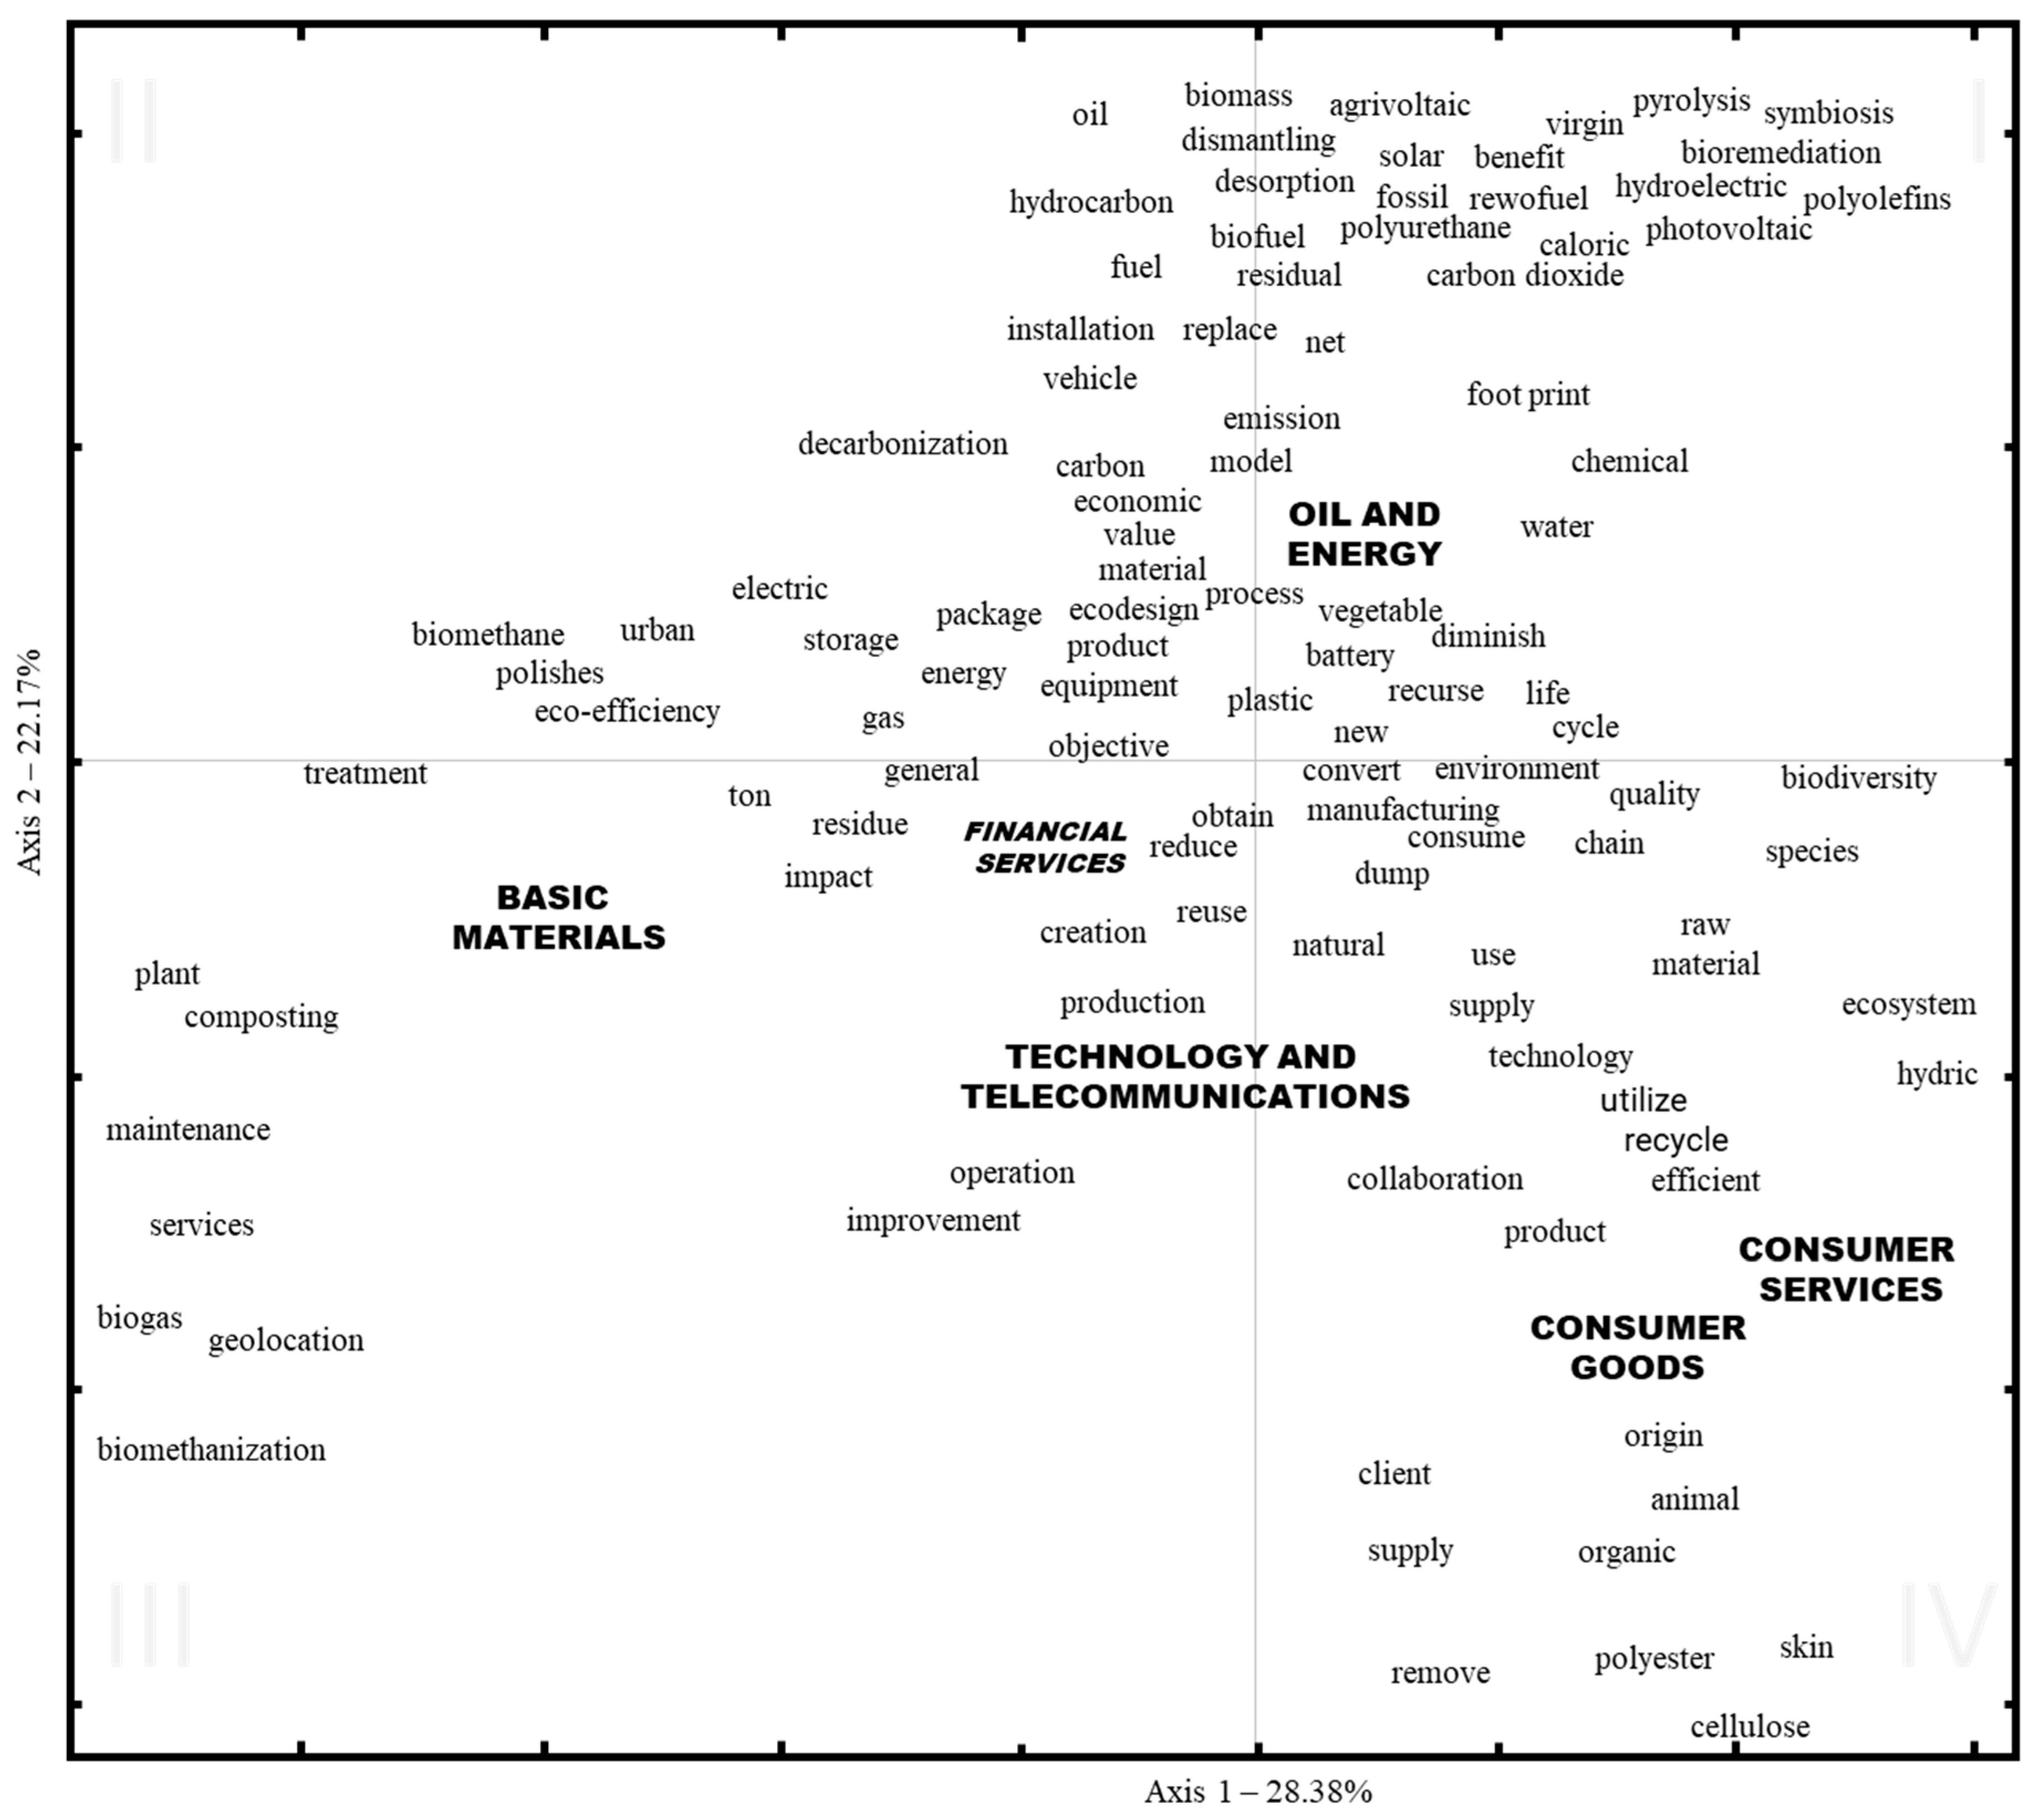
4.4. Industrial Strategies in CE Reporting

Finally, we grouped the information by activity sectors: consumer goods, basic materials, industry and construction, oil and energy, consumer services, financial services, and technology and telecommunications. We first observe a very large difference in the length of the reports, where companies in the oil and energy sector use an average of 1561 terms, followed by consumer goods with 1195, both well distanced from the rest. Companies producing basic materials use 785 words, technology and telecommunications use 545 and consumer services and financial services companies provide the most concise reports on the CE, with around 185 words (see Table 4).
The majority of the percentages of numbers in companies’ information are between 1.5% and 2%, with technology and telecommunications in the lead. Consumer goods (1.1%) and the consumer services (0%) sectors are far below this. The companies with the most concise reports are those that use technical terms to a greater extent, with 7% in consumer services. Close to these values are basic materials (6.4%), consumer goods (5.3%) and oil and energy (4.9%). Financial services and technology and telecommunications use lower percentages, at around 2.7%.
The information about the heads of companies shows us that training in engineering or chemicals corresponds to the CEOs of sectors such as basic materials and oil and energy. In the rest of the sectors, most of the CEOs have training in economics and business. We find a greater number of company team members in the financial services and technology and telecommunications sectors, with around 15–16 members, whereas the rest of the sectors have 10–11 members. These are mostly men (62–77%). The greatest difference is found in basic materials and oil and energy, whose company team members are 23% and 27% women, respectively; 30% in consumer services and around 35–38% in the rest of the sectors, with consumer goods being the sector with the highest percentages of women (38%). The highest percentages of women are trained in economics and business in all the sectors. The same is true for men, with smaller differences, and there are higher proportions of law graduates in consumer services.
Correspondence factorial analysis allowed the terms used most often by the companies to be simultaneously represented with the technical words discussed in the previous table. This study focuses on the representation of Figure 4, where, according to the location of the companies close to the sectors of activity, we can characterise the CE reports they each make and observe the most important differences.
  • Oil and energy: these companies are environmentally sensitive industries [51]. They focus on the negative effects of emissions and pollution, the footprint left by their actions, carbon dioxide, plastics, chemical agents, vehicles, and so on, but they also comment on their new sustainable processes and models based on the substitution of fuels or methods of generating energy, placing emphasis on eco-design, the use of biofuels, the construction of solar plants, hydroelectric plants, electric vehicles, and others, with the idea of planning tomorrow’s energy transitions today.
  • Basic materials: the companies belonging to this sector are environmentally sensitive industries [51] and focus on the impact of the tons of waste produced. Their objective is to treat this waste and reduce and reuse materials before recycling. They speak about the importance of treating plastic containers or the use of alternative energies. An important part of this discourse is directed towards reducing environmental impacts, the treatment and maintenance of gas, switching from biogas to biomethane, the importance of composting and eco-efficiency.
  • Financial services: these companies make concise and vague speeches about the CE.
  • Technology and telecommunications: these companies talk about improvements in production, creation and transport operations and the search for innovative technologies to help improve global waste management, reduce environmental impact and optimise costs.
  • Consumer goods: these companies focus their reports on products. They explain that we live in an age of consumption, anchored to an economic model based on “produce, buy, use, discard” and, in turn, they urge us to move towards a new model where products and raw materials can have a second life without the need to produce new consumer goods. In this way, waste and waste reduction, reuse and recycling result in increased resource efficiency, respecting ecosystems and biodiversity.
  • Consumer services: these companies make similar speeches to those of companies in the consumer goods sector, proclaiming the importance of product life. Although they are true, the reports analysed were very concise, with little specific information.
According to these results, we accept the null hypothesis since the environmentally sensitive industries (oil and energy industry and basic materials) disclose and report more CE information (average words, % numbers, % techniques and firms in level 2) than firms from other sectors do. However, consumer goods is in the top three, in our opinion, because they are closer to demand and can directly increase the value of the brands.
As a last point, and to explain how it is done, we present the words most commonly used by companies in their speeches (around 50), making up 11.6%, together with the most repeated technical words (around 40), although these make up only 1.5% of the sample (see Figure 5).
This representation collects about 50% of the information. The most frequent words (in blue) are less weighted and are located in the centre of the figure. The technical words (in orange), with a higher weighting, are located closer to the edges of the figure.
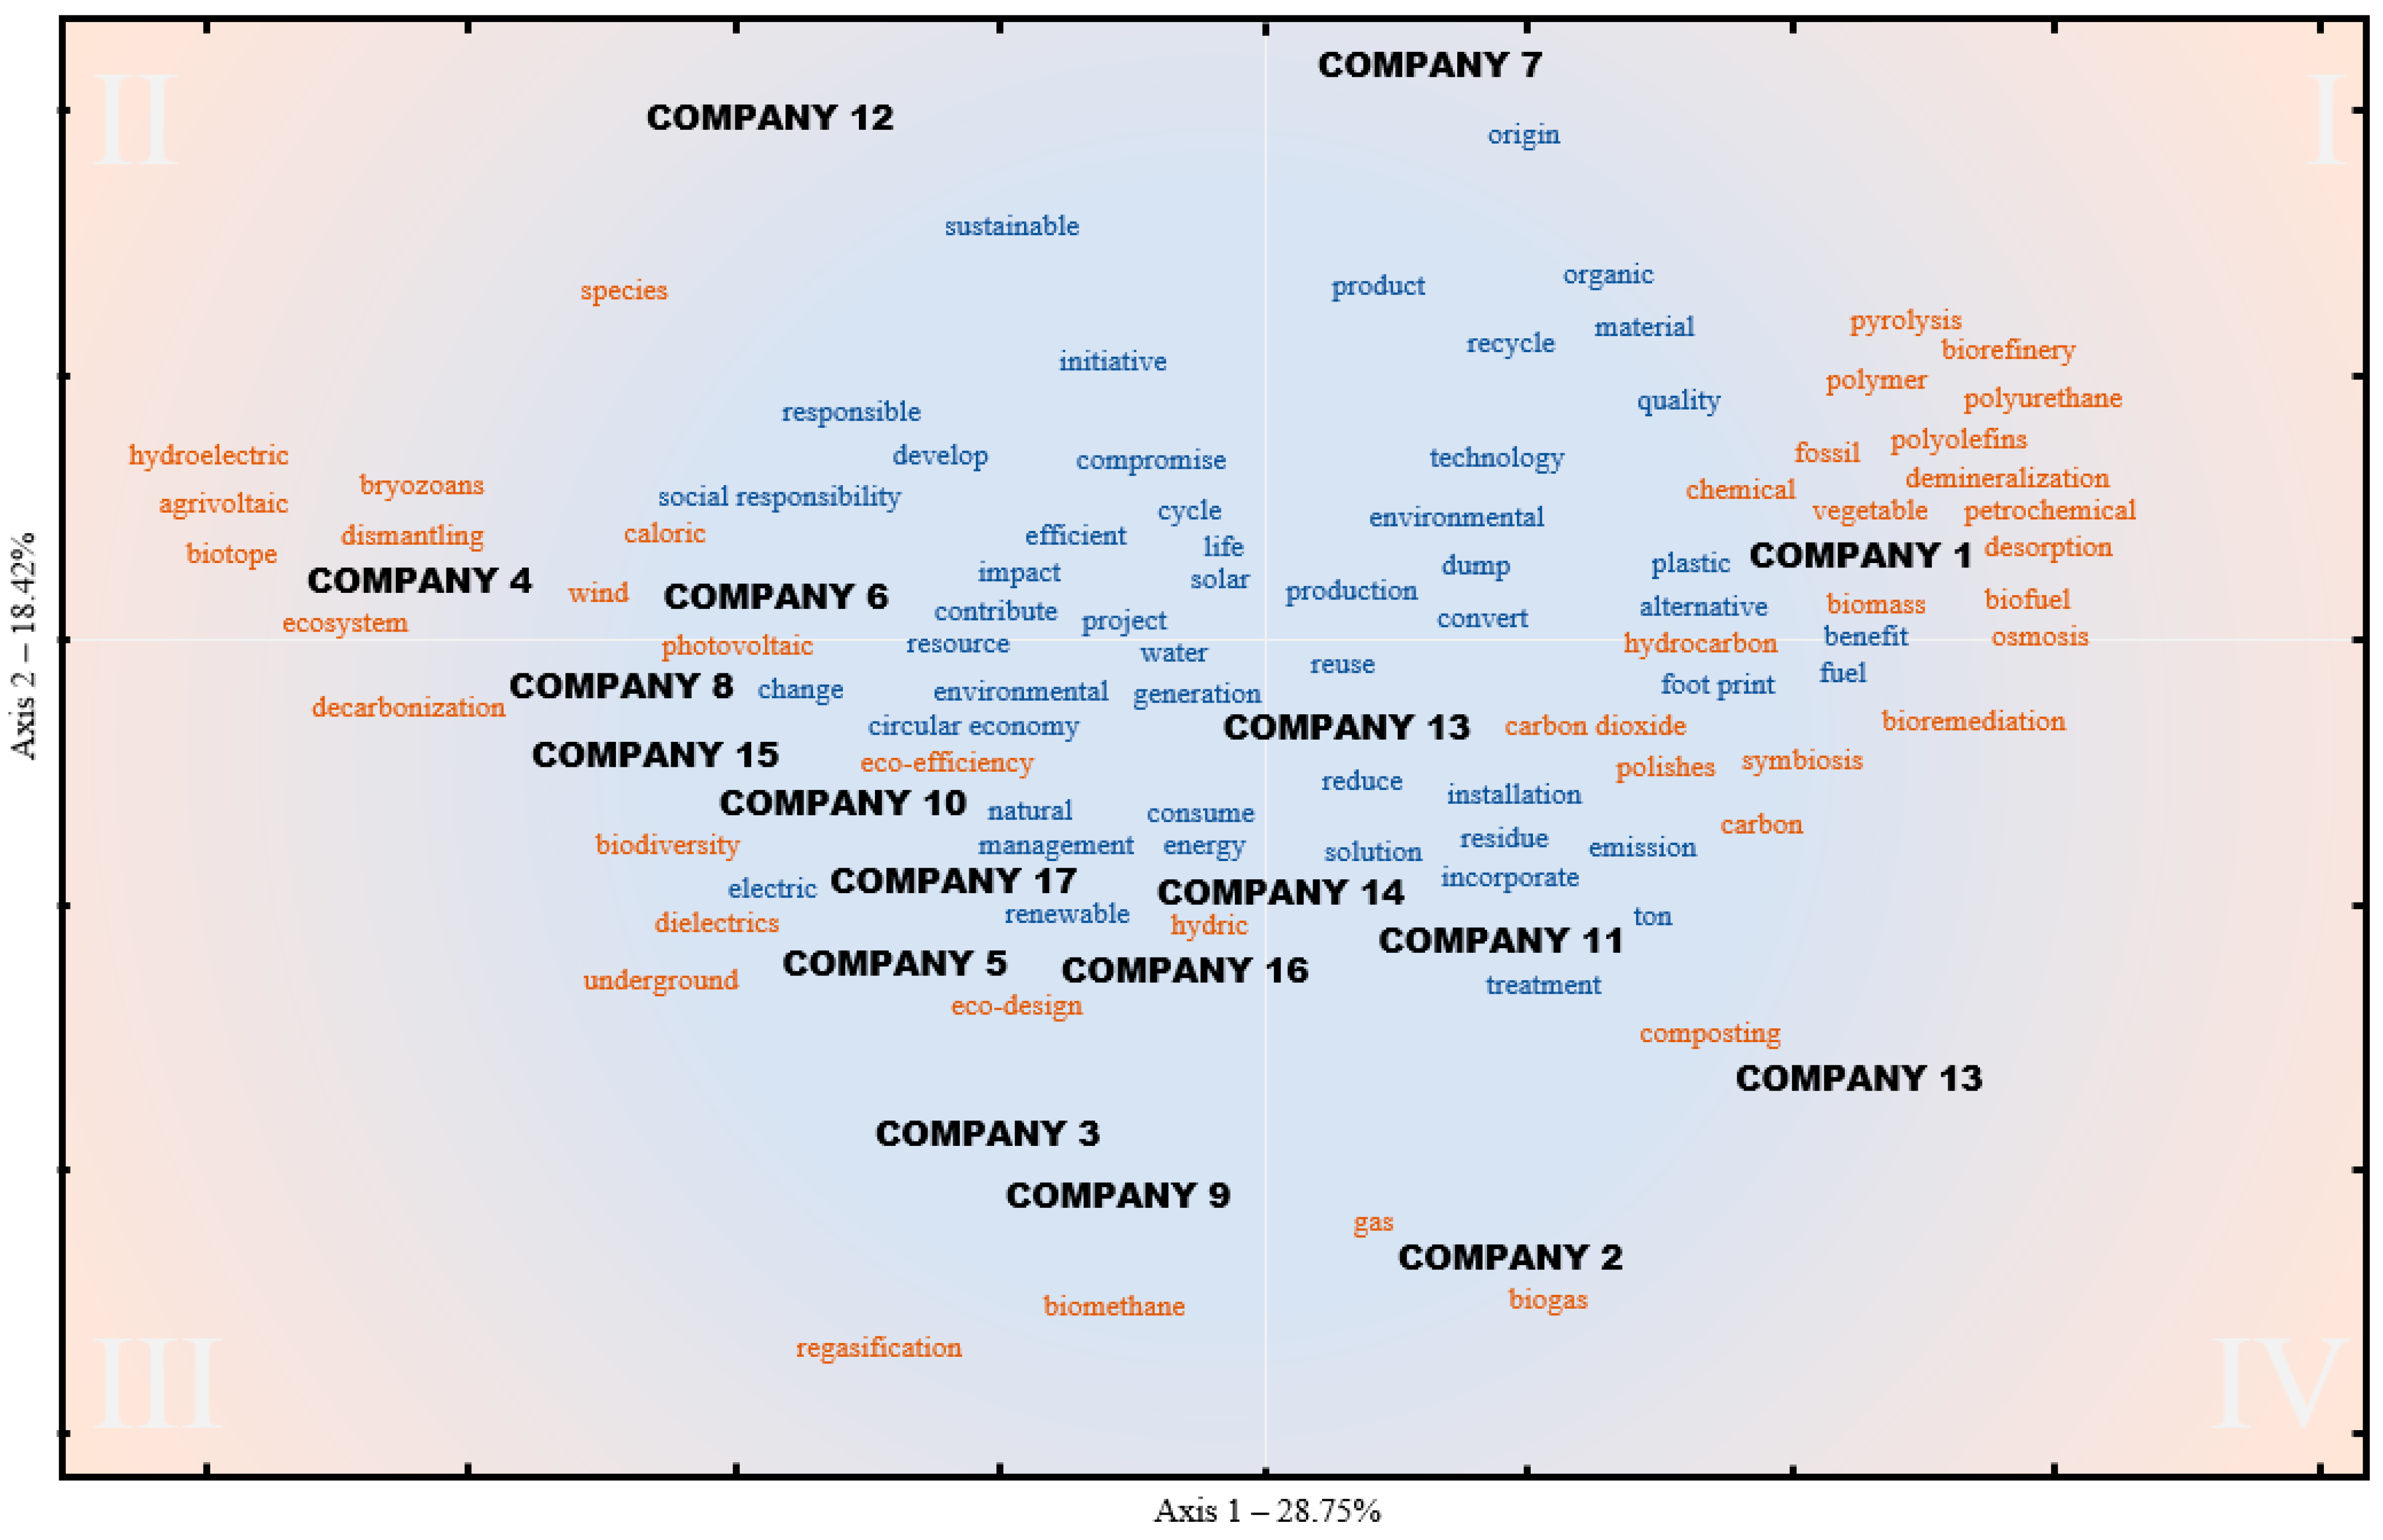
  • On the right side of Figure 5, we can see a discourse on the waste and footprint that different emissions, such as carbon dioxide, leave on the road, compared to alternative fuel for the sake of environmental benefit, such as the use of biomass and biofuel. Company 1 stands out in this regard.
  • Other discourses, such as that of Company 7, are more closely related to the product, establishing its origin, the quality standards in production, responsible use of material, and everything related to recycling.
  • Company 2, Company 3 and Company 9 are the main energy companies, and their speeches are related to biogas or biomethane and regasification.
  • Company 4 and Company 6, two large electricity companies in the Spanish energy market, focus on social responsibility and seek to contribute to change, so they promote photovoltaic solar energy and wind energy, refer to decarbonisation and talk about the use of hydroelectric energy and harming any ecosystem (bryozoans, biotope etc.) as little as possible.
  • The rest of the companies produce a less specific discourse, where they prioritise the term circular economy, the efficient use of resources and water, and speak of eco-efficiency, biodiversity, ecodesign, etc.

5. Discussion and Conclusions

Company initiatives and impacts are important factors in the speed of the transition to the CE [7,18]. In our research, we categorised the information published in the corporate web pages of 17 companies listed on the Spanish stock market according to their content value. These companies are considered leaders in their sectors.
The analysis of the texts show that the companies, especially environmentally sensitive industries, prioritise their commitment to a sustainable future based on the proper use of resources in their speeches. The next most important topic is the reduction or elimination of greenhouse gases and the prudent consumption of water, followed by lengthening the useful life of products with a special emphasis on recycling. Finally, companies mention specific technical and social initiatives that affect the environment. Thirty-four percent of the companies describe their CE projects in detail and report the benefits of these projects (Level 2). Forty-four percent describe only their initiatives, but not the benefits, focusing on new objectives in terms of the use of raw materials and the importance of recycling (Level 1). The remaining twenty-two percent do not do so in either case (Level 0), so they are considered symbolic projects. The latter refer mainly to the regulatory aspects of unacceptable actions and the objectives of reducing water and energy consumption and the carbon footprint.
We found differences in CEO training, with a notable prevalence of engineers or chemists, as well as higher proportions of male and female economists in management teams in the companies that provide more and more detailed information (Level 2).
The result of the industry analysis is that the oil and energy companies provide more information on the negative aspects of their activities but offer information on their solutions, with an emphasis on eco-design, biofuels, alternative energies and energy transition planning. Basic materials companies highlight the importance of waste and its treatment, reduction and reuse, as do consumer goods and consumer services companies, which promote the use of goods and services until the end of their useful life to reduce waste. Finally, technology and telecommunications companies include some information on improvements in waste management and the reduction of environmental impacts with innovative technologies, and financial services hardly include any specific information on CE initiatives or projects.
Our results show that institutional mimicry is feasible in the oil and energy and consumer goods sectors because the listed companies disclose and report more CE information, and they are profitable. However, much remains to be done to move towards the “new” socioeconomic system suggested by [57]. The companies in our study act as opinion leaders due to their size, so the information provided on their corporate websites benefits the transformation process towards the CE because they explain the benefits produced by corporate initiatives using a significant percentage of easily understandable terms [48]. The results are in the line with those in the work of [24], as most companies focus on reducing materials as well as air and water emissions. They used a data sample consisting of 220 large manufacturing companies in the EU that provided CE reporting information in 2016. Their results were that the keywords Reduce and Recycle were more frequent than Reuse (156, 61 and 183 companies mentioned them more than ten times, respectively), while the majority of the companies included almost one KPI about Emission, Energy and Water (200, 163 and 146, respectively). Considering the same keywords, our results in Table 2 show that from 17 listed companies, Reduce (55 times in Levels 0, 1 and 2) and Recycle (54 times) were also more frequent than Reuse (34 times). However, Water was more frequent than Emission or Energy (56, 49 and 40, respectively). Furthermore, our paper makes an important contribution since it incorporates the sector of activity into the work done by [24]. The analysis suggests that institutional pressures contribute positively to the amount and type of information leading companies provide about their CE projects. Hence, industrial strategies can be identified in CE disclosures as they are broader and more detailed in companies that belong to the sectors most sensitive to institutional, especially coercive, pressures, such as the oil and energy industries. Our work makes a significant contribution to the area of corporate information and the CE because these industrial strategies do not signal a direct embodiment of CE principles. However, they are key to accelerating the transition to a CE from our current linear economic model [19].
The findings of this study lead to some useful implications for research, practitioners and policymakers. For research, the empirical results are consistent with the literature since large, listed firms are more active in implementing CE practices to mitigate negative environmental effects [20], especially in the sectors most sensitive to institutional pressures with worse environmental performance [28]. For policymakers, the offer of tax incentives and the NextGenerationEU funds should have a guiding effect on enterprises [71]. Hence, companies’ CE disclosures reveal their eagerness to comply with CE principles, and their willingness to establish guidelines for the industry. For practitioners, the study confirms that corporate managers consider the adoption of CE practices a win–win strategy to achieve environmental and economic goals simultaneously.
There are two limitations, however, which will be future developments of the work. First of all, the sample is limited since the cost of data processing means that we have reviewed a small number of companies. Second, in connection with this, we are looking for a way to digitise the information collection process and expand the sample. This would make it possible to complete the information since sometimes companies use channels other than their corporate websites to update data about their initiatives.

Author Contributions

Conceptualization, I.-M.G.-S. and F.-M.S.-R.; software, V.A.-E.; validation, I.-M.G.-S., F.-M.S.-R., B.G.-V. and V.A.-E.; formal analysis, B.G.-V. and V.A.-E.; investigation, I.-M.G.-S., F.-M.S.-R., B.G.-V. and V.A.-E.; writing—original draft preparation, I.-M.G.-S., F.-M.S.-R. and V.A.-E.; writing—review and editing, F.-M.S.-R.; project administration, I.-M.G.-S.; funding acquisition, I.-M.G.-S. All authors have read and agreed to the published version of the manuscript.

Funding

Ministerio de Ciencia, Innovación y Universidades [Grant/Award No. RTI2018-093423-B-I00]; Consejería de Educación, Junta de Castilla y León [Grant/Award No. SA069G18]; Junta de Castilla y León y Fondo Europeo de Desarrollo Regional [Grant/Award No. CLU-2019-03 Unidad de Excelencia “Gestión Económica para la Sostenibilidad” (GECOS)].

Institutional Review Board Statement

Not applicable.

Informed Consent Statement

Not applicable.

Data Availability Statement

Table A1 includes the original data used in this research.

Conflicts of Interest

The authors declare no conflict of interest.

Appendix A

Table A1. Information about Ce Projects by Company.
COMPANYINDUSTRYNº PROJECTSCE STAGESDESCRIPTIONCIRCULAR BENEFITS
COMPANY 1Oil and energyMore than 230 CE projects in the different business units.Efficiency and process innovation, renewable energy and alternative raw materialsFUEL GENERATION FROM URBAN WASTE.
Through the use of technology, different waste is heated to high temperatures and in the absence of oxygen, produces gas that can be used to replace traditional fuels.
Remove 10,000 tons per year of urban waste from landfills in the first phase.
Remove 100,000 tons of waste per year in the following phases.
COMPANY 2Basic materials, industry and construction13 projectsReuseECOPARK.
It is a plant designed and built by Company 2 for the mechanical-biological treatment of solid urban waste to produce biogas and compost that are later converted into energy and fertiliser, respectively.
10,000 tons per year of garbage from selective collection
35,000 tons per year of dehydrated sludge
Biogas generation: 8,900,000 Nm3/year6 composting tunnels with a capacity of 35,000 tons per year
COMPANY 3Oil and gasUnknownReuseIt is launching a project to take advantage of the cold from liquefied natural gas that allows it to be channelled to refrigeration facilities.Unknown
COMPANY 4Oil and gas17 Projects in SpainReuseELECTRIC VEHICLE BATTERIES TO LIGHT UP A CITY.
This project is based on an energy storage system using electric vehicle batteries at the City X thermal power plant to guarantee the city’s electricity supply in the event of a power outage. In this way, a second life is being given to the batteries of electric vehicles.
It is a more economical and sustainable alternative to stationary power storage batteries
Contributes to improving the quality of supply
Extends the life of already spent batteries in electric vehicles
COMPANY 5Basic materials, industry and constructionUnknownReuseZero Waste to Landfill project: a project in collaboration with Ford that seeks to reduce the waste that is taken to the landfill to zero by looking for a new location for the waste that is generated.Unknown
COMPANY 6Oil and gasNot availableEcodesignGreen Hydrogen Plant
This project will consist of a photovoltaic solar plant, a lithium-ion battery system and a hydrogen production system through electrolysis. The green hydrogen produced at this plant will be used in Brand’s ammonia factory to produce green fertilisers.
It will avoid emissions of 39,000 tons per year of CO2.
It will reduce the plant’s natural gas needs by more than 10%.
COMPANY 7Consumer goodsUnknownReuse and recycleCLOSING THE LOOP.
Installing collection points, mitigating the generation of waste and promoting the reuse of clothing, marketing it for social purposes and recycling for industrial materials. This initiative is carried out through cooperation with nonprofit organisations and research programs in technologies to create new textile fibres from recycled garments.
100% of the company’s waste is recycled or treated with another environmentally sustainable management method.
1201 million security alarms recycled.
120 million hangers recycled.
COMPANY 8Financial servicesUnknownRecycleCompany 8 has a Road Safety and Experimentation Centre.
This is a global technological centre for the design, insurance, use, maintenance, repair and recycling of vehicles and other solutions for the mobility of goods and people.
Unknown
COMPANY 9Oil and gasUnknownUnknownUnknownUnknown
COMPANY 10Oil and gasUnknownReuseObsolete Machines Marketing Project.
This project promotes the relocation of power machines that are no longer used in the value chain as resources or raw materials, giving them a second life and preventing them from ending up in a landfill.
Unknown
COMPANY 11Technology and telecommunicationsUnknownEcodesignECO SMART
It is a project of digital solutions for Company 11 client companies that helps them to see their contribution to the environment when they are installed. Based on a 100% renewable and low-emission network to reduce energy, water and CO2 consumption.
15% reduction in fuel consumption with fleet management services
20% reduction in water consumption in agriculture with Smart Agro
30% reduction in public lighting consumption with Smart Lighting
43% reduction in the average time spent searching for parking with Smart Parking,
26.6% reduction of energy consumption with the Energy Efficiency service and LUCA Energy,
10% reduction in fuel and 85% development of black spots where there is poor waste separation, thanks to Smart Waste
COMPANY 12Basic materials, industry and constructionUnknownUnknownCompany 12’s Positive Impact 360º project is a plan approved by the Board of Directors that summarises a series of actions that add value in five main areas:
ethical, responsible and transparent governance,
eco-efficiency and the fight against climate change,
the CE and sustainable products,
committed teams, culture, diversity and safety,
supply chain and community impact.
Unknown
COMPANY 13 (Resulted of the acquisition of one financial company that purchases another outright)Financial servicesUnknownReuse and recycleIt carries out a selective collection of waste that allows it to be recovered and recycled both in corporate buildings and in the office network. The comprehensive plan for the revaluation of technology equipment also promotes the transfer of said equipment to nonprofit organisations, and in 2020 this plan was extended to office furniture.Unknown
COMPANY 14Technology and telecommunicationsUnknownConsumeZero Plastic InitiativeThis consists of gradually eliminating single-use plastics in all the entity’s offices.Unknown
COMPANY 15Consumer servicesUnknownUnknownUnknownUnknown
COMPANY 16Oil and GasUnknownUnknownUnknownUnknown
COMPANY 17Consumer goodsUnknownUnknownUnknownUnknown

References

  1. Yuan, Z.; Bi, J.; Moriguichi, Y. The Circular Economy: A New Development Strategy in China. J. Ind. Ecol. 2013, 2, 23–44. [Google Scholar] [CrossRef] [Green Version]
  2. Aranda-Usón, A.; Portillo-Tarragona, P.; Scarpellini, S.; Llena-Macarulla, F. The progressive adoption of a circular economy by businesses for cleaner production: An approach from a regional study in Spain. J. Clean. Prod. 2020, 247, 119648. [Google Scholar] [CrossRef]
  3. García-Sánchez, I.-M.; Raimo, N.; Vitolla, F. Are Environmentally Innovative Companies Inclined towards Integrated Environmental Disclosure Policies? Adm. Sci. 2021, 11, 29. [Google Scholar] [CrossRef]
  4. Weisz, H.; Krausmann, F.; Amann, C.; Eisenmenger, N.; Erb, K.-H.; Hubacek, K.; Fischer-Kowalski, M. The physical economy of the European Union: Cross-country comparison and determinants of material consumption. Ecol. Econ. 2006, 58, 676–698. [Google Scholar] [CrossRef]
  5. Preston, F. A global redesign? Shaping the circular economy. Energy Environ. Resour. Gov. 2012, 2, 1–20. [Google Scholar]
  6. West, J.; Schandl, H.; Krausmann, F.; Kovanda, J.; Hak, T. Patterns of change in material use and material efficiency in the successor states of the former Soviet Union. Ecol. Econ. 2014, 105, 211–219. [Google Scholar] [CrossRef] [Green Version]
  7. Ranta, V.; Aarikka-Stenroos, L.; Ritala, P.; Mäkinen, S.J. Exploring institutional drivers and barriers of the circular economy: A cross-regional comparison of China, the US, and Europe. Resour. Conserv. Recycl. 2018, 135, 70–82. [Google Scholar] [CrossRef]
  8. Dong, L.; Dai, M.; Liang, H.; Zhang, N.; Mancheri, N.; Ren, J.; Dou, Y.; Mingming, H. Material flows and resource productivity in China, South Korea and Japan from 1970 to 2008: A transitional perspective. J. Clean. Prod. 2017, 141, 1164–1177. [Google Scholar] [CrossRef]
  9. Awasthi, A.K.; Cucchiella, F.; D’Adamo, I.; Li, J.; Rosa, P.; Terzi, S.; Wei, G.; Zeng, X. Modelling the correlations of e-waste quantity with economic increase. Sci. Total Environ. 2018, 613 (Suppl. C), 46–53. [Google Scholar] [CrossRef]
  10. Robaina, M.; Villar, J.; Pereira, E.T. The determinants for a circular economy in Europe. Environ. Sci. Pollut. Res. 2020, 27, 12566–12578. [Google Scholar] [CrossRef]
  11. Di Maio, F.; Rem, P.C. A robust indicator for promoting circular economy through recycling. J. Environ. Prot. 2015, 6, 1095. [Google Scholar] [CrossRef] [Green Version]
  12. Smol, M.; Kulczycka, J.; Avdiushchenko, A. Circular economy indicators in Relation to eco-innovation in European regions. Clean Technol. Environ. Policy 2017, 19, 669–678. [Google Scholar] [CrossRef] [Green Version]
  13. Elia, V.; Gnoni, M.G.; Tornese, F. Measuring circular economy strategies through index methods: A critical analysis. J. Clean. Prod. 2017, 142, 2741–2751. [Google Scholar] [CrossRef]
  14. Linder, M.; Sarasini, S.; van Loon, P. A Metric for Quantifying Product-Level Circularity. J. Ind. Ecol. 2017, 21, 545–558. [Google Scholar] [CrossRef] [Green Version]
  15. Katz-Gerro, T.; Sintas, J.L. Mapping circular economy activities in the European Union: Patterns of implementation and their correlates in small and medium-sized enterprises. Bus. Strat. Environ. 2018, 28, 485–496. [Google Scholar] [CrossRef]
  16. García-Sánchez, I.-M.; Somohano-Rodríguez, F.-M.; Amor-Esteban, V.; Frías-Aceituno, J.-V. Which region and which sector leads the circular economy? CEBIX, a multivariant index based on business actions. J. Environ. Manag. 2021, 297, 113299. [Google Scholar] [CrossRef]
  17. Moraga, G.; Huysveld, S.; Mathieux, F.; Blengini, G.A.; Alaerts, L.; Van Acker, K.; DeMeester, S.R.; Dewulf, J. Circular economy indicators: What do they measure? Resour. Conserv. Recycl. 2019, 146, 452–461. [Google Scholar] [CrossRef] [PubMed]
  18. Geissdoerfer, M.; Savaget, P.; Bocken, N.M.; Hultink, E.J. The Circular Economy—A new sustainability paradigm? J. Clean. Prod. 2017, 143, 757–768. [Google Scholar] [CrossRef] [Green Version]
  19. Gunarathne, N.; Wijayasundara, M.; Senaratne, S.; Kanchana, P.K.; Cooray, T. Uncovering corporate disclosure for a circular economy: An analysis of sustainability and integrated reporting by Sri Lankan companies. Sustain. Prod. Consum. 2021, 27, 787–801. [Google Scholar] [CrossRef]
  20. Kuo, L.; Chang, B.G. The affecting factors of circular economy information and its impact on corporate economic sustainability-Evidence from China. Sustain. Prod. Consum. 2021, 27, 986–997. [Google Scholar] [CrossRef]
  21. García-Sánchez, I.-M. Corporate social reporting and assurance: The state of the art. Rev. Contab. 2021, 24, 241–269. [Google Scholar] [CrossRef]
  22. North, D. Transaction Costs, Institutions, and Economic Performance; ICS Press: San Francisco, CA, USA, 1992. [Google Scholar]
  23. Walker, K.; Wan, F. The Harm of Symbolic Actions and Green-Washing: Corporate Actions and Communications on Environmental Performance and Their Financial Implications. J. Bus. Ethics 2011, 109, 227–242. [Google Scholar] [CrossRef] [Green Version]
  24. Dagiliene, L.; Frendzel, M.; Sutiene, K.; Wnuk-Pel, T. Wise managers think about circular economy, wiser report and analyze it. Research of environmental reporting practices in EU manufacturing companies. J. Clean. Prod. 2020, 274, 121968. [Google Scholar] [CrossRef]
  25. Ramus, C.A.; Montiel, I. When are corporate environmental policies a form of greenwashing? Bus. Soc. 2005, 44, 377–414. [Google Scholar] [CrossRef]
  26. Connelly, B.L.; Certo, S.T.; Ireland, R.D.; Reutzel, C.R. Signaling Theory: A Review and Assessment. J. Manag. 2010, 37, 39–67. [Google Scholar] [CrossRef]
  27. Delmas, M.A. The diffusion of environmental management standards in Europe and in the United States: An institutional perspective. Policy Sci. 2002, 35, 91–119. [Google Scholar] [CrossRef]
  28. Cho, C.H.; Patten, D.M. The role of environmental disclosures as tools of legitimacy: A research note. Account. Organ. Soc. 2007, 32, 639–647. [Google Scholar] [CrossRef]
  29. García-Sánchez, I.-M.; Amor-Esteban, V.; Galindo-Álvarez, D. Communication Strategies for the 2030 Agenda Commitments: A Multivariate Approach. Sustainability 2020, 12, 10554. [Google Scholar] [CrossRef]
  30. Tate, W.L.; Dooley, K.J.; Ellram, L.M. Transaction cost and institutional drivers of supplier adoption of environmental practices. J. Bus. Logist. 2011, 32, 6–16. [Google Scholar] [CrossRef]
  31. Parra-Domínguez, J.; David, F.; Azevedo, T. Family Firms and Coupling among CSR Disclosures and Performance. Adm. Sci. 2021, 11, 30. [Google Scholar] [CrossRef]
  32. Boulding, K.E. The Economics of the Coming Spaceship Earth; Taylor & Francis: New York, NY, USA, 1966. [Google Scholar]
  33. Ellen MacArthur Foundation. Towards a Circular Economy: Business Rationale for an Accelerated Transition. 2015. Available online: www.ellenmacarthurfoundation.org (accessed on 1 July 2021).
  34. Zeng, H.; Chen, X.; Xiao, X.; Zhou, Z. Institutional pressures, sustainable supply chain management, and circular economy capability: Empirical evidence from Chinese eco-industrial park firms. J. Clean. Prod. 2017, 155, 54–65. [Google Scholar] [CrossRef]
  35. Oliver, C. Strategic responses to institutional processes. Acad. Manag. Rev. 1991, 16, 145–179. [Google Scholar] [CrossRef]
  36. Hart, S.L. A natural-resource-based view of the firm Acad. Manag. Rev. 1995, 20, 986–1014. [Google Scholar]
  37. Scott, W.R. The adolescence of institutional theory. Adm. Sci. Q. 1987, 32, 493–511. [Google Scholar] [CrossRef]
  38. DiMaggio, P.J.; Powell, W.W. The iron cage revisited: Institutional isomorphism and collective rationality in organizational fields. Am. Sociol. Rev. 1983, 48, 147–160. [Google Scholar] [CrossRef] [Green Version]
  39. Molina-Azorín, J.F. Microfoundations of strategic management: Toward micro-macro research in the resource-based theory. BRQ Bus. Res. Q. 2014, 17, 102–114. [Google Scholar] [CrossRef]
  40. Daddi, T.; Todaro, N.M.; De Giacomo, M.R.; Frey, M. A Systematic Review of the Use of Organization and Management Theories in Climate Change Studies. Bus. Strat. Environ. 2018, 27, 456–474. [Google Scholar] [CrossRef]
  41. Aibar-Guzmán, B.; Frías-Aceituno, J.-V. Is It Necessary to Centralize Power in the CEO to Ensure Environmental Innovation? Adm. Sci. 2021, 11, 27. [Google Scholar] [CrossRef]
  42. Aibar-Guzmán, C.; Somohano-Rodríguez, F.M. Do Consumers Value Environmental Innovation in Product? Adm. Sci. 2021, 11, 33. [Google Scholar] [CrossRef]
  43. Pérez-Calderón, E.; Pache-Durán, M.; Milanés-Montero, P. Inversión ecoeficiente: Efectos sobre el desempeño económico y financiero de los grupos empresariales del Dow Jones Sustainability World Index. Rev. Contab. 2021, 24, 220–230. [Google Scholar] [CrossRef]
  44. Widmer, T.; Prior, D. Institutional Isomorphism, Institutional Logics and Organisational Fields: An Institutionalist Perspective on Circular Economy. In Proceedings of the Spring Servitization, Linköping, Sweden, 13–15 May 2019. [Google Scholar]
  45. Escobar, L.F.; Vredenburg, H. Multinational oil companies and the adoption of sustainable development: A resource-based and institutional theory interpretation of adoption heterogeneity. J. Bus. Ethics 2011, 98, 39–65. [Google Scholar] [CrossRef]
  46. Amran, A.; Ooi, S.K.; Wong, C.Y.; Hashim, F. Business strategy for climate change: An ASEAN perspective. Corp. Soc. Responsib. Environ. Manag. 2016, 23, 213–227. [Google Scholar] [CrossRef]
  47. Wahyuni, D.; Ratnatunga, J. Carbon strategies and management practices in an uncertain carbonomic environment—Lessons learned from the coal-face. J. Clean. Prod. 2015, 96, 397–406. [Google Scholar] [CrossRef]
  48. Liu, Q.; Li, H.M.; Zuo, X.L.; Zhang, F.F.; Wang, L. A survey and analysis on public awareness and performance for promoting circular economy in China: A case study from Tianjin. J. Clean. Prod. 2009, 17, 265–270. [Google Scholar] [CrossRef]
  49. Elzinga, R.; Reike, D.; Negro, S.O.; Boon, W.P. Consumer acceptance of circular business models. J. Clean. Prod. 2020, 254, 119988. [Google Scholar] [CrossRef]
  50. Bag, S.; Pretorius, J.H.C.; Gupta, S.; Dwivedi, Y.K. Role of institutional pressures and resources in the adoption of big data analytics powered artificial intelligence, sustainable manufacturing practices and circular economy capabilities. Technol. Forecast. Soc. Chang. 2020, 163, 120420. [Google Scholar] [CrossRef]
  51. Radu, C.; Smaili, N. Corporate performance patterns of Canadian listed firms: Balancing financial and corporate social responsibility outcomes. Bus. Strat. Environ. 2021, 30, 3344–3359. [Google Scholar] [CrossRef]
  52. BS 8001:2017—Framework for Implementing the Principles of the Circular Economy in Organizations. Guide. Available online: www.aenor.com (accessed on 23 September 2021).
  53. Etzion, D.; Pe’Er, A. Mixed signals: A dynamic analysis of warranty provision in the automotive industry, 1960–2008. Strat. Manag. J. 2013, 35, 1605–1625. [Google Scholar] [CrossRef] [Green Version]
  54. Scott, W.R. Institutions and Organizations: Ideas, Interests, and Identities; Sage Publications: Thousand Oaks, CA, USA, 2013. [Google Scholar]
  55. Bocken, N.M.P.; Short, S.W.; Rana, P.; Evans, S. A literature and practice review to develop sustainable business model archetypes. J. Clean. Prod. 2014, 65, 42–56. [Google Scholar] [CrossRef] [Green Version]
  56. Teece, D.J. Technological innovation and the theory of the firm: The role of enterprise-level knowledge, complementarities, and (dynamic) capabilities. In Handbook of the Economics of Innovation, 1st ed.; Elsevier B.V.: Amsterdam, The Netherlands, 2010; Volume 1. [Google Scholar]
  57. Milios, L. Advancing to a circular economy: Three essential ingredients for a comprehensive policy mix. Sustain. Sci. 2018, 13, 861–878. [Google Scholar] [CrossRef] [PubMed] [Green Version]
  58. Patten, D.M. The relation between environmental performance and environmental disclosure: A research note. Account. Organ. Soc. 2002, 27, 763–773. [Google Scholar] [CrossRef]
  59. Benner, M.J.; Tushman, M.L. Exploitation, exploration, and process management: The productivity dilemma revisited. Acad. Manag. Rev. 2003, 28, 238–256. [Google Scholar] [CrossRef] [Green Version]
  60. Jalonen, H. The uncertainty of innovation: A systematic review of the literature. J. Manag. Res. 2011, 4, 1. [Google Scholar] [CrossRef] [Green Version]
  61. Berthiaume, A. Use of the National Pollutant Release Inventory in environmental research: A scoping review. Environ. Rev. 2021, 29, 329–339. [Google Scholar] [CrossRef]
  62. Reverte, C. Corporate social responsibility disclosure and market valuation: Evidence from Spanish listed firms. Rev. Manag. Sci. 2014, 10, 411–435. [Google Scholar] [CrossRef]
  63. Li, Y.; Richardson, G.D.; Thornton, D.B. Corporate disclosure of environmental liability information: Theory and evidence. Contemp. Acc. Res. 1997, 14, 435–474. [Google Scholar] [CrossRef]
  64. Karahanna, E.; Straub, D.W.; Chervany, N.L. Information Technology Adoption Across Time: A Cross-Sectional Comparison of Pre-Adoption and Post-Adoption Beliefs. MIS Q. 1999, 23, 183. [Google Scholar] [CrossRef]
  65. Rogers, E.M. Evolution: Diffusion of Innovations. In International Encyclopedia of the Social & Behavioral Sciences, 2nd ed.; Wright, J.D., Ed.; Elsevier: Oxford, UK, 2015; pp. 378–381. [Google Scholar]
  66. Luhmann, N. Social Systems; Stanford University Press: Stanford, CA, USA, 1995. [Google Scholar]
  67. Melón-Izco, Á.; Ruiz-Cabestre, F.J.; Ruiz-Olalla, C. Readabilty in management reports: Extension and good governance practices. Rev. Contab. 2021, 24, 19–30. [Google Scholar] [CrossRef]
  68. Hadro, D.; Klimczak, K.M.; Pauka, M. Management’s choice of tone in letters to shareholders: Sincerity, bias and incentives. Rev. Contab. 2021, 24, 202–219. [Google Scholar] [CrossRef]
  69. Reinert, M. Système Alceste: Une méthodologie d’analyse des données textuelles. Actes Jornades Int. D’analisi Dades Textuals 1991, 44–161. [Google Scholar]
  70. Benzécri, J.P. L’analyse des Données; Dunod: Paris, France, 1973; Volume 2, p. 1. [Google Scholar]
  71. Zarbà, C.; Chinnici, G.; La Via, G.; Bracco, S.; Pecorino, B.; D’Amico, M. Regulatory Elements on the Circular Economy: Driving into the Agri-Food System. Sustainability 2021, 13, 8350. [Google Scholar] [CrossRef]
Figure 1. Methodological process outline.
Sustainability 14 01149 g001
Figure 2. Representation of the most frequently used terms.
Sustainability 14 01149 g002
Figure 3. Grouping of clearly differentiated clustered terms.
Sustainability 14 01149 g003
Figure 4. Representation of frequent and technical words according to sector activity.
Sustainability 14 01149 g004
Figure 5. Factorial analysis of correspondences, frequent words and technical words by companies (Note: Company 13 resulted from the acquisition of one financial company, purchased outright from another).
Sustainability 14 01149 g005
Table 1. Sample description.
IndustryFreq.%
Consumer goods211.8%
Basic materials, industry and construction317.6%
Oil and energy741.2%
Consumer services15.8%
Financial services211.8%
Technology and telecommunications211.8%
Total17100%
Table 2. Word frequency distribution by levels.
Level 0Freq. Level 1Freq. Level 2Freq.
1Water91Residual511Residual147
2Consume92Objective222Raw material108
3Residual83Recurse173Life48
4Emission84Use154New48
5Reduce65Material155Use43
6Energy66Electronic136Water43
7Carbon dioxide67Equipment137Reduce42
8Efficiency58Recycle128Product42
9Recurse49Consume119Recycle41
10Model410Model1110Process40
11Impact411Generation1111Recurse37
12Gas412Net1112Material37
13Environment413Product1113Objective36
14Use314Raw Material1014Plant36
15Generate315Process915Plastic33
16Natural316Life916Energy31
17Foot Print317Natural817Reuse28
18Biodiversity318Building818Pick up25
19Material219Value819Production24
20Plant220Reduce720Ton24
21Building221Impact721Consume23
22Production222Pick Up722Model22
23Ton223Dump723Building22
24Ecoeffiency224New624Emission22
25Hydric225Plastic625Service22
26Raw material226Economic626Produce22
27Objective127Ecodesign627Urban22
28Recycle128Gas528Technology22
29Process129Reuse529Fuel22
30Production130Chain530Dump21
31Urban131Use531Animal21
32Technology132Maintenance532Obtain20
33Reuse133Water433Quality20
34Origen134Efficiency434Cotton19
35Treatment135Services435Electric17
36Organic136Energy336Carbon dioxide17
37Solar137Treatment337Origin17
38Client138Oil338Manufacturing17
39Chain139Operation339Generate16
40Creation140Convert340Equipment16
41Net141Dangerous341Value16
42Collaboration142Plant242Use16
43Remove143Production243Treatment16
44Residual144Produce244Organic16
45Storage145Origin245Vehicle16
46Supply146Client246Cycle15
47Species147Creation247Benefit15
48Symbiosis148Collaboration248Solar15
49Photovoltaic149Remove249Package15
50Biomethane150Residual250Efficiency14
51Ecosystem151Supply251Economic14
52Life052Biomethane252Supplier14
53New053Obtain253Biofuel14
54Product054Cycle254Foot print13
55Plastic055Diminish255Fibre13
56Use056Improvement256Battery13
57Pick up057Decarbonisation257Garments13
58Electric058Underground258Oil12
59Equipment059Regasification259Client12
60Dump060Emissions160Operation12
Table 3. Proportion of numbers and technical words by levels, CEO and work team training.
LevelLevel 0Level 1Level 2
Average words2113932254
% Numbers1.7%1.4%1.7%
% Techniques4.9%3.5%6.2%
CEO training
% Engineers or chemists (CEO)50.0%37.5%50.0%
% Lawyers (CEO)0.0%25.0%16.7%
% Economists and managers (CEO)50.0%33.3%33.3%
Board member training
% Male72.4%68.0%70.1%
Total with training information (M)798
% Engineers or chemists (M)35.9%19.4%21.9%
% Lawyers (M)25.1%28.4%30.9%
% Economists and managers (M)39.0%52.2%47.1%
% Female27.6%32.0%29.9%
Total with training information (F)343
% Engineers or chemists (F)25.0%23.8%15.0%
% Lawyers (F)6.3%23.8%18.6%
% Economists and managers (F)68.8%52.5%66.4%
Total Board Members101412
Table 4. Proportion of numbers and technical words by sectors, CEO and work team training.
SectorsConsumer GoodsBasic MaterialsOil and EnergyConsumer ServicesFinancial ServicesTechnology and Telecom
Average words11957851561185187545
% Numbers1.1%1.5%1.8%0.0%1.7%2.1%
% Techniques5.3%6.4%4.9%7.0%2.7%2.8%
CEO training
% Engineers or chemists (CEO)0.0%66.7%85.7%0.0%0.0%0.0%
% Lawyers (CEO)50.0%0.0%0.0%0.0%33.3%50.0%
% Economists and managers (CEO)50.0%33.3%14.3%100.0%66.7%50.0%
Board member training
% Male61.8%76.8%72.7%70.0%63.9%65.1%
Total with training information (M)78771010
% Engineers or chemists (M)12.5%20.4%33.5%28.6%16.7%15.6%
% Lawyers (M)32.5%16.2%29.2%42.9%36.7%21.1%
% Economists and managers (M)55.0%63.4%37.3%28.6%46.7%63.3%
% Female38.2%23.2%27.3%30.0%36.1%34.9%
Total with training information (F)433345
% Engineers or chemists (F)25.0%16.7%20.7%0.0%25.0%30.0%
% Lawyers (F)29.2%0.0%18.3%0.0%33.3%20.0%
% Economists and managers (F)45.8%83.3%61.0%100.0%41.7%50.0%
Board Members111111101615
Average Level1.01.31.10.01.01.5
Level 050.0%0.0%28.6%100.0%0.0%0.0%
Level 10.0%66.7%28.6%0.0%100.0%50.0%
Level 250.0%33.3%42.9%0.0%0.0%50.0%
Publisher’s Note: MDPI stays neutral with regard to jurisdictional claims in published maps and institutional affiliations.

